 Open Access Article
Biodecolorization and biotransformation of methylene blue using mixed cultures of brown-rot fungus Daedalea dickinsii and filamentous fungus Aspergillus oryzae: identification of metabolites and degradation pathway
Adi Setyo Purnomo *a,
Umirul Solichah Fauzanya,
Hamdan Dwi Rizqia,
Taufiq Rinda Alkas
 b and
Ichiro Kameic
aDepartment of Chemistry, Institut Teknologi Sepuluh Nopember (ITS), Kampus ITS Sukolilo, Surabaya, 60111, Indonesia. E-mail: adi_setyo@chem.its.ac.id; adi.spurnomo@yahoo.com; Fax: +62-31-5928314; Tel: +62-31-5943353
bDepartment of Environment Management, Politeknik Pertanian Negeri Samarinda, Samarinda, 75131, Indonesia
cDepartment of Forest and Environmental Science, Faculty of Agriculture, University of Miyazaki, 1-1, Gakuen-kibanadai-nishi, Miyazaki 889-2192, Japan
First published on 8th February 2024
Abstract
This study aimed to examine biodecolorization and biotransformation of methylene blue (MB) using mixed cultures of brown-rot fungus Daedalea dickinsii and filamentous fungus Aspergillus oryzae. In addition, the ratio of D. dickinsii and A. oryzae in mixed cultures was 1![[thin space (1/6-em)]](https://www.rsc.org/images/entities/char_2009.gif) :
:![[thin space (1/6-em)]](https://www.rsc.org/images/entities/char_2009.gif) 1, and the sample was incubated at 30 °C for 7 days in liquid medium potato dextrose broth (PDB). The results showed that the sample had the ability to remove and transform 95.24 mg L−1 MB. In this study, mixed cultures had the highest removal percentage of 64.77%, while values of 5.94% and 36.82% were obtained for single cultures of D. dickinsii and A. oryzae, respectively. LC-TOF/MS analysis results showed that peak intensity of MB compound (m/z 284) in each treatment chromatogram decreased compared to the control. The metabolites of decolorization by D. dickinsii were C15H16N3S, C16H19N3SO, and C16H21N3SO, while C31H48N3S+ was obtained using A. oryzae. For mixed cultures, the metabolites obtained included C26H37N2O3S, C9H8N2O3S, C28H38NO2S, and C27H27N5S2. Based on the results, mixed cultures of D. dickinsii and A. oryzae had a high MB decolorization and could be used in the textile industry.
1, and the sample was incubated at 30 °C for 7 days in liquid medium potato dextrose broth (PDB). The results showed that the sample had the ability to remove and transform 95.24 mg L−1 MB. In this study, mixed cultures had the highest removal percentage of 64.77%, while values of 5.94% and 36.82% were obtained for single cultures of D. dickinsii and A. oryzae, respectively. LC-TOF/MS analysis results showed that peak intensity of MB compound (m/z 284) in each treatment chromatogram decreased compared to the control. The metabolites of decolorization by D. dickinsii were C15H16N3S, C16H19N3SO, and C16H21N3SO, while C31H48N3S+ was obtained using A. oryzae. For mixed cultures, the metabolites obtained included C26H37N2O3S, C9H8N2O3S, C28H38NO2S, and C27H27N5S2. Based on the results, mixed cultures of D. dickinsii and A. oryzae had a high MB decolorization and could be used in the textile industry.
Introduction
At the moment, Indonesia has the fourth-largest population in the world. The textile industry is one of the industries that is growing rapidly. Currently, over 700![[thin space (1/6-em)]](https://www.rsc.org/images/entities/char_2009.gif) 000 tonnes of commercial dyes are generated annually, of which 14–21% are lost as wastewater.1 In fact, according to other estimates, almost 90% of the textile colours used in the dyeing process are dumped straight into sewage samples of active sludge.2 Numerous investigations demonstrated that synthetic dyes constituted a significant risk to the environment, mainly because they are carcinogenic and mutagenic to living things.3
000 tonnes of commercial dyes are generated annually, of which 14–21% are lost as wastewater.1 In fact, according to other estimates, almost 90% of the textile colours used in the dyeing process are dumped straight into sewage samples of active sludge.2 Numerous investigations demonstrated that synthetic dyes constituted a significant risk to the environment, mainly because they are carcinogenic and mutagenic to living things.3
Methylene blue (MB) is a common synthetic dye that has been extensively used in the textile industry due to its accessibility and cost-effectiveness.4 Despite the popularity, a significant drawback arises from the substantial waste generated during the dyeing process. Several studies have been carried out to address MB pollution through various methods, including sonocatalysis,5 photocatalysis,6 chemical oxidation with ozone,7 co-precipitation,8 and adsorption,9 but these methods have significant drawbacks.
Despite being quicker and appearing to be a simpler way to handle pollution, chemical and physical treatments are typically destructive, intrusive, costly to run, energy-intensive, and produce a poisonous end product.10–12 The biodegradation process (bioremediation) using microbes is a promising technique for this problem because it can decolorize dye and convert it into non-toxic chemical forms.13 In addition, Patel et al. claim that the most affordable and globally dependable technique for bioremediating liquid dyes from wastewater is microbial-based bioremediation. Numerous microorganisms are simple to handle and no preparation required.14 However, Abbasi et al. recommended that bacteria are not appropriate for breaking down these dyes, since they produce harmful substances and cause natural contamination. Involving fungi in decolorization is newly proposed for dye degradation without creating poisonous substances.15 On the other hand, this statement still needs further exploration of the toxicity of metabolite products from microbial dye-degradation.
Brown-rot fungi in particular stand out as a viable option for decolorizing some contaminants, including dyes and insecticides, which require the Fenton reaction.16–20 One brown-rot fungus that has demonstrated potential for MB degradation is Daedalea dickinsii. Prior research indicated that D. dickinsii (final concentration 100 mg L−1) may achieve a modest 53.55% decolorization percentage after a 14-day incubation period.17 However, study for finding the effective techniques are still necessary to improve the low removal percentages and lengthy decolorization process.
A useful technique for enhancing biodegradation is the application of mixed microorganism cultures. Patel et al. revealed that the microbial consortium will be more successful in removing dye since it consists of a variety of constituent microorganisms that produce a range of enzymes and metabolites.14 Numerous publications concerning dye cleanup using microbial consortia have been published. According to Correa et al., using fungal consortia can result in greater substrate colonization, enhanced synthesis of pertinent enzymes, and improved resistance to contamination by other organisms, making their use potentially more efficient.21 For instance, Kuhar et al. reported Ganoderma lucidum – Trametes versicolor consortium exhibited a higher rate of malachite green degradation when compared to other conditions.22 While El-Rahim et al. also revealed that a fungal consortium was able to achieve up to 100% degradation efficiency for a number of different types of azo dyes.23 Akar et al. shown that this approach outperformed the usage of a single culture in terms of ability and performance.24
Therefore, the purpose of this study is to decolorize MB utilizing single culture and mixed cultures of the filamentous fungus Aspergillus oryzae and D. dickinsii. The selection of A. oryzae was based on its capacity to enhance the percentage of degradation by generating elevated amounts of active MnP and LiP enzymes, which resulted in a remarkable 80% rise in lignin disintegration.25 Apart from that, this research also identified product metabolites and proposed predictions of their degradation pathways.
Materials and method
Chemicals
D. dickinsii and A. oryzae were obtained from fungus collection in the Microorganism Chemistry Laboratory, Department of Chemistry Institut Teknologi Sepuluh Nopember (ITS). Furthermore, the materials used comprised potato dextrose agar (PDA, Merck), potato dextrose broth (PDB, Merck), methylene blue (MB, SAP), aquadest, alcohol 70%, rubbing alcohol, aluminum foil, plastic wrap, parafilm, filter paper, methanol, and acetone.Biodecolorization of MB by single culture
Decolorization process was performed in a liquid PDB medium, and the initial stage was carried out by pre-incubating the culture. A total of 1 mL homogenized culture (D. dickinsii or A. oryzae) was inoculated into 100 mL Erlenmeyer containing 9 mL sterile PDB and each culture was pre-incubated at 30 °C for 7 days.17Pre-incubated cultures of D. dickinsii or A. oryzae were added with 10 mL PDB medium, followed by 1 mL MB dye (final concentration MB 95.24 mg L−1). Furthermore, the cultures were covered with a glass cover and parafilm, followed by incubation at 30 °C for 7 days. At the end of incubation, the liquid sample was separated by centrifuging at 3000 rpm for 15 min and the filtrate was taken to measure the absorbance using UV-Vis spectrophotometer instrument.
Biodecolorization of MB by mixed cultures
Pre-incubated D. dickinsii culture (10 mL) was mixed with 10 mL pre-incubated A. oryzae culture. Mixed cultures were added with 1 mL MB dye with a final concentration of MB 95.24 mg L−1. The abiotic control in this study was 20 mL sterile PDB medium, which was added with 1 mL MB solution without adding any fungus culture. Furthermore, mixed cultures were covered with a glass cover and taped with parafilm. The cultures and abiotic control were then incubated for 7 days at a temperature of 30 °C in static conditions. After 7 days, the biomass and filtrate were separated by centrifuge at 3000 rpm for 15 min. The absorbance of the filtrate was measured using UV-Vis spectrophotometer. The calculation of decolorization percentage was carried out using the following equation (eqn (1)).19
 | (1) |
Analysis of metabolites
Biotransformation analysis of MB and the metabolite product was carried out by decanting the supernatant after the centrifugation process, followed by analysis using LC-TOF MS instrument. Furthermore, the ionization source was ionization electron spheres (ESI) with a mass range of 50–350. The elution method was carried out using the gradient technique with a flow rate of 0.2 mL min−1 and 0.4 mL min−1 in the first 3 min and the next 7 min, respectively. The mobile phase used methanol and water with a ratio of 99![[thin space (1/6-em)]](https://www.rsc.org/images/entities/char_2009.gif) :
:![[thin space (1/6-em)]](https://www.rsc.org/images/entities/char_2009.gif) 1 in the initial 3 min and 61
1 in the initial 3 min and 61![[thin space (1/6-em)]](https://www.rsc.org/images/entities/char_2009.gif) :
:![[thin space (1/6-em)]](https://www.rsc.org/images/entities/char_2009.gif) 39 for the remaining 7 min. The column used was Acclaim TM RSLC 120 C18 with a size of 2.1 × 100 mm and a column temperature of 33 °C.26
39 for the remaining 7 min. The column used was Acclaim TM RSLC 120 C18 with a size of 2.1 × 100 mm and a column temperature of 33 °C.26
Results
Biodecolorization of MB by single culture
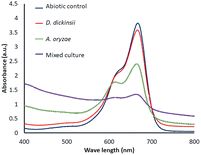
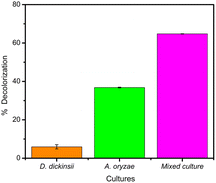
The results of decolorization by single culture of D. dickinsii and A. oryzae against MB with an initial concentration of 95.24 mg L−1 were shown by profiling in Fig. 1 and compared with abiotic control (without the addition of fungus). Based on the analysis results using UV-Vis spectrophotometer, the absorbance at 665 nm for the abiotic control, D. dickinsii, and A. oryzae were 3.805, 3.579, and 2.404, respectively. Furthermore, the percentage of decolorization by single culture of D. dickinsii and A. oryzae was 5.94% and 36.82%, respectively.Biodecolorization of MB by fungus mixed cultures
The effect regarding mixed cultures of D. dickinsii and A. oryzae on decolorization of MB dye was analyzed using UV-Vis spectrophotometer. The analysis showed that at MB wavelength of 665 nm, an absorbance of 1.341 was obtained, with a percentage color removal of 64.77%. Therefore, it could be concluded that mixed cultures of D. dickinsii and A. oryzae could increase decolorization percentage of MB dye.Fig. 1 shows the absorbance profile of the four samples, including abiotic control, single culture of D. dickinsii, single culture of A. oryzae, and mixed cultures of D. dickinsii and A. oryzae. Mixed cultures could remove MB with a higher percentage compared to single culture. Fig. 2 shows decolorization percentage for each culture variation. Apart from that, visualization of the color changes resulting from degradation can be seen in Fig. 3, where (a) is the initial MB solution (control) and (b)–(d) are the results of color removal with single culture and mixed culture.
 | ||
| Fig. 3 (a) MB control and decolorization result using various treatment, (b) D. dickinsii, (c) A. oryzae and (d) mixed culture. | ||
Metabolites of MB biodecolorization by D. dickinsii
Chromatogram from LC-TOF MS of MB biodecolorization by D. dickinsii showed the presence of 2 same peaks between the control (without adding any culture) and treatment (MB that has been decolorized by D. dickinsii) at retention time of 5.57 min, showing MB peak (m/z 284 data not shown). Furthermore, a total of 3 metabolites were detected (Table 1) at retention times of 3.96, 6.17, and 8.29. The compounds were identified as 3-(dimethylamino)-7-(methylamino)phenothiazine (C15H16N3S, m/z 270), 3,7-bis(dimethylamino)-4aH-phenothiazin-5-one (C16H19N3SO, m/z 300), and 4-(dimethylamino)-2-[m-(dimethylamino)phenylsulfiny]benzenamine (C16H21N3SO, m/z 303). Similar results had also been obtained and predicted in the previous study by Rizqi et al.17Metabolite of MB biodecolorization by A. oryzae
A chromatogram of MB biodecolorization using A. oryzae is presented in Fig. 4. At retention time of 6 min, 2 similar peaks were detected as MB peak (m/z 284). Furthermore, treatment MB (MB that has been decolorized by A. oryzae) had a lower peak compared to the control (without adding any culture) at the same retention time, showing the occurrence of decoloration. N-(8-(Dimethylamino)-2-pentadecyl-3H-phenothiazin-3-ylidene)-N-methyl methanaminium (C31H48N3S+, m/z 494) was detected as a metabolite at retention time of 5.17 min, as shown in Table 2. This metabolite had also been reported in the previous study by Purnomo et al.27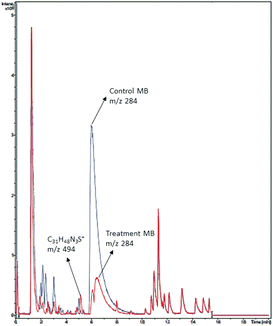 | ||
| Fig. 4 Chromatogram of biodecolorizaton of MB by A. oryzae. Blue: control chromatogram (MB + PDB) and red: treatment chromatogram (A. oryzae). | ||
Metabolite products of MB biodecolorization by mixed cultures
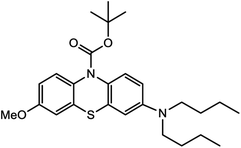
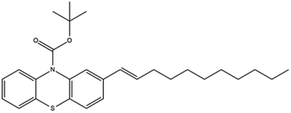
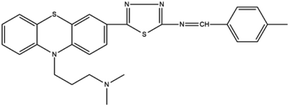
Based on decolorization analysis results of mixed cultures using LC-TOF MS, chromatograms were obtained, as shown in Fig. 5. MB peak (m/z 284) intensity was high on the control chromatogram (without adding any culture) at retention time of 6.00 min, while a lower density was obtained for the treatment (MB that has been decolorized by mixed cultures), showing MB decolorization. A total of 4 metabolites were detected (Table 3) at retention times of 2.31, 3.65, 3.85, and 4.06, respectively. These compounds were identified as tert-butyl-3-(dibutylamino)-7-methoxy-10H-phenothiazine-10-carboxylate (C26H37N2O3S, m/z 457), 4-methyl-6-nitro-2H-benzo[b][1,4]thiazin-3(4H)-one (C9H8N2O3S, m/z 224), (E)-tert-butyl 2-(undec-1-en-1-yl)-10H-phenothiazine-10-carboxylate (C28H38NO2S, m/z 452), and 5-(10-(3-(dimethylamino)propyl)-10H-phenothiazin-3-yl)-N-(4-methylbenzylidene)-1,3,4-thiadiazol-2-amine (C27H27N5S2, m/z 485).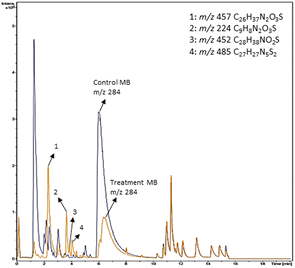 | ||
| Fig. 5 Chromatogram of biodecolorization of MB by mixed cultures of D. dickinsii and A. oryzae. Black: control chromatogram (MB + PDB) and orange: treatment chromatogram (mixed cultures). | ||
Discussion
Biodecolorization was an effective method to overcome textile waste, specifically for decolorizing dye. In this study, decolorization process of MB was carried out in a liquid PDB medium to determine the ability of single culture of D. dickinsii or A. oryzae and mixed cultures to remove MB dye quantitatively. Furthermore, PDB was the most suitable medium for fungus regeneration, specifically brown-rot fungus when compared to other types of liquid media, such as low nitrogen (LN) and high nitrogen (HN) media.18,28During the experiment, biodecolorization of MB by single culture of D. dickinsii or A. oryzae was carried out after a pre-incubation period of 7 days at 30 °C. The dye sample was added to each fungus culture with a final concentration of 95.24 mg L−1. Fig. 1 shows that the maximum wavelength of MB in abiotic control was 665 nm, with an absorbance of 3.805. Meanwhile, in the treatment by single culture of D. dickinsii or A. oryzae, the absorbance at 665 nm was 3.579 and 2.404, respectively. The results showed that the reduction in the absorbance value at a wavelength of 665 nm, indicated the occurrence of decolorization by each single culture of fungus. Based on the results, biodecolorization percentage of single culture of D. dickinsii and A. oryzae was 5.94% and 36.82%, respectively.
In fact, the biodecolorization ability of D. dickinsii and A. oryzae is still lower than the Gloeophyllum trabeum and A. oryzae mixed culture (69.34%).27 This could be due to the different types of enzymes possessed by the two cultures. G. trabeum produces xylanase and laccase enzymes while A. oryzae produces lignolytic enzymes. Meanwhile, in D. dickinsii fungus, MB decolorization is related to the extracellular enzymes they have and the ability to produce hydroxyl radicals from the Fenton reaction.29 And to be honest, the potential of these two mixed cultures is still below the achievement of the mixed culture between D. dickinsii fungus and Ralstonia pickettii bacteria which reached 88.79% after 7 days of incubation.30 Generally, fungi have the advantage of being able to grow better than bacteria because their extracellular enzymes can be adapted to break down high molecular weight pollutants.31 Therefore, the study of mixed culture is still widely open to find the best culture composition for decolorizing MB dye.
The analysis of decolorization results using mixed cultures showed that at wavelength of 665 nm, the absorbance was 1.341, with a color removal percentage of 64.77%. This showed that mixed cultures of D. dickinsii and A. oryzae had a significant percentage of MB decolorization compared to single culture.
According to the chromatogram, MB peak on each chromatogram decreased after biodecolorization process by each culture. In the treatment chromatogram using D. dickinsii, there were different new peaks, which were hypothesized as metabolite products, but absent in the control. Furthermore, peaks appeared at retention time of 3.96, 6.17, and 8.29 min. TOF-MS data showed that peak at retention time of 3.96 min had m/z 270 and was suggested to be C15H16N3S (3-(dimethylamino)-7(methylamino)phenothiazine) based on the library. This result was consistent with Rauf et al.,32 which also found these compounds in MB degradation using the photocatalysis method. Peak at retention time of 6.17 min had an m/z value of 300 and was suggested to be C16H19N3SO (3,7-bis(dimethylamino)-4aH-phenothiazin-5-one) based on the library. This result was in line with Huang et al.,33 which also found these compounds from MB degradation using the dielectric pressure method. Peak at retention time of 8.29 min had an m/z of 303 and was hypothesized to be C16H21N3SO (4-(dimethylamino)-2-[m-(dimethylamino)phenylsulfinyl]benzenamine) based on the library. This was consistent with Nezamzadeh et al.,34 which found the same compound from MB degradation using the photocatalysis method with CuO nanoparticles and zeolite X.
New peaks also appeared on the chromatogram of biodecolorization using A. oryzae at retention time of 5.17 min. Based on TOF/MS data, peak in retention time of 5.17 minutes showed a metabolite product with m/z 494, and the compound could have the molecular formula C31H48N3S+ (N-(8-(dimethylamino)-2-pentadecyl-3H-phenothiazin-3-ylidene)-N-methylmethanaminium). This result was supported by the presence of several fragments in the spectra, such as m/z 286, m/z 232, m/z 181, and m/z 145. Similar results were obtained from Bandyopadhyay et al., where a compound was synthesized from a lipophilic analog of MB, which increased mitochondrial biogenesis and frataxin levels.35
In this study, new peaks were observed on mixed cultures treatment chromatogram at retention time of 2.31, 3.65, 3.85, and 4.06 min. TOF/MS data showed that peak at retention time of 2.31 min had an m/z of 457, which was hypothesized to be C26H37N2O3S (tetra-butyl 3-(N,N-dibutylamino)-7-methoxy-10H-phenothiazine-10-carboxylate). This compound was supported by the presence of m/z 143 and m/z 86 fragments in the spectra. The results were also in line with Chowdhury et al.,36 where an analogue compound of MB was obtained, which functioned as a radical extinguisher. Peak at retention time of 3.65 min showed a metabolite product with m/z 224, which was hypothesized to be C9H8N2O3S (4-methyl-6-nitro-4H-benzo[1,4]thiazine-3-one). This compound was supported by the m/z 113 fragment, which possessed a very high intensity. The results were consistent with the study by Souza et al.,37 which found that the compound was formed from the synthesis of benzylidene benzothiazine, a derivative of MB. At peak with retention time of 3.85 min, there was a metabolite with m/z 452, which was C28H38NO2S (tetra-butyl(E)-2-(undek-1-en-1-il)-10H-phenothiazine-10-carboxylate). This compound was supported by the presence of fragments m/z 286, m/z 216, and m/z 113 in the spectra. At peak with retention time of 4.06 minutes, there was a product metabolite with m/z of 485, which was possibly C27H27N5S2 (N-(4-methylbenzylidene)-5-(10-(3-(N,N-dimethylamino)propyl)-10H-phenothiazine-3il)-1,3,4-tiadiazol-2-amine). This compound was supported by the presence of m/z 232 and m/z 113 fragments in the spectra. The results were consistent with Gopi et al.,38 where the compound was a product of MB from azo dyes/basic Schiff derivatives.
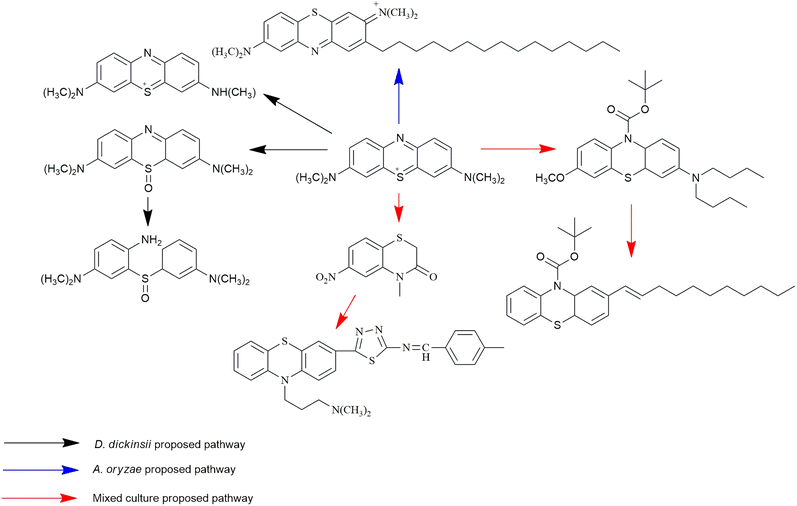
MB biotransformation that occurred in the presence of single D. dickinsii culture had been previously proposed by Rizqi et al.17 through 2 pathways, namely demethylation and oxidation, and the breaking of the double C![[double bond, length as m-dash]](https://www.rsc.org/images/entities/char_e001.gif) N bond. The ability of D. dickinsii to decolorize MB dye was related to the production of hydroxyl radicals from the Fenton reaction mechanism. Meanwhile, MB transformation occurred during decolorization with A. oryzae, and the proposed pathway had also been published by Purnomo et al.27 with m/z 494. A new pathway was also proposed in this study from mixed cultures of D. dickinsii and A. oryzae, as shown in Fig. 6.
N bond. The ability of D. dickinsii to decolorize MB dye was related to the production of hydroxyl radicals from the Fenton reaction mechanism. Meanwhile, MB transformation occurred during decolorization with A. oryzae, and the proposed pathway had also been published by Purnomo et al.27 with m/z 494. A new pathway was also proposed in this study from mixed cultures of D. dickinsii and A. oryzae, as shown in Fig. 6.
The level of toxicity of metabolites from MB degradation was predicted using known applications. Furthermore, applications, such as Protox-II,39 pkCSM (https://biosig.lab.uq.edu.au/pkcsm/prediction), and TEST from US EPA were used for LD50 prediction of these metabolites. Table 4 showed the prediction results, where the LD50 value of MB was 1180 mg kg−1 based on the PubChem website.40 In a previous study on the toxicity of dyes compared to metabolites from dye degradation, enhanced growth of experimental plants was observed when grown under dye-degraded products.41 This suggested the possibility that the degradation product was lower in toxicity compared to the initial dye. From the prediction of Protox-II application, the results of MB dye degradation from each culture had varying toxic properties. In single culture A. oryzae, the metabolite produced had the same toxic level as MB, while in D. dickinsii and mixed cultures, there were higher levels of toxicity (m/z 270 and 452) and some had lower levels (m/z 303 and 485).
| Metabolites (m/z) | Toxicity prediction (LD50) | ||
|---|---|---|---|
| TEST (US EPA) (mg kg−1) | pKCSM (mol kg−1) | Protox II (mg kg−1) | |
| D. dickinsii | |||
| 270 | N/A | 2.206 | 350 |
| 300 | 458.37 | 2.611 | 1150 |
| 303 | 120.69 | 2.509 | 2240 |
![[thin space (1/6-em)]](https://www.rsc.org/images/entities/char_2009.gif) |
|||
| A. oryzae | |||
| 494 | 1013.54 | 2.385 | 1180 |
![[thin space (1/6-em)]](https://www.rsc.org/images/entities/char_2009.gif) |
|||
| Mixed cultures | |||
| 224 | N/A | 2.224 | 1050 |
| 452 | 291.89 | 2.72 | 495 |
| 485 | 908.65 | 2.501 | 3100 |
Conclusions
In conclusion, this study succeeded in showing the synergy regarding mixed cultures of D. dickinsii and A. oryzae to decolorize MB dye. Mixed cultures were proven to produce a higher percentage of decolorization (64.77%) compared to single culture of D. dickinsii and A. oryzae, namely 5.94% and 36.82% respectively. The metabolites produced from decolorization process with D. dickinsii included C15H16N3S, C16H19N3SO, and C16H21N3SO, while C31H48N3S+ was produced from A. oryzae. The results showed that mixed cultures produced several metabolites, including C26H37N2O3S, C9H8N2O3S, C28H38NO2S, and C27H27N5S2.Author contributions
ASP: conceptualization, methodology, validation, resources, writing – original draft, writing – review & editing, supervision, funding acquisition. USF: validation, formal analysis, methodology, investigation, writing – original draft, visualization. TRA: validation, formal analysis, writing – original draft, writing – review & editing, visualization. HDR: formal analysis, writing – original draft, writing – review & editing. IK: validation, writing – original draft.Conflicts of interest
The authors declare no conflict of interest.Acknowledgements
This study was funded by the Directorate of Research and Community Service, Institut Teknologi Sepuluh Nopember (ITS), under the scheme of Partnership Research, Number: 2260/PKS/ITS/2023.References
- L. Singh, Journal of Applied Biotechnology & Bioengineering, 2017, 3, 430–435 Search PubMed.
- S. P. Bera, M. P. Shah and M. Godhaniya, Front. Environ. Sci., 2022, 10, 930616 CrossRef.
- T. Arunprasath, S. Sudalai, R. Meenatchi, K. Jeyavishnu and A. Arumugam, Biocatal. Agric. Biotechnol., 2019, 17, 672–679 CrossRef.
- Z. Derakhshan, M. A. Baghapour, M. Ranjbar and M. Faramarzian, Health Scope, 2013, 2, 136–144 CrossRef.
- N. Shimizu, C. Ogino, M. F. Dadjour and T. Murata, Ultrason. Sonochem., 2007, 14, 184–190 CrossRef CAS.
- S. Chin, E. Park, M. Kim and J. Jurng, Powder Technol., 2010, 201, 171–176 CrossRef CAS.
- J. Zhang, K.-H. Lee, L. Cui and T. Jeong, J. Ind. Eng. Chem., 2009, 15, 185–189 CrossRef CAS.
- Q. Wang, S. Tian, J. Long and P. Ning, Catal. Today, 2014, 224, 41–48 CrossRef CAS.
- I. Feddal, A. Ramdani, S. Taleb, E. M. Gaigneaux, N. Batis and N. Ghaffour, Desalin. Water Treat., 2014, 52, 2654–2661 CrossRef CAS.
- N. Yildirim, G. Ö. Ergüven and A. Çel
![[i with combining dot above]](https://www.rsc.org/images/entities/char_0069_0307.gif) K, Journal of Anatolian Environmental and Animal Sciences, 2021, 6, 211–216 CrossRef.
K, Journal of Anatolian Environmental and Animal Sciences, 2021, 6, 211–216 CrossRef. - A. S. Purnomo, in Microbe-Induced Degradation of Pesticides, ed. S. N. Singh, Springer International Publishing, Cham, 2017, pp. 1–22 Search PubMed.
- R. P. Kalnake, R. Raval, D. V. R. Murthy, P. B. Vanzara and K. Raval, Bioresour. Technol. Rep., 2023, 22, 101449 CrossRef CAS.
- S. S. Mohanty and A. Kumar, Sci. Rep., 2021, 11, 7678 CrossRef CAS PubMed.
- H. Patel, V. K. Yadav, K. K. Yadav, N. Choudhary, H. Kalasariya, M. M. Alam, A. Gacem, M. Amanullah, H. A. Ibrahium, J.-W. Park, S. Park and B.-H. Jeon, Water, 2022, 14, 3163 CrossRef CAS.
- B. Abbasi, International Journal of Medical Reviews, 2018, 4, 112–118 CrossRef.
- R. T. Mahmood, M. J. Asad, M. Asgher, M. Gulfraz and T. Mukhtar, Pak. J. Agric. Sci., 2017, 54, 407–413 Search PubMed.
- H. D. Rizqi and A. S. Purnomo, World J. Microbiol. Biotechnol., 2017, 33, 92 CrossRef PubMed.
- A. S. Purnomo, I. Kamei and R. Kondo, J. Biosci. Bioeng., 2008, 105, 614–621 CrossRef CAS PubMed.
- A. S. Purnomo and M. O. Mawaddah, Biodiversitas, 2020, 21, 2297–2302 Search PubMed.
- A. S. Purnomo, T. Mori and R. Kondo, Int. Biodeterior. Biodegrad., 2010, 64, 560–565 CrossRef CAS.
- S. J. Correa, A. C. Jaramillo, R. A. Merino and A. Hormaza, BASE, 2018, 242–251 CrossRef.
- F. Kuhar, V. Castiglia and L. Levin, Int. Biodeterior. Biodegrad., 2015, 104, 238–243 CrossRef CAS.
- W. M. A. El-Rahim, H. Moawad, A. Z. A. Azeiz and M. J. Sadowsky, Egypt. J. Aquat. Res., 2021, 47, 269–276 CrossRef.
- S. T. Akar, A. Gorgulu, Z. Kaynak, B. Anilan and T. Akar, Chem. Eng. J., 2009, 148, 26–34 CrossRef CAS.
- Z. Zhang, J. Jia, M. Li and Q. Pang, BioResources, 2014, 9, 3077–3087 CAS.
- A. S. Purnomo, A. Asranudin, D. Prasetyoko and Y. D. N. Azizah, Indones. J. Chem., 2021, 21, 1418 CrossRef CAS.
- A. S. Purnomo, A. S. Prameswari, H. D. Rizqi, T. R. Alkas, R. Ediati and Y. Kusumawati, Int. J. Technol., 2022, 13, 1768 CrossRef.
- P. A. Setyo, H. R. Dwi, F. Sri, P. H. Sulistyo and K. Ichiro, Res. J. Chem. Environ., 2018, 22, 151–156 Search PubMed.
- A. Sariwati and A. S. Purnomo, Indones. J. Chem., 2018, 18, 75 CrossRef CAS.
- B. Nabilah, A. S. Purnomo, H. D. Rizqi, H. S. Putro and R. Nawfa, Heliyon, 2022, 8, e08963 CrossRef CAS PubMed.
- S. Wang, N. Nomura, T. Nakajima and H. Uchiyama, J. Biosci. Bioeng., 2012, 113, 624–630 CrossRef CAS PubMed.
- M. A. Rauf, M. A. Meetani, A. Khaleel and A. Ahmed, Chem. Eng. J., 2010, 157, 373–378 CrossRef CAS.
- F. Huang, L. Chen, H. Wang and Z. Yan, Chem. Eng. J., 2010, 162, 250–256 CrossRef CAS.
- A. Nezamzadeh-Ejhieh and M. Karimi-Shamsabadi, Appl. Catal., A, 2014, 477, 83–92 CrossRef CAS.
- I. Bandyopadhyay, S. R. Chowdhury, N. P. Visavadiya, S. M. Hecht and O. M. Khdour, Data Brief, 2018, 20, 1105–1114 CrossRef PubMed.
- S. R. Chowdhury, Synthesis of Methylene Blue Analogues as Multifunctional Radical Quenchers, Synthesis of Unnatural Amino Acids and Their Ribosomal Incorporation into Proteins, Arizona State University, 2016 Search PubMed.
- A. M. A. D. Souza, V. L. D. M. Guarda, L. F. C. D. C. Leite, J. M. Barbosa Filho, M. D. C. A. D. Lima, S. L. Galdino and I. D. R. Pitta, Quim. Nova, 2006, 29, 1106–1109 CrossRef.
- C. Gopi, V. G. Sastry and M. D. Dhanaraju, Future Journal of Pharmaceutical Sciences, 2017, 3, 79–89 CrossRef.
- P. Banerjee, A. O. Eckert, A. K. Schrey and R. Preissner, Nucleic Acids Res., 2018, 46, W257–W263 CrossRef CAS PubMed.
- J. V. Marhold, Prehled průmyslové toxikologie : organické látky, Avicenum, Praha, 1st edn, 1986 Search PubMed.
- S. Amin, R. P. Rastogi, M. G. Chaubey, K. Jain, J. Divecha, C. Desai and D. Madamwar, Front. Microbiol., 2020, 11, 576680 CrossRef PubMed.
| This journal is © The Royal Society of Chemistry 2024 |

