DOI:
10.1039/D3RA08521J
(Paper)
RSC Adv., 2024,
14, 7745-7762
Comprehensive analysis of cationic dye removal from synthetic and industrial wastewater using a semi-natural curcumin grafted biochar/poly acrylic acid composite hydrogel†
Received
13th December 2023
, Accepted 27th February 2024
First published on 8th March 2024
Abstract
Polymer composites offer a tailored framework as an exceptional candidate for water treatment due to their tunable chemical structure, porous 3D architecture, physiochemical stability, accessibility, pH-sensitivity and ease of use. In this study, curcumin-engineered biochar is embedded into a cross-linked polyacrylic acid hydrogel matrix using in situ polymerization for developing a semi-natural adsorbent for the removal of cationic dye from an aqueous solution. The physicochemical features of the generated composite hydrogel are significantly influenced by the implementation of curcumin-grafted biochar into the polyacrylic acid substrate. Comprehensive characteristic approaches were employed to explore all aspects of the adsorbent's properties, especially its removal efficacy. The methodical adsorption study was accomplished by monitoring dynamic factors such as pH, adsorbent content, time frame, and initial dye concentration. The presence of the porous aromatized structure of biochar, active oxygen-enrich functional groups (carboxyl, hydroxyl, keto, enol, ether) coupled with the conjugated curcumin structure facilitate the effective establishment of hydrogen bonds, electrostatic interactions, π–π interactions, electron donor–acceptor and charge-assisted H-bonding with the malachite green (MG) and rhodamine B (Rho) molecules. The highest adsorption capacities of MG and Rho reached 521 mg g−1 and 741 mg g−1 respectively, in the range of neutral pH, considering their molecular nature, functionalities, and unique adsorption mechanisms. The isothermal modeling was carried out with Henry, Langmuir, Jovanovic, Freundlich, Temkin, and Koble–Corrigan models to determine the adsorption system. Additionally, the kinetic data were assessed with Bangham, pseudo-first-order, pseudo-second-order, intra-particle, and liquid film diffusion models to ascertain the rate-limiting phase. The Koble–Corrigan and Langmuir isotherm models (R2 > 0.997) as well as pseudo-second-order (R2 > 0.998) and Elovich (R2 = 0.983 and 0.995) kinetics models provide a substantial level of concordance with empirical findings. The analysis of non-linear diffusion models revealed that the Bangham (R2 > 0.995) pore and liquid film diffusion (R2 > 0.960) models has major influence on the rate of the adsorption procedure. The binary adsorption test demonstrated higher efficacy of the synthesized adsorbent in the removal of malachite as compared to rhodamine. This study sheds light on the design of a cost-effective semi-natural polymeric composite for treating dye-polluted wastewaters, a major milestone toward environmental and ecological sustainability.
1 Introduction
Undoubtedly, the water pollution crisis can be considered the foremost challenge confronting humanity and can dramatically harm ecosystems and natural processes. Four hundred and fifty millions of children are among the 1.42 billion people who reside in regions with high or extremely high-water vulnerability today.1 According to a WHO report in 2021, 884 million people suffered from a lack of access to safe drinking water, which resulted in the daily loss of 2195 children, more than AIDS, malaria, and measles altogether.2 Water pollution can be considered the growth of the population can exacerbate this situation through the expansion of the industrial sector, agricultural landfills, and the industrialization of mining activities.3 Heavy industries (steel, automotive, transportation),4 textile, petrochemical, dyeing, pharmaceutical, and chemical (fertilizers and pesticides) are the main pollutants originators of surface and underground water.5 The major contaminants in water bodies can be categorized into organic compounds (dyes, phenols, and pharmaceuticals6), inorganic pollutants (toxic7 and heavy metals),8 pathogens, suspended particles, nutrients, agro-pollutants (pesticides and fertilizers),9 and thermal and radioactive substances.10 Dyes are chemical substances that exhibit inherent risks which are extensively utilized across various sectors, such as textiles, plastics, food processing, dyeing, pulp and paper production, carpet making, printing, medicines,11 cosmetics, and photoelectric technology.12 Replacing conventional dyes with modern dyes with complex structures and higher chemical, thermal, photochemical,13 and biological degradation resistance, making their degradation even more complicated.14 Dyes-colored water can impede sunlight penetration and elevate microorganism oxygen demand.15 Even a trace amount of dyes (1.0 mg L−1) can be unsafe for human and animal consumption due to their carcinogenicity, reproductive and developmental toxicity, neurotoxicity, and chronic toxicity.16 Rhodamine B (a xanthine organic dye) and malachite green (a triarylmethane dye) have enormous applications in fluorescence staining, leather and paint manufacturing, textile dyeing,17 paper printing, glass production, fungicides, and ectoparasiticides in aquaculture, as well as in food additives and cell staining, respectively.18 The observation of MG residues in fish tissue suggests the potential entry of this toxic chemical into the food chain and endangers human health.19 To date, a variety of approaches namely ion exchange membrane separation,20 Bioremediation,21,22 photochemical degradation, electrocoagulation,23 adsorption, and fenton-biological degradation24,25 have been developed to treat dye-laden wastewater. The adsorption approach is widely favored owing to its cost-effectiveness, ease of implementation, outstanding effectiveness, and ability to facilitate sludge-free cleaning operations.26 The unique properties of metal–organic frameworks,27 metal oxide, carbon-based nanomaterials (such as graphene, single/multiwall carbon nanotubes, and carbon fibers), porous adsorbents such as clay, fly ash,6 zeolite, sepiolite, activated carbons, bionanomaterials,28 natural and synthetic polymers, and agro wastes products (biochar) made them potential candidates for the removal of dyes.29 Biochar has garnered attention in the field of environmental research due to its large surface to volume ratio, relatively low density, affordability, tolerance to high temperatures, and oxygen-containing functional groups (–COOH, –OH, –OCH3, and phenol).30 The application of biochar in wastewater treatment is now being widely researched, with a particular emphasis on its potential for adsorbing medicines, toxic metals, dyes, chemical pesticides, and organic molecules. In particular, several composites of biochar and their derivatives with natural polymers (cellulose,31 alginate,29 chitosan,32) as well as synthetic polymers (acrylamide,33 polyaniline,34 polysiloxane35) have been synthesized to develop effective adsorbents for the elimination of chemical contaminants such as Co(II), crystal violet, Congo red, MG, Pb(II), antibiotics. Moreover, a substantial amount of work has been dedicated to enhancing the effectiveness of pollution removal by optimizing the quantity and composition of surface functional groups.36 Oxidation (H2O2, KMnO4, HNO3, or an HNO3/H2SO4 mixture treatment),37 amination,38,39 and H3PO4 treatment40 stand out among surface modification methods due to their positive impact on redox potential, active surface area, surface charge, particle size, and hetero atom-containing functional groups which may result in increased wettability and pollutants removal. Today, the utilization of biomaterials such as curcumin, gingerol, papain, caffeic acid, and gluconic acid for surface modification has gained significant attention among researchers due to their abundant availability, biodegradability, cost-effectiveness, and versatile structures. Incorporation of curcumin treated boehmite nanoparticles in PES ultrafiltration membrane shows boosted removal efficiency against heavy metals.41 In light of the above background, a hypothesis has been proposed suggesting that the integration of curcumin-modified biochar into the cross-linked network architecture of polyacrylic acid (PAA) gel may enhance the absorbency and physical characteristics of the adsorbent composite. It is anticipated that the introduction of curcumin to the surface of biochar with keto/enol, phenol, and methoxy functional groups of benzene rings, along with the conjugated structure, without the use of environmentally incompatible reagents, would boost the removal efficiency of the developed polymeric adsorbent. The synergistic effects of curcumin@biochar and the physicochemical properties of the proposed sorbent-gel were investigated using systematic analyses. The removal efficiency of the fabricated adsorbent was gauged using Rho and MG dye solutions. The impact of various independent variables like pH, dye concentration, adsorbent dosage, and time intervals was explored in order to thoroughly probe the validity of this hypothesis. The binary adsorption test was carried out to assess the presumed selective adsorption of dyes. Finally, the adsorption mechanism and rate-limiting stage were systematically elucidated using six non-linear kinetic and six isothermal models. Therefore, the biochar@curcumin/PAA adsorbent was discovered to be highly regenerate over seven cycles and hence suitable for engineering ecologically sustainable adsorbents for the treatment of water sources, suggesting its potential for the removal of other pollutants in future researches.
2 Experimental
2.1 Materials
Malachite green (C23H25ClN2, 98%), rhodamine B (C28H31ClN2O3, ≥95%), acrylic acid (AA, C3H4O2, 99%), azobisisobutyronitrile (AIBN, [(CH3)2C]2N2, >98%), (3-chloropropyl)trimethoxysilane (CPTMS, Cl(CH2)3Si(OCH3)3, ≥97%), were acquired from Merck Millipore Co (India), and hydrochloric acid (HCl, 37%), sodium hydroxide (NaOH, 99%), N,N′-methylenebisacrylamide (BMA, C7H10N2O2, 99%), were also purchased from Loba chemie Co (India) and employed without any additional purification. The fresh rhizoids of Curcuma longa were purchased from domestic suppliers. The crude biochar was acquired from the ICAR Division of Medicinal and Aromatic Plants Research in Anand.
2.2 Curcumin extraction
A modified solid–liquid extraction method was applied to prepare a fresh curcumin solution from raw Curcuma longa rhizome.41 200 grams of raw rhizoids were dried for 24 hours at room temperature under airflow. The dry sample was pulverized and sieved. A solid-to-solvent ratio of 1![[thin space (1/6-em)]](https://www.rsc.org/images/entities/char_2009.gif) :8 was used to disperse 8 grams of the obtained powder in ethanol for 1 h using an ultrasonic probe, followed by 2 hours of vigorous stirring in an inert atmosphere at room temperature. The solution was filtered, and curcumin was collected in the ethanol media and stored in a dark and cool environment to minimize decomposing rate.
:8 was used to disperse 8 grams of the obtained powder in ethanol for 1 h using an ultrasonic probe, followed by 2 hours of vigorous stirring in an inert atmosphere at room temperature. The solution was filtered, and curcumin was collected in the ethanol media and stored in a dark and cool environment to minimize decomposing rate.
2.3 Curcumin functionalized biochar
To functionalize biochar with curcumin, 0.5 g of untreated dried biochar powder was suspended in 10 mL of anhydrous toluene using a sonicator for 30 minutes. The mixture was then given 0.5 mL of (CPTMS) and stirred for 24 h at 80 °C under an inert atmosphere. The product (Bio@CPTMS) was collected and washed several times using isopropyl alcohol and dried overnight at 60 °C. Afterward, curcumin grafted biochar (Bio@CPTMS@Cur) was obtained via a uniform dispersion of 0.2 g of Bio@CPTMS in 20 mL of curcumin solution in a sonicator for 30 min. The mixture was refluxed for 20 h at 70 °C under N2 environment. The desired product was isolated, washed three times with 20 mL of ethanol/water solution, and dried for 24 hours at 70 °C.
2.4 Preparation of hydrogel adsorbent
The composite adsorbent was synthesized based on our previously published work.42 Bio@CPTMS@Cur (0.05 g) was sonicated for 1 hour in 5 mL of deionized water. The mixture was then supplemented with 2.162 g (0.03 mol) AA and 0.092 g MBA (2 mol% with regard to monomers) and continuously stirred while being protected by N2. The reaction was conducted at 80 °C with the addition of 0.098 g of AIBN initiator (2 mol% concerning monomers) till the successful synthesis of the hydrogel. The formation of gel was confirmed by tube inversion test (Fig. S1†).43,44 The composite gel was cut into thin pieces and agitated in a deionized water bath for one day to remove any unreacted residue. The prepared adsorbent was freeze-dried in a lyophilizer for additional study and batch experiments (Fig. 1).
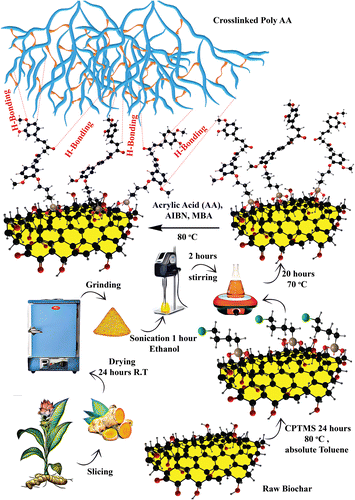 |
| | Fig. 1 Schematic presentation of adsorbent synthesis. | |
2.5 Adsorption experiment
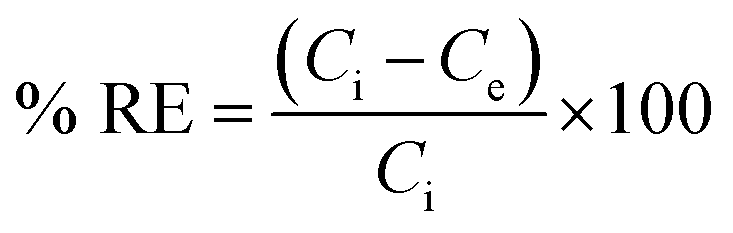
The study evaluated optimal dye adsorption parameters by analyzing pH levels (3 to 10), treatment time (0 to 180 min), initial dye concentrations (10 to 1200 mg L−1), and sorbent dosages (1 to 3.5 g L−1). The experimental batch sorption procedure involved the addition of 10–35 mg of biochar@curcumin/PAA adsorbent to 10 mL of Rho and MG containing dye solution at various pH values. The resulting mixtures were subjected to agitation at a temperature of 25 °C and a rotational speed of 600 rpm for different durations. The heterogeneity of the adsorbent structure resulted in its efficient and straightforward removal from the solution following the attainment of equilibrium. The residual dye concentration was determined using a UV-vis spectrometer at the maximum absorption wavelength (λmax, 553 nm) for Rho and (λmax, 617 nm) for MG. Adsorption capacity at equilibrium and removal efficiency were calculated as:45| |
 | (1) |
| |
 | (2) |
Here Ce (mg L−1) indicates the equilibrium dye concentration, Ci denotes the initial dye concentration, V signifies the dye solution volume (L), m represents the mass of the adsorbent, and Qe symbolizes the equilibrium adsorption capacity of dye adsorbed per gram of the adsorbent (g).
3 Result and discussion
3.1 Characterization methods
UV/vis spectrophotometer (UV2550-Shimadzu, Japan), FTIR spectrometer (Nicolet 6700, USA), SEM (JEOL, JSM 6010LA, Japan), thermogravimetric analyzer (Mettler-Toledo, Switzerland), and Zeta Potential Analyzer (HORIBA, SZ 100 X, Japan) were utilized. Energy dispersive X-ray spectroscopy (EDS) of adsorbent was executed utilizing a Numerix DXP-X10P. The X-ray diffraction (XRD) pattern of specimen was attained with a Bruker D2 Phaser X-ray diffractometer. Flow behavior of hydrogels was determined by Aton paar rheometer (MCR 301, Austria).
3.2 Fourier transform infrared analysis of biochar
Identification of functional groups in the multi-step conversion of substrate to the final product was carried out by FTIR spectroscopy. The wide absorption band in the range of 3200 to 3700 cm−1 is assigned to the stretching vibrations of the biochar hydroxyl (–OH) groups and moisture adsorbed onto the surface (Fig. 2a).46 Whereas, the O–H bending and the aromatic C–C symmetric stretching mode can be recognized between 1380 to 1450 cm−1. The distinct stretching vibrations mode of the aliphatic ether (C–O) functional groups peak appears at 1080 cm−1. Unsaturated C![[double bond, length as m-dash]](https://www.rsc.org/images/entities/char_e001.gif) C and CO stretching vibration appeared at 1623 cm−1.47 The vibrational mode associated with the stretching of the H–C bonds in the methylene group was detected at wavenumbers of 2922 cm−1 and 2858 cm−1.48 Fig. 2b displays the characteristic stretching vibrations of the CPTMS Si–O linker and Si–C peaks at wavenumbers of 1161 cm−1 and 1107 cm−1, respectively. The vibrations in the range 800–613 cm−1 corroborate the C–Cl stretching.49 The IR spectra of extracted curcumin, Fig. 2c, displays two peaks at 1627 and 1674 cm−1 that are attributed predominantly to the overlapping stretching vibrations of alkenes (CC) and carbonyl (CO) character.50 The asymmetric C–H stretching of –OCH3 groups appears at 2926 and 2960 cm−1.51 The bending vibrations of the (CO) phenolic group are indicated by a peak at 1281 appeared at 1513 cm−1.52 A small shoulder at 1732 cm−1 might be attributed to the vibration of the carbonyl bond (CO).53 Fig. 2d shows the IR spectra of curcumin-engineered biochar. In comparison to raw curcumin, the characteristic peaks of curcumin in 1511 cm−1 (CC aromatic), 1625 cm−1 and 1676 cm−1 (overlapping stretching vibrations of alkenes (CC) and carbonyl (CO)), 1160 cm−1 and 1276 (C–O of phenolic group) are distinguishable in the intermediate product. The band at around 1732 cm−1 is suggestive of CO stretching in the FTIR spectrum of biochar@CPTMS@curcumin/PAA (Fig. 2e), and the peaks at about 1544 cm−1 and 1454 cm−1 are ascribed to the asymmetric/symmetric stretching bands of carboxylate, accordingly.54
C and CO stretching vibration appeared at 1623 cm−1.47 The vibrational mode associated with the stretching of the H–C bonds in the methylene group was detected at wavenumbers of 2922 cm−1 and 2858 cm−1.48 Fig. 2b displays the characteristic stretching vibrations of the CPTMS Si–O linker and Si–C peaks at wavenumbers of 1161 cm−1 and 1107 cm−1, respectively. The vibrations in the range 800–613 cm−1 corroborate the C–Cl stretching.49 The IR spectra of extracted curcumin, Fig. 2c, displays two peaks at 1627 and 1674 cm−1 that are attributed predominantly to the overlapping stretching vibrations of alkenes (CC) and carbonyl (CO) character.50 The asymmetric C–H stretching of –OCH3 groups appears at 2926 and 2960 cm−1.51 The bending vibrations of the (CO) phenolic group are indicated by a peak at 1281 appeared at 1513 cm−1.52 A small shoulder at 1732 cm−1 might be attributed to the vibration of the carbonyl bond (CO).53 Fig. 2d shows the IR spectra of curcumin-engineered biochar. In comparison to raw curcumin, the characteristic peaks of curcumin in 1511 cm−1 (CC aromatic), 1625 cm−1 and 1676 cm−1 (overlapping stretching vibrations of alkenes (CC) and carbonyl (CO)), 1160 cm−1 and 1276 (C–O of phenolic group) are distinguishable in the intermediate product. The band at around 1732 cm−1 is suggestive of CO stretching in the FTIR spectrum of biochar@CPTMS@curcumin/PAA (Fig. 2e), and the peaks at about 1544 cm−1 and 1454 cm−1 are ascribed to the asymmetric/symmetric stretching bands of carboxylate, accordingly.54
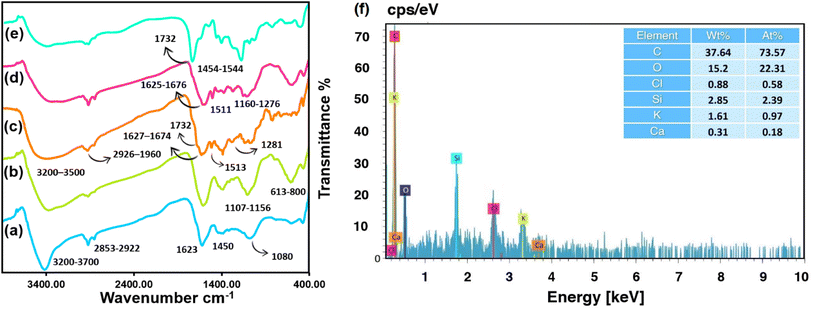 |
| | Fig. 2 FTIR spectra of raw biochar (a), biochar@CPTMS (b), extracted curcumin (c), biochar@CPTMS@curcumin (d), final product (e), and elemental percentage of biochar@curcumin/PAA composite hydrogel (f). | |
3.3 Elemental analysis
To ascertain the elemental percentage of curcumin-grafted biochar intermediate and adsorbent, the EDX analysis technique was adopted (Fig. 2f). According to the EDS data (2.39 at% Si), the CPTMS linker has been grafted effectively into the biochar surface. The presence of chlorine atoms arose from the unreacted –CH2Cl terminals. A lower atomic percentage of Cl compare to Si suggests the successful reaction among silane coupling agent and curcumin molecules. A more significant carbon percentage (73.57 at%) than the pristine AA (33.46 at%) is achieved through the inclusion of biochar@curcumin into the PAA matrix. The presence of K (0.97 at%) and Ca (0.18 at%) originated from the potassium and calcium elements in biochar sources.55
3.4 Morphological analysis
The porosity of adsorbents has a significant impact on the performance of an adsorption process by facilitating the infiltration of dye molecules into the voids and pores of the absorbent. The hydrogel possesses a unique porous structure with heterogeneous voids, as evidenced by the SEM micrographs (Fig. 3). Compared to virgin PAA hydrogel and our earlier study,42 the configuration of the pores and interconnected bridges between the backbones of the PAA matrix and additive has undergone a substantial alteration.56,57 The establishment of hydrogen bonds amid the carbonyl, ether, and hydroxyl groups in curcumin molecules and the carboxyl groups in PAA chains and MBA bridges are accountable for the integration of porous structures comprising both micro and macro holes. The observation of these permeable structures suggests a heightened adsorption efficiency.
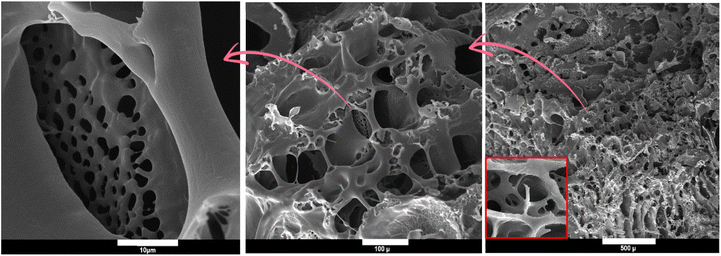 |
| | Fig. 3 Morphological analysis of adsorbent with different magnitude. | |
3.5 TGA
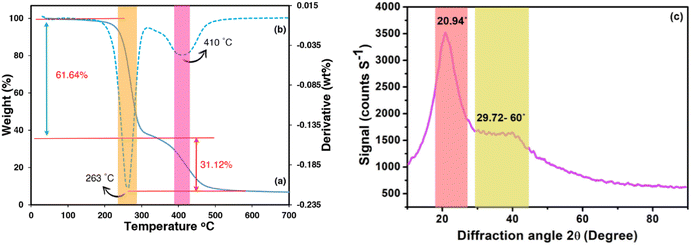
The thermal stability of PAA has extensive application in the modification and advancement of heat-resistant materials, encompassing fibre, coatings, adsorbents, and semi-natural composites.58 The thermal characteristics of the adsorbent were elucidated comprehensively across a temperature spectrum spanning from 30 to 800 °C. The TGA and DTA curves of the product breakdown are depicted in Fig. 4a and b. The curves indicate that at least two distinct endothermic reactions are discernible according to the maximum values on the DTA curve associated with the two degrees of TGA mass loss. The endothermic maximum of high intensity (70–300 °C) is attributed to the elimination of moisture, surface-adsorbed water molecules, and remnant solvents (EtOH, toluene) resulting in a mass loss of 61.64% (maximum of almost 263 °C).
 |
| | Fig. 4 TGA (a), DTA (b), and XRD (c) curves of composite hydrogel. | |
The water molecules emerged during the cyclization reaction are the main products of the beak down process in structural transformation (Fig. S2a†). Intermolecular and intramolecular anhydrides produced from adjacent carboxyl groups are showing prominent stability (Fig. S2b†). Another potential explanation for the observed mass reduction within the current range can be credited to the release of water molecules during the esterification process, comprising enol and phenol groups of curcumin molecules and carboxyl groups of PAA (Fig. S2c†). The second stage in mass loss (31.12%), with a maximum at 410 °C in the DTA curve, was hypothesized to be accounted for the decarboxylation of intramolecular anhydride and its transformation to the cyclic ketone by releasing CO2 (Fig. S2d†). Degradation of curcumin, as seen in Fig. S2e,† is another possible explanation for the mass decrease in this region.
3.6 XRD analysis of the adsorbent
X-ray diffraction analysis can be employed to establish a better understanding pertaining to the arrangement of polymer chains and the additive. The XRD patterns of biochar@curcumin/PAA are illustrated in Fig. 4c with an angular range (2θ) of 10–90°. The diffractogram of the product exhibits one conspicuous peak at a 2θ value of 20.94° and also a broad peak spanning the range of 29.72° to 60°. Variations in the crystallinity peak of acrylic polymer within acrylic-based hydrogels can occur due to the characteristics of additives and their interactions with the polymeric matrix during the polymerization process. The presence of a discernible peak at 20.94° in the PAA diagram signifies the growth of a semicrystalline structure within the synthesized hydrogel, which aligns with previous studies. Intermolecular hydrogen interactions involving the carboxyl groups of polymeric chains, the hydroxyl and carboxyl groups of biochar, and the grafted curcumin led to 1 to 2 degrees of shift in the observed peak.59 The second expanded peak originated from the atomic architecture of graphite-like structures in biochar.60 It is postulated that the Si–O characteristic peak, (originated from the presence of CPTMS linker) has been overshadowed by the intense PAA peak. The peak observed at 2θ = 29.72° (with an interplanar distance of 3 Å) could possibly be explained by the π–π stacking interaction occurring inside the composite hydrogel component, which comprises biochar and curcumin.61,62
3.7 Surface charge analysis
The pH of the solution affects the pHPZC, surface charge type and density, which have significance for optimal interaction with charged species. Consequently, measurements of surface charge were taken five times in each pH range of 1–11, and the results were averaged. The obtained results are plotted versus pH in Fig. S3.† The addition of curcumin-grafted biochar into the hydrogel matrix alters the zeta potential properties of the composite material, causing a decrease in electrokinetic potential measurements with increasing pH. The pHPZC obtained at the pH of 1.5. The zeta potential has been reported to exhibit negative values over the entire pH range higher than the PZC to 11. The carboxyl and hydroxyl groups of the applied biochar and the carboxylic acid of the PAA in the area of the slipping plane are the origins of the lowered zeta potential and negative surface charge.63 The second possible source of the zeta potential drop is the shift of the slipping plane driven by the presence of the PAA adsorption layer.64 The negative surface charge of the adsorbent in a wide range of pHs provides its potential interaction with positively charged organic and inorganic species. Considering diverse wastewater pH levels, it can be inferred that the fabricated adsorbent is applicable to a broad spectrum of water treatment operations.
3.8 Swelling and contact angle analysis
To examine the impact of biochar@curcumin addition on the hydrophilicity and swelling properties of the adsorbent, the contact angle and swelling analysis have been conducted (at 25 °C for 24 hours with a pH range of 3–10), and the results are provided in Fig. S4.† The tests have been conducted using the conventional method as described in our prior research.65 Swelling capacity (SC, %) determined using the following equation:| |
 | (3) |
Wdry and Wwet represent the mass of the sample in its dry and swelled states, respectively, measured in grams. According to the data from Fig. S4a,† the adsorbent exhibits diminished swelling capacity compared to the pure PAA hydrogel. It can be hypothesized that the decrease in the adsorbent's swelling can be linked to the hydrophobic characteristics of curcumin and graphitized biochar. In both cases, raising the pH of the medium leads to an increase in the SC% value, which reaches its maximum in alkaline environments. The abundance of free hydroxyl and carboxyl functional groups, along with the availability of non-bonded lone electron pairs on oxygen atoms with H-bond formation capability, can reasonably explain the observed change in SC% from acidic to basic regions. The contact angle analysis performed using the sessile drop method. As seen in Fig. S4b and c,† the contact angle of the adsorbent (88.36°) enhanced due to low surface binding energy compared to pure PAA (63.09°) indicating a decrease in hydrophilicity of the composite, which proves the swelling data.
3.9 The stability tests
The adsorbent underwent stability tests to assess potential leaching and dissociation in response to pH variations (3–10) over a period of 10 days at 25 °C for both composite and pure PAA hydrogel. To this aim 0.1 grams of the samples was weighed after being dried overnight and subsequently transferred to 20 mL of distilled water at various pH levels. The swollen samples were collected after 10 days and dried in an air oven overnight before being weighed. The following equation is employed to calculate the recovery rate (RR, %):| |
 | (4) |
Here, Wdf and Wd represent the weight in grams of the dried sample after and before treatment, respectively. Fig. S5† depicts the stability test with pH alteration. The RR% values changed by around 2.5% and 2.2% for the adsorbent and pure PAA, respectively, due to pH variations. This suggests that hydrogel has acceptable stability compared to pure PAA and a low dissociation level even in harsh acidic and basic conditions. The decrease in mass of the composite material in acidic and basic regions can be attributed to the degradation of curcumin, the release of short polymeric chains from the hydrogel structure, and hydrogen-bonded non-reacted monomers.
3.10 Rheological characterization
The rheological behaviour of hydrogel was studied using a rheometer at room temperature with parallel plate geometry. The strain sweep test was used to show storage modulus (G′) and loss modulus (G′′) over an increasing strain and gave insight into the linear viscoelastic region (LVR) for the hydrogel (Fig. S6a†). As indicated, the storage modulus gradually decreased with increasing the strain and after the strain threshold of 10%, the storage modulus fell below the loss modulus which shows the viscoelastic behaviour of the hydrogel. After studying the linear viscoelastic region by strain sweep test, a frequency sweep test below the critical strain was performed. The graph in Fig. S6b† shows that the storage modulus is significantly higher than the loss modulus. Absence of crossover frequency shows the permanent chemical crosslinking in the structure of the hydrogel.66,67
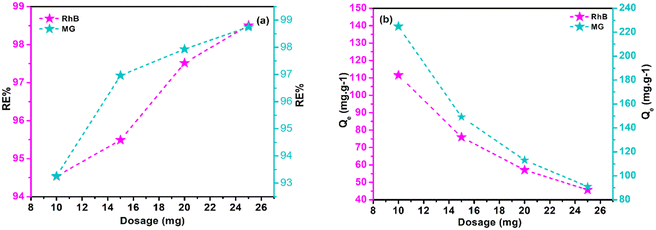
3.11 Impact of dose of adsorbent
Adsorbent dosage significantly impacts dynamic sites' abundance, Qe, and RE%. Research on polymeric composite dosages (10–25 mg), with a constant 10 mL of MG (200 mg L−1) and Rho (100 mg L−1) solution was conducted, examining the influence of adsorbent content at optimized pH, room temperature, and 180 minute intervals. RE% and Qe data are displayed in Fig. 5a and b. Results imply that Qe values for both adsorbates are reversely correlated with adsorbent doses, while RE% factors are raised. A starting dose of adsorbent (10 mg) results in 224.75 mg g−1 and 111.53 mg g−1 Qe values for MG and Rho, respectively. The increase in the adsorbent dosage resulted in an improvement in the RE% values for Rho and MG, respectively, from 94.53% and 93.26% (10 mg of adsorbent dose) to 98.50% and 98.75% (25 mg of adsorbent dose). The prevalence of vacant dynamic sites on the adsorbent explains these observations. Adsorbent dosage increases active sites accessibility. Due to restricted numbers of active site and lower adsorbent contents, contaminating molecules occupy a larger percentage of active sites, accelerating equilibrium. However, with high adsorbent concentrations, equilibrium takes longer to establish, and more adsorbate molecules are effectively adsorbed due to a lower possibility of vacant active sites fouling.
 |
| | Fig. 5 The graphs of RE% (a), and Qe (b) as a function of adsorbent dosage. | |
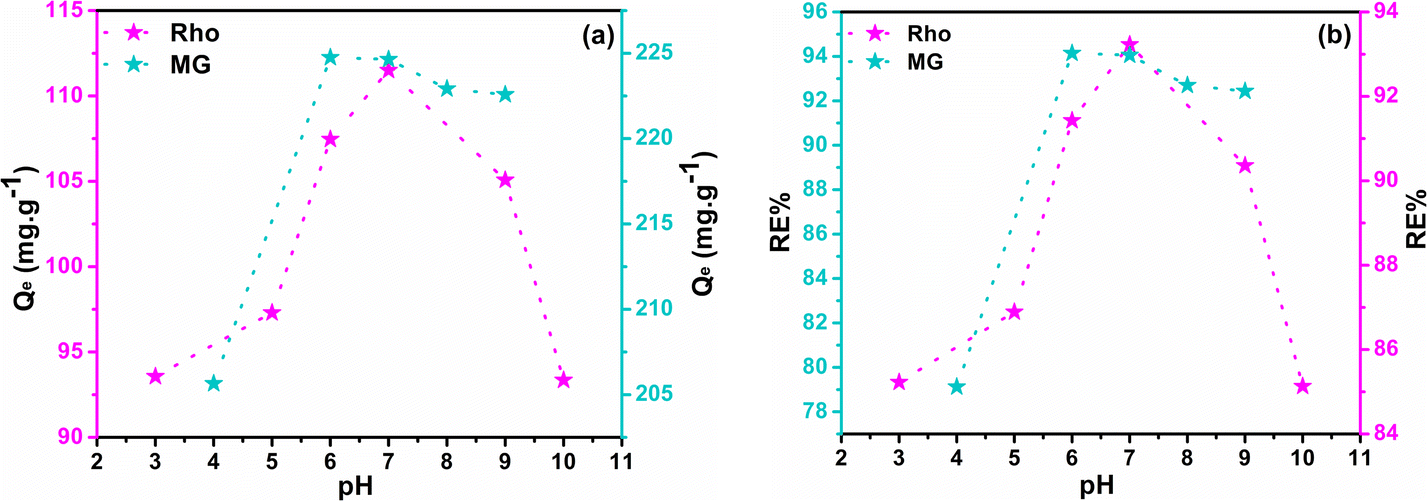
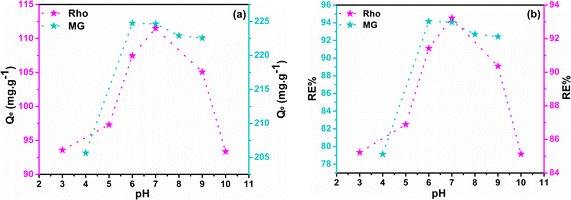
3.12 Effect of pH on adsorption performance
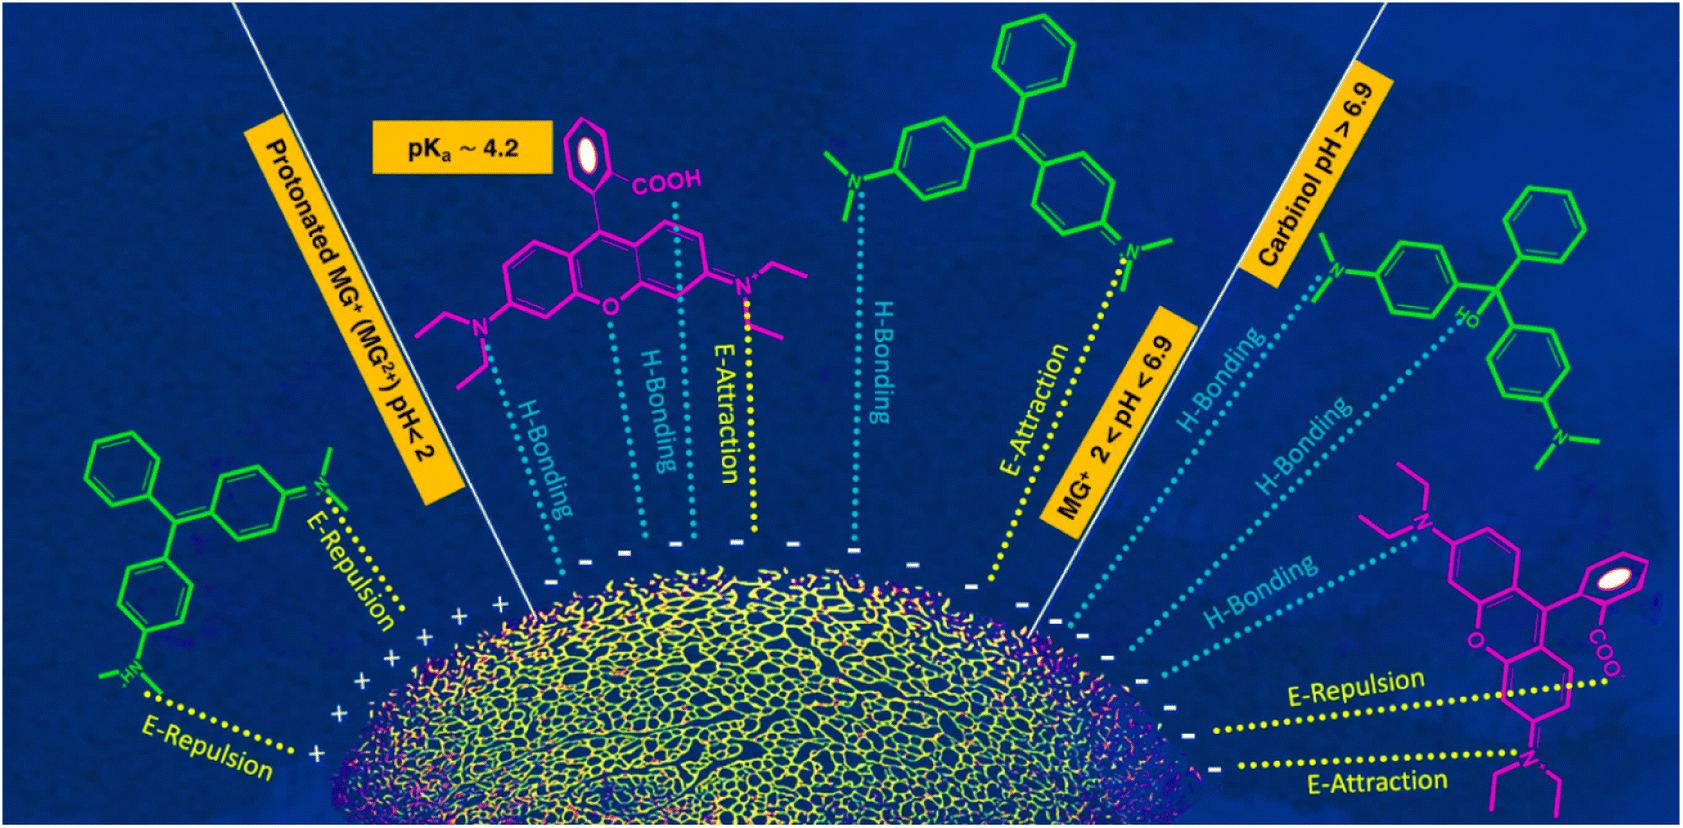
The process of adsorption exhibits a significant degree of sensitivity towards alterations in the pH of the feed solution. Under identical conditions, the Qe and RE% values were determined in solutions covered a pH range of 3 to 10. The ideal pH value is profoundly influenced by the structure of the dye molecules and the active functional groups on the adsorbent surface. Structures of curcumin-engineered biochar at different pH and the interactions between dye molecules and composite are depicted in Fig. S7† and 6 respectively. The values of Qe and RE% for two dyes at various pH are shown in Fig. 7a and b. As can be seen, the maximum adsorption of malachite (224.76) and rhodamine (111.50) was obtained at pH 6 and 7, correspondingly. As the pH rises from 3 to 7, the Qe values of Rho and MG increases impressively. The high concentration of H+ ions induce the protonation of the adsorbent functional groups; the formation of these positively charged centers leads to the repulsion of the cationic dye molecules.68 On the other hand, at elevated pH (greater than 8), the formation of hydrated Rho ions and dimer bulk structures (arising from the electrostatic interactions among the carboxyl and xanthene groups of the Rho molecules) impeded the infiltration of dye molecules into the adsorbent pores, resulting in lowered adsorption.69 Under strongly alkaline conditions, deprotonation of the –COOH group to –COO− (Fig. 6) results in a repulsive interaction between Rho and the adsorbent. Fig. 6 demonstrates that malachite molecules are only found in the cationic form (MG2+) at pH < 2. Whereas by increasing pH (2 < pH < 6.9), the presence of both positively charged nitrogen centers, as well as non-bonding electrons of nitrogen atoms, enables the formation of a compelling electrostatic attraction and a hydrogen bond. At pHs > 6.9, despite the greater possibility of hydrogen bonding, the exclusion of cationic nitrogen (lack of electrostatic interaction) reduces adsorption capacity (carbinol).70 Due to carboxyl group deprotonation on biochar surfaces and acrylic acid, the polymer composite adsorption rate rises with solution basicity. The lack of aromaticity in the acidic domain as well as the cationic nature of the curcumin molecule, causes repulsion with positive dye molecules which impedes effective interaction with MG2+ and Rho molecules resulting in a diminished adsorption capacity. Forms B and C may be regarded as active curcumin species during the adsorption process (Fig. S7†). With the deprotonation and subsequent activation of the enol and phenol groups in the curcumin structure, and the deprotonation of the carboxyl group in the Rho molecule, the negatively charged nature of these active species exerts an inhibitory force that leads to a downward in adsorption efficiency.71 Adsorption at a near-neutral pH is crucial for industrial water treatment to minimize secondary pollution and maintain neutral wastewater characteristics post-purification.
 |
| | Fig. 6 Acid–base equilibria of MG and Rho at different pH and efficient interactions.72 | |
 |
| | Fig. 7 The plots of Qe (a) and RE% (b) as a function of pH. | |
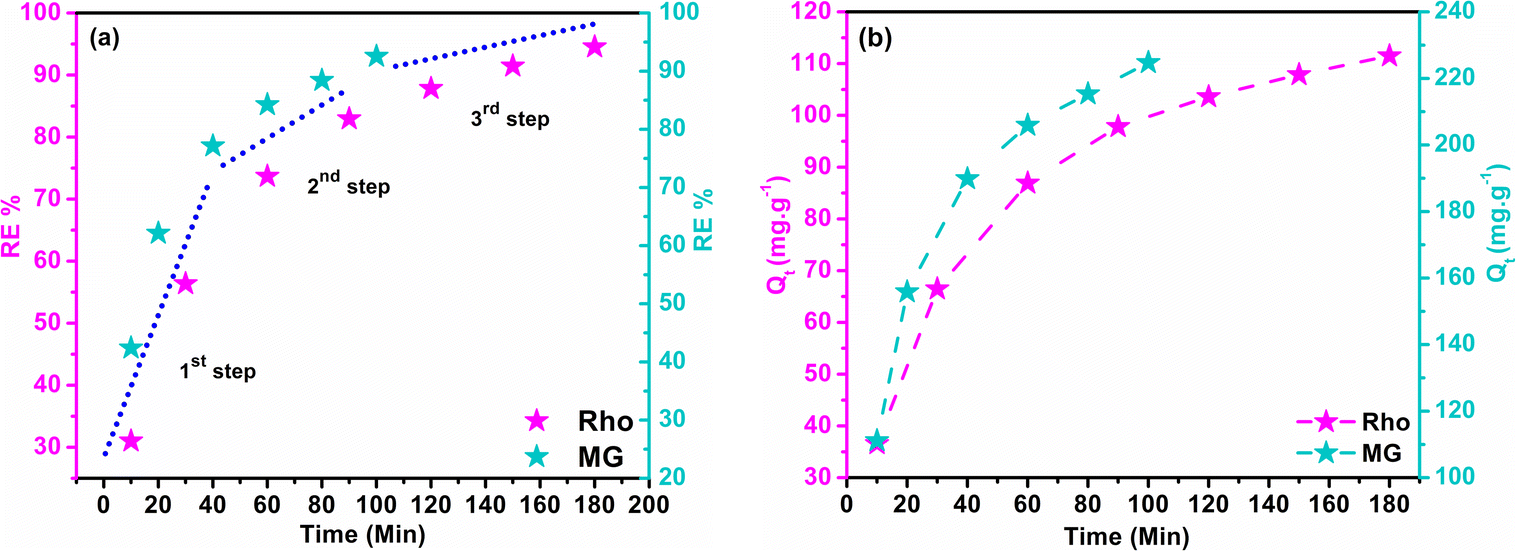
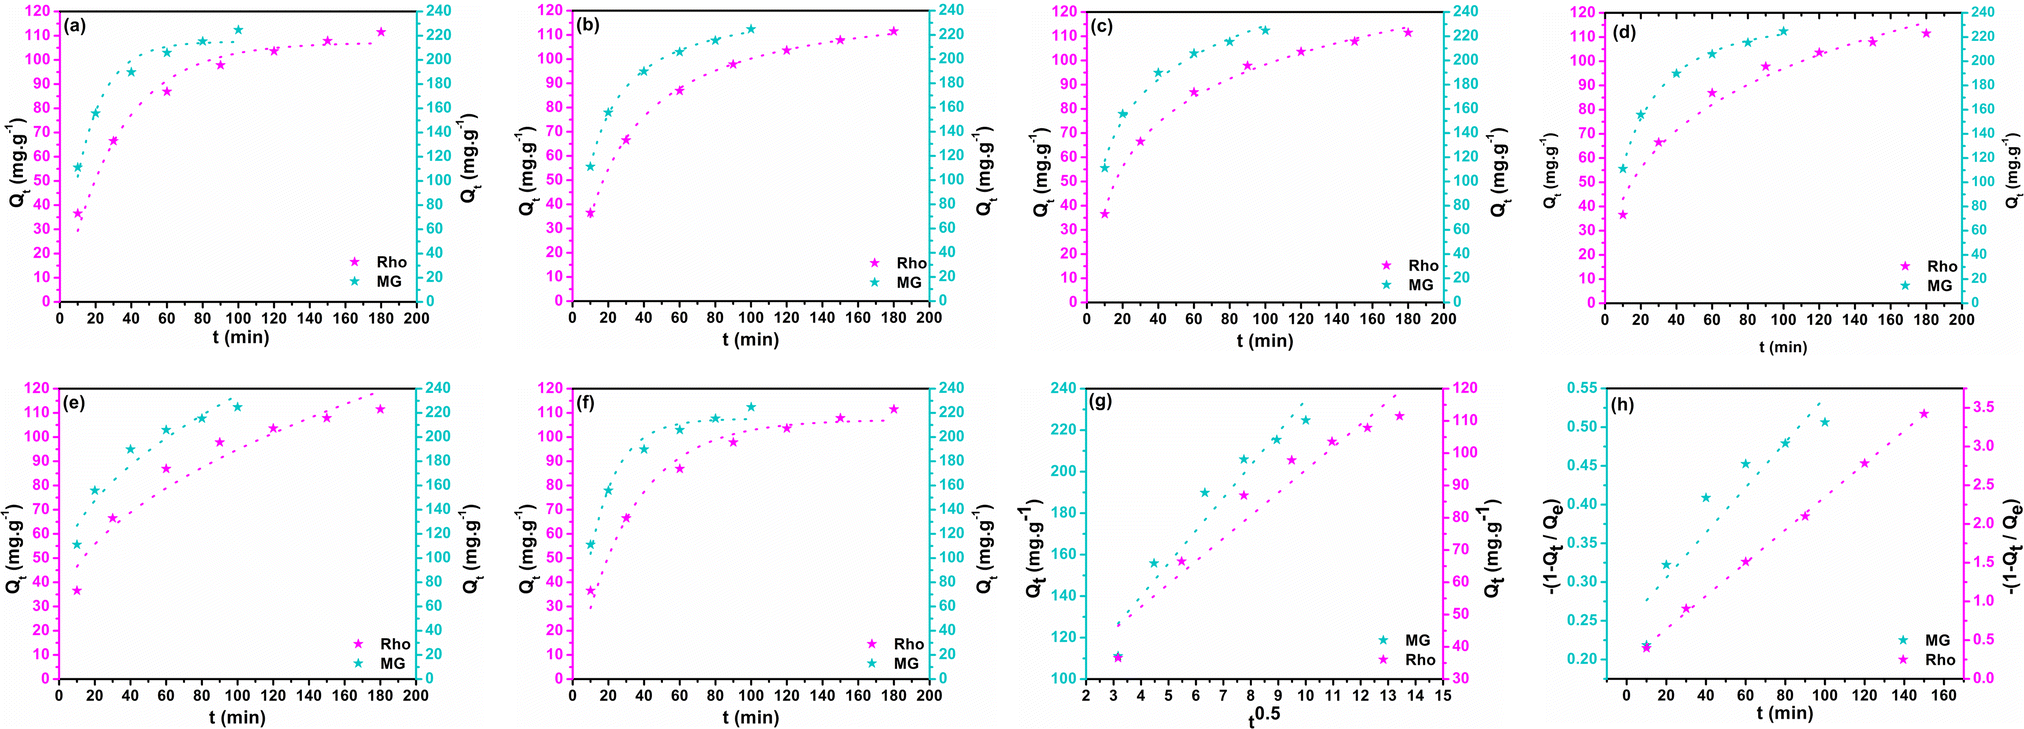
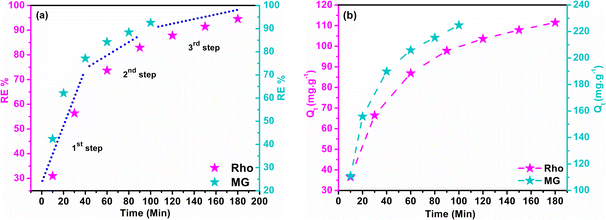
3.13 Time dependency of adsorption
Adsorption and degradation-based water treatment techniques necessitate precise intervals for efficiency and resource conservation, prompting numerous experiments to ascertain the minimum achievable time. The batch experiment involved 10 mg of adsorbent with a 100 ppm Rho solution at a neutral pH level for 10 to 180 minutes and a 200 ppm MG solution at a pH of 6 for 100 minutes. The eqn (5) was applied to calculate the adsorption capacity (Qt) at time t.| |
 | (5) |
Here, Ci (mg L−1) and Ct (mg L−1) depict the initial and concentration at any time t. The solution's volume, and the mass of the adsorbent, are represented by V (L), and m (g) accordingly. The effects of contact time on RE% and Qt in dye removal are illustrated in Fig. 8a and b. It is evident that, the adsorbent attained saturation after rapidly absorbing MG for an initial period of up to 100 minutes, at which the RE% and the Qt peaked at 93.02% and 224.75 mg g−1 respectively. After 180 minutes, the quantities of Qt (111.50 mg g−1) and RE% (94.53%) have been achieved for Rho, which can be credited to structural difference and the emergence of multiple types of interaction. The adsorption and availability of the adsorption sites at the solid–liquid interface could be elucidated by considering the following processes:
 |
| | Fig. 8 The plot of RE% (a) and Qt (b) as a function of time. | |
- Bulk diffusion: the adsorbate species are migrating from the bulk of the solution to the liquid layer encircling the solid adsorbent in this phase.73
- External diffusion: when the solute diffuses across the surface liquid film that covers the solid adsorbent.74
- Internal diffusion: the propagation of adsorbate species from the liquid film to the solid adsorbent's surface.75
This phenomenon takes place through two mechanisms: molecule diffusion into pores and surface, influenced by adsorbent morphology, and interaction with active sites via physisorption or chemisorption. It has been established that the slowest step controls the overall rate of any adsorption process. The three main stages of any adsorption process can be extracted from the slope of the RE% vs. t graph (Fig. 8a): the initial stage of dye absorption occurs when dye molecules penetrate into the liquid layer encompassing the absorbent (external diffusion). The diffusion of dye molecules into the absorbent's internal pores (internal diffusion) and physical attachment, indicated by a lower slope of the diagram in the second stage, and in the third stage, the successful establishment of the chemical interaction with the absorbent and attainment of the maximum Qt and RE% values, with a pseudo-linear slope.76
3.14 Comparative kinetic study
Non-linear Langergren pseudo-first-order (PFO), Elovich (El), Bangham, and pseudo-second-order (PSO) kinetic models, as well as intraparticle (IPD) and liquid film diffusion (LFD) models, are employed to investigate the dynamics of the adsorption and rate-limiting mechanisms of Rho and MG adsorption into the hydrogel adsorbent. For an intricate system, the cumulative effect of two or more steps may occasionally dictate the total rate. To achieve this objective, Qt values were fitted into the selected models.
According to the literature, the non-linear fitting is more precise than the linear approach for adjusting kinetic and isotherm data considering its fewer statistical errors accumulation. Non-linear equations and their parameters' descriptions are provided in Table S1.† The estimated kinetic fitting results and the non-linear regression correlation coefficient (R2) are summarized in Table 1. Fig. 9 displays fitted graphs of employed models. The correlation coefficient is employed to assess the accuracy and reliability of models.77 The PFO model governs adsorption through interface diffusion by assuming that the solute uptake rate correlates to the difference between the saturation concentration and the solid adsorption at any time t.78 The sorption process is inconsistent with the PFO kinetic model in the entire adsorption time ranges, as evidenced by the R2 values (0.962 for MG and 0.969 for Rho) compared to alternative models, highlighting the PFO model's imitations in the exegesis of the sorption mechanism (Fig. 9a). Typically, it is often applicable at the first stage of the adsorption process. Extrapolation of experimental data from the initial stage of sorption employing the PFO model yielded a good correlation coefficient (R2 of Rho = 0.980 and MG = 0.985), proving the model's applicability in the preliminary phases.79 Although, estimated Qt values (Rho = 107 and MG = 215 mg g−1) approximately coincide with empirical values. The PSO kinetic model implies that chemisorption constitutes the rate-limiting phase and predicts behavior across a broad sorption spectrum. The stronger correlation coefficient of the PSO model (R2 = 0.998) highlights the best-fitting outcomes, convincing the effective implementation of the PSO model in data analysis (Fig. 9b). From the study's result, it could be established that the chemisorption mechanism governs the rate-limiting step across the entire sorption range, and the adsorption rate is determined by adsorption capacity rather than adsorbate concentration. The Elovich kinetic model is frequently applied to interpret adsorption kinetics and effectively reflects the PSO dynamics on an energetically heterogeneous surface. The R2 values of the Elovich model (R2 of Rho = 0.995 and MG = 0.983) are greater than those of PFO (Table 1, Fig. 9c) and even comparable with that of the PSO, confirming the monolayer chemisorption of the dye molecules on the adsorbent's solid surface. Another noteworthy model is the Bangham equation which is constructed on the theory that pore diffusion is the only rate-controlling step during adsorption. The elevated R2 values obtained from the fitting of the Bangham model (R2 of Rho = 0.999 and MG = 0.995) reveal that the diffusion of MG and Rho molecules into adsorbent pores is the most acceptable phenomenon in the rate-determining step (Fig. 9d). Furthermore, estimated Qe values (Rho = 116 and MG = 231 mg g−1) showed 2.9% and 0.93% deviation from the empirical results for GM and Rho, respectively. The Weber–Morris model was employed to elucidate the IPD mechanism as a pivotal step of adsorption. Given the lowest coefficient correlation reported in the kinetic analysis (R2 of Rho = 0.921 and MG = 0.913), IPD may not be the dominant governing component (Fig. 9e). The observed lack of convergence between the linear-line portion of the graph and its origin indicates that the mechanism for Rho and MG elimination by biochar@curcumin/PAA hydrogel is multifaceted, involving both surface adsorption and IPD. The kinetic data were fitted with the IPD linear model to validate the hypotheses as mentioned earlier (Fig. 9g). But fitting line does not cross the origin confirming, the model's incapacity to fit the data. The LFD model asserts that the rate-determining phase is governed by adsorbate species transiting through a liquid layer surrounding the solid adsorbent. In preliminary moderately low sorbate concentrations, the tendencies in the accuracy of the fit demonstrate the dominance of the LFD model. The kinetic results were fitted with linear and non-linear forms of the model to assess the potential participation of LFD in the rate-determining phase of Rho and MG adsorption by biochar@curcumin/PAA. The R2 values obtained from the non-linear (R2 = 0.962) and linear (R2 = 0.871) equations, along with the absence of lines with zero intercept in the linear model, suggest that the LFD model is not consistent with the empirical data for MG dye (Fig. 9f). Although the non-linear LFD model failed to achieve a high R2 value (0.962) in Fig. 9f, the linear LFD model exhibited an exceptionally high R2 value (0.999) with almost zero intercept (Fig. 9h). These findings suggest that, in contrast to MG adsorption, the LFD mechanism is the main determinants influencing the Rho adsorption rate. According to the finding as mentioned earlier, and relying on the correlation-coefficient values (PSO = 0.998 > El = 0.983 > PFO = 0.962) the pseudo-second-order kinetic model is the most precise mechanism among the other kinetic models for the adsorption of MG onto biochar@curcumin/PAA in an aqueous system, demonstrating chemisorption on a heterogeneous surface. The El model kinetic results corroborate the chemisorption mechanism of the PSO kinetic model, which indicates that the solid interfaces are exceedingly heterogeneous from the energy point of view. Compared to the two other non-linear diffusion models (Bangham = 0.995 > NL-LFD = 0.962 > NL-IPD = 0.913), the Bangham model is the most acceptable mechanism for the rate-limiting step of the MG adsorption process, which emphasizes dye molecule diffusion into the solid absorbent's pores. Similar to MG, the correlation coefficients for Rho adsorption show the following reducing order (PSO = 0.998 > El = 0.995 > PFO = 969), indicating the dominance of the PSO model and chemical adsorption of Rho molecules on the non-uniform adsorbent surface. In contrast with MG, the LFD model, which emphasizes diffusion into the liquid layer surrounding the absorbent and pore diffusion (Bangham model), are the main rate-limiting mechanisms in Rho adsorption from an aqueous solution (L-LFD = 0.999 ≈ NL-Bangham = 0.999 > L-IPD = 0.934).
Table 1 Predicted kinetic models variables for the adsorption of MG and Rho onto adsorbent
| Model |
Parameter |
Unit |
MG |
Rho |
| NL-PFO |
Qcal |
(mg g−1) |
215.129 |
107.197 |
| k1 |
(min−1) |
0.065 |
0.032 |
| R2 |
|
0.962 |
0.969 |
| NL-PSO |
Qcal |
(mg g−1) |
250.129 |
126.778 |
| k2 |
(g mg−1 min−1) |
3.217 × 10⁻⁴ |
2.977 × 10⁻⁴ |
| R2 |
|
0.998 |
0.998 |
| NL-IPD |
kid |
(mg g−1 min−0.5) |
15.783 |
7.069 |
| I |
(mg g−1) |
76.874 |
24.139 |
| R2 |
|
0.913 |
0.921 |
| L-IPD |
kid |
(mg g−1 min−0.5) |
15.784 |
7.069 |
| I |
(mg g−1) |
76.875 |
24.140 |
| R2 |
|
0.930 |
0.934 |
| NL-Elovich |
αEl |
(mg g−1 min−1) |
54.211 |
11.056 |
| βEl |
(g mg−1) |
0.020 |
0.038 |
| R2 |
|
0.983 |
0.995 |
| NL-LFD |
q∞ |
(mg g−1) |
215.129 |
107.197 |
| R |
(min−1) |
0.065 |
0.032 |
| R2 |
|
0.962 |
0.969 |
| L-LFD |
K |
(min−1) |
0.002 |
0.0213 |
| R2 |
|
0.871 |
0.999 |
| NL-Bangham |
qm |
(mg g−1) |
231.459 |
116.727 |
| kb |
|
0.139 |
0.073 |
| n |
|
0.682 |
0.712 |
| R2 |
|
0.995 |
0.999 |
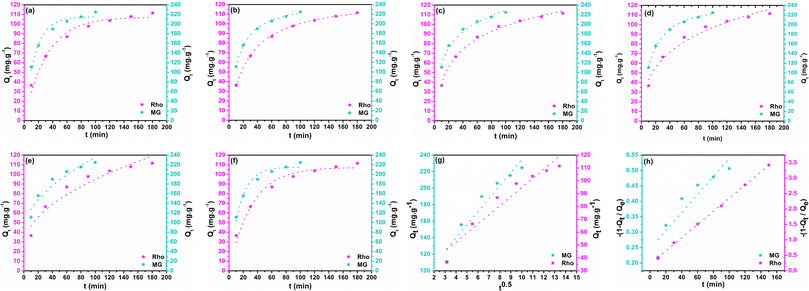 |
| | Fig. 9 PFO (a), PSO (b), Elovich (c), Bangham (d), IPD (e), LFD (f) non-linear kinetic models and IPD (g), and LFD (h) linear kinetic models fitting plots. | |
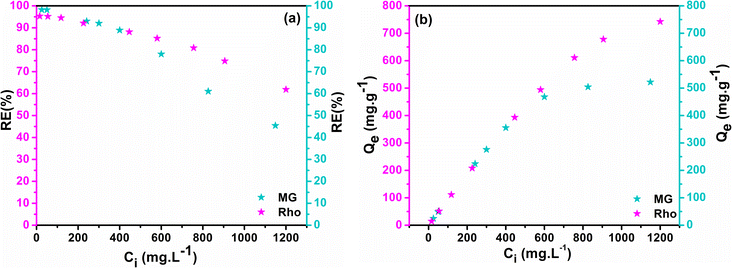
3.15 Impact of concentration on adsorption efficiency
The efficiency of the adsorption process could be constrained by the concentration of the contaminant's solution. By manipulating the initial concentration of dyes from 10 to 1200 ppm with a constant adsorbent dose (1 g L−1), the force behind the mass transfer mechanism among the bulk solution and the adsorbent was monitored at optimal pH and intervals for each dye (pH = 6 and 100 min for MG and pH = 7 and 180 min for Rho). The alteration in RE% and Qe as a function of Ci were plotted in Fig. 10a and b, which implies that the removal efficiency of both dyes declines with an increment in the initial concentration of the solution. According to Fig. 10a, the highest RE% (Rho = 95.32%, MG = 98.22%) values were obtained at the lowest concentrations (Ci < 25 ppm), demonstrating a reverse association between dye concentrations (Ci) and adsorption efficiency (RE%). A substantial number of available active sites explain these observations. The RE% drops by up to 80% when the concentration has been raised to 400 ppm however, there is still been a sizable percentage of dye molecule removal. The efficacy of adsorption significantly diminishes with subsequent increases in the starting concentration of the adsorbent, ultimately reaching its minimal value (Rho = 61.87%, MG = 45.42%) at the maximum concentration of the adsorbate (Ci ≈ 1200 ppm). The Qe vs. Ci graph shows that Qe values ascend steeply at lower concentrations, but with the relative saturation of the adsorbent at high concentrations and E-repulsion between adsorbate molecules and adsorbed species on the active sites, the graph tends to a quasi-linear state and the range of alters decreases.80
 |
| | Fig. 10 Impact of starting dye concentration on RE% (a), Qe (b). | |
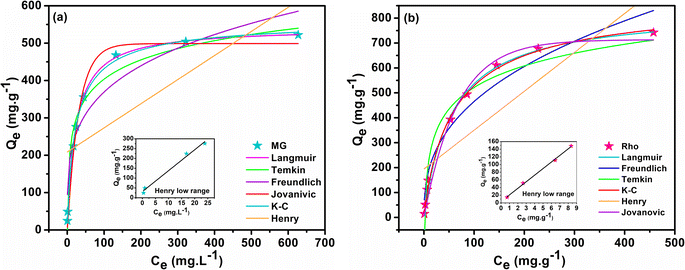
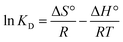
3.16 Comparative isothermal study
Adsorption isotherm models reveal the distribution of adsorbate species in solid and liquid phases, providing insight into the Rho and MG molecule adsorption mechanisms by biochar@curcumin/PAA. To this aim, the empirical equilibrium data of MG and Rho adsorption into biochar@curcumin/PAA were fitted employing six isotherms on their non-linear equations, namely, Henry, Langmuir, Freundlich, Temkin, Jovanovic, and Koble–Corrigan (K–C) (Table S1†). Fig. 11 and Table 2 display the fitting outcomes of the isothermal evaluation and the estimated parameters, respectively. The most fundamental model, recognized as Henry's adsorption isotherm, asserts that the quantity of adsorbed material is proportional to the relative concentration of the adsorbate. Henry's model's extremely poor correlation coefficient implies the incoherency of the model with the MG (R2 = 0.464) and Rho (R2 = 0.664) adsorption (Fig. 11a and b). However, fitting the data obtained from the lower concentrations with the Henrys model provided profoundly high R2 values (MG = 0.999 and Rho = 0.999), depicting the strong validity of the model in accurately representing the behavior of the dye at lower concentrations. The Langmuir theory asserts that adsorbate species kinetically adsorb onto the solid surface of the adsorbent by continuous penetration of molecules, corresponding desorption from the active surface, and zero surface aggregation. This empirical theory implies monolayer adsorption and that the adsorption process occurs at equivalent and identically specific localized active sites regardless of neighboring sites and steric hindrance or lateral interaction among the adsorbed species.42 The high correlation coefficient (R2 = 0.995 and 0.998 for MG and Rho, respectively) and satisfactory agreement between the calculated and empirical values of Qe (541.98 and 834.69 mg g−1 for MG and Rho, respectively) confirm the Langmuir model's accuracy and the adsorption of dye molecules on a uniform surface with approximately even enthalpy and activation energy. The values of the separation factor lay down in the range of 0 < RL < 1, providing the adsorption process's favorability (Table 2). For multi-layered adsorption with an uneven distribution of adsorption energy and attractions over the heterogeneous surface, the Freundlich isotherm model is frequently employed for organic compounds or highly interacting species on solid adsorbents. This model's high kF values (116.171 and 80.603 (mg g−1) (L mg)1/n for MG and Rho) and large R2 values (0.905 and 0.945 for MG and Rho, respectively) propose that the multilayer adsorption mechanism on a heterogeneous surface cooperates in the removal process (Fig. 11). The intensity of adsorption of the Freundlich model (1/n value), is 0.251 and 0.380 for MG and Rho, respectively, indicating the potential of the manufactured adsorbent toward whole range of concentrations. In the medium concentration, the Temkin isotherm explicitly accounts for indirect adsorbent–adsorbate interactions and assumes that the heat of adsorption for every molecule in the adsorption layer decreases linearly with coverage.
 |
| | Fig. 11 Non-linear fitting graphs for MG (a) and Rho (b). | |
Table 2 Isotherms estimated parameters
| Model |
Parameter |
Unit |
MG |
Rho |
| Henry |
kHE |
|
0.645 |
1.560 |
| R2 |
|
0.464 |
0.664 |
| Langmuir |
Qmax,cal |
mg g−1 |
541.982 |
834.697 |
| kL |
L mg−1 |
0.0436 |
0.018 |
| RL |
|
0.019 |
0.044 |
| R2 |
|
0.995 |
0.998 |
| Freundlich |
kF |
(mg g−1) (L mg)1/n |
116.171 |
80.603 |
| 1/n |
|
0.251 |
0.380 |
| R2 |
|
0.905 |
0.945 |
| Temkin |
BT |
kJ mol−1 |
74.303 |
125.032 |
| AT |
L mg−1 |
2.290 |
0.974 |
| R2 |
|
0.970 |
0.937 |
| Jovanovic |
Qmax |
mg g−1 |
498.868 |
713.329 |
| kJ |
L g−1 |
0.0321 |
0.015 |
| R2 |
|
0.984 |
0.988 |
| K–C |
AKC |
Ln mg1−n g−1 |
37.553 |
21.044 |
| BKC |
(L mg−1)n |
0.066 |
0.023 |
| nKC |
|
0.846 |
0.899 |
| R2 |
|
0.996 |
0.998 |
The application of Temkin's model resulted in a R2 of 0.970, indicating a satisfactory correlation between the chemisorption system and the adsorption of MG across the whole concentration range. However, the R2 value of Rho (0.937) does not demonstrate an adequate correlation with the empirical data (Fig. 11). Additionally, the dye molecules' endothermic adsorption on the hydrogel can be witnessed by the positive values of the Temkin constant BT (74.303 and 125.032 kJ mol−1).81 Similar to the Langmuir model, the Jovanovic adsorption isotherm applies to homogeneous surfaces and monolayer adsorption; however, the Jovanovic equation exhibits a slower approach to saturation. Additionally, the Jovanovic isotherm model incorporates the potential of mechanical interactions among the adsorbed and bulk phases into account.82 The R2 of 0.984 and 0.988 acquired from the non-linear fitting plot (Fig. 11) are lower than those obtained from the Langmuir model. However, the predicted Qe values (498.86 and 713.329 mg g−1 for MG and Rho respectively) are remarkably comparable to the empirical findings, indicating the feasibility of mechanical interactions in the adsorption process. The K–C isotherm employs a combination of the Freundlich and the Langmuir models for interpreting the equilibrium adsorption mechanism.83 Deployment of the K–C model generated R2 values of 0.996 for MG and 0.998 for Rho, respectively, indicating its practicality in data analysis. The value of K–C constant for MG (0.846) and Rho (0.899) highlights similar behavior of adsorbent toward various dyes structure. Almost the unit value of nKC suggested that the equilibrium isotherm model was approximated to the Freundlich equation and that the model was suited to evaluating the empirical outcomes.
3.17 Binary batch experiment
A binary adsorption experiment was conducted to examine the selective adsorption of dyes. The experiment involved the use of a 10 mL solution containing a mixture of Rho and MG dyes at a concentration of 100 mg L−1, along with 10 mg of adsorbent under different pH conditions and at ambient temperature, with a time interval of 180 minutes. The UV-Vis spectra of the initial solution and the solution after the experiment are presented in Fig. S8.† Results indicate that both dyes' adsorption improved with pH, reached its maximum capacity, and then declined. Fig. S8† illustrates that the adsorbent retains MG more effectively compared to Rho at all pH levels. The contrasting behaviour could be attributed to structural variations and effective interactions between the adsorbent and dye molecules. Fig. S8† illustrates that the adsorbent retains MG more effectively compared to Rho at all pH levels. The contrasting behaviour could be attributed to structural variations and effective interactions between the adsorbent and dye molecules. The ability to selectively remove particular dyes could be advantageous in wastewater purification processes.
3.18 Thermodynamic evaluation
The thermodynamic aspects of sorption are essential for evaluating the equilibrium state between liquid mixtures (adsorbate) and heterogeneous (solid) sorbent materials. The kinetic energy of the solute is directly proportional to the temperature of the solution. Increasing the temperature can result in a simultaneous increase in the molecular diffusion rate. Therefore, temperature significantly influences the equilibrium state of the adsorption process, resulting in substantial alterations in the thermodynamic parameters. In order to evaluate the spontaneity of an adsorption process, it is necessary to determine the thermodynamic parameters. The thermodynamic parameters often used to assess the feasibility of adsorption under temperature-dependent conditions are the changes in Gibb's free energy (ΔG°), entropy (ΔS°), and enthalpy (ΔH°). The aforementioned parameters were evaluated using the following equations, and the corresponding results are presented in Table 3.| |
 | (6) |
| | |
ΔG° = −RTlnKD
| (7) |
Table 3 Thermodynamic parameters
| Ci (mg L−1) |
ΔG° (kJ mol−1) |
ΔH° (kJ mol−1) |
ΔS° (J mol−1 K−1) |
| 298 K |
303 K |
308 K |
313 K |
| 100 MG |
−2.807 |
−3.061 |
−3.341 |
−3.552 |
43.888 |
173.152 |
| 100 Rho |
−6.481 |
−7.140 |
−7.626 |
−8.054 |
24.565 |
104.389 |
In this context, R is the universal gas constant, T reflects the temperature in Kelvin, and KD represents the dimensionless equilibrium constant for a phase transfer process. The linear regression plot of KD vs. 1/T was utilized to determine the values of ΔH° and ΔS° based on the slope and intercepts (Fig. S9a†). The negative ΔG° values at all temperatures indicate that the adsorption process is thermodynamically favorable and occurs spontaneously (Fig. S9b†). The positive ΔH° results suggest that the adsorption of CV and MG dye into the F-biochar is an endothermic process. This implies that greater temperatures are favorable for the adsorption. The confirmation of the random distribution of dye molecules on the surface of F-biochar was achieved by the observation of positive ΔS° values, which indicate an advantageous enhancement in the stability of the system. The study emphasizes that the adsorption mechanism tends to become increasingly chaotic.
3.19 Potential interactions
The analysis of the adsorption mechanism provides evidence that the process involved in the adsorption of the dyes by the biochar@curcumin/PAA composite hydrogel could be classified into four main stages: LFD, IPD, pore diffusion, surface penetration. The three aforementioned diffusion models control the adsorption rate and the establishment of dynamic equilibrium. Electrostatic-interaction, π–π stacking, hydrogen bonding and charge assisted H-bonding are the main adsorption driving factors involved in the removal of MG and Rho by biochar@curcumin/PAA. The electrostatic interaction between dye molecules with opposite charges and negatively charged biochar, grafted curcumin, and PAA carboxyl groups could potentially be developed. The π–π interaction could be explained by formation of the π attraction between the aromatic rings of dyes, curcumin molecules and biochar and he conjugated curcumin structure. Furthermore, hydrogen bonding develops between the carboxyl, enol, and hydroxyl groups of the adsorbent and the nitrogen and oxygen heteroatoms present in the MG and Rho structures. Adsorption phenomena are briefly illustrated in Fig. S10.†
3.20 Reusability of adsorbent
The continuous applicability of any adsorbent is one of its primary features, which minimizes the generation of secondary pollutants and avoids the renewal requirement after any cycle. Desorption and adsorption experiments were consequently conducted to investigate the biochar@curcumin/PAA's potential for practical applications. Due to the sorbent's ease of separation, the adsorbent was repeatedly refined using water/ethanol solution after every cycle and vacuum-dried at the appropriate temperature for 24 h. Fig. S11† exhibits the reusability data over seven cycles. The RE% values for MG and Rho reduced from 98.16% to 96.107% and from 94.53% to 92.05%, accordingly, over the second cycle, indicating a 97.90% and 97.37% total recovery. During seven cycles, the RE% maintained at 80.11% and 72.42% for MG and Rho, respectively. The downward trend in RE% readings after seven cycles of operation might be attributed to the non-reversible saturation of the active sites absorbing dye molecules. The substantial quantity of hydroxyl, and carboxyl groups, as well as aromatic rings in the biochar@curcumin/PAA sorbent improves its capability to absorb MG, and Rho molecules. Furthermore, the findings indicate that active sites during the recovery phase efficiently desorbs the pollutants, enabling the adsorbent to be utilized in successive cycles. The adsorbent described in the study has demonstrated exceptional stability and recyclability in neutral conditions without the need for acid treatment or the production of secondary products. These findings revealed that the as-described adsorbent offers advantages for prospective further research applications.
3.21 Real industrial sample analysis
The industrial wastewater along with residual dyes from the textile industry contains a variety of pollutants, including mineral salts, organic compounds, acid, base, and buffer compounds, which are used to increase the absorption capability of the dye by the fibres. The efficacy of any adsorbent can be hindered by the presence of competing ions, organic molecules, and the acidic or alkaline properties of the medium. In order to evaluate the possible applicability of the adsorbent in industrial wastewater processing, a batch experiment was conducted using real industrial wastewater received from a textile company in Gujarat, India. The tests were assessed using 10 mg of adsorbent in 20 mL of solution for 3 h at different pH (3–11). According to Fig. S12,† the highest removal was achieved at pH 3. Both the acidic and basic conditions are favourable for adsorption, with the lowest removal observed in the neutral condition. The high removal effectiveness observed in both acidic and basic conditions indicates that the solution includes cationic and anionic dyes that exhibit distinct interactions and may be removed by altering the pH. In summary, adsorption efficacy can be significantly impacted by the presence of additional contaminants in wastewater.
3.22 Economical and practical perspective
While considering an adsorbent for practical use, its simplicity of preparation and cost are important aspects that greatly influence the final decision. The typical price range for a kilogram of commercially accessible powder or granular adsorbent based on polyacrylic acid (PAA) varies between 2 and 4 dollars. The wholesale cost for the production of the adsorbent, which involves acrylic acid monomers, biochar, and turmeric, on the local Indian market varies between 2.5 to 3.5 dollars per kilogram with very high performance in dye removal. The material in consideration has the potential to be regarded as an effective adsorbent due to its affordable price compared to other frequently employed acrylate-based materials.
3.23 Comparison with other work
The removal of MG and Rho molecules from water-based media has been accomplished previously by employing an assortment of manufactured and natural adsorbents. The adsorption capacity (Qe) of the biochar@curcumin/PAA thus needs to be compared against the other reported research to acquire a more precise conclusion. Table S2† compares the Qmax for MG and Rho adsorption in the current work and that observed in previous literature, demonstrating the preferable performance of synthesized adsorbent over a wide range of adsorbents. Concerning its relatively high adsorption efficiency, the biochar@curcumin/poly AA adsorbent could be perceived as a conceivably advantageous option for the removal of MG and Rho from water-based media in the treatment of wastewater.
4 Conclusions
The current work focuses on developing a PAA-based composite hydrogel adsorbent using biochar@curcumin modifying agent via a straightforward in situ polymerization method. For the objective of validating the successful development of biochar@curcumin/PAA hydrogel and the physiochemical properties of the adsorbent, multiple characterization approaches, such as FTIR, EDX elemental analysis, XRD, Zeta potential test, SEM, and TGA, were employed. The biochar@curcumin/PAA adsorbent achieved satisfactory adsorption performance with a qmax of 521 mg g−1 and 742 mg g−1 toward MG and Rho at nearly neutral pH within 100 and 180 min, respectively, which is higher than many previous studies. This research not only introduced a seminatural adsorbent originating from readily available materials for the development of a cost-effective and highly stable adsorbent with a long lifespan, but also the employed six different non-linear isotherms and six kinetic models to fit the equilibrium findings and the in-depth analysis of the adsorption mechanism. The chemical adsorption of Rho/MG onto non-uniform surfaces of the adsorbent is corroborated by the kinetic modeling, which shows a substantial propensity to fit in the PSO (R2 = 0.998) and Elovich (R2 = 0.995, 0.983) kinetic models. Based on the R2 values of diffusion models, it can be established that the diffusion mechanism plays a crucial role in the adsorption process. The Bangham pore diffusion model (R2 = 0.995) elucidates the plausible rate-determining step for MG dye, while for Rho dye, both the pore diffusion and the LFD diffusion models (R2 = 0.999) are the credible rate-controlling phases in the adsorption mechanism. Based on the robust fitting outcome of the non-linear Freundlich, K–C, and Langmuir equations (R2 = 0.998), it can be inferred that, in contrast to MG, the adsorption process of Rho encompasses both monolayer and multilayer adsorption. The Jovanovic isotherm model's high R2 value of 0.988 indicates that mechanical contact has a similar function in Rho adsorption. Overall, the results of the modeling analysis indicate that, for Rho/MG, the primary mechanism of sorption onto the developed adsorbent is chemical adsorption on homogeneous surfaces, which is coupled with the physical interaction on multilayer heterogeneous surfaces as a secondary mechanism for Rho dye. The binary adsorption test reveals that the adsorbent is more selective toward MG than Rho B. Adsorption mechanisms including H-bonding, charge-assisted H-bonding, π–π, and Lewis's acid–base interactions are responsible for MG/Rho elimination, as revealed by in-depth, comprehensive analysis and previous searches. The hydrogel composite demonstrates the capacity to maintain its structure and retain 80% of its efficiency following seven cycles. This study introduces a semi-natural composite adsorbent for the efficient removal of cationic dyes (MG/Rho) from aqueous systems with remarkable adsorption capacity and renderability, making it a promising candidate for further investigation and environmental preservation efforts.
Author contributions
EM: methodology, investigation, data analysis, visualization, writing – original draft, review & editing, RIP: writing—review & editing, AB: conceptualization, methodology, writing – review & editing, funding acquisition, supervision. BBB: preparation of crude biochar. MO: data analysis, writting – review & editing.
Conflicts of interest
There are no conflicts to declare.
Acknowledgements
We would like to acknowledge the infrastructural and experimental facilities at Dr K. C. Patel Research and Development Centre, P D Patel Institute of Applied Sciences, CHARUSAT. AB respectfully acknowledges the CHARUSAT Seed Research Grant (CHARUSAT SEED RESEARCH GRANT/KCP/AB) and research funding provided by Council of Scientific and Industrial Research (CSIR), India, (Project No. 01(3013)/21/EMR-II). EM expresses gratitude for receiving a CHARUSAT PhD Scholars' Fellowship (CPSF). We are thankfully acknowledging Dr Kinnari Parekh for providing the instrumental facilities. Charotar University of Science and Technology, CHARUSAT Seed Research Grant (CHARUSAT SEED RESEARCH GRANT/KCP/AB), Council of Scientific and Industrial Research (CSIR), India, 01(3013)/21/EMR-II.
References
- UNICEF, UNICEF guidance note, Programmatic Approaches to Water Scarcity, 2021 Search PubMed.
- WHO, Progress on household drinking water, sanitation and hygiene 2000–2020: five years into the SDG, Geneva, Switzerland, 2021 Search PubMed.
- Y. R. Fischer, I. V. de Melo, L. C. S. Silva and V. A. Wanderley, Cleaner Production in a Steel Industry, Modern Environmental Science and Engineering, 2016, 1, 341–347 CrossRef.
- W. Liu, F. Huang, Y. Liao, J. Zhang, G. Ren, Z. Zhuang, J. Zhen, Z. Lin and C. Wang, Treatment of CrVI-containing Mg(OH)2 nanowaste, Angew. Chem., 2008, 120, 5701–5704 CrossRef.
- A. Hamid, S. R. Ahmad, F. Ali, M. S. Iqbal and R. Nazir, Treatment of pesticides (chlorpyrifos and tebuconazole) and Congo red dye by the application of green synthesized palladium nanoparticles using hemicellulose obtained from Lallemantia royleana seed, Environ. Dev. Sustain., 2022, 1–21 Search PubMed.
- S. Mor, M. K. Chhavi, K. K. Sushil and K. Ravindra, Assessment of hydrothermally modified fly ash for the treatment of methylene blue dye in the textile industry wastewater, Environ. Dev. Sustain., 2018, 20, 625–639 CrossRef.
- H. Zeng, L. Wang, D. Zhang, P. Yan, J. Nie, V. K. Sharma and C. Wang, Highly efficient and selective removal of mercury ions using hyperbranched polyethylenimine functionalized carboxymethyl chitosan composite adsorbent, Chem. Eng. J., 2019, 358, 253–263 CrossRef CAS.
- Z. Jahani, E. Mosaffa, M. Oroujzadeh and H. Ghafuri, Performance evaluation of polyethersulfone membranes modified with poly(acrylic acid-co-N-vinyl pyrrolidone) grafted mesoporous carbon nitride for effective removal of cadmium(II) from wastewater, Polym. Adv. Technol., 2023, 34, 1–15 CrossRef.
- K. L. Wasewar, S. Singh and S. K. Kansal, Process intensification of treatment of inorganic water pollutants, Elsevier, 2020 Search PubMed.
- Y. Wong, Y. Szeto, W. Cheung and G. McKay, Equilibrium studies for acid dye adsorption onto chitosan, Langmuir, 2003, 19, 7888–7894 CrossRef CAS.
- M. Tohidinia, N. Sabbaghi, S. Shaybani and M. Noroozifar, Simultaneous determination of dopamine, acetaminophen and xanthine by modified carbon ceramic micro-electrode with nanosized LaFe0.2Ni0.8O3 perovskite, Anal. Bioanal. Electrochem., 2018, 10, 1525–1537 CAS.
- M. Ptaszkowska-Koniarz, J. Goscianska and R. Pietrzak, Removal of rhodamine B from water by modified carbon xerogels, Colloids Surf., A, 2018, 543, 109–117 CrossRef CAS.
- Y. Zheng, Y. Liu, X. Guo, Z. Chen, W. Zhang, Y. Wang, X. Tang, Y. Zhang and Y. Zhao, Sulfur-doped g-C3N4/rGO porous nanosheets for highly efficient photocatalytic degradation of refractory contaminants, J. Mater. Sci. Technol., 2020, 41, 117–126 CrossRef CAS.
- S. Kumar, B. Verma, A. Gupta, R. Kumar, A. Bharti, A. Kumar and V. Kumar, New Insights into Cu/Cu2O/CuO Nanocomposite Heterojunction Facilitating Photocatalytic Generation of Green Fuel and Detoxification of Organic Pollutants, J. Phys. Chem. C, 2023, 127, 7095–7106 CrossRef CAS.
- D. Kornbrust and T. Barfknecht, Testing of 24 food, drug, cosmetic, and fabric dyes in the in vitro and the in vivo/in vitro rat hepatocyte primary culture/DNA repair assays, Environ. Mutagen., 1985, 7, 101–120 CrossRef CAS PubMed.
- S. K. Das, P. Ghosh, I. Ghosh and A. K. Guha, Adsorption of rhodamine B on Rhizopus oryzae: role of functional groups and cell wall components, Colloids Surf., B, 2008, 65, 30–34 CrossRef CAS PubMed.
- L. Wang, Y. Du, Q. Zhu, J. Song, K. Ou, G. Xie and Z. Yu, Regulating the Alkyl Chain Length of Quaternary Ammonium Salt to Enhance the Inkjet Printing Performance on Cationic Cotton Fabric with Reactive Dye Ink, ACS Appl. Mater. Interfaces, 2023, 15, 19750–19760 CrossRef CAS PubMed.
- J. Bujdák, T. m. S. i. Baranyaiová, P. Bohac and R. Mészáros, Adsorption of Dye Molecules and Its Potential for the Development of Photoactive Hybrid Materials Based on Layered Silicates, J. Phys. Chem. B, 2023, 127, 1063–1073 CrossRef PubMed.
- E. Mosaffa, H. Ghafuri and H. R. Esmaili Zand, Improvement on physical properties of polyethersulfone membranes modified by poly(1-vinylpyrrolidone) grafted magnetic Fe3O4@SiO2 nanoparticles, Appl. Organomet. Chem., 2019, 33, e4639 CrossRef.
- R. M. Shinde, P. U. Ingle, H. R. Trivedi, D. Wasule, A. Gaharwar, A. K. Gade, M. Rai, S. Manna, P. K. Srivastava and J. K. Biswas, Bioremediation of industrial dye waste effluents aided by GIS applications: a comprehensive review, Environ. Dev. Sustain., 2023, 1–27 Search PubMed.
- R. Keyikoglu and O. T. Can, The role of dye molecular weight on the decolorization performance of the electrocoagulation, Environ. Dev. Sustain., 2021, 23, 3917–3928 CrossRef.
- Y. Zhao, Y. Dong, X. Chen, Z. Wang, Z. Cui and S.-Q. Ni, Using sulfide as nitrite oxidizing bacteria inhibitor for the successful coupling of partial nitrification-anammox and sulfur autotrophic denitrification in one reactor, Chem. Eng. J., 2023, 475, 146286 CrossRef CAS.
- H. Bulut, O. Eskikaya, P. Belibagli, Z. Işik, H. Arslan and N. Dizge, Reuse of waste welding powder in Fenton-like process for RO16 dye removal and Cr(VI) reduction, Environ. Dev. Sustain., 2023, 1–21 Search PubMed.
- F. R. Oliveira, A. K. Patel, D. P. Jaisi, S. Adhikari, H. Lu and S. K. Khanal, Environmental application of biochar: current status and perspectives, Bioresour. Technol., 2017, 246, 110–122 CrossRef CAS PubMed.
- H. A. Ahmad, S. Ahmad, L. Gao, S. Ismail, Z. Wang, A. El-Baz and S.-Q. Ni, Multi-omics analysis revealed the selective enrichment of partial denitrifying bacteria for the stable coupling of partial-denitrification and anammox process under the influence of low strength magnetic field, Water Res., 2023, 245, 120619 CrossRef CAS PubMed.
- G. Li, K. K. Ho and Y. Y. Zuo, Relative dye adsorption method for determining the hydrophobicity of nanoparticles, J. Phys. Chem. C, 2021, 126, 832–837 CrossRef.
- Z. Li, Y. Chen, Z. Wang, Y. Zhao, Q. Xia, J. Qiu, H. Wang and J. Wang, Ionic liquid hybrid metal–organic frameworks for efficient adsorption and selective separation of ammonia at high temperature, Chem. Eng. J., 2023, 464, 142728 CrossRef CAS.
- H. Li, S. Si, K. Yang, Z. Mao, Y. Sun, X. Cao, H. Yu, J. Zhang, C. Ding and H. Liang, Hexafluoroisopropanol based silk fibroin coatings on AZ31 biometals with enhanced adhesion, corrosion resistance and biocompatibility, Prog. Org. Coat., 2023, 184, 107881 CrossRef CAS.
- M. Sadeghi Afjeh, G. Bagheri Marandi and M. J. Zohuriaan-Mehr, Nitrate removal from aqueous solutions by adsorption onto hydrogel-rice husk biochar composite, Water Environ. Res., 2020, 92, 934–947 CrossRef CAS PubMed.
- Y. Dong, H. Yuan, D. Ge and N. Zhu, A novel conditioning approach for amelioration of sludge dewaterability using activated carbon strengthening electrochemical oxidation and realized mechanism, Water Res., 2022, 220, 118704 CrossRef CAS PubMed.
- X. Shan, L. Yang, Y. Zhao, H. Yang, Z. Xiao, Q. An and S. Zhai, Biochar/Mg-Al spinel carboxymethyl cellulose-La hydrogels with cationic polymeric layers for selective phosphate capture, J. Colloid Interface Sci., 2022, 606, 736–747 CrossRef CAS PubMed.
- P. Doondani, V. Gomase, D. Saravanan and R. M. Jugade, Chitosan coated cotton-straw-biochar as an admirable adsorbent for reactive red dye, Results Eng., 2022, 15, 100515 CrossRef CAS.
- Z. F. Akl, E. G. Zaki and S. M. ElSaeed, Green hydrogel-biochar composite for enhanced adsorption of uranium, ACS Omega, 2021, 6, 34193–34205 CrossRef CAS PubMed.
- H. Yakişik and U. Özveren, Synthesis of polyaniline/biochar composite material and modeling with nonlinear model for removal of copper(II) heavy metal ions, J. Turk. Chem. Soc., Sect. A, 2021, 8, 289–302 CrossRef.
- R. A. Teixeira, E. C. Lima, A. D. Benetti, P. S. Thue, D. R. Lima, F. Sher, G. S. Dos Reis, N. Rabiee, M. K. Seliem and M. Abatal, Composite of methyl polysiloxane and avocado biochar as adsorbent for removal of ciprofloxacin from waters, Environ. Sci. Pollut. Res., 2022, 29, 74823–74840 CrossRef CAS PubMed.
- K. Premarathna, A. U. Rajapaksha, B. Sarkar, E. E. Kwon, A. Bhatnagar, Y. S. Ok and M. Vithanage, Biochar-based engineered composites for sorptive decontamination of water: a review, Chem. Eng. J., 2019, 372, 536–550 CrossRef CAS.
- P. M. Godwin, Y. Pan, H. Xiao and M. T. Afzal, Progress in preparation and application of modified biochar for improving heavy metal ion removal from wastewater, J. Bioresour. Bioprod., 2019, 4, 31–42 CrossRef.
- B. Sajjadi, J. W. Broome, W. Y. Chen, D. L. Mattern, N. O. Egiebor, N. Hammer and C. L. Smith, Urea functionalization of ultrasound-treated biochar: a feasible strategy for enhancing heavy metal adsorption capacity, Ultrason. Sonochem., 2019, 51, 20–30 CrossRef CAS PubMed.
- M. Faheem, J. Du, J. Bao, M. A. Hassan, S. Irshad and M. A. Talib, Multi-functional biochar novel surface chemistry for efficient capture of anionic Congo red dye: behavior and mechanism, Arabian J. Sci. Eng., 2019, 44, 10127–10139 CrossRef.
- L. Zhao, W. Zheng, O. Mašek, X. Chen, B. Gu, B. K. Sharma and X. Cao, Roles of phosphoric acid in biochar formation: synchronously improving carbon retention and sorption capacity, J. Environ. Qual., 2017, 46, 393–401 CrossRef CAS PubMed.
- G. Moradi, S. Zinadini, L. Rajabi and A. A. Derakhshan, Removal of heavy metal ions using a new high performance nanofiltration membrane modified with curcumin boehmite nanoparticles, Chem. Eng. J., 2020, 390, 124546 CrossRef CAS.
- E. Mosaffa, R. I. Patel, A. M. Purohit, B. Basak and A. Banerjee, Efficient Decontamination of Cationic Dyes from Synthetic Textile Wastewater Using Poly(acrylic acid) Composite Containing Amino Functionalized Biochar: A Mechanism Kinetic and Isotherm Study, J. Polym. Environ., 2022, 1–18, DOI:10.1007/s10924-022-02744-3.
- A. Niehoff, A. Mantion, R. McAloney, A. Huber, J. Falkenhagen, C. M. Goh, A. F. Thünemann, M. A. Winnik and H. Menzel, Elucidation of the structure of poly(γ-benzyl-l-glutamate) nanofibers and gel networks in a helicogenic solvent, Colloid Polym. Sci., 2013, 291, 1353–1363 CrossRef CAS PubMed.
- R. Shapira, S. Katalan, R. Edrei and Y. Eichen, Chirality dependent inverse-melting and re-entrant gelation in α-cyclodextrin/1-phenylethylamine mixtures, RSC Adv., 2020, 10, 39195–39203 RSC.
- E. Mosaffa, A. Banerjee and H. Ghafuri, Sustainable high-efficiency removal of cationic and anionic dyes using new super adsorbent biochar: performance, isotherm, kinetic and thermodynamic evaluation, Environ. Sci.: Water Res. Technol., 2023, 9, 2643–2663 RSC.
- Z. Yavari, S. Shaybani, J. Saffari, K. Kerman and M. Noroozifar, Stoichiometry influence of oxide support on the catalytic efficiency of nano-palladium towards CH3OH electrooxidation, Chem. Pap., 2021, 75, 2317–2329 CrossRef CAS.
- M. Lawrinenko and D. A. Laird, Anion exchange capacity of biochar, Green Chem., 2015, 17, 4628–4636 RSC.
- S. Y. Oh, D. I. Yoo, Y. Shin, H. C. Kim, H. Y. Kim, Y. S. Chung, W. H. Park and J. H. Youk, Crystalline structure analysis of cellulose treated with sodium hydroxide and carbon dioxide by means of X-ray diffraction and FTIR spectroscopy, Carbohydr. Res., 2005, 340, 2376–2391 CrossRef CAS PubMed.
- J. F. De Conto, M. R. Oliveira, M. M. Oliveira, T. G. Brandão, K. V. Campos, C. C. Santana and S. M. Egues, One-pot synthesis and modification of silica nanoparticles with 3-chloropropyl-trimethoxysilane assisted by microwave irradiation, Chem. Eng. Commun., 2018, 205, 533–537 CrossRef CAS.
- Y. M. Song, J. P. Xu, L. Ding, Q. Hou, J. W. Liu and Z. L. Zhu, Syntheses, characterization and biological activities of rare earth metal complexes with curcumin and 1,10-phenanthroline-5,6-dione, J. Inorg. Biochem., 2009, 103, 396–400 CrossRef CAS PubMed.
- Z. Song, Y. Wu, H. Wang and H. Han, Synergistic antibacterial effects of curcumin modified silver nanoparticles through ROS-mediated pathways, Mater. Sci. Eng., C, 2019, 99, 255–263 CrossRef CAS PubMed.
- E. Ismail, D. Sabry, H. Mahdy and M. Khalil, Synthesis and Characterization of some Ternary Metal Complexes of Curcumin with 1,10-phenanthroline and their Anticancer Applications, J. Sci. Res., 2014, 6, 509–519 CrossRef.
- D.-J. K. Hee-Je Kim, S. N. Karthick, K. V. Hemalath, C. J. Raj, S. Ok and Y. Choe, Curcumin Dye Extracted from Curcuma longa L. Used as Sensitizers for Efficient Dye-Sensitized Solar Cells, Int. J. Electrochem. Sci., 2013, 8, 8320–8328 CrossRef.
- T. Jin, Q. Yang, C. Meng, J. Xu, H. Liu, J. Hu and H. Ling, Promoting desulfurization capacity and separation efficiency simultaneously by the novel magnetic Fe3O4@PAA@MOF-199, RSC Adv., 2014, 4, 41902–41909 RSC.
- B. B. Basak and S. Ajoy, Recycling of isabgol (Plantago ovata Forsk.) straw biomass and mineral powder with bio-inoculants as an effective soil amendment for isabgol cultivation, Pedosphere, 2022, 32, 686–697 CrossRef CAS.
- M. T. Nakhjiri, G. B. Marandi and M. Kurdtabar, Poly(AA-co-VPA) hydrogel cross-linked with N-maleyl chitosan as dye adsorbent: isotherms, kinetics and thermodynamic investigation, Int. J. Biol. Macromol., 2018, 117, 152–166 CrossRef CAS PubMed.
- A. Pourjavadi, P. E. Jahromi, F. Seidi and H. Salimi, Synthesis and swelling behavior of acrylated starch-g-poly(acrylic acid) and acrylated starch-g-poly(acrylamide) hydrogels, Carbohydr. Polym., 2010, 79, 933–940 CrossRef CAS.
- V. Kabanov, V. Dubnitskaya and S. Khar'kov, Thermal properties of polyacrylic acid, Polym. Sci., 1975, 17, 1848–1855 Search PubMed.
- S. K. Swain and K. Prusty, Biomedical applications of acrylic-based nanohydrogels, J. Mater. Sci., 2018, 53, 2303–2325 CrossRef CAS.
- Y. Liu, X. Zhao, J. Li, D. Ma and R. Han, Characterization of bio-char from pyrolysis of wheat straw and its evaluation on methylene blue adsorption, Desalin. Water Treat., 2012, 46, 115–123 CrossRef CAS.
- S. Sen, R. Parveen, M. Paul, N. N. Ghosh, J. Im and G. Biswas, Self-gelation techniques for amoxicillin: formulation and characterization, Appl. Surf. Sci. Adv., 2023, 18, 100466 CrossRef.
- J. Zheng, R. Fan, H. Wu, H. Yao, Y. Yan, J. Liu, L. Ran, Z. Sun, L. Yi and L. Dang, Directed self-assembly of herbal small molecules into sustained release hydrogels for treating neural inflammation, Nat. Commun., 2019, 10, 1604 CrossRef CAS PubMed.
- M. Alomari, A. Almahasheer, B. R. Jermy, A. A. Al-Dossary, H. Bahmdan, V. Ravinayagam, D. Ababneh, M. Tarhini and A. Elaissari, Impact of Poly(Styrene-Acrylic Acid) Latex Nanoparticles on Colorectal and Cervical Cancer Cells, Polymers, 2021, 13, 2025 CrossRef CAS PubMed.
- M. Wiśniewska, A. Nosal-Wiercińska, I. Ostolska, D. Sternik, P. Nowicki, R. Pietrzak, A. Bazan-Wozniak and O. Goncharuk, Nanostructure of poly(acrylic acid) adsorption layer on the surface of activated carbon obtained from residue after supercritical extraction of hops, Nanoscale Res. Lett., 2017, 12, 1–9 CrossRef PubMed.
- M. A. Nikouei, E. Mosaffa and M. Amiri, The selection of polyethersulfone/polyvinylpyrrolidone films for industrial application using the multiple-criteria decision-making approach, Polym. Compos., 2021, 42, 6106–6115 CrossRef CAS.
- M.-E. Karga, M.-E. Kargaki, H. Iatrou and C. Tsitsilianis, pH-Responsive, Thermo-Resistant Poly(Acrylic Acid)-g-Poly(boc-L-Lysine) Hydrogel with Shear-Induced Injectability, Gels, 2022, 8, 817 CrossRef CAS PubMed.
- M. Vera, C. Mella, D. Palacio, S. Surabhi, B. Boury, K. Bouchmella, J. R. Jeong and B. F. Urbano, Influence of TiO2 nanofiller geometry on the rheological and optical properties of poly(acrylic acid)-based nanocomposite hydrogels, J. Appl. Polym. Sci., 2024, 141, e54986 CrossRef CAS.
- V. da Silva Lacerda, J. B. López-Sotelo, A. Correa-Guimarães, S. Hernández-Navarro, M. Sánchez-Báscones, L. M. Navas-Gracia, P. Martín-Ramos and J. Martín-Gil, Rhodamine B removal with activated carbons obtained from lignocellulosic waste, J. Environ. Manage., 2015, 155, 67–76 CrossRef PubMed.
- T. Santhi, A. L. Prasad and S. Manonmani, A comparative study of microwave and chemically treated Acacia nilotica leaf as an eco friendly adsorbent for the removal of rhodamine B dye from aqueous solution, Arabian J. Chem., 2014, 7, 494–503 CrossRef CAS.
- S. J. Culp and F. A. Beland, Malachite green: a toxicological review, J. Am. Coll. Toxicol., 1996, 15, 219–238 CrossRef.
- W.-H. Lee, C.-Y. Loo, M. Bebawy, F. Luk, R. S. Mason and R. Rohanizadeh, Curcumin and its derivatives: their application in neuropharmacology and neuroscience in the 21st century, Curr. Neuropharmacol., 2013, 11, 338–378 CrossRef CAS PubMed.
- M. C. Nguyen, I. Shoji and K. Noboru, Donnan electric potential dependence of intraparticle diffusion of malachite green in single cation exchange resin particles: a laser trapping-microspectroscopy study, Am. J. Anal. Chem., 2012, 3, 188–194 CrossRef.
- B. An, Cu(II) and As(V) adsorption kinetic characteristic of the multifunctional amino groups in chitosan, Processes, 2020, 8, 1194 CrossRef CAS.
- J. Aburabie, S. Mohammed, A. Kumaran and R. Hashaikeh, From waste to wealth: chelating polymeric membranes for precious palladium recovery from wastewater, J. Mater. Chem. A, 2023, 11, 22845–22858 RSC.
- H. Mashhadimoslem, F. Maleki and M. S. Khosrowshahi, in Polymeric Adsorbents, Elsevier, 2024, pp. 393–432 Search PubMed.
- T. R. Sahoo and B. Prelot, Adsorption processes for the removal of contaminants from wastewater: the perspective role of nanomaterials and nanotechnology, Elsevier, 2020 Search PubMed.
- D. Chen, Q. Wang, Y. Li, Y. Li, H. Zhou and Y. Fan, A general linear free energy relationship for predicting partition coefficients of neutral organic compounds, Chemosphere, 2020, 247, 125869 CrossRef CAS PubMed.
- T. Shahzadi, S. Sanaullah, T. Riaz, M. Zaib, A. Kanwal and H. Jabeen, Kinetics and thermodynamic studies of organic dyes removal on adsorbent developed from Viola tricolor extract and evaluation of their antioxidant activity, Environ. Dev. Sustain., 2021, 23, 17923–17941 CrossRef.
- G. M. Al-Senani and F. F. Al-Fawzan, Adsorption study of heavy metal ions from aqueous solution by nanoparticle of wild herbs, Egypt. J. Aquat. Res., 2018, 44, 187–194 CrossRef.
- M. Akhgari, E. Mosaffa, H. Dogari, N. A. Ramsheh, H. Ghafuri and A. Banerjee, A magnetic nano-sorbent incorporating antimicrobial papain for the rapid and efficient removal of levofloxacin and Pb(II) from aqueous systems, Environ. Sci.: Water Res. Technol., 2023, 9, 2112–2127 RSC.
- N. A. Ramsheh, H. Dogari, E. Mosaffa, M. Akhgari, H. Ghafuri and A. Banerjee, Metformin-Embedded Biocompatible Chitosan/Poly(vinyl alcohol) Beads with Superior Adsorption Properties toward Lead(II) and Levofloxacin, ACS Appl. Polym. Mater., 2023, 5, 3148–3160 CrossRef CAS.
- E. Mosaffa, D. Patel, N. A. Ramsheh, R. I. Patel, A. Banerjee and H. Ghafuri, Bacterial cellulose microfiber reinforced hollow chitosan beads decorated with cross-linked melamine plates for the removal of the Congo red, Int. J. Biol. Macromol., 2023, 127794 Search PubMed.
- R. A. Koble and T. E. Corrigan, Adsorption isotherms for pure hydrocarbons, Ind. Eng. Chem., 1952, 44, 383–387 CrossRef CAS.
|
| This journal is © The Royal Society of Chemistry 2024 |
Click here to see how this site uses Cookies. View our privacy policy here. 
 Open Access Article
 This Open Access Article is licensed under a Creative Commons Attribution-Non Commercial 3.0 Unported Licence
 *a,
Biraj. B. Basakc and
Maryam Oroujzadehd
*a,
Biraj. B. Basakc and
Maryam Oroujzadehd