
 Open Access Article
 This Open Access Article is licensed under a Creative Commons Attribution-Non Commercial 3.0 Unported Licence
Morphological and mechanical studies of Al2O3–Na2SiO3 as a skin barrier coated with TiO2 for carbon fiber reinforced composite materials†
Widyastuti *a,
Serly Hardiyantia,
Wafiq Syeach Muhaqqi Al Haqa,
Liyana Labiba Zulfab,
Ninik Safridaa,
Arif Nur Hakimc,
Lilis Marianic,
Herry Purnomoc,
Sulistijonoa and
Ruri Agung Wahyuonod
*a,
Serly Hardiyantia,
Wafiq Syeach Muhaqqi Al Haqa,
Liyana Labiba Zulfab,
Ninik Safridaa,
Arif Nur Hakimc,
Lilis Marianic,
Herry Purnomoc,
Sulistijonoa and
Ruri Agung Wahyuonod
aDepartment of Materials and Metallurgical Engineering, Faculty of Industrial Technology and Systems Engineering, Institut Teknologi Sepuluh Nopember, Jl. Arif Rahman Hakim, Kampus ITS Keputih-Sukolilo, Surabaya 60111, Indonesia. E-mail: wiwid@mat-eng.its.ac.id
bDepartment of Chemistry, Faculty of Science and Data Analytics, Institut Teknologi Sepuluh Nopember, Jl. Arif Rahman Hakim, Kampus ITS Keputih-Sukolilo, Surabaya 60111, Indonesia
cNational Research and Innovation Egency, Tangerang 15314, Indonesia
dDepartment of Engineering Physics, Faculty of Industrial Technology and Systems Engineering, Institut Teknologi Sepuluh Nopember, Jl. Arif Rahman Hakim, Kampus ITS Keputih-Sukolilo, Surabaya 60111, Indonesia
First published on 20th March 2024
Abstract
The utilization of adhesive compounds in bonding lightweight and high-performance composite structures, including carbon fiber reinforced polymer (CFRP) composites, has garnered significant attention from researchers. This study presents the novel application of Al2O3 coated with TiO2 as a thermal protective layer for CFRP substrate. Initially, the CFRP substrate underwent a protective treatment involving the application of Al2O3 as a middle coat, followed by a further protective layer consisting of TiO2 as a top coat. The deposition of TiO2 onto an Al2O3-based thermal barrier coating (TBC) was carried out utilizing the flame spray method. The use of a TiO2 coating as a top coat was employed to enhance protection and heat dispersion across the middle coat and substrate. In order to achieve sufficient adhesion between the CFRP substrate, an intermediate coat consisting of Al2O3 with a Na2SiO3 binder, the impact of varying nozzle distances on adhesion strength and pull-off test outcomes was investigated, with a nozzle distance of 180 mm yielding the highest adhesion strength. The thermal stability of a CFRP substrate was enhanced through the deposition of a layer of TiO2 on Al2O3. The surface and cross-sectional morphologies of the composite were analyzed using a Scanning Electron Microscope (SEM). It was observed that the presence of a TBC on the composite surface effectively reduced the amount of heat that was transferred to the composite material. In order to assess the effectiveness of TBC on CFRP substrates, a series of experiments involving thermal torch and conductivity tests were undertaken. The interaction between the top and middle coats of a composite material results in enhanced mechanical properties, hence improving its thermal insulation capabilities. The artificially produced TBC coatings have the potential to function as adhesive materials, ensuring the sustained high performance of CFRP substrates.
1 Introduction
CFRP is a composite consisting of matrix and reinforcement (carbon fiber) separated by three-dimensional interface regions with different characteristics.1 The unique features of CFRP include low thermal expansion, a high strength and stiffness-to-weight ratio, and good corrosion resistance, which have attracted the attention of many scientists in various fields that require high strength and lightness.2,3 CFRP's yearly demand is growing, especially in the field of aerospace and aircraft, where the need for lightweight materials is urgent. On the other hand, with the goal of the International Civil Aviation Organization (ICAO) to reduce aviation emissions by at least 50% by 2050, the development of composites with lightweight materials, namely CFRP, will continue to increase.4 In addition, half the weight of the Boeing 787 is made from CFRP to produce a vehicle with stronger, lighter, and more fuel-efficient characteristics.5 However, the presence of a polymer matrix in CFRP leads to the loss of its superiority through the decomposition of the organic matrix when exposed to high temperatures and friction, where epoxy and bismaleimide (BMI) have maximum operating temperatures of approximately 180 °C and 232 °C, respectively.6 Thus, thermal protection is needed to protect CFRP from high temperatures and pressures in order to maintain its advantages.Thermal barrier coating (TBC) is a thermal protection method often used by depositing a material onto the substrate you want to protect.7–9 The presence of TBC ensures effective protection of the substrate against oxidation and corrosion, inhibiting heat distribution and suppressing heat that touches a substrate.10,11 One of the essential criteria used in selecting TBC is its low thermal conductivity and high durability value resulting in good thermal insulation properties.12,13 YSZ, cordierite, Al2O3 and mullite are TBCs commonly used in industry.8,11,14,15 Compared to other candidate TBC, Al2O3 is more in demand by scientists as TBC due to its low thermal conductivity, high stability and corrosive and erosive resistance in hot environments.16,17 Ariharan and Balani revealed that using Al2O3 as TBC can improve surface tribological properties by providing TBC thickness.17 On the other hand, TBC preparations on a substrate require special treatment to produce TBCs that have good adhesion. TBC with good adhesion can fully protect the substrate when heat is applied, but TBC with poor adhesion can cause cracking and decomposition of the organic matrix on the substrate. Several types of binders have been reported that can increase the effectiveness of bonding in a material, including alcohol,18 silica sol19 and Na2SiO3.20 Na2SiO3 is a binder that has better adhesion properties than other binders, does not cause gelation with the powder, and can produce moderate suspension with powders compared to alcohol. On the other hand, Na+ ions in Na2SiO3 when exposed to high temperatures can react with the oxide layer on TBC to form secondary TBC.21 It is undeniable that oxidation is one of the obstacles to achieving optimal TBC performance.
Protecting the TBC through the coating process is the appropriate way to get desirable insulating characteristics in the material. The presence of a coating on the surface of TBC reduces cracking so that it can optimize the thermal insulation that occurs on CFRP substrates.22 In addition, the issue of oxidation in Al2O3 may impede the performance of Al2O3 as TBC. One potential strategy for preserving the efficiency and efficacy of Al2O3 performance as a TBC is to incorporate the design Al2O3 into an intermediate coat. By applying an additional coating material as a top coat, Al2O3 can be prevented from failing as a TBC. TiO2 is frequently employed as a top-coat coating for the purpose of safeguarding Al2O3.23 The use of TiO2 as top coating is based on its unique properties such as better resilience and austerity resistance compared to a monolithic coating.24 Toma et al. explains in his research that an increase in TiO2 results in an improvement in performance; for instance, a 44% addition of TiO2 generates the Al2TiO5 phase, which possesses excellent corrosion resistance.25 Therefore, the research of Al2O3 coating is meaningful for improving the interface state.
Wang et al. reported a new multifunctional TiO2 coating agent on TBC to produce composites with high thermal conductivity and stability using the solid-state method.26 On the other hand, the selection of the composite preparation method plays a role in determining the adhesiveness and thermal insulation of the composite. As reported by Golewski et al. in 2019, when the CFRP composite was treated with thermal spray, the surface around the coating area changed due to the impact of the heat generated by the tool.27 Moreover, one of the challenges of using thermal spray on TBC is the low homogeneity of the spraying to produce layers that have uniform characteristics due to the thermal shock layer experienced by tuberculosis.28 This low homogeneity can be avoided by adjusting the spray angle along the thermal spray, which can affect the thermal properties and adhesion between one layer and another, resulting in increased thermal resistance.29 High-velocity oxygen fuel (HVOF) is a thermal spray process in which feedstock material is sprayed after passing through the combustion chamber and flowing through a nozzle, with the raw material being liquid.30 The use of flame spraying has an advantage when compared to other thermal spraying methods, such as a more even distribution process due to particle spraying on the substrate at low speeds, where a low speed can produce high homogeneity, which can improve adhesion capacity.31 Therefore, in this study, we will develop a TiO2–Al2O3-CFRP composite using Na2SiO3 binder and nozzle spacing to obtain a composite with good thermal insulation properties. Variation of mass fraction of Al2O3 with binder Na2SiO3 and variation of nozzle spacing were studied to determine the correlation that occurs. The resulting composites were then characterized to analyze their structural and morphological properties. In addition, the thermal properties of each composite were assessed using a thermal torch and bonding steel test.
2 Materials and methodology
2.1 Materials
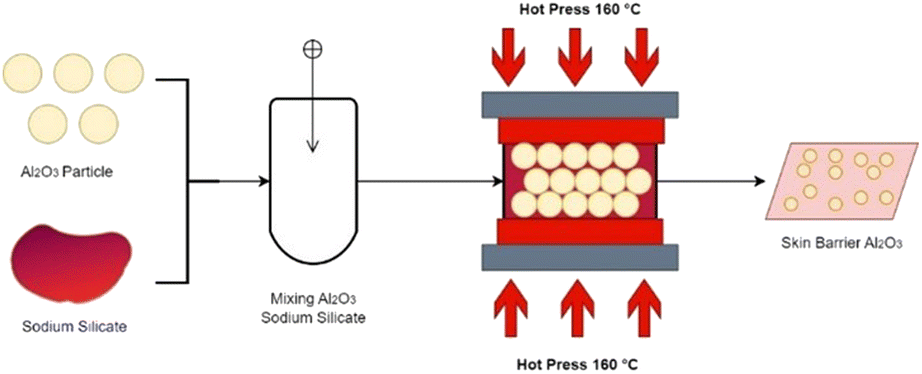
Aluminium oxide (Al2O3, Merck) with an average particle size of >0.063 mm or 63 μm of 72%, natrium silikat hidrat (Na2(SiO2)x·(H2O)x) (DILMASIL) was used as a mixture to bind the ceramic powder which is composed of sodium silicate (Na2O·nSiO2). Carbon fiber (HDC524-3K, Indonesia) were used as CFRP substrates. Titanium dioxide (TiO2, Merck) were was used as thermal spray powder feedstock. Epoxy LP1Q was applied as matrix in composite synthesis.2.2 Synthesis of materials
| Curing temperature (oC) | Mass fraction (Al2O3![[thin space (1/6-em)]](https://www.rsc.org/images/entities/char_2009.gif) :binder) :binder) |
Specimen code |
|---|---|---|
| 100 | 1:2.5 |
SB100/2.5 |
| 1:2.75 |
SB100/2.75 | |
| 1:3 |
SB100/3 | |
| 130 | 1:2.5 |
SB130/2.5 |
| 1:2.75 |
SB130/2.75 | |
| 1:3 |
SB130/3 | |
| 160 | 1:2.5 |
SB160/2.5 |
| 1:2.75 |
SB160/2.75 | |
| 1:3 |
SB160/3 |
 | ||
| Fig. 1 Schematic diagram of preparation skin barrier coating. | ||
The chemical equations of synthesis:
| 2Al2O3 + 3Na2O·nSiO2·mH2O + 3CO2 → 2Al(OH)3 + 3Na2CO3 + nSiO2 | (1) |
The mixture in the form of paste is then rolled to form a sheet-like shape and placed in an aluminium mould with a depth of 3 mm for the negative mould and 1.5 mm for the positive mould. Pressure at 4 MPa was used to compact the paste for over 1 hour of pressing time at several curing temperatures presented in Table 1. Polyimide tape, which is 50 mm in size and has a working temperature ranging from 250 to 300 °C, was coated on the mould to prevent the skin barrier from sticking and also ease the ejection process. This mould produced a specimen with 110 × 110 mm dimensions and 1.2–2 mm in thickness.
:1:0.5, respectively. The post-hot-pressed skin barrier was then placed on top of the fibre carbon before resin impregnation during the vacuum bagging process. Before the impregnation process, wax was applied to the vacuum bagging mould, followed by placing the skin barrier and fiber carbon, which had already been layered with resin by hand. The use of this wax is intended to facilitate the release and help to avoid the occurrence of adhesion between skin barrier composite specimens Al2O3-CFRP when the specimen is released. If there are still wax residues on the skin barrier composite sample Al2O3-CFRP, then the cleaning with alcohol is performed by way of swap (Fig. 2). Then the vacuum-bagged product was cured at room temperature for 24 hours. After performing the thermal conductivity test on the post-lamination process of the skin barrier, the composition with the lowest thermal conductivity was chosen to enter the flame spray process.
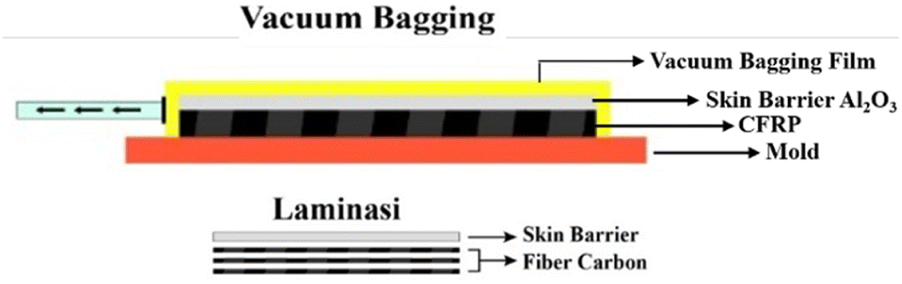 | ||
| Fig. 2 Vacuum bagging scheme. | ||
| Surface preparation | Flame spraying parameter | |||||
|---|---|---|---|---|---|---|
| Number of layers | Feed rate (g min−1) | Jet pressure (bar) | Working temp (oC) | Substrate temp (oC) | Nozzle distance (mm) | |
| Grade 80 grinder | 3 | 20 | 2 | 1000–1200 | 80–120 | 120 |
| 150 | ||||||
| 180 | ||||||
2.3 Characterization
Morphology and element distribution of the material synthesized were analyzed by Scanning Electron Microscopy-Energy Dispersive X-ray (SEM-EDX) images taken using Zeiss EVO MA10 (Zeiss, Germany). The thermal stability of material composites was determined by thermogravimetric analysis (TGA) using the PerkinElmer Pyris 1 Analyzer (Perkin Elmer, America) in the range of 30–900 °C with a heating rate of 10 °C min−1 under an air atmosphere (approximately ±10 mg of the as-synthesized samples). In order to determine the hydrophobicity properties, water contact angle (WCA) measurements were utilised in the testing process. The force required to pull a specified diameter of coating away from its substrate was studied using the Portable Adhesive Tester Type II based on the ASTM D4541 standard.The thermal properties of the torch were studied at the surface of the specimen. A thermocouple is placed in front of and behind the specimen to measure the temperature of the front and back of the specimen. First, the burner is turned on until it has reached the desired temperature. The specimen is then locked in the holder, and the specimen is tested for 120 s at a distance of 45 mm. Thermal conductivity was calculated using QTM-500 using the hot wire/probe method. Specimens cut to size 110 × 50 mm are heated to a temperature of 10 °C for 1 minute and then proceed to calculate the average conductivity of 10 test points. The next test is thermal torching, which aims to analyze the skin barrier morphology after exposure to a sudden high-temperature environment (Fig. 3). The burner used in the torch test is a commercial standard torch gun equipped with a combustion temperature control ring. This test used a butane gas combustion as the flame source, which reached up to 500 °C. Thermocouples were used as the temperature sensor, which was placed in front and back of the thermal torch specimen and clamped 45 mm away from the flame source. After reaching 500 °C, the process was held for 30 seconds then the final thermal torch specimen morphology was compared with the original specimen. The test is carried out at a temperature of 500 °C. It is used to validate the thermal conductivity value of the TiO2–Al2O3 TBC specimen by calculating and checking the heat decrease value during the torch test.
 | ||
| Fig. 3 Thermal torch scheme. | ||
2.4 Coating adhesion
Adhesion is a state where two surface bodies are joined up by an interface force, which becomes the main factor for a successful coating process. There are several methods for determining the bonding strength of the coating, and this paper used the pull-off method. This method involves a Portable Adhesive Tester Type II with the ASTM D4541 testing standard. The adhesive test by pull-off method uses a 20 mm in diameter dolly, which is then glued with epoxy adhesive (Araldite) on top of the specimen surface. After drying, the pull-off device was then applied to the dolly and connected with the pulling lever, followed by pressing the lever until the coating ripped off from the substrate. The pull-off test was performed using an MPa unit as its quantitative result and repeated three times to acquire the average value.2.5 Statistical analysis
Two way ANOVA with replication calculations using the SPSS application are performed to find out the impact of each variation and its repetition. Used an alpha value of 0.05 with a 95% confidence level.3 Results and discussion
3.1 Characterization of Al2O3–Na2SiO3 skin barrier
The cross-sectional morphology shows that the higher the hot-pressing temperature, the more pores are produced (Fig. 4), which originate from the evaporation of water in the binder. This is caused by the drying process of the binder via water evaporation that takes place at a temperature range of 90–220 °C, creating air bubbles that can migrate to the environment and thereby produce new pores.32 The presence of most pores in the 1:3 mass fraction results from the high use of binder. Increasing the amount of binder causes more water content, so the process of forming new pores increases as the amount of binder increases due to water evaporation.33
 | ||
| Fig. 4 CFRP skin barrier cross-section microstructure and composite (a) SB100/2.5 (b) SB 100/2.75 (c) SB100/3 (d) SB130/2.5 (e) SB130/2.75 (f) SB130/3 (g) SB160/2.5 (h) SB160/2.75 (i) SB160/3. | ||
These results reinforce the thermal conductivity debate: samples with a fraction of 1:3 produce the lowest thermal conductivity properties. There are differences in morphology before (Fig. 5a and c) and after the thermal torch (Fig. 5b and d). Morphological changes after the thermal torch treatment (Fig. 5) explain the occurrence of craters, namely bubble breakage due to evaporation of the residual water content from the binder when exposed to high temperatures. This process arises from the evaporation of the crystal water content in the skin barrier, causing the gas phase to try to escape, appearing as a burst air bubble.34
 | ||
| Fig. 5 Skin morphology (left) before; (right) after thermal torch test. | ||
The specimen thermograms (Fig. 6) showed a curve with a two-step weight reduction to the heating temperature. The first step, the weight loss, is due to the evaporation of solvents (water, ethanol and acetone) and stabilizers in the binder and the drying process of water vapor in the binder Na2(SiO2)x·(H2O)x in the temperature range of 0–190 °C of 1.1 mg.35 Furthermore, at a temperature range of 200–470 °C, a weight loss of 1.6 mg is due to the breakdown of the water molecule in the sodium silicate hydrate compound. The binder is mainly composed of hydrate compounds, meaning water molecules are inserted into the sodium silicate's crystalline structure. However, this water molecule does not react with the main compound of the binder to form a chemical bond. Evaporation of the water of crystallization causes liquid sodium silicate, the water content of which has been evaporated, to solidify, followed by conversion to sodium metasilicate, which can be obtained at an optimum temperature of about 360–400 °C.36,37 The process of reducing the mass produced during the decomposition process produces a solid crystalline structure of sodium metasilicate due to the loss of water vapor content, both physically and chemically bound, to produce new pores that play a role in the heat insulation process. After the SB100/3 specimen reached a temperature of 470 °C, there was no significant weight loss, so it can be concluded that the thermal stability of SB100/3 is 470 °C.
 | ||
| Fig. 6 Thermogram of SB100/3. | ||
A hydrophobicity test was conducted on specimens of Al2O3–Na2SiO3 skin barriers coated with TiO2 at 120 mm in sweep distance, as well as on Al2O3–Na2SiO3 skin barriers coated with SB160/3 variations. Based on the tests that have been carried out, the water droplet contact angle (WCA) values for Al2O3–Na2SiO3 skin barriers and Al2O3–Na2SiO3 skin barrier specimens coated with TiO2 are 97.8° and 105.6° respectively. Both have hydrophobic characteristics with respective WCA values of >90° (Fig. 7).
 | ||
| Fig. 7 (a) Contact angle of Al2O3–Na2SiO3 skin barrier specimens (SB160/3) and (b) contact angle of specimens Al2O3–Na2SiO3 skin barrier coated with TiO2 (120 mm). | ||
Specimens with hydrophobic characteristics have a weak bond to water droplets, which indicates there is little contact between air and the surface of the specimen. Interestingly and as expected, the addition of the TiO2 layer significantly affected the hydrophobicity of the Al2O3–Na2SiO3 skin barrier specimen coated with TiO2 compared to the Al2O3–Na2SiO3 specimen. These are due to differences in the fabrication method and the powder size. It is also known that the Al2O3–Na2SiO3 specimens use a hot pressing method in which the Al2O3 powder is included and adheres to the sodium silicate solution material so that ionic bonds and interlocking occur between the two materials. Unlike the TiO2 coating process, the fabrication method uses the flame spray method, producing a covalent bond between the two materials. The addition or inclusion of TiO2 into the Al2O3–Na2SiO3 skin barrier increases the surface roughness of the layer and simultaneously increases the non-wettability of the surface. It can be validated similarly on SEM images of Al2O3–Na2SiO3 barrier skin specimens and Al2O3–Na2SiO3 barrier skin specimens coated with TiO2, which have different roughness characteristics.
This is supported by several pieces of literature stating that surface roughness and surface chemical composition influence a specimen's hydrophobic and superhydrophobic properties.38 Superhydrophobic surfaces can be obtained by combining two different factors: surface roughness and low surface energy. Surface roughness is usually determined by the hierarchical structure of micro/nanometric dimensions, and surface energy can be reduced by adjusting the chemical composition of the surface.39,40 Kumar et al. have conducted research on TiO2 nanoparticles with varying concentrations of 0.5, 1, 2, and 3% by weight added to an acrylic-epoxy polymer matrix in a ratio of 90:10% by weight (90A:10E) added to 1% by weight of graphene, to create a graphene/TiO2 based nanocomposite coating system. His research found that the WCA of the graphene/TiO2 layer increased along with the ratio of TiO2 to graphene, reaching the highest CA of 120.85° for 3 wt% TiO2.41 In other research, the development of hydrophobic properties was mostly carried out on nanoparticles (NPs), which are considered a promising material for preparing superhydrophobic coatings because multi-scale roughness can be easily achieved by combining the nanoscale roughness of primary nanoparticles with the microscale roughness of nanoparticle aggregates.42,43 The particles are usually modified with low surface energy compounds to provide hydrophobic characteristics and better dispersion into the polymer matrix. Several materials can be used for surface decoration. Namely, silica, titanium dioxide (TiO2), zinc oxide (ZnO), silicon dioxide (SiO2), and aluminum oxide (Al2O3) are some inorganic nanoparticles that are often used to develop nanocomposite coatings with anti-aging performance—high corrosion.44 In another study, incorporating organic moieties on the surface of alumina NPs was considered an effective way to reduce surface energy and increase hydrophobic characteristics.45 Several studies involve the hydrophobiation of alumina NPs by silylation using functionalized silanes.46–48 In short, a high concentration of the material or modification agent is required to increase the hydrophobic properties of a specimen coating to increase roughness and decrease bonding with water. It also uses modified materials or materials with nano powder size.
3.2 Characterization of Al2O3–Na2SiO3 skin barrier coated with TiO2
Fig. 8 shows the visualization of the surface of the Al2O3–Na2SiO3 skin barrier CFRP composite coated with TiO2. The pre-flame-sprayed skin barrier surface is shown in Fig. 8(a), while the flame-sprayed skin barriers are presented in Fig. 8b–d with nozzle distances of 120, 150, and 180 mm, respectively. The shorter nozzle distance shows more homogenous coating distribution and less porosity. The closer the nozzle distance, the less the particles originating from the nozzles experience cooling and directly touch the substrate in melting conditions. | ||
| Fig. 8 (a) Visual surface of undercoating Al2O3 skin, visual surface of TiO2 coating result with nozzle distance (b) 120 (c) 150 (d) 180 mm. | ||
Particles still in a molten state cause the internal distribution process to become more homogeneous, which is associated with a low density, so that they can cover the entire surface of the substrate.49,50
The morphology of the sample with a nozzle spacing of 120 mm in Fig. 9a shows the details of each layer of the sample. It can be seen that CFRP has a solid morphology with no pores, while the outer layer, namely TiO2, has a small number of pores. More clearly, TiO2 has a particle-shaped morphology with particle sizes of about 36.83 μm (Fig. 9b and c). The EDX results of TiO2 showed that only Ti and O elements were found in TiO2 (Table 3). The elemental distribution in the middle layer is Al2O3 with binder Na2(SiO2)x·(H2O)x with the greatest porosity, which is in agreement with the previous discussion that the presence of Na2(SiO2)x·(H2O)x in Al2O3 opens the pore of the monster. A porous material has less thermal conductivity than a solid bulk material; therefore, the presence of porosity in the skin barrier could increase the insulation efficiency of the thermal barrier coating.51,52
 | ||
| Fig. 9 (a) Composite TBC cross-sectional morphology after thermal spray (b) SEM image of TiO2 (c) particle size distribution of TiO2. | ||
| Material | Element | Content (%) |
|---|---|---|
| TiO2 | Ti | 70.68 |
| O | 29.38 | |
| Nozzle distance 120 mm | O | 49.71 |
| Na | 15.43 | |
| Al | 2.79 | |
| Si | 31.26 | |
| Ti | 0.80 | |
| Nozzle distance 150 mm | O | 48.48 |
| Na | 15.67 | |
| Al | 3.14 | |
| Si | 30.02 | |
| Ti | 2.68 | |
| Nozzle distance 180 mm | O | 48.31 |
| Na | 16.49 | |
| Al | 1.82 | |
| Si | 32.86 | |
| Ti | 0.52 |
The surface morphology of the coated skin barriers was also scanned to identify the particle condition after the thermal spray process. Three common particle conditions are deposited on the skin barrier surface after the thermal spray process. The first condition is a fully melted particle, which is indicated by a flat plate shape.
Another condition is partially melted, with a spherical shape that still contains some particles. The third condition is a fully unmelted particle with a perfectly spherical shape as a powder particle. The morphological test results of different thermal spraying nozzle distances are presented in Fig. 10. It shows that increasing nozzle distance will affect the final particle conditions. The first specimen with a 120 mm nozzle distance variation (Fig. 10a) has almost fully melted deposited particles, which are homogeneously distributed on the skin barrier surface. However, the other nozzle distance variations have some variation in the final condition. Fig. 10b and c, it can be seen that the deposited particles consist of partially melted and unmelted ceramic powder. A long distance between the substrate and nozzle tends to solidify more quickly during the travel through the air, which results in partially melted and even unmelted powder.53 Hence, the other nozzle distance variations show non-homogenous powder conditions. This phenomenon also affects the final diameter of the deposited particle.
 | ||
| Fig. 10 TBC surface morphology with nozzle distance (a) 120 (b) 150 (c) 180 mm. | ||
The EDX results of TBC composite (Table 3) with nozzle distance variation showed that O, Na, Al, Si, and Ti elements were found in TBC composite. The elements are derived from the precursor used, proving the success of coating CFRP with Al2O3 and TiO2. Besides, no other elements were found to prove that TBC composite has a high purity. Fig. 11 illustrates the diameter distribution of the powder particles, which shows that shorter nozzle distances tend to have larger particle diameters and a more homogenous distribution. The impact between melted ceramic particles and their substrate creates a flat shape with a large circular plate diameter. On the other hand, a long spraying distance generates a spherical particle with a smaller diameter because the solidifying process occurs during the travel time between the nozzle and the skin barrier.54
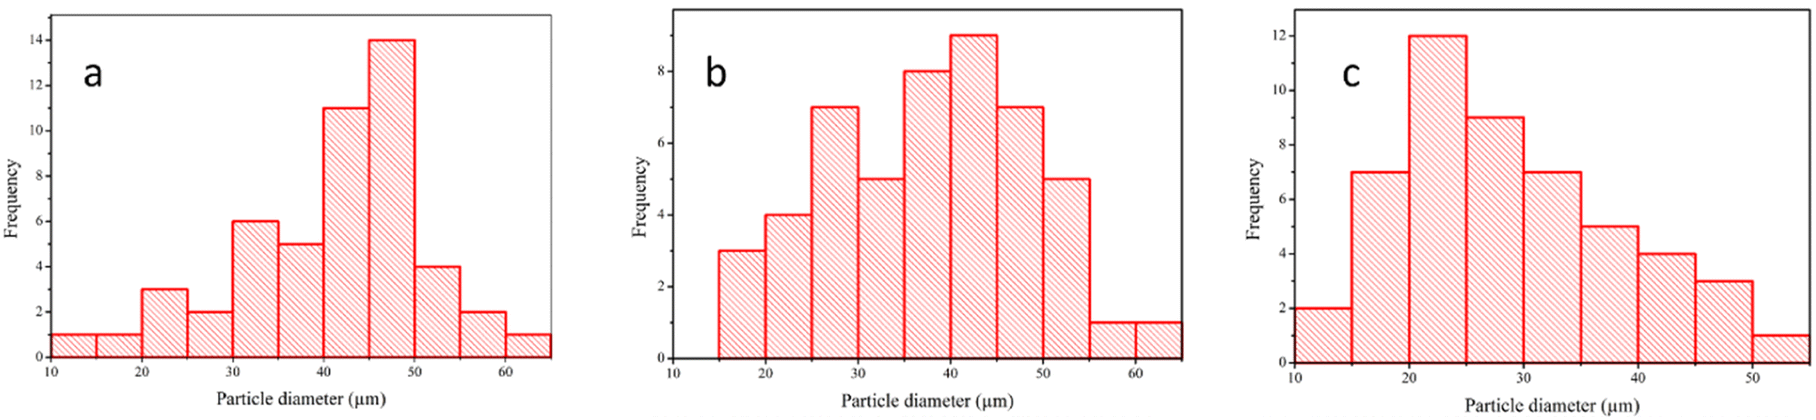 | ||
| Fig. 11 Particle diameter distribution graph on the Al2O3 skin barrier surface with nozzle distance variation (a) 120 mm, (b) 150 mm, and (c) 180 mm. | ||
Therefore, the partially melted ceramic powder has an irregular shape after fully solidifying, but the unmelted particle still holds a spherical shape even after impacting the substrate. To observe the endurance under high thermal loads, the coated laminated skin barrier was also exposed to the flame in a thermal torch test. Fig. 12 shows that the shorter nozzle distance variation has more thermal endurance than the more extended nozzle variation.
 | ||
| Fig. 12 Cross-section of the coated skin barrier after thermal torch exposure at 100× magnification (left) and 500× magnification right with different nozzle distance variation: (a) 120 mm, (b) 150 mm, and (c) 180 mm. | ||
After being exposed to high-temperature conditions, the 120 mm nozzle distance variations show no changes in the ceramic coating or the skin barrier. In contrast, some holes were formed on the other nozzle distance variation. This defect also affects the skin barrier below the ceramic coating, which generates a large crater inside the skin barrier.55 The impact of nozzle variations on porosity is illustrated in Fig. 10. An increase in the distance of the nozzle leads to a corresponding increase in porosity.
There is a positive correlation between increased porosity and thermal insulation efficiency, as seen in Tables 3 and 4. The effective thermal insulation of the TiO2-coated component is attributed to the combined influence of its porosity and conductivity, resulting in a good synergistic effect.56 In another hand, Fig. 12 and 13 shows that 150 and 180 mm nozzle distance variations experience structural changes, which are indicated by a cratering phenomenon inside the skin barrier. Due to the non-homogeneous coating distribution that covers the skin barrier, it cannot withstand the thermal load, which results in binder transformation. The uneven coating coverage also results in direct heat exposure from the flame to the skin barrier, which causes this failure.9
| Specimens | Thermal conductivity (W mK−1) | Final temperature (°C) | Adhesive strength (MPa) |
|---|---|---|---|
| Standard | 3.37a | ∼300 °Cb | 0.3–1.5c |
| a Previous research.8b The thermal resistance of epoxy resin.8c Testing similar ceramic materials.63 | |||
| SB100/2.5 | 0.4438 | 301.25 | 0.733 |
| SB100/2.75 | 0.5043 | 373.56 | 0.797 |
| SB100/3 | 0.3100 | 253.18 | 0.640 |
| SB130/2.5 | 0.2277 | 159.30 | 0.567 |
| SB130/2.75 | 0.2687 | 235.02 | 0.780 |
| SB130/3 | 0.2220 | 191.24 | 0.523 |
| SB160/2.5 | 0.1697 | 67.91 | 0.507 |
| SB160/2.75 | 0.2046 | 152 | 0.767 |
| SB160/3 | 0.1605 | 46.45 | 0.533 |
 | ||
| Fig. 13 Cross-section comparison between before and after thermal torch exposure with different nozzle distance variation: (a) 120 mm, (b) 150 mm, and (c) 180 mm. | ||
XRD characterization is used to determine the phase of composite crystals after coating with TiO2. Diffractogram of TiO2 showed the main characteristic peak at 2θ = 27.5°, 36.2°, 41.3°, and 54.4°, which corresponds to the anatase TiO2 crystal phase (1 0 1), (0 0 4), (2 0 0), and (105) planes (JCPDS No. 21–1272). TBC composite diffractogram has a characteristic peak of TiO2 at a low intensity caused by a low addition to TiO2 (Fig. 14).
 | ||
| Fig. 14 XRD pattern of TiO2 and TBC composites. | ||
As the nozzle distance is increased, the peak intensity of TiO2 gradually increases. The reinforcement of the diffraction peak can be considered to be derived from the improvement in the quality of the crystal on the composite. In addition, the appearance of the peak characteristics of TiO2 supports the success of the coating of TiO2 on the composite.
3.3 Adhesive strength test
The qualitative results of the adhesion test on each sample show the presence of black and white colours (Fig. 15a–i). The white part is the skin barrier, while the black part is CFRP and the wide range of cohesion breakage, which is a breakage process between the skin barrier and a CFRP base of 22.8–66.5%.57 In addition, the mechanical strength of the laminated material is largely determined by the interfacial bond strength of each layer.58 Based on the analysis of the effect of the mass fraction on the adhesion for each hot press temperature (Fig. 15j), it can be seen that the best adhesion of the three variations of the mass fraction is 1:2.75 and the highest value is obtained at a temperature variation of 100 °C with an adhesive force value of 0.797 MPa. The low binder meant that the bond was not optimal during the formation of the composite and resulted in an uneven accumulation of Al2O3, which impacted the low mechanical properties of the composite. However, an increase in the amount of binder above optimum conditions can reduce the mechanical strength resulting from pressing the bonds of the excess binder against the bonds that have occurred between the binder and Al2O3.33,59
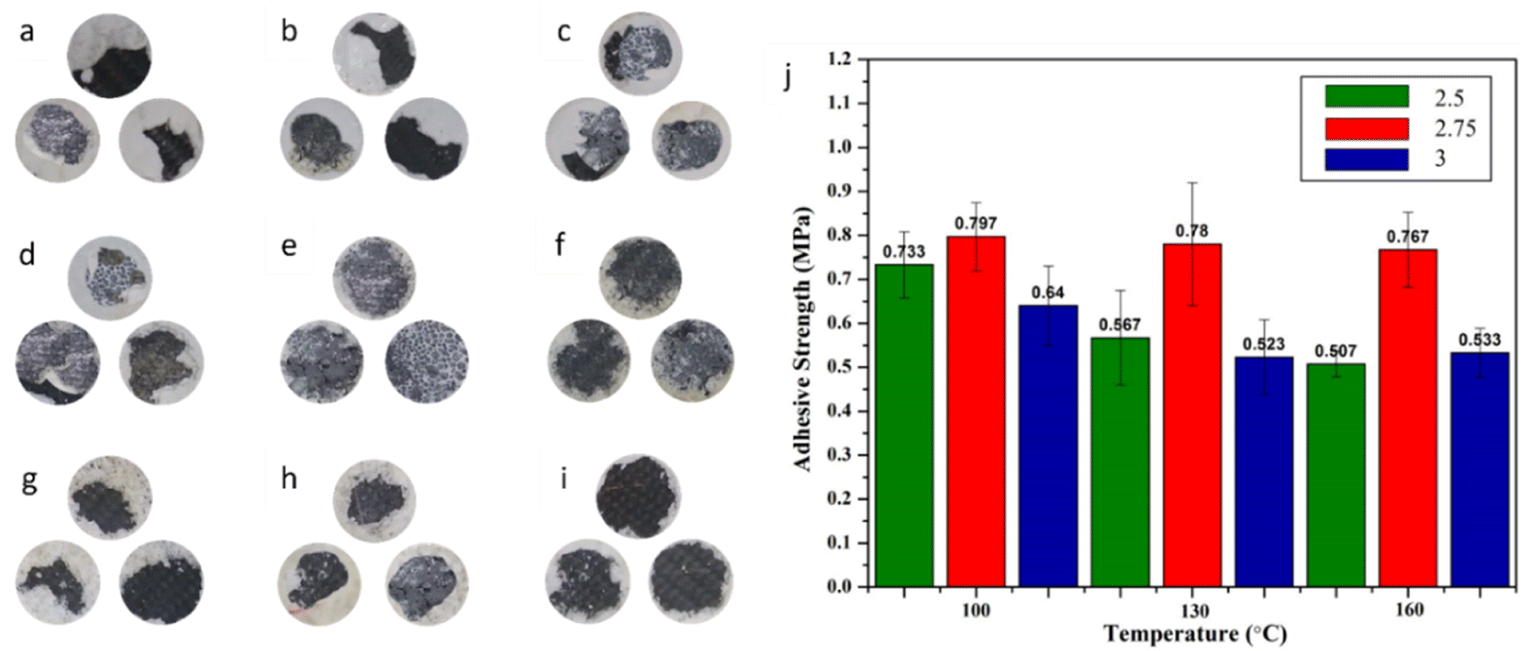 | ||
| Fig. 15 Ripped skin barrier visualization results after pull-off test with the ceramic binder/powder mass fraction and hot-press temperature: (a) SB100/2.5 (b) SB100/2.75 (c) SB100/3 (d) SB130/2.5 (e) SB130/2.75 (f) SB130/3 (g) SB160/2.5 (h) SB160/2.75 (i) SB160/3 and (j) adhesive strength of the Al2O3 skin barrier laminated on CFRP. | ||
The adhesive strength of each specimen decreases as temperature increases with each adjustment of the Al2O3:binder. The evaporation process works well to release the water vapour stored in the binder at higher temperatures. It is based on the hot pressing of alumina specimens with the binder Na2(SiO2)x·(H2O)x, which begins drying at 90 °C. Water evaporation causes bubbles of water vapour to form, which then dry and form holes. The presence of pores reduces surface bonding and adhesion, resulting in a drop in the mechanical strength of the specimen. Evaporation of water produces water vapour bubbles, which then dry out and become pores. The presence of pores causes interfacial bonding and adhesion to be low, which has an impact on the reduction of the mechanical strength of the sample.60 Therefore, a temperature of 100 °C provides optimum adhesion values compared to other temperature variations.
3.4 Thermal conductivity test results of the skin barrier
Thermal conductivity testing is used to determine the material properties, which show the amount of heat transferred through a unit of an area if the temperature gradient is one.61 Fig. 16a and b show that Al2O3:binder 1:3 at 160 °C has the lowest thermal conductivity value expected to isolate heat as it passes through the surface of the sample. The low value of thermal conductivity in the 1:3 fraction shows good insulating properties compared to the 1:2.5 and 1:2.75 mass fractions, this can be attributed to the abundant pores as the binder value increases.62
 | ||
| Fig. 16 (a) Variation of thermal conductivity of Al2O3:binder (b) effect of temperature pressing on CFRP temperature. | ||
Consistent with the previous discussion, an increase in binder results in an increase in water content, resulting in more and more new pores through the process of evaporation of water, which is then released into the environment. The new pores that are formed improve the thermal insulation properties of the material through heat dissipation by the gas in the pores and interfacial processes that can inhibit heat transfer.64,65 In addition, the lowest thermal conductivity value with increasing temperature comes from the faster drying process of water from the binder, which produces pores that can inhibit heat dissipation, increasing the insulation properties of the sample. Based on the data tabulation in Table 4, it can be seen that in its application to protect the CFRP skin barrier, it must be able to reduce the temperature to a maximum of 300 °C. The analysis results show a skin barrier with a ceramic and binder mass fraction of 1:2.5, 1:2.75, and 1:3, hot pressed at temperatures of 130 and 160 and the 1:3 fraction at a temperature of 100 by qualifications.
3.5 Effect of nozzle distance on adhesive strength
The adhesive test results (Fig. 17a) show no significant difference between all coated specimens. However, the shorter nozzle distance generates a lower adhesive strength than the other variations. Spraying with more distant nozzles tends to produce heterogeneous particles due to the rapid cooling process.66 In addition, increased adhesion with increased nozzle distance arises from thermal shock on the Al2O3 layer in receiving the particle due to high temperatures and speeds at low distances (120 mm) resulting in Al2O3 not being optimal for dispersing the particles, while at a longer distance (180 mm), Al2O3 no longer undergoes thermal shock, resulting in high dispersal. The degree of dispersion affects the adhesion value between Al2O3 and TiO2, where the higher the dispersion, the more adhesive the player produces.28 Most of the heat contained in ceramic particles is also lost during air travel. Using the thermocouple and thermogun, the surface temperature of the skin barrier was measured during the thermal spray process. It was observed that the working temperature of thermal spray on the skin barrier surface was 120, 100, and 80 °C for the 120, 150, and 180 mm nozzle distances, respectively. By comparing the thermogram (Fig. 6), it can be seen that the skin barrier mass reduction begins at 0 °C, caused by water molecule evaporation. In addition, the Al2O3 skin barrier showed a decrease in Na2SiO3 binding mass at temperatures ranging from 100–420 °C,67 indicating that deformation on the Al2O3 surface started to occur, causing a decrease in adhesion between the ceramic Al2O3 skin and the TiO2 coating because the skin was brittle. | ||
| Fig. 17 (a) Adhesive strength of the laminated Al2O3 skin barrier after thermal-sprayed with TiO2 ceramic powder. Visualization of the dolly after pull-off test of the laminated Al2O3 skin barrier after thermal-sprayed with TiO2 with different nozzle distance variation: (a) 120 mm, (b) 150 mm, and (c) 180 mm. | ||
The short nozzle distance still holds the heat to evaporate the remaining water content, which leads to deformation and low mechanical bonding between the skin and the coating particles.68 Additionally, the one-way ANOVA method was used to determine the significance of nozzle distance variations on adhesive strength. Due to its slight difference (0.1 to 0.4 MPa) in value, this method was carried out using the acquired adhesive strength data. After the calculation, the result also shows that nozzle distance has no significant effect on the adhesive strength of the coating. Pull-off test visual observation presented in Fig. 17b–d was also carried out to analyze the coating failure patterns. For the thermally sprayed specimens, there are two different coating failure types depending on the damaged layers. First, the black-coloured pull-off test result area shows the coating failure caused by low bonding strength between the CFRP substrate and the Al2O3 skin barrier but has a high adhesive coating strength between the TiO2 ceramic coating and the Al2O3 skin barrier. This low bonding strength between coated skin barrier and substrate is considered an adhesive failure. On the other hand, the white-coloured pull-off test result occurred because the ceramic particles poorly adhered to the skin barrier. This low bonding strength between ceramic particles and the skin barrier is considered a cohesive failure.69 In Fig. 17, TBCs with nozzle spacings of 120, 150, and 180 mm have adhesive fracture areas of 0.389, 21.608, and 43.355%. This data shows that as the nozzle spacing increases, the fracture surface of the adhesive also increases. The wider the area of adhesive breakage, the increasing value of the adhesive force. This is consistent with the results obtained in this study, where they were obtained in TBC with a nozzle spacing of 180 mm.
3.6 Effect of nozzle distance on thermal insulation capability
The laminated skin barrier final product, which has the lowest conductivity result, was then prepared for the thermal spray process and then followed with a thermal insulation test. Thermal insulation test results presented in Table 5 show that there is no significant difference between all nozzle distance variations.| Nozzle distance variation (mm) | Final temperature on CFRP (oC) | Thermal insulation efficiency (%) |
|---|---|---|
| 120 | 135 | 73 |
| 150 | 143 | 71 |
| 180 | 153 | 69 |
The previous morphological analysis shows that the 150 and 180 mm nozzle distance variations have non-homogenous coverage and experienced thermal deformation, resulting a higher coefficient of thermal conductivity.70,71 Meanwhile, TBC featuring a nozzle spacing of 120 mm exhibit the lowest thermal conductivity, measuring at 0.1505 W mK−1. Subsequently, TBCs with nozzle spacings of 180 mm and 150 mm demonstrate somewhat higher thermal conductivities of 0.1535 and 0.1570 W mK−1, respectively (Table 5). Based on the ranking of effectiveness in reducing ambient temperatures, it can be concluded that TBC with a nozzle distance of 120 mm exhibit the highest level of performance. The observed phenomenon can be attributed to the quality of the surface coating on each individual product. According to Fig. 4, TBC featuring a nozzle distance of 120 mm exhibit a more uniform coating surface in comparison to TBC with nozzle distances of 150 mm and 180 mm. The morphologies display an uneven surface, leading to a faster collapse of heat. The thermal insulation test was conducted at an ambient temperature of 500 °C, thereby confirming its validity.
A thermal torch test was also carried out to verify the high-temperature exposure to the flame-sprayed skin barrier. Table 6 shows that reducing the nozzle spacing can significantly reduce the exposure temperature of the CFRP substrate. The heat hitting CFRP can be damped by different layers in composites such as TiO2 and Al2O3 layers.
| Nozzle distance (mm) | Thickness (mm) | Thermal conductivity (W mK−1) | |||
|---|---|---|---|---|---|
| TiO2 coating | Al2O3 skin barrier | CFRP | Total | ||
| 120 | 0.35 | 2.04 | 0.8 | 3.19 | 0.1505 |
| 150 | 0.31 | 1.94 | 0.8 | 3.05 | 0.1570 |
| 180 | 0.39 | 2.07 | 0.8 | 3.26 | 0.1535 |
In addition, the coefficient of thermal conductivity also affects improving the properties of composite insulation. Composites with low thermal conductivity indicate good insulation properties, which can be found in composites with a nozzle spacing of 120 mm.72 In addition, with a nozzle spacing of 120 mm, the composite has characteristics consistent with previous studies, namely homogeneous morphology and no damage after heat transfer, explaining its high stability compared to other composites. On the other hand, the thermal conductivity, insulation properties and adhesion of each composite are within the correct range.73,74
3.7 Statistical evaluation
Validation of the binding effect between mass fraction and hot pressing temperature against adhesive strength can be seen in Table 7.| Source | Type III sum of square | df | Mean square | F | Sig. |
|---|---|---|---|---|---|
| a R squared = 714 (adjusted squared = 586). | |||||
| Corrected model | 369a | 9 | 0.046 | 5.604 | 0.001 |
| Intercept | 11.499 | 1 | 11.499 | 1395.973 | 0.000 |
| Temperature | 0.068 | 2 | 0.034 | 4.142 | 0.033 |
| Mass fraction | 0.261 | 2 | 0.013 | 15.839 | 0.000 |
| Temperature × mass fraction | 0.040 | 4 | 0.010 | 1.217 | 0.338 |
| Error | 0.148 | 18 | 0.008 | ||
| Total | 12.016 | 27 | |||
| Corrected total | 518 | 26 | |||
A hot pressing temperature indicates a Sig. value of 0.033 where 0.033 < 0.05, then produces a reject Ho, which indicates that there is a significant difference in the result based on the temperature of the hot press. Similar to the effect of a temperature pressing, the influence of a mass fraction indicates the value of the Sig. of 0.000 where 0.000 < 0.05 then results in the reject of the Ho, indicating that there are significant differences in the outcome based on. However, the interaction between a temperature hot pressed and a fraction of the mass refers to a Sig value of 0.338 where 0.338 > 0.005, then resulting in a fail to reject the Ho.
In addition, the influence of a homogeneous subset on two factors namely temperature hot pressing and mass fraction is shown in Fig. 17. Based on Table 8 shows that there are empty cells on either subset 1 or 2 for 3 variations of mass fractions so that the mass fraction of 2.5; 2.75; and 3 affects the adhesion force.
Similar to Table 9, the presence of empty cells on either subset 1 or 2 for temperature variations of hot pressing 100 and 160 so that the temperature of hot pressing 100 and 160 affects the adhesion (Fig. 16).
4 Conclusion
We proposed a novel, simple, and effective Al2O3-based thermal barrier coating (TBC) coated with TiO2 on CFRP substrate through a flame spraying method. The flame spraying method with the adjustment of binder mass fraction shows homogeneity and high pores, which can be used as good insulation agents. The thermal and adhesive properties of the TiO2–Al2O3-CFRP composite were studied using a variety of thermal conductivity and adhesive tests. The performance of composites has been studied based on variations in the mass fraction of Al2O3 with the binder and the nozzle spacing. The best insulation properties were achieved with 1:3 mass fraction of 0.1605 W mK−1. On the other hand, increasing the hot press temperature will increase the thermal insulation properties, as proven by the lowest thermal conductivity constant in the specimen at 160 °C. However, the optimum parameter to achieve higher adhesive strength is 1:2.75 ceramic powder mass fraction ratio to the binder, which is valued at 0.797 MPa. The nozzle distance variations show no significant effect on the adhesive or the thermal conductivity test results. However, the longer nozzle distance (180 mm nozzle distance) tends to generate higher adhesive strength at 0.73 MPa. Thermal torch testing shows that the presence of TiO2 coating and nozzle spacing can protect CRFP from heat, as evidenced by the final state of unmelted CFRP. Overall, the final result with 1:3 Al2O3 ceramic and binder Na2(SiO2)x·(H2O)x ratio, which is hot pressed at 160 °C and then followed by TiO2 thermal spray at 120 mm nozzle distance, has the standard properties for the coating appropriateness.
Author contributions
Widyastuti: conceptualization, methodology, supervision, writing – review & editing. Serly Hardiyanti: investigation, writing – original draft. Wafiq Syeach Muhaqqi Al Haq: investigation, writing – original draft. Liyana Labiba Zulfa: investigation, writing – original draft, writing – review & editing. Ninik Safrida: investigation, writing – original draft, writing – review & editing. Arif Nur Hakim: resources, formal analysis. Lilis Mariani: resources, formal analysis. Herry Purnomo: resources, formal analysis. Sulistijono: methodology, validation, forma analysis. Ruri Agung Wahyuono: methodology, validation, forma analysis.Conflicts of interest
There are no conflicts to declare.Abbreviation
| CFRP | Carbon Fiber Reinforced Polymer |
| TBC | Thermal Barrier Coating |
| ICAO | International civil aviation organization |
| BMI | Bismaleimide |
| YSZ | Yttrium Stabilized Zirconia |
| HVOF | High Velocity Oxygen Fuel |
Acknowledgements
The authors gratefully acknowledge financial support from the National Research and Innovation Agency of Indonesia (BRIN), Indonesia, for this work, under Research and Innovation Program for Developed Indonesia with contract no. 79/IV/KS/11/2022.References
- G. K. Ze, A. Pramanik, A. K. Basak, C. Prakash, S. Shankar and N. Radhika, Compos., Part C: Open Access, 2023, 11, 100356 CAS.
- P. Fallah, S. Rajagopalan, A. McDonald and S. Yue, Surf. Coat. Technol., 2020, 400, 126231 CrossRef CAS.
- P. Golewski and T. Sadowski, Compos. Struct., 2019, 229, 111489 CrossRef.
- International Civil Aviation Organization (ICAO), ICAO Journal, 2007, Issue 4 Search PubMed.
- R. Stewart, Reinf. Plast., 2009, 53, 16–21 CrossRef.
- Y. Jia, T. D. Ajayi, K. R. Ramakrishnan, A. Negi, J. Liu, S. Ekkad and C. Xu, Surf. Coat. Technol., 2020, 404, 126481 CrossRef CAS.
- B. Liu, Y. Liu, C. Zhu, H. Xiang, H. Chen, L. Sun, Y. Gao and Y. Zhou, J. Mater. Sci. Technol., 2019, 35, 833–851 CrossRef CAS.
- H. Kim, J. Kim, J. Lee and M. W. Lee, Composites, Part B, 2021, 225, 109308 CrossRef CAS.
- N. Uchida, Int. J. Engine Res., 2022, 23, 3–19 CrossRef CAS.
- X. Song, Y. Ding, J. Zhang, C. Jiang, Z. Liu, C. Lin, W. Zheng and Y. Zeng, J. Mater. Res. Technol., 2023, 23, 648–655 CrossRef CAS.
- M. Wu, Y. Liu, W. Qu, W. Guo, H. Zhang, Y. Pei, S. Li and S. Gong, Surf. Coat. Technol., 2023, 129748 CrossRef CAS.
- A. Moridi, M. Azadi and G. H. Farrahi, Surf. Coat. Technol., 2014, 243, 91–99 CrossRef CAS.
- K. Chen, S. Bai, H. Li, Y. Xue, X. Zhang, M. Liu and J. Jia, Appl. Catal. A, 2020, 599, 117614 CrossRef CAS.
- Z. Yang, Y. Sun, D. Cai, B. Wang and D. Jia, Ceram. Int., 2019, 45, 24793–24801 CrossRef CAS.
- K. Fan, L. Guo, H. Ou, H. Li and J. Sun, Corros. Sci., 2023, 221, 111371 CrossRef CAS.
- S. Ponnapureddy, A. Bhadauria, S. Bajpai, A. Tiwari, K. K. Pandey, A. K. Keshri and K. Balani, Surf. Coat. Technol., 2023, 462, 129488 CrossRef CAS.
- S. Ariharan and K. Balani, Int. J. Refract. Met. Hard Mater., 2021, 98, 105525 CrossRef.
- Z. Xue, Y. Zhu, H. Yu, M. Shi, X. Liu and S. Zhang, Surf. Coat. Technol., 2022, 433, 128173 CrossRef CAS.
- L. Guo, X. Tao, Z. Gong, A. Guo, H. Du and J. Liu, Ceram. Int., 2019, 45, 2602–2611 CrossRef CAS.
- Z. Zhang, H. Chen, Y. Wang, G. Wang, L. Li, M. Zhong and H. Bai, Surf. Coat. Technol., 2022, 448, 128868 CrossRef CAS.
- G. Q. Chen, N. N. Li, X. S. Fu and W. L. Zhou, Powder Technol., 2012, 230, 134–138 CrossRef CAS.
- D. Wang, H. Peng, S. Gong and H. Guo, Corros. Sci., 2014, 78, 304–312 CrossRef CAS.
- J. Zhou, K. Sun, S. Huang, W. Cai, Y. Wei, L. Meng, Z. Hu and W. Li, Coatings, 2020, 10, 1–15 Search PubMed.
- I. D. Utu, G. Marginean, I. Hulka, V. A. Serban and D. Cristea, Int. J. Refract. Met. Hard Mater., 2015, 51, 118–123 CrossRef CAS.
- F.-L. Toma, C. C. Stahr, L.-M. Berger, S. Saaro, M. Herrmann, D. Deska and G. Michael, J. Therm. Spray Technol., 2010, 19, 137–147 CrossRef CAS.
- Q. Wang, L. Guo, Z. Yan and F. Ye, Coatings, 2018, 8(7), 253 CrossRef.
- P. Golewski and T. Sadowski, J. Eur. Ceram. Soc., 2018, 38, 2920–2927 CrossRef CAS.
- W. Uczak de Goes, M. Ossiansson, N. Markocsan, M. Gupta, P. Honnerová and Z. Veselý, J. Therm. Spray Technol., 2022, 31, 2068–2090 CrossRef CAS.
- R. A. Abbas, S. A. Ajeel, M. A. Ali Bash and M. J. Kadhim, Mater. Today: Proc., 2021, 42, 2553–2560 CAS.
- K. M. Doleker, Y. Ozgurluk, Y. Kahraman and A. C. Karaoglanli, Surf. Coat. Technol., 2021, 409, 126862 CrossRef CAS.
- A. Pattnayak, A. Gupta, N. V Abhijith and D. Kumar, Ceram. Int., 2023, 49, 7085–7088 CrossRef CAS.
- A. Younsi, R. Cherif, A. Trabelsi, A. E. A. Hamami, R. Belarbi and A. Aït-Mokhtar, Constr. Build. Mater., 2021, 279, 122427 CrossRef CAS.
- M. M. Ali, M. Nion and M. S. Rahman, J. Eng. Appl. Sci., 2020, 4, 42–51 Search PubMed.
- L. Jin, G. Huang, Y. Li, X. Zhang, Y. Ji and Z. Xu, Materials, 2021, 14(8), 1927 CrossRef CAS.
- Y. Lin, F. Chu and X. Wu, Int. Commun. Heat Mass Transfer, 2022, 134, 106045 CrossRef CAS.
- M. L. Heilig, ACM SIGGRAPH Comput. Graphics, 1994, 28, 131–134 CrossRef.
- J. C. Mcrae, M. A. Smith, B. P. Duncan, E. Holihan, V. Liberman, C. Rock, D. Beck and L. M. Racz, IEEE Trans. Compon., Packag., Manuf. Technol., 2021, 11, 144–152 CAS.
- X. H. Wu and Y. Y. Then, Polymers, 2022, 14(1), 122 CrossRef CAS.
- M. Song, J. Ju, S. Luo, Y. Han, Z. Dong, Y. Wang, Z. Gu, L. Zhang, R. Hao and L. Jiang, Sci. Adv., 2024, 3, e1602188 CrossRef PubMed.
- Y. Lei, Q. Wang and J. Huo, Ceram. Int., 2014, 40, 10907–10914 CrossRef CAS.
- S. S. A. Kumar, N. B. Mohammed, O. Alduhaish, K. Ramesh, S. Ramesh, M. Khan, B. Shaik and S. F. Adil, Polymers, 2023, 15(11), 2428 CrossRef CAS PubMed.
- C. Cai, N. Sang, S. Teng, Z. Shen, J. Guo, X. Zhao and Z. Guo, Surf. Coat. Technol., 2016, 307, 366–373 CrossRef CAS.
- P. Nguyen-Tri, T. A. Nguyen, P. Carriere and C. Ngo Xuan, Int. J. Corros., 2018, 2018, 4749501 Search PubMed.
- E. Richard, S. T. Aruna and B. J. Basu, Appl. Surf. Sci., 2012, 258, 10199–10204 CrossRef CAS.
- S. Yan, G.-L. Song, Z. Li, H. Wang, D. Zheng, F. Cao, M. Horynova, M. S. Dargusch and L. Zhou, J. Mater. Sci. Technol., 2018, 34, 421–435 CrossRef CAS.
- G. Gu, Y. Tian, Z. Li and D. Lu, Appl. Surf. Sci., 2011, 257, 4586–4588 CrossRef CAS.
- Q. Ji, X. Xiao, Z. Ye and N. Yu, Polym. Compos., 2019, 40, 2019–2028 CrossRef CAS.
- A. Llorente, B. Serrano and J. Baselga, Macromol. Res., 2017, 25, 11–20 CrossRef CAS.
- J. Bin Lee, D. H. Shin, J. H. Moon and S. H. Lee, Mater. Trans., 2012, 53, 2043–2048 CrossRef.
- R. J. Alroy, R. Pandey, M. Kamaraj and G. Sivakumar, Surf. Coat. Technol., 2022, 449, 128941 CrossRef CAS.
- M. Gardon and J. M. Guilemany, J. Therm. Spray Technol., 2014, 23, 577–595 CrossRef CAS.
- S. Ahmad, S. Ali, M. Salman and A. H. Baluch, Ceram. Int., 2021, 47, 33956–33971 CrossRef CAS.
- D. Jafari, T. H. J. Vaneker and I. Gibson, Mater. Des., 2021, 202, 109471 CrossRef.
- M. Jadidi, S. Moghtadernejad and A. Dolatabadi, Coatings, 2015, 5, 576–645 CrossRef CAS.
- H.-J. Streitberger and A. Goldschmidt, BASF Handbook Basics of Coating Technology, 2019 Search PubMed.
- W.-W. Zhang, G.-R. Li, Q. Zhang and G.-J. Yang, J. Therm. Spray Technol., 2017, 26, 1183–1197 CrossRef.
- ASTM International, ASTM D4541-17, Standard Test Method for Pull-Off Strength of Coatings Using Portable Adhesion Testers, ASTM Int., 2017, pp. 1–16 Search PubMed.
- L. Cheng, M. Sun, F. Ye, Y. Bai, M. Li, S. Fan and L. Zhang, Int. J. Lightweight Mater. Manuf., 2018, 1, 126–141 Search PubMed.
- K. Srinivas and M. S. Bhagyashekar, IOP Conf. Ser.: Mater. Sci. Eng., 2021, 1189, 012003 CrossRef CAS.
- M. Damayanti, Z. H. Gan, T. Sritharan, S. G. Mhaisalkar, A. Naman, J. Widodo and H. S. Tan, Thin Solid Films, 2006, 504, 213–217 CrossRef CAS.
- C. Y. Ho, R. W. Powell and P. E. Liley, NSRDS-NBS, 1968, 16, 168 Search PubMed.
- X. Dai, X. Gu, J. Zheng, L. Zhao, L. Zhou and H. Jiang, Int. J. Miner., Metall. Mater., 2023, 30, 1548–1559 CrossRef CAS.
- C. Lopes, I. Flores-Colen and L. Silva, J. Adhes., 2015, 91, 150505115444007 CrossRef.
- S. N. Hong, C. J. Yu, U. S. Hwang, C. H. Kim and B. H. Ri, Mater. Chem. Phys., 2020, 250, 123146 CrossRef CAS.
- P. Ruckdeschel, A. Philipp and M. Retsch, Adv. Funct. Mater., 2017, 27, 1702256 CrossRef.
- X.-S. Wang, B. Chen and Z.-F. Zhou, Int. J. Heat Mass Transfer, 2018, 121, 15–27 CrossRef CAS.
- N. Saadatkhah, A. Carillo Garcia, S. Ackermann, P. Leclerc, M. Latifi, S. Samih, G. S. Patience and J. Chaouki, Can. J. Chem. Eng., 2020, 98, 34–43 CrossRef CAS.
- Z. Zhang, X. Wang and Y. Yan, e-Prime Adv. Electr. Eng. Electron. Energy., 2021, 1, 100009 CrossRef.
- A. Zotti, S. Zuppolini, M. Zarrelli and A. Borriello, Preparation and characterization of surface modified boron nitride epoxy composites with enhanced thermal conductivity, ed. A. Rudawska, IntechOpen, Rijeka, 2016, ch. 10 Search PubMed.
- J. Hou, G. Li, N. Yang, L. Qin, M. E. Grami, Q. Zhang, N. Wang and X. Qu, RSC Adv., 2014, 4, 44282–44290 RSC.
- B. Wan, Z. Gao, X. Huang, Y. Yang, L. Chen, Q. Wang, C. Fang, W. Shen, Y. Zhang, H. Ma, H. Gou, X. Jia and Z. Zhang, ACS Appl. Energy Mater., 2022, 5, 9549–9558 CrossRef CAS.
- K. J. Krakowiak, R. G. Nannapaneni, A. Moshiri, T. Phatak, D. Stefaniuk, L. Sadowski and M. J. Abdolhosseini Qomi, Cem. Concr. Compos., 2020, 108, 103514 CrossRef CAS.
- S. Akçaözoğlu, K. Akçaözoğlu and C. D. Atiş, Composites, Part B, 2013, 45, 721–726 CrossRef.
- L. D. Hung Anh and Z. Pásztory, J. Build. Eng., 2021, 44, 102604 CrossRef.
Footnote |
| † Electronic supplementary information (ESI) available. See DOI: https://doi.org/10.1039/d3ra08518j |
| This journal is © The Royal Society of Chemistry 2024 |