DOI:
10.1039/D3RA08311J
(Paper)
RSC Adv., 2024,
14, 4406-4415
Retracted Article: In situ fabrication of lanthanum-doped nickel oxide nanostructures using sol–gel for the degradation of rhodamine B
Received
5th December 2023
, Accepted 17th January 2024
First published on 2nd February 2024
Abstract
Nanoscale science represents a thriving field of research for environmental applications within materials science. This study focuses on the fabrication of pure and La-doped nickel oxide (NiO) nanostructures with varying concentrations (1.0, 2.0, 3.0, and 4.0 wt%) of lanthanum using a facile sol–gel technique. This study explores the structural, morphological, chemical composition, and optical characteristics of the resulting pure and La-doped NiO nanostructures. Techniques such as X-ray diffraction (XRD), scanning electron microscopy (SEM), energy-dispersive X-ray (EDX) spectroscopy, UV-visible spectroscopy, and photoluminescence (PL) spectroscopy were used for material analysis. The observed trend in the energy band gap (Eg) values demonstrates a continuous decrease up to a La-doping concentration of 3 wt% in NiO. However, after this concentration (at 4.0 wt%), there is a noticeable increase in the energy band gap. At lower La-doping concentrations (up to 3 wt%), the incorporation of La ions into the NiO lattice may result in the formation of defects and oxygen vacancies. The presence of these imperfections may lead to new energy levels into the band gap, resulting in partial filling and a subsequent reduction in the band gap. Beyond a specific doping concentration (e.g., 3 wt%), excess La atoms may aggregate or cluster inside the NiO lattice. This agglomeration may cause structural distortions, strain, and disturbances in the crystal lattice, resulting in an increase in the band gap. The 3 wt% La-doped NiO sample demonstrated a notable 84% degradation efficiency of the synthesized nanomaterials coupled with its inherent stability, highlighting its dual attributes of effective pollutant removal and sustained performance. Furthermore, the cyclic stability of the optimized nanostructure is anticipated to be ∼77.42% after six cycles, suggesting promising future applications in photocatalysis.
1. Introduction
According to a survey by the World Commission on Water, regions under severe water stress are expanding, which emphasizes strong competition for low available water owing to increase in population, over-water withdrawal, and limited rainfall.1 Moreover, pollution from enormous sources entering into water bodies has made accessible water unfit for consumption; therefore, research on developing effective techniques to clean wastewater and remove different contaminants has attracted considerable attention.2 Because of the unique features and the potential to revolutionize a number of scientific and technical sectors, research on nanostructure materials has gained momentum.3 Metal oxides have drawn a lot of attention because of their distinctive chemical, physical, and optoelectronic features;4 NiO is a p-type semiconductor with a broad bandgap (3.6–4.0 eV) along with outstanding chemical stability and optical transparency in the visible range.5 Its potential uses in solar cells, electrochromic devices, gas sensors, and catalysis have been extensively researched.6 However, its applicability is frequently limited due to its comparatively low electrical conductivity and carrier mobility.7 Consequently, doping NiO with other elements has emerged as a tactical approach for improving its characteristics and boosting its scope.8
Lanthanum, being a rare-earth element, has a distinct electrical structure. Rare-earth elements frequently have complex electronic configurations involving partially filled 4f or 5f orbitals.9 Lanthanum has a comparatively high ionic radius, particularly when compared to transition metals such as nickel. The ionic radius of La3+ is greater than that of Ni2+, which may cause lattice expansion when La is doped.10 This expansion may alter the crystal structure of NiO, thus resulting in lattice strain. The introduction of La into the NiO lattice may cause changes in electronic configurations and consequently affect the material's properties, making it an effective dopant for tailoring NiO characteristics.11 Because of La's unique electronic structure and large ionic radius, its incorporation into the NiO lattice may affect key properties such as electrical conductivity, charge carrier mobility, and catalytic activity.12 The altered properties could be useful in a variety of applications, including catalysis, sensors, and energy storage devices.13 Prior research suggests that lanthanum (La) doping considerably enhances NiO's optical absorbance and electrical conductivity, making it ideal for a wide range of optoelectronic uses.14 However, a comprehensive understanding of the synthesis methods and their influence on the optical characteristics of La-NiO nanostructures remains inadequate and demands more investigations.14 The physical and optical characteristics of doped nanostructures are considerably influenced by their shape and crystalline structure, which are mainly controlled by the synthesis processes.14 Consequently, a thorough examination of various synthesis processes for La-NiO nanostructures, such as sol–gel,15 hydrothermal,15 and co-precipitation,16 is essential.17 Each approach offers distinct control over the qualities of the resulting material and may be used for a variety of applications.18 Furthermore, the investigation of the optical characteristics of La-NiO nanostructures is essential, particularly considering their potential for optoelectronic applications.18 Comprehending these characteristics enables researchers to customize and improve material for particular uses, improving solar cell efficiency, maximizing the performance of photoelectrochemical cells, and raising the sensitivity of gas sensors.19 The photocatalytic degradation of rhodamine B (RhB) may produce a number of intermediate intermediates before reaching a final degradation state.20 The eventual degradation products are determined by the particular circumstances of the photocatalytic process and the effectiveness of the catalyst (NiO or La-doped NiO).21 RhB photocatalysis is typically characterized by a series of oxidative and reductive events that degrade the dye molecule.22 Smaller organic molecules, such as carboxylic acids, aldehydes, and other fragments formed by chromophore breakage, are common degradation products.23
The presence of specific inorganic salt ions has a substantial influence on photocatalytic efficiency.24 Certain salts, such as iodide ions, may behave as hole scavengers, minimizing charge carrier recombination and increasing the photocatalytic activity.25 Some salts, such as chloride ions, can hinder the photocatalytic process by competing for active sites on the catalyst surface, resulting in a drop in efficiency.26 The total impact is determined by the precise interactions between inorganic salt ions and the photocatalyst, highlighting the need to understand these dynamics to optimize photocatalytic performance.27
This study discusses the synthesis of pure and La-NiO nanostructures, examining several approaches and their effects on optical characteristics and structures. The synthesized structures were used to degrade the organic dye, which was being used in many industries throughout the world. The primary objective of our research is to stimulate additional exploration of doped metal oxides, thereby advancing the overarching goals of material science. Our aspiration is to contribute to the field by participating in the design and development of materials with customized properties, tailored to meet specific requirements and applications. Through this work, we aim to inspire and support ongoing research endeavors focused on the enhancement and diversification of material functionalities.
2. Experimental work
2.1. Materials
All reagents employed were of analytical grade and utilized as purchased without any further purification.
2.2. Preparation of pure and La-doped nickel oxide nanomaterials
The targeted nanostructures were synthesized according to the reported method with slight modification (Fig. 1).28 For pure NiO, 2.8 g of nickel chloride was dissolved in 80 ml of water by stirring at room temperature. Citric acid (5.0 g) was slowly added to the nickel chloride solution and the resultant mixture was heated to 80 °C. A few drops of polyethylene glycol (PEG) were added while ammonia was used to maintain the pH of the solution at 9–10. The resultant material was left under stirring for 5–6 h and a thick gel was formed. The resulting gel was extracted, and dried, followed by washing with water several times until the pH became 7. Finally, the resultant powder was ground with mortar and pastel followed by calcination at 550 °C for an hour to produce pure NiO. For lanthanum doping at 1%, 2%, 3%, and 4% wt, 28 mg, 56 mg, 84 mg, and 112 mg, respectively, of lanthanum nitrate were added and processed, as mentioned above.
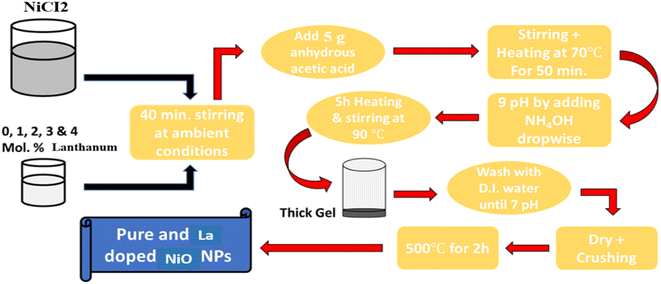 |
| | Fig. 1 Schematic representation of the synthesis of pure and doped nanomaterials. | |
2.3. Characterization
Initial examination of the synthesized nanomaterials was conducted via XRD using Cu (kα) radiation with a wavelength of 1.5406 Å and a scanning range of 10–80° (2θ). Furthermore, SEM was used at 15 kV in conjunction with EDX to evaluate the composition and morphology. A double-beam UV-visible PerkinElmer (UVD-3500) spectrophotometer was used to assess the photocatalytic degradation efficiency of the nanopowder over a 200–600 nm wavelength range. PL spectroscopy was used to understand the electron–hole recombination and photocatalytic reactions for all produced materials.
2.4. Photocatalytic degradation of the dye
Pure and La-doped nickel oxide nanostructures were evaluated by performing the reaction of RhB dye in the presence of sunlight. The activity was tested using a 10 ppm aqueous solution of RhB, 25 mg dose of pure/doped NiO, and 120 min of irradiation time. To determine the percentage degradation (%) value at a certain time (t), about 2 mL of reacting solution was taken by pipet followed by centrifugation at 3500 rpm for 10 min, which resulted in the elimination of suspended particles. Furthermore, UV-vis analysis was performed to estimate the dye amount in the medium of reaction at a particular time value.29 Eqn (1) was then employed for the evaluation of this reaction.30| |
 | (1) |
where the value of At illustrates the intensity of absorption measured for RhB dye for a certain time after the reaction was initiated, while A0 depicts the value of the absorption intensity when t = 0.
3. Results and discussion
3.1. Ultraviolet-visible analysis
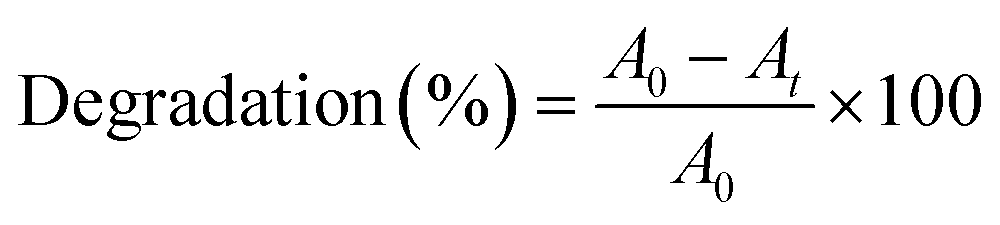
In the UV-vis spectrum, several absorption bands were observed in pure and doped NiO. The absorption band appeared at 274 nm for pure NiO-NPs, 273 nm for 1% La-doped NiO, 272 nm for 2% La-doped NiO, 273 nm for 3% La-doped NiO, and 266 nm for 4% La-doped NiO (Fig. 2). After evaluating the spectra, it was concluded that the increase in the dopant level resulted in enhancing the ability of the material to interact with electromagnetic radiation and making it suitable for its role as photocatalytic degradation of dye when interacting with sunlight. Using the Tauc plot relation from the direct band gaps of pure and doped NiO-NPs were calculated. The direct band gaps of pure and lanthanum-doped NiO nanoparticles using eqn (2) were calculated as 3.28, 3.13, 3.01, 2.91, and 2.98 eV, respectively. The generation of NiO results in the strong binding of oxygen anions to the host materials, consequently causing a reduction in the optical band gap as the number of bridging La3+ ions within the network system increases. Moreover, the diminishing value of the optical band gap can be attributed to the escalating presence of non-bridging oxygens.31 The intricate modulation of optical properties is emphasized by the observed redshift and enhanced absorption profile through the precise control in the doping concentrations of La3+. This has considerable implications for customizing material functionalities in various applications. In a prior investigation by Zhang et al. in 2017, a study focused on a solvothermal route preparation of a stable NiO/ZnO heterojunction with a band gap between 3.22 and 3.00 eV in which RhB dye was degraded up to the highest 87% over five cycles, and hydroxyl radicals were proposed to be a main contributor for the higher degradation,32
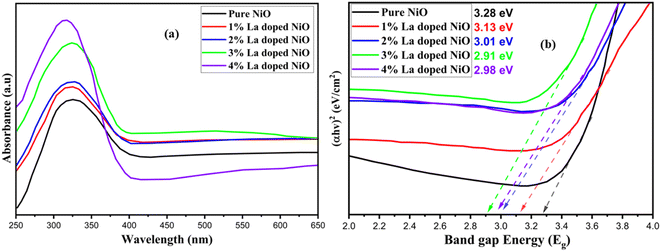 |
| | Fig. 2 (a) UV and (b) Tauc plots of the synthesized pure and La-doped nickel oxide nanoparticles. | |
3.2. Photoluminescence (PL) analysis
The evaluation of the optical characteristics and the effectiveness of photogenerated electron–hole recombination and separation was observed via PL spectroscopy. It is important to remember that a slower rate of recombination is correlated with a weaker photoluminescence response. This suggests that photo-generated charge carriers are more separated, leading to improved photocatalytic activity.30,33,34 Fig. 3 represents the PL emission spectra of pure and doped nickel oxide in the 360–600 nm range. An important peak at 390 nm was demonstrated by the synthesized nanoparticles in the PL emission spectrum. The decrease in the intensity of the peak was found with the upsurge of the dopant lanthanum, which was associated with dissimilarity in the ionic radii, and a decrease in electron–hole pair recombination, associated with an increase in the separation of the carrier of charges and eventually, profiting the optical and photocatalytic activity of nanoparticles.35 Small shoulder peaks towards the visible region were eliminated upon the addition of the dopant in a direct relationship.
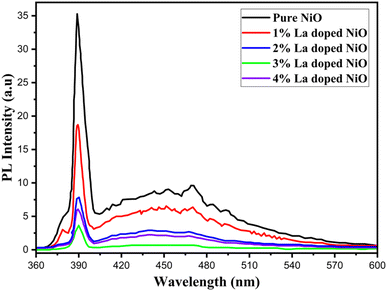 |
| | Fig. 3 PL spectrum of the synthesized pure and La-doped nickel oxide nanoparticles. | |
When the dopant concentration was varied, the PL spectra of the La-doped NiO nanomaterial showed small alterations in both the UV and broad-band areas, confirming the doping-induced reduction in the band gap, and a reduction in the electron–hole pair recombination rates. The synthesized samples' lattice defects are shown by the peaks in the broad band spectra. The La-doped samples' peak intensity decreases with increasing dopant concentration.
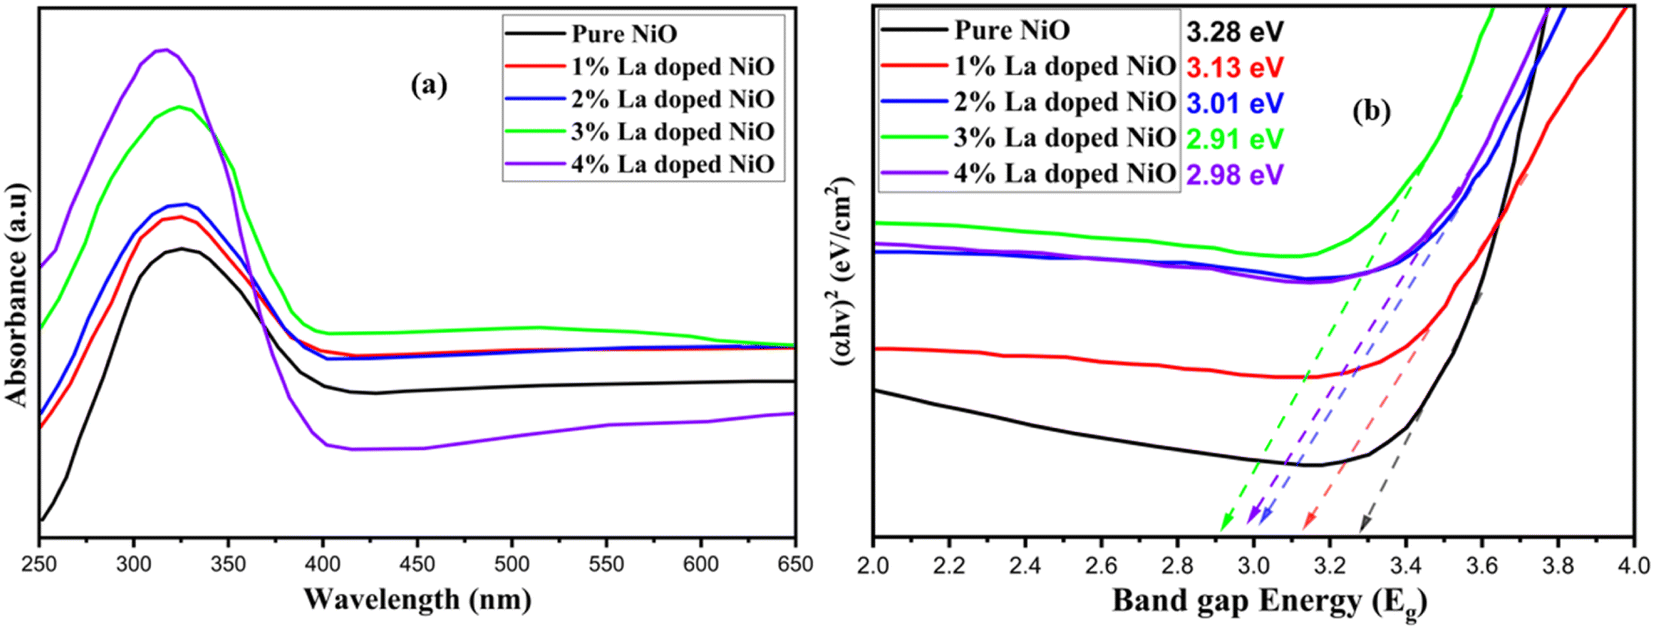
3.3. Scanning electron microscopy (SEM)
The morphological characteristic of the fabricated nanoparticles was studied by SEM. The SEM micrographs of the fabricated La-doped NiO NPs (La0%NiO, La1%NiO, La2%NiO, and La3%NiO) are shown in Fig. 4. SEM images show the morphological characteristics of the fabricated nanomaterials. NiO and La-doped NiO samples have different surface structures and grain morphologies. The undoped NiO has a well-defined surface with agglomerated particles, demonstrating the distinctive morphology of pure nickel oxide. La doping (1–3%) induces notable changes in the particle size and dispersion. Lower doping levels (1–2%) generate more scattered particles, indicating a regulated nucleation and growth process. As the concentration of La doping increases (3%), there is a noticeable effect on particle aggregation, resulting in the creation of clusters or agglomerates. The undoped NiO surface is generally compact, while La-doped NiO samples have various degrees of porosity. At increasing La doping concentrations, agglomeration occurs, which may be linked to the effect of lanthanum ions on the sol–gel formation process. The results showed the inverse relation between the particle size and the concentration of the dopant used for the fabrication of NiO NPs, i.e., by increasing the amount of dopant, the particle size was reduced.
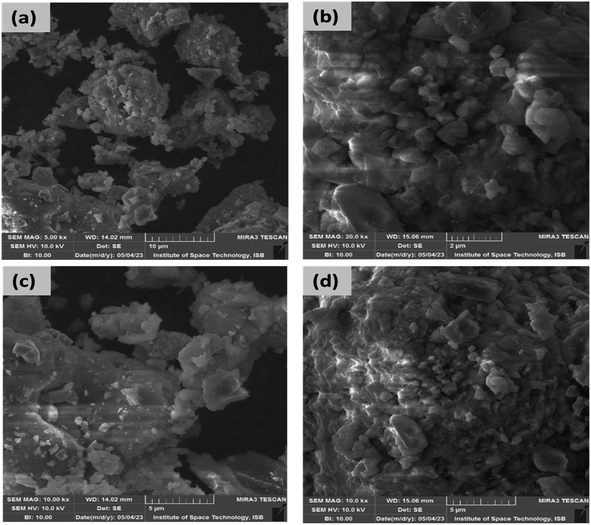 |
| | Fig. 4 SEM images of the synthesized pure and (1–3 wt%) La-doped nickel oxide nanoparticles; (a) pure, (b) 1%, (c) 2%, (d) 3%. | |
3.4. Energy dispersion spectroscopy (EDS) analysis
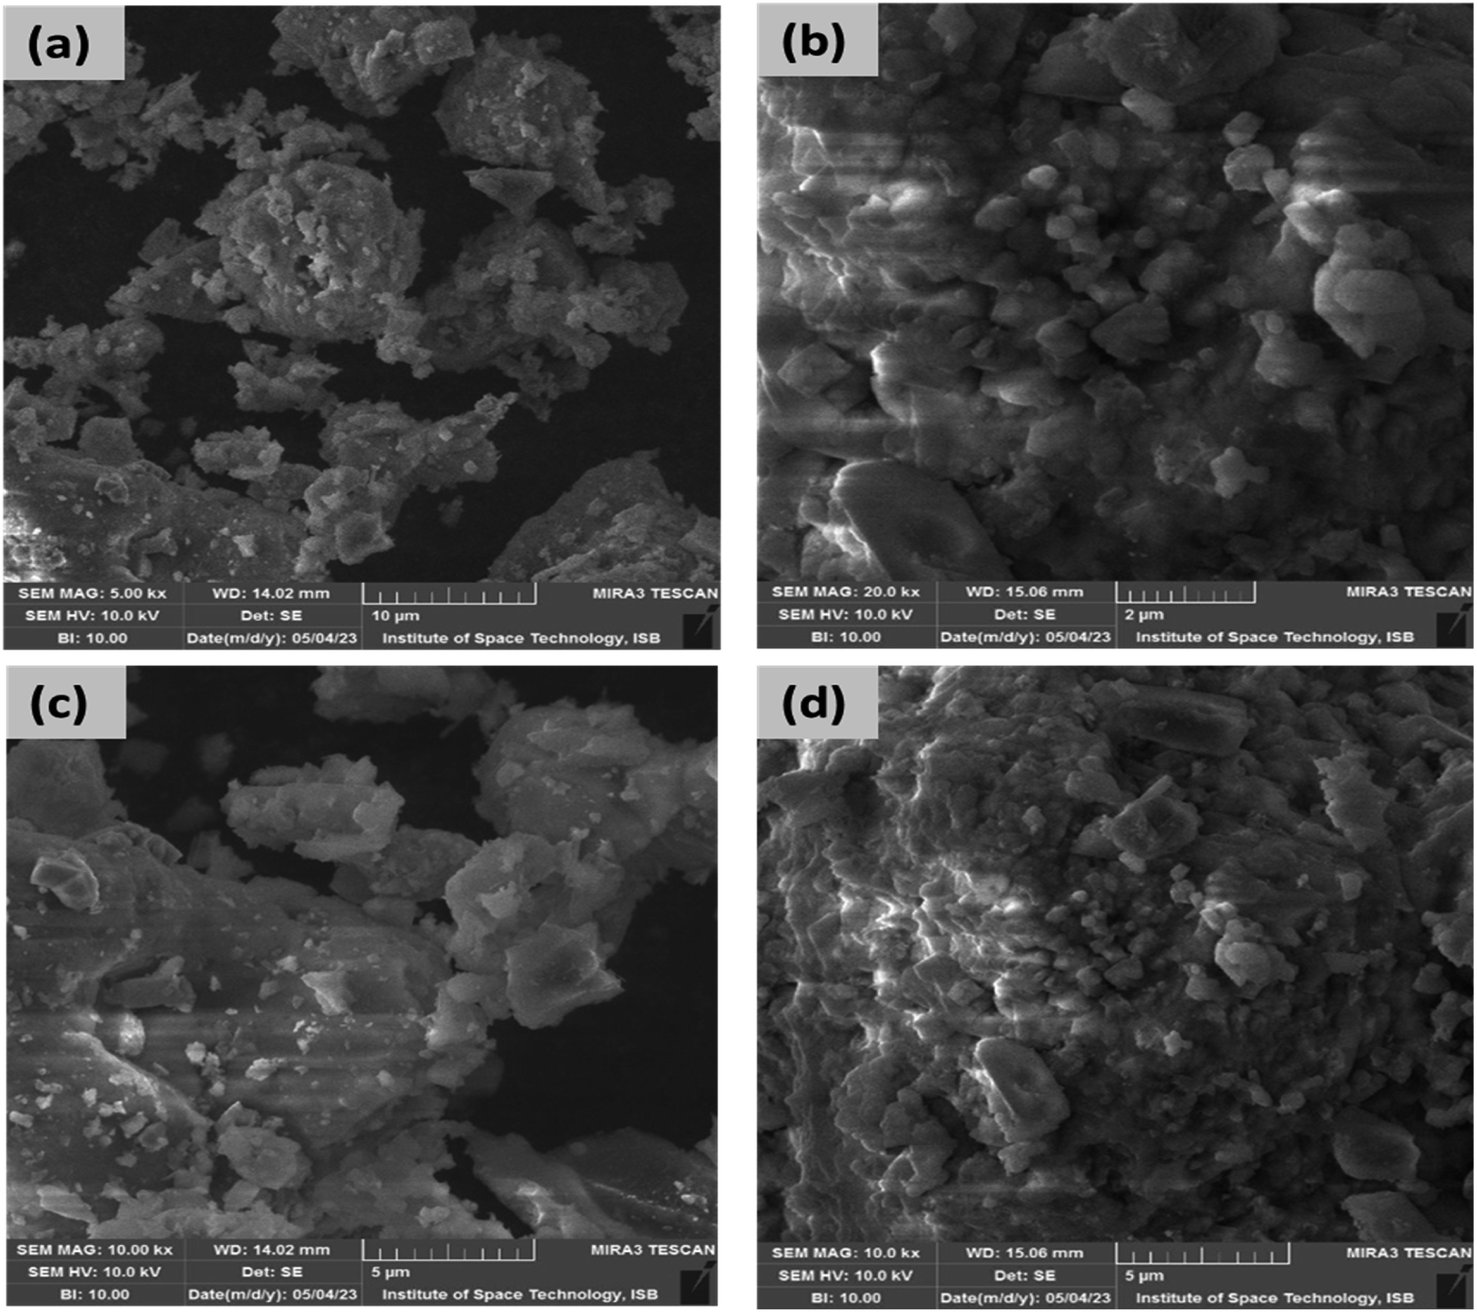
The elemental composition of the fabricated pure and doped NiO-NPs was analyzed by employing using the energy-dispersive X-ray (EDS) spectroscopy technique. Fig. 5 shows the EDS spectrum of the pure compound and 3% La-doped NiO NPs, which confirms that lanthanum is distributed on the surface of pure NiO-NPs with no other impurities present in the synthesized samples. The purity of the doped NiO-NPs demonstrated that there were no residuals of the chemicals, and then guaranteed their safe use in different applications.
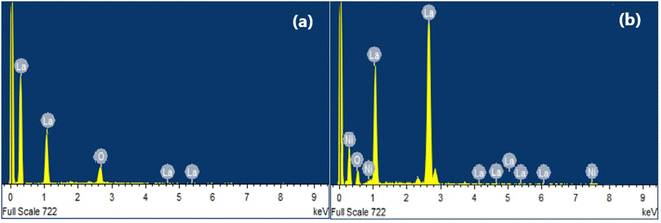 |
| | Fig. 5 EDS graph of the synthesized pure (a) and doped (b) nickel oxide nanoparticles. | |
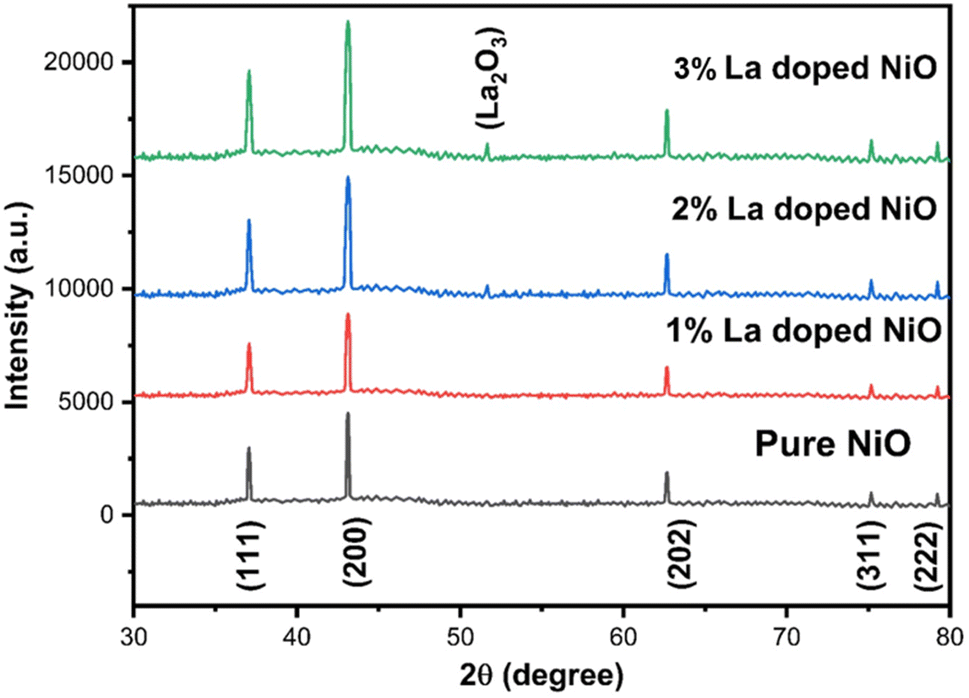
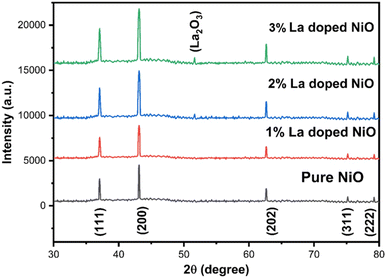
3.5. X-ray diffraction (XRD) analysis
Synthesized pure and doped nickel oxide nanoparticles were inspected for primary validation through powder XRD to evaluate crystallinity, phase, and purity. Fig. 6 shows the XRD peak pattern of the synthesized pure and doped nickel oxide, indicating a precise single (physical) phase with higher purity (indicated from narrow peaks) structure indexing to face-centered (FCC) cubic crystallinity (Fm3m space group) with the absence of any other impurity. The position of peaks emerging at an angle (2θ) with their respective Miller indices (hkl) is 37.20° (111), 43.20° (200), 62.87° (202), 75.20° (311), and 79.38° (222) of the bulk nickel oxide crystal plane, having characteristic peak locations and their relative intensities in accordance to the standard JCPDS No. 04-0835 pattern spectrum.36 Successful morphology in the manufacturing of pure nanomaterials was confirmed by the absence of the un-indexed peaks. The principle diffraction planes are all odd or even further support the FCC plane. Peak intensity is affected by lanthanum doping, which has similar behavior to the already reported La-doped NiO.37 The larger size and finished inner construction can be attributed to the higher diffraction peaks, and therefore crystallinity increased with the increase of the dopant. The absence of the additional dopant was confirmed by the non-appearance of the change or shift in the location of the peaks. The increase in the size and lattice parameters can be attributed to the ionic difference between Ni2+ (0.69 Å) and La3+ (1.16 Å).
 |
| | Fig. 6 XRD pattern of the synthesized pure and La-doped nickel oxide nanoparticles. | |
Using the Scherrer formula, the size of the produced pure and La-doped nickel oxide nanoparticles was calculated using the XRD diffraction line, which is represented in eqn (3).38
| |
D = kλ/β![[thin space (1/6-em)]](https://www.rsc.org/images/entities/char_2009.gif) cosθ cosθ
| (3) |
where
k = 0.94,
β,
λ, and
θ are the Scherrer constant, full width at half maxima, X-ray wavelength of Cu source, and the angle of diffraction, respectively. The calculated crystallite size of the fabricated metal oxide-based NiO was in the range of 13 to 35 nm, as shown in
Table 1. The results suggest that varying the concentration of the dopant in pure-NiO-NPs directly affects the size of the crystal. Moreover, there was no other peak corresponding to lanthanum detected, which confirmed that no additional phases were present except for La-NiO. Only the intensity of the peak was increased by doping, which was confirmed by increasing the concentration of the dopant crystal size. The micro-strain (
ε) and dislocation density (
δ) of the synthesized nanoparticles were calculated using the equations mentioned in the literature.
39| | |
ε = β/4tanθ
| (4) |
Table 1 Lattice parameters of pure and La-doped NiO particles
| Sample |
Peak position (200) (2θ0) |
Lattice parameters |
β (radian) |
Scherrer size (nm) |
d-Spacing (Å) |
Micro-strain (×10−3) |
Dislocation density (×1014 cm−2) |
| Pure NiO |
37.27 |
4.1656 |
0.01082 |
13.53 |
2.4051 |
8.002 |
5.47 |
| 1% La-doped NiO |
37.29 |
4.1700 |
0.00837 |
17.47 |
2.4076 |
6.2019 |
3.28 |
| 2% La-doped NiO |
37.32 |
4.1732 |
0.00581 |
25.18 |
2.4094 |
4.3063 |
1.58 |
| 3% La-doped NiO |
37.36 |
4.1754 |
0.00419 |
34.93 |
2.4107 |
3.1054 |
0.819 |
The measured values of micro-strain and dislocation density of synthesized nanoparticles for a particular plane (200) are given in Table 1, which can be influenced by substitution or relocation of atoms along with promiscuous grain distribution.
3.6. Photocatalytic activity
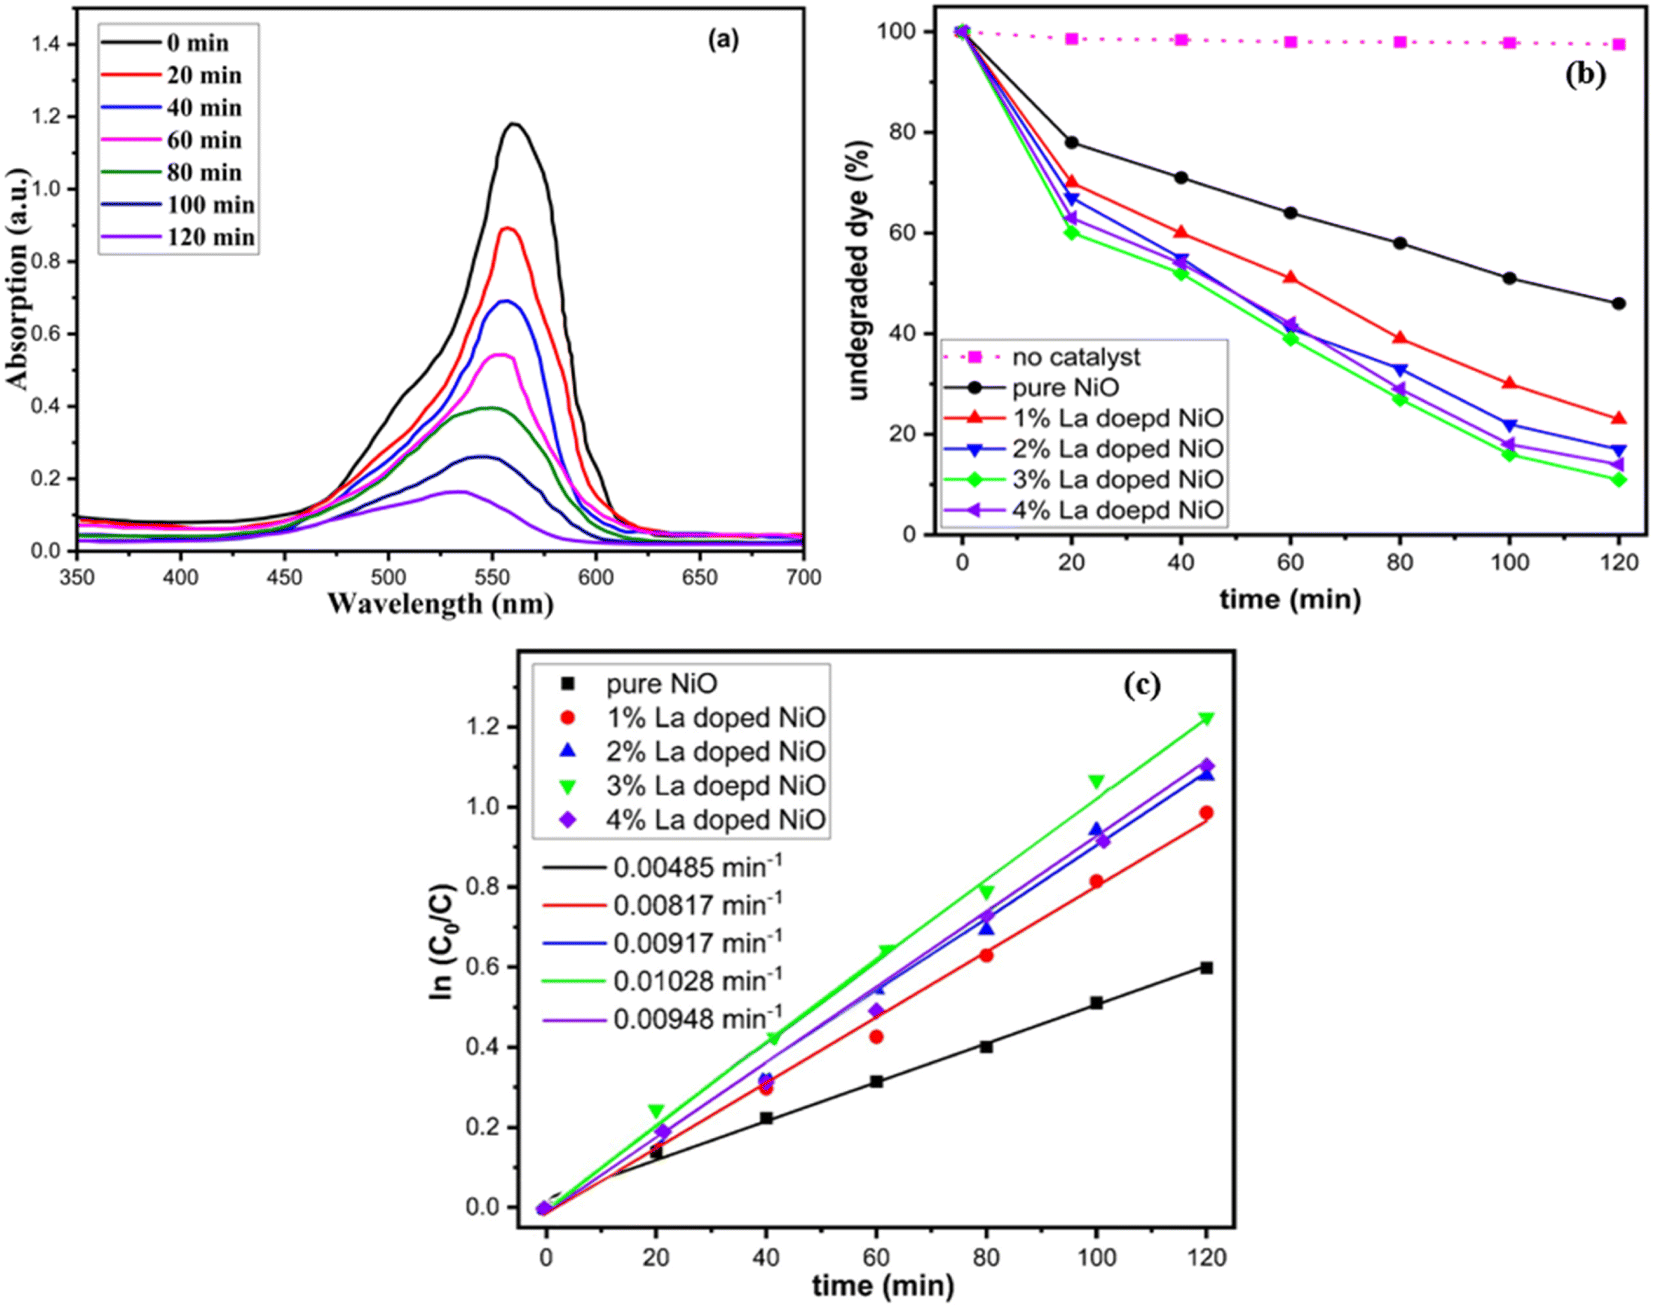
The photocatalytic activity of pure and La-doped NiO NPs was evaluated in the degradation of rhodamine B dye. The photocatalytic reactor with a UV-visible lamp of 300 W was used for the degradation of pollutants. Note that 25 mg/200 ml of the synthesized product was employed to initiate the photocatalytic treatment of the wastewater and monitor the degradation efficiency over time. This procedure was carried out in the dark at first, and a UV-visible absorption spectrum was used to record and calculate the maximum absorption value. Rhodamine dye (RhB) has the potential to be employed as a contaminant model. To measure the stability of pollutants under UV light irradiation, a normal dye solution without any nanostructure catalyst was used, as shown in Fig. 7. The proficiency of degradation was investigated for pure and La-doped NiO samples for every 20 minute time range. Initially, for 40 min, the placement of the reactor in the dark without the catalyst was to attain absorption–adsorption equilibrium. The suppression of the characteristic absorption peak indicates the degradation of the dye, as shown in Fig. 7(a). RhB dye was applied in the same manner to every sample. Factors such as temperature, pH, and catalyst loading were kept constant, as they can have a big impact on how quickly the photocatalytic degradation reactions occur.
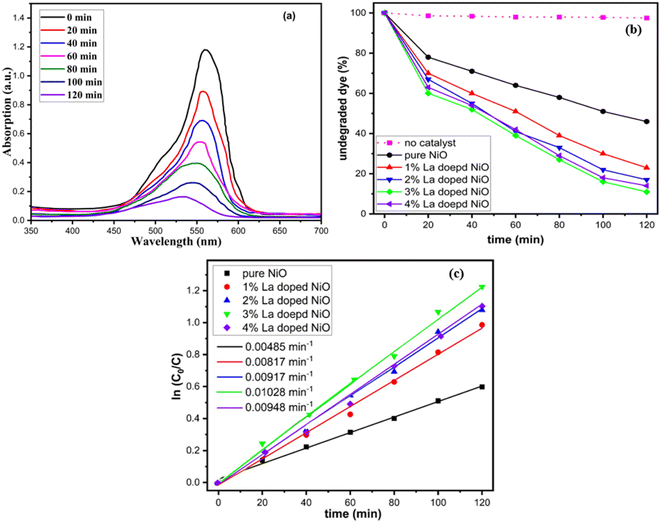 |
| | Fig. 7 (a) Degradation of RhB dye under UV-visible irradiation, (b) catalytic degradation efficiency, (c) rate constant of pure and La-doped NiO nanoparticle. | |
Quantitative measurement of organic contaminants was achieved using UV-visible analysis by monitoring the intensity of absorption at 554 nm, the characteristic peak value of RhB dye.40–42 The performance of nanostructure in photocatalysis could be primarily attributed to the band gap.43 The decrease in the band gap and Eg favors the electronic coupling of NiO with the contaminant molecule owing to quick charge transfer to the conduction band from the valence band and this band gap reduction permits quicker charge transfer to the Fermi level of the dye molecule from the photocatalyst. Thus, the dye molecule adsorption on the surface of the photocatalyst will take place in greater amounts, and the competence of dye degradation will be enhanced.44 The reduced light absorption, higher electron–hole pair recombination rate, and wider band gap of the pure nickel oxide nanomaterial resulted in restricted organic contaminant degradation. Impurity dopants were added to address these drawbacks, and the band gap effect and PL demonstrate that this considerably increased the light interaction capacity and narrowed the NiO band gap. Lanthanum-doped NiO exhibits distinctive behavior attributed to its extensive surface area, crystalline structure, and optimized band gap. These features facilitate efficient mass and diffusion transport of RhB molecules while slowing down the reaction rate of the photogenerated electron–hole pairs in the photocatalysis process. The presence of oxygen defects is crucial, effectively segregating the evolving electron–hole pairs during photocatalysis. Structural imperfections in the catalyst considerably impact the overall photocatalytic efficiency.45 The surface of the nanoparticles in the photocatalyst was able to absorb more UV-visible light by precisely adjusting the band gap. Remarkably, primarily because of the Burstein–Moss effect, the photocatalyst's efficiency increased with the impurity content, up to a certain threshold before declining, as shown in Fig. 7.46 As compared to pure NiO, the doped nanomaterials have greater dye degradation efficiency and the maximum degradation efficiency was observed from a 3% La-doped NiO sample.
Rhodamine B dye degraded to 54%, 73%, 77%, 84%, and 79% by 0%, 1%, 2%, 3%, and 4% pure and La-doped NiO samples, respectively. The results clearly indicated the enhancement in photocatalytic effectiveness of NiO by doping. Enlarging the dopant concentration improves the aptitude of photocatalytic activity, which may be accredited to the abridged photo-generated electron–hole recombination rate, which will intensify the accessibility of the charge carriers to initiate redox reactions, as discussed in PL studies.30 UV-vis analysis established the fact that the NiO band gap declined by introducing lanthanum, which permitted the effectual utilization of visible light. Moreover, the XRD study has demonstrated the reduction in particle size and upsurge of the active surface area by doping. Intensification of the active surface area allows greater contaminant molecules to stick to the surface of the photocatalyst and enable the photocatalytic reaction. Since an increase in the dopant concentration increased the active surface area and diminished the band gap, recombination rate, and crystallinity, the photocatalytic efficiency was boosted from 54% to 84% for a 3% doped sample.
3.7. Kinetic studies
Photocatalysis is a pseudo-first-order reaction. The Langmuir–Hinshelwood (L–H) model was employed to determine the photocatalytic reaction rate constant for the solid–liquid interface.47 Fig. 7(c) shows the rate constant for the degradation of RhB. A linear fitting of the graph between lnCo/Ct as a time function gave the rate constant value of 0.00485, 0.00817, 0.00917, 0.01028, and 0.00948 min−1 for 0–4% lanthanum-doped nickel oxide. The value of R2 was greater than 0.95 for all the linear fittings signifying a stronger co-relation of the L–H model. The greater rate constant was obtained for the 3% La-doped NiO samples. The rate constant was 2.2 times enhanced for RhB removal compared with that of pure NiO.
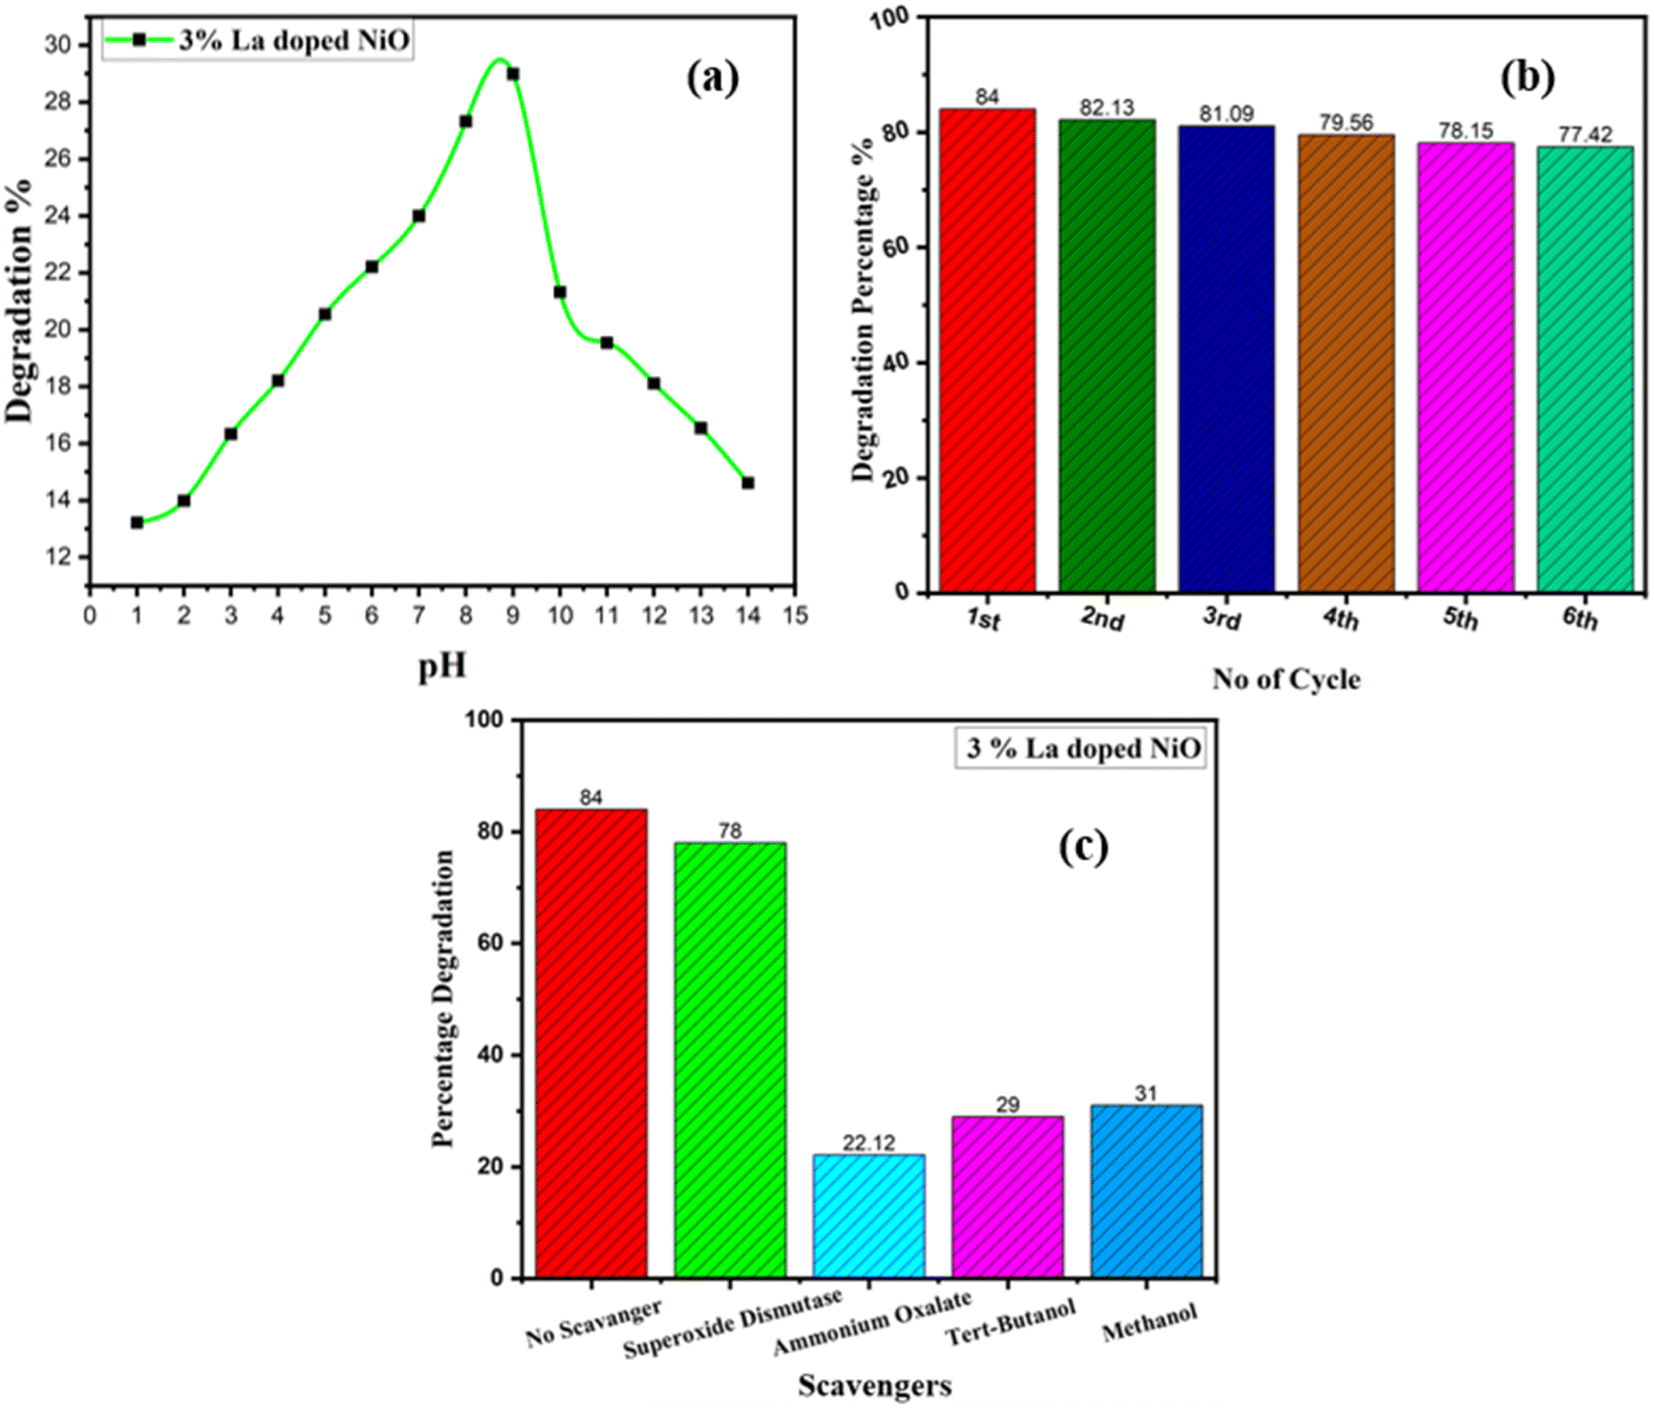
3.7.1 Effect of pH/optimal pH. In heterogeneous photocatalysis, the pH of the reaction mixture is critical. The impact of pH on the photocatalyst is attributed to the catalyst surface charge and the charge on the dye molecule. pH has the capability to impact the adsorption performance of adulterants on photocatalyst surfaces along with the surface charge traits.48 Variation in pH shifts the redox potential of the valence and conduction bands, which might influence the interfacial charge transfer.49 Investigation of pH impression on RhB by 3% La-doped NiO functioned at 1 to 14 pH range for half an hour. The pH of the mixture was varied before irradiation and was not maintained during the process. Fig. 8(a) shows the %degradation of RhB with 3% La-doped NiO at various pH values. The performance of degradation was improved with pH change and maximum deterioration was exhibited at pH 9, which is weakened by the further pH boost. The highest activity at alkaline pH could be credited to further facilitation of the adsorption of RhB (positively charged) on the photocatalyst (negatively charged) by electrostatic interaction, which enhances the photodegradation. The decline in photocatalytic efficiency at low pH could be related to the lower dissolution of the NiO nanostructure. RhB is a heterocyclic aromatic chemical compound and is a cationic dye. The absorption of dye molecules on the catalyst surface is highly favoured at higher pH, which resulted in greater degradation efficiency.50 Multiple research studies on moderated NiO signifying a greater of breakdown rate of multiple cationic dyes at higher pH have been previously documented.51,52
 |
| | Fig. 8 (a) Effect of pH on catalytic performance, (b) reusability of best sample (3% La doped NiO) for degradation of RhB dye, (c) scavenger experiment confirming contribution of hydroxyl radicals in photocatalytic reaction. | |
3.8. Mechanistic pathway for photocatalytic degradation by nanostructure
In the presence of a catalyst, photoexcitation of the material initiates photocatalytic degradation of the dye, resulting in the formation of electron–hole pairs. While some of these pairs move to the catalyst's surface, others combine with RhB. There, the electron functions as a reductant and the hole as a strong oxidant.53 As reactive intermediates are essential to the mineralization of the dye, hydroxyl radicals are produced by the breakdown of H2O or by the reaction of hydroxyl ions with holes (Fig. 9). However, dye molecules absorb electrons in the conduction band, resulting in the creation of dye radicals that are later eliminated. In this complex process, the separation and recombination paths of charge carriers become critical, and successful photocatalytic activity depends on keeping them from recombining.54 It is well-known documented that RhB is converted into various products, such as acetic acid, formic acid, benzoic acid, hydroxyl benzoic acid, aromatic dicarboxylic acid, poly hydroxyl benzoic acid, and hydroxyl benzoic acid.55,56
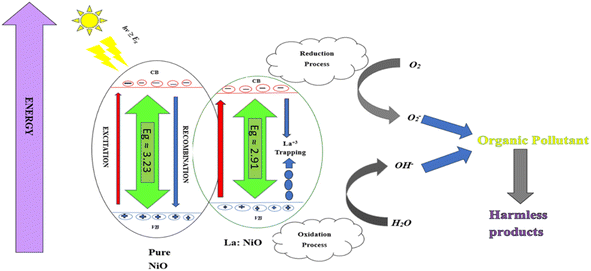 |
| | Fig. 9 Proposed reaction mechanism for RhB degradation via the free radical reaction. | |
3.9. Scavenger experiments and reusability/photostability
A complex photocatalysis reaction involves a number of reactive species such as free electrons (e−), holes (h+), and oxidation radicals. Radical trapping investigations using various reagents such as superoxide dismutase, ammonium oxalate, tertiary butanol, and methanol, for the best sample (3% La-doped NiO) were performed to confirm solely accountable active species for dye degradation. A greater disintegration rate was detected for the scavenger-free system, as illustrated in Fig. 8(b). Methanol helps in electron trapping, tertiary butanol acts as hydroxyl radicals, and ammonium oxalate as oxygen radical scavenging. Their addition has substantially weakened the degradation of dye by eclipsing hydroxyl, oxygen radicals, and electrons created during the reaction, demonstrating the contribution of hydroxyl, oxygen radicals, and electrons in the dye deterioration process. The addition of superoxide dismutase traps the holes and affirms the electrons and hydroxyl, oxygen radicals as major reactive species. The deterioration rate of the six cycles is shown in Fig. 8(c), which discloses the repeatability of the degradation rate. The absence of significant change in the rate of photocatalytic degradation was noticed, reflecting the stability of fabricated nanostructure.57 A comparison between the reported work and our result is tabulated in Table 2.
Table 2 Comparative assessment of studies on %degradation of pollutants from the academic literature
| Material |
Methodology |
Dye |
Reaction time (min) |
Catalytic dose (mg) |
Degradation (%) |
Reference |
| La-NiO |
Sol–gel |
Direct Bordeaux |
180 |
— |
65.2 |
58 |
| NiO/AgNbO3 |
Impregnation |
Methylene Blue |
180 |
100 |
90 |
59 |
| NiO |
Sol–gel |
Methylene Blue |
360 |
75 |
77.6 |
52 |
| NiO |
Biosynthesis |
Methylene Blue |
60 |
20 |
67 |
60 |
| GO@NiO |
Precipitation |
Rhodamine B |
100 |
100 |
17.3 |
61 |
| NiO/TiO2 |
Coprecipitation |
MB |
60 |
1 |
39.4 |
62 |
| La-doped NiO |
Combustion |
Rhodamine B |
120 |
25 |
84 |
Our work |
4. Conclusion
In this study, pure and La-doped NiO nanostructures were prepared using a cost-effective and facile sol–gel method. Structural, compositional, morphological, and optical characteristics of nanostructures were determined using several techniques such as XRD, EDX, SEM, UV-visible, and PL analysis. Primary XRD analysis confirmed the cubic crystallinity without the presence of unindexed peaks. Moreover, the alteration in position, intensity, crystalline size, and enhancement in the intensity of the peaks affirmed the thriving doping of lanthanum (La3+ ionic radii 1.16 Å) in the nanostructure of the Ni2+ (0.69 Å) crystal plane. The EDX study was performed for elemental composition, which confirmed the homogenous distribution of lanthanum. UV-vis and PL techniques were used to explore the optical characteristics, band gap, and e−/h+ recombination of the nanostructure. The band gap ranged from 3.28 to 2.91 eV, it decreased and then subsequently increased, which is attributed to the Burstein–Moss effect. This phenomenon results in a decline in both the PL intensity and recombination rates. The photodegradation of the understudied dye was tested and it was concluded that the doped material has a high degradation potential as compared to pure NiO. This increase was the maximum at which the dope concentration was 3%. The photodegradation mechanism path and the involvement of hydroxyl (OH˙) and superoxide radical anion (O2˙−) were predicted from the use of scavenger experiments. The highest dye degradation material was then examined in terms of cyclic stability, and it was observed that it remained stable for up to six cycles with about 77.42% efficiency.
Conflicts of interest
The authors declare that they have no competing interests.
Acknowledgements
The Deanship of Scientific Research at King Khalid University is greatly appreciated for research funding (R.G.P-2/518/44).
References
- A. K. Dwivedi, Int. Res. J. Nat. Appl. Sci., 2017, 4, 118–142 Search PubMed.
- F. N. Chaudhry and M. Malik, J. Ecosyst. Ecography, 2017, 7, 225–231 Search PubMed.
- S. Li, Z. Zhao, J. Zhao, Z. Zhang, X. Li and J. Zhang, ACS Appl. Nano Mater., 2020, 3, 1063–1079 CrossRef CAS.
- N. Taiba and D. Tayyiba, Environ. Chem. Ecotoxicol., 2021, 3, 59–75 CrossRef.
- Z. Chen, T. Dedova, I. O. Acik, M. Danilson and M. Krunks, Appl. Surf. Sci., 2021, 548, 149118 CrossRef CAS.
- M. Ruscello, T. Sarkar, A. Levitsky, G. M. Matrone, N. Droseros, S. Schlisske, E. Sachs, P. Reiser, E. Mankel and W. Kowalsky, Sustainable Energy Fuels, 2019, 3, 1418–1426 RSC.
- M. Shkir, A. Khan, K. V. Chandekar, M. Sayed, A. M. El-Toni, A. A. Ansari, S. F. Adil, H. Ghaithan, H. Algarni and S. AlFaify, Ceram. Int., 2021, 47, 15611–15621 CrossRef CAS.
- R. Ahmed and G. Nabi, J. Energy Storage, 2021, 33, 102115 CrossRef.
- J. L. Mason, H. Harb, J. E. Topolski, H. P. Hratchian and C. C. Jarrold, Acc. Chem. Res., 2019, 52, 3265–3273 CrossRef CAS PubMed.
- E. Pikalova, A. Kolchugin, V. Tsvinkinberg, V. Sereda, A. Khrustov and E. Filonova, J. Power Sources, 2023, 581, 233505 CrossRef CAS.
- M. N. Siddique and P. Tripathi, J. Alloys Compd., 2020, 825, 154071 CrossRef CAS.
- S. Aejitha, G. Dhanraj, T. Govindaraj, F. Maiz, M. Shkir, W. K. Kim, V. R. M. Reddy and D. H. Kim, Inorg. Chem. Commun., 2023, 156, 111172 CrossRef CAS.
- A. Huang, Y. He, Y. Zhou, Y. Zhou, Y. Yang, J. Zhang, L. Luo, Q. Mao, D. Hou and J. Yang, J. Mater. Sci., 2019, 54, 949–973 CrossRef CAS.
- V. Ganesh, L. Haritha, M. A. Manthrammel, M. Shkir and S. AlFaify, Phys. B, 2020, 582, 411955 CrossRef CAS.
- M. Shkir, B. Palanivel, A. Khan, N. Ahmad and A. Mani, Surf. Interfaces, 2021, 27, 101515 CrossRef CAS.
- M. Rabaa, M. Mezher, A. Aridi, D. Naoufal, M. I. Khalil, R. Awad and W. Abdeen, Catalysts, 2023, 13, 693 CrossRef CAS.
- M. Parashar, V. K. Shukla and R. Singh, J. Mater. Sci.: Mater. Electron., 2020, 31, 3729–3749 CrossRef CAS.
- H. Abbas, K. Nadeem, A. Hafeez, A. Hassan, N. Saeed and H. Krenn, Ceram. Int., 2019, 45, 17289–17297 CrossRef CAS.
- K. V. Chandekar, M. Shkir, A. Khan, M. Sayed, N. Alotaibi, T. Alshahrani, H. Algarni and S. AlFaify, J. Mater. Res. Technol., 2021, 15, 2584–2600 CrossRef CAS.
- D.-E. Lee, M.-K. Kim, M. Danish and W.-K. Jo, Catal. Commun., 2023, 106764 CrossRef CAS.
- S. D. Khairnar, A. N. Kulkarni, S. G. Shinde, S. D. Marathe, Y. V. Marathe, S. D. Dhole and V. S. Shrivastava, J. Photochem. Photobiol., 2021, 6, 100030 CrossRef.
- P. C. L. Muraro, S. R. Mortari, B. S. Vizzotto, G. Chuy, C. Dos Santos, L. F. W. Brum and W. L. da Silva, Sci. Rep., 2020, 10, 3055 CrossRef CAS PubMed.
- A. Haleem, A. Shafiq, S.-Q. Chen and M. Nazar, Molecules, 2023, 28, 1081 CrossRef CAS PubMed.
- S. Ahmad, M. Almehmadi, H. T. Janjuhah, G. Kontakiotis, O. Abdulaziz, K. Saeed, H. Ahmad, M. Allahyani, A. Aljuaid and A. A. Alsaiari, Water, 2023, 15, 175 CrossRef CAS.
- S. Lettieri, M. Pavone, A. Fioravanti, L. Santamaria Amato and P. Maddalena, Materials, 2021, 14, 1645 CrossRef CAS PubMed.
- F. T. Joorabi, M. Kamali and S. Sheibani, Mater. Sci. Semicond. Process., 2022, 139, 106335 CrossRef.
- S. K. Fanourakis, J. Peña-Bahamonde and D. F. Rodrigues, Environ. Sci.: Nano, 2020, 7, 3794–3804 RSC.
- A. Mehmood, K. Bibi, F. Ali, A. Nazir, Z. A. Sandhu, M. A. Raza, A. H. Bhalli, A. Ashraf, M. Aslam and A. G. Al-Sehemi, J. Mol. Liq., 2023, 123768 Search PubMed.
- A. Mirzaei, L. Yerushalmi, Z. Chen and F. Haghighat, J. Hazard. Mater., 2018, 359, 516–526 CrossRef CAS PubMed.
- M. Danish, H. Ayub, Z. A. Sandhu, A. Shoaib, S. Akram, J. Najeeb and S. Naeem, Appl. Nanosci., 2021, 11, 2503–2515 CrossRef CAS.
- A. A. Ezhilarasi, J. J. Vijaya, K. Kaviyarasu, L. J. Kennedy, R. J. Ramalingam and H. A. Al-Lohedan, J. Photochem. Photobiol., B, 2018, 180, 39–50 CrossRef PubMed.
- Y. Zhang, J. Zhou, W. Cai, J. Zhou and Z. Li, Appl. Surf. Sci., 2018, 430, 549–560 CrossRef CAS.
- A. Masood, T. Iqbal, M. Ashraf, A. Nazir, F. Ali, Q. A. Ranjha, M. Hussain, F. Al-Harbi and A. M. Galal, J. Inorg. Organomet. Polym. Mater., 2023, 1–14 Search PubMed.
- W. Zhou and H. Fu, Inorg. Chem. Front., 2018, 5, 1240–1254 RSC.
- N. Khalid, A. Hammad, M. Tahir, M. Rafique, T. Iqbal, G. Nabi and M. Hussain, Ceram. Int., 2019, 45, 21430–21435 CrossRef CAS.
- H. Qiao, Z. Wei, H. Yang, L. Zhu and X. Yan, J. Nanomater., 2009, 2009, 1–5 CrossRef.
- Z. Xiao, W. Zhou, B. Yang, C. Liao, Q. Kang, G. Chen, M. Liu, X. Liu, R. Ma and N. Zhang, Nano Mater. Sci., 2023, 5, 228–236 CrossRef CAS.
- M. Danish, M. Tayyab, A. Akhtar, A. A. Altaf, S. Kausar, S. Ullah and M. Iqbal, Inorg. Nano-Met. Chem., 2020, 51, 359–365 CrossRef.
- M. A. Islam, D. K. Sarkar, M. Shahinuzzaman, Y. A. Wahab, M. U. Khandaker, N. Tamam, A. Sulieman, N. Amin and M. Akhtaruzzaman, Nanomaterials, 2022, 12, 1933 CrossRef CAS PubMed.
- T. Adinaveen, T. Karnan and S. A. S. Selvakumar, Heliyon, 2019, 5, e01751 CrossRef CAS PubMed.
- G. Kale, S. Arbuj, U. Kawade, S. Rane, J. Ambekar and B. Kale, Mater. Chem. Front., 2018, 2, 163–170 RSC.
- A. H. Kianfar, M. A. Arayesh and M. M. Momeni, Appl. Phys. A: Mater. Sci. Process., 2021, 127, 1–9 CrossRef.
- M. Ramesh, M. P. C. Rao, S. Anandan and H. Nagaraja, J. Mater. Res., 2018, 33, 601–610 CrossRef CAS.
- S. Fatima, S. I. Ali, M. Z. Iqbal and S. Rizwan, RSC Adv., 2017, 7, 35928–35937 RSC.
- R. Vahini, P. S. Kumar and S. Karuthapandian, Appl. Phys. A: Mater. Sci. Process., 2016, 122, 744 CrossRef.
- S. M. Mariappan, M. Shkir, T. Alshahrani, V. Elangovan, H. Algarni and S. AlFaify, J. Alloys Compd., 2021, 859, 157762 CrossRef CAS.
- J. Malleshappa, H. Nagabhushana, S. Sharma, Y. Vidya, K. Anantharaju, S. Prashantha, B. D. Prasad, H. R. Naika, K. Lingaraju and B. Surendra, Spectrochim. Acta, Part A, 2015, 149, 452–462 CrossRef CAS PubMed.
- A. J. Christy and M. Umadevi, Mater. Res. Bull., 2013, 48, 4248–4254 CrossRef.
- T. Liu, Y. Wang, C. Liu, X. Li, K. Cheng, Y. Wu, L. Fang, F. Li and C. Liu, Environ. Sci. Technol., 2020, 54, 4810–4819 CrossRef CAS PubMed.
- D. Dey and M. Patra, J. Org. Inorg. Chem., 2015, 1, 1–7 Search PubMed.
- A. Akbari, Z. Sabouri, H. A. Hosseini, A. Hashemzadeh, M. Khatami and M. Darroudi, Inorg. Chem. Commun., 2020, 115, 107867 CrossRef CAS.
- R. Vyas, K. Navin, G. K. Tripathi and R. Kurchania, Optik, 2021, 231, 166433 CrossRef CAS.
- O. P. Kumar, M. N. Ashiq, S. S. A. Shah, S. Akhtar, M. A. A. Obaidi, I. M. Mujtaba and A. ur Rehman, Mater. Sci. Semicond. Process., 2021, 128, 105748 CrossRef CAS.
- M. Elansary, M. Belaiche, O. Oulhakem, K. B. Alaoui, O. Lemine, Y. Mouhib, E. Iffer, B. Salameh and A. Alsmadi, Mater. Res. Bull., 2023, 112598 Search PubMed.
- D. D. Thongam, J. Gupta and N. K. Sahu, SN Appl. Sci., 2019, 1, 1030 CrossRef CAS.
- Z.-H. Diao, J.-J. Liu, Y.-X. Hu, L.-J. Kong, D. Jiang and X.-R. Xu, Sep. Purif. Technol., 2017, 184, 374–383 CrossRef CAS.
- D. Wang, J. Li, Z. Xu, Y. Zhu, G. Chen and Z. Cui, J. Mater. Sci., 2019, 54, 11417–11434 CrossRef CAS.
- P. Liu, Z. Yang and P. Ran, Second International Conference on Smart Materials and Nanotechnology in Engineering, 2009, DOI:10.1117/12.840080.
- K. Rambabu, G. Bharath, F. Banat and P. L. Show, J. Hazard. Mater., 2021, 402, 123560 CrossRef CAS PubMed.
- S. Ravichandran, P. Sengodan and J. Radhakrishnan, Ceram. Int., 2023, 49, 12408–12414 CrossRef CAS.
- E. I. Khalaf, N. M. El-Shafai, A. M. Nassar, E. E. Assem, I. S. Yahia and I. M. El-Mehasseb, Spectrochim. Acta, Part A, 2023, 286, 121949 CrossRef CAS PubMed.
- W. Mohammed, M. Matalkeh, R. M. Al Soubaihi, A. Elzatahry and K. M. Saoud, ACS Omega, 2023, 8, 40063–40077 CrossRef CAS PubMed.
|
| This journal is © The Royal Society of Chemistry 2024 |
Click here to see how this site uses Cookies. View our privacy policy here. 
 Open Access Article
 This Open Access Article is licensed under a
  b,
Muhammad Asam Raza
b,
Muhammad Asam Raza