 Open Access Article
The absorption properties of ZrO2 nanoparticles in the THz and sub-THz frequency ranges†
Jessica MacDougall ,
Asuka Namai
 *,
Fangda Jia
 ,
Marie Yoshikiyo
 and
Shin-ichi Ohkoshi
 *
*
Department of Chemistry, School of Science, The University of Tokyo, 7-3-1 Hongo, Bunkyo-ku, Tokyo 113-0033, Japan. E-mail: asuka@chem.s.u-tokyo.ac.jp; ohkoshi@chem.s.u-tokyo.ac.jp
First published on 6th March 2024
Abstract
As terahertz (THz) and sub-THz region electromagnetic waves are becoming vital for industrial applications such as 5G wireless communication, so too are THz and sub-THz wave absorbing materials. Herein, we report the optical properties of monoclinic zirconia (m-ZrO2) nanoparticles in these frequency regions, with different crystalline sizes. The crystalline sizes of the three samples, measured by transmission electron microscopy, are 93 ± 23 nm (denoted 1), 28 ± 14 nm (denoted 2) and 2.6 ± 0.7 nm (denoted 3). X-ray diffraction and Raman spectra show that 1 and 2 have high crystallinity whereas 3 shows peak broadening due to its small crystalline size. Terahertz time-domain spectroscopy (THz-TDS) measurements of pelletised samples show that the small crystalline size sample exhibits larger absorption, e.g., the absorbance value at 300 GHz is 0.18 mm−1 (1), 0.04 mm−1 (2) and 1.11 mm−1 (3), and the related dielectric loss value (ε′′) is 0.04 (1), 0.01 (2) and 0.82 (3), respectively. This is considered to be due to the proportional increase in surface water molecules for the small particle size sample due to the relative increase in surface area and under-coordinated atoms, shown by IR spectra. These results show that small crystalline size m-ZrO2 nanoparticles have potential as THz and sub-THz wave absorbing materials, which are crucial for noise reduction in THz and sub-THz wave technologies.
Introduction
Zirconium dioxide (ZrO2), commonly known as zirconia, is a ceramic material that exhibits beneficial properties such as chemical and thermal stability, low thermal conductivity, high resistivity, high refractive index, and mechanical strength.1,2 ZrO2 is widely used in various fields, including refractories,3 electro- and bioceramics,4,5 fuel cell,6 optical devices,7 oxygen sensors,8 and catalysts.9–11 Furthermore, ZrO2 is under investigation for its potential use as a gate dielectric material.12 ZrO2 has three major crystalline phases: monoclinic (m-ZrO2),13 tetragonal (t-ZrO2)14,15 and cubic (c-ZrO2).16 In bulk form, m-ZrO2 is the stable phase at temperatures below 1170 °C under ambient pressure, belonging to the monoclinic P21/c space group. The t-ZrO2 crystal structure belongs to the tetragonal P42/nmc space group and is stable at 1170–2370 °C. c-ZrO2 is stable above 2370 °C in bulk form. The crystalline phase is also dependent on factors such as crystalline size,17 temperature,18 and pressure.19,20In recent years, millimetre waves (30–300 GHz) in the sub-THz region have gained prominence for their use in various Internet of Things (IoT) technologies.21–28 In wireless communications, fifth generation (5G) mobile systems are anticipated to use millimetre waves. Millimetre wave absorbers, such as epsilon iron oxide (ε-Fe2O3), are expected to play a crucial role for noise suppression in these technology fields.29–37 Furthermore, the sub-THz region above 300 GHz is being considered as a candidate for the next-generation carrier frequency, particularly for beyond 5G technologies, therefore it is important to develop materials that can absorb sub-THz waves. To effectively absorb sub-THz waves, a high dielectric constant (ε′′) is necessary, though currently there are not so many reports regarding such high frequencies. Our investigations have focused on the optical properties of metal oxides within this high frequency region. For ZrO2, although the optical properties have been extensively studied in the ultraviolet (UV)-visible-infrared (IR) region,38 optical studies within the THz region, especially the sub-THz region, remain limited. Herein, we investigated the optical properties of m-ZrO2 nanoparticles with different sizes, i.e., 93 ± 23 nm (denoted as 1), 28 ± 14 nm (denoted as 2) and 2.6 ± 0.7 nm (denoted as 3). In this study, we report the morphology and crystal structure analyses, alongside the optical properties in the sub-THz wave region using terahertz time domain spectroscopy (THz-TDS). We found that small size m-ZrO2 nanoparticles exhibit strong sub-THz wave absorption, indicating their potential as a sub-THz absorber.
Experimental
Materials
Powder form samples of 1, 2 and 3 were prepared. 1 and 2 were purchased as white powders from Wako Pure Chemical Industries Ltd and MSE Supplies LLC, respectively. 3 was prepared from a colloidal aqueous dispersion of ZrO2 nanoparticles provided by Daiichi Kigenso Kagaku Kogyo Co., Ltd using a sol containing 10 wt% ZrO2 in a neutral aqueous media, which was dried to provide a white powder sample.Elemental analysis was run using X-ray fluorescence (XRF) measurements. Calcd for 96% ZrO2, 4% HfO2: Zr, 71%; Hf, 3%; O 26%. Found Zr, 70%; Hf, 3%; O 27% (1), Zr, 70%; Hf, 3%; O 27% (2) and Zr, 68%; Hf, 3%; O 29% (3). HfO2 is often found as an impurity in commercially available ZrO2 reagents due to the difficulty of separation.
Physical measurements
Elemental analysis was performed by XRF measurements using a Rigaku ZSX Primus IV/NT XRF spectrometer. Powder X-ray diffraction (PXRD) measurements were conducted on a Rigaku Ultima IV with Cu Kα radiation (λ = 1.5418 Å) and Rietveld analysis was performed with Rigaku PDXL2 software. Transmission electron microscopy (TEM) images were taken using a JEOL JEM 2000EX II microscope, and high-resolution scanning TEM (HRSTEM) images were taken using a JEM-ARM200F Thermal FE (STEM SDD). Raman spectra of pelletized samples were taken using a JASCO NRS-7500 laser Raman spectrophotometer. IR spectra were taken of pelletised samples diluted with KBr, using a JASCO FTIR-4100 spectrophotometer.Results and discussion
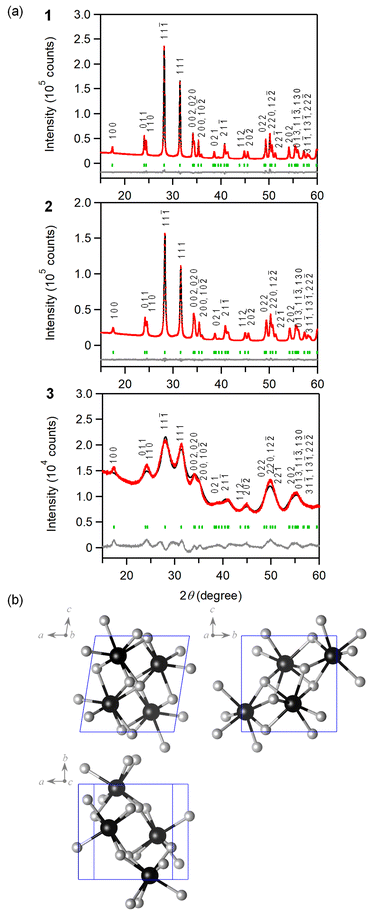
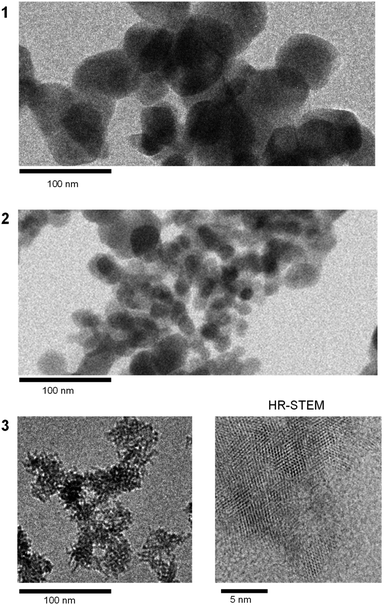
Fig. 1a displays the PXRD for all samples, with diffraction peaks attributed to m-ZrO2 (Fig. 1b and S1†). The diffraction peaks for 1 and 2 are sharp, indicating larger crystalline sizes, whereas the peaks for 3 are considerably broader, indicating that 3 has smaller crystalline size compared to 1 and 2. The TEM images further corroborate these findings, showing nanoparticles measuring 93 ± 23 nm for 1, 28 ± 14 nm for 2 and notably smaller particles of 2.6 ± 0.7 nm for 3 (Fig. 2 and S2†). Fig. 3 shows the Raman spectra for 1, 2 and 3 in the range of 100–1200 cm−1. 1 shows strong distinct peaks assigned to m-ZrO2 (ref. 39 and 40) 97 cm−1 (Ag), 177 cm−1 (Bg), 189 cm−1 (Ag), 221 cm−1 (Bg), 305 cm−1 (Bg), 331 cm−1 (Bg), 346 cm−1 (Ag), 381 cm−1 (Ag), 474 cm−1 (Ag), 502 cm−1 (Bg), 536 cm−1 (Bg), 557 cm−1 (Ag), 615 cm−1 (Bg), 636 cm−1 (Ag), 753 cm−1 (Bg). There are two small unidentified peaks at 448 cm−1 and 578 cm−1 which are also reported in previous studies.41,42 2 shows a similar spectrum to 1. 3 shows a spectrum with broad peaks, which can be fitted with similar peak positions to 1, though there are small frequency shifts indicating a particle size-dependent effect. Notably, the peak widths increase progressively in the order of 1 to 2 to 3. For example, focusing on the peak assigned to the Ag mode at around 189 cm−1, the full width at half maximum (FWHM) increases from 6 cm−1 (1) to 7 cm−1 (2) and significantly to 21 cm−1 (3). These broadening effects are reportedly due to the disruption of the crystalline periodic structure caused by a reduction in crystal size.43–45 Besides the peaks attributed to the lattice vibrational modes of m-ZrO2, 3 has an intense peak at ∼1050 nm, denoted as S. This S peak can be attributed to an additional surface vibrational mode, which is uniquely observed in m-ZrO2 nanoparticles that are smaller than 15 nm in crystalline size.45 The full assignment of the vibrational modes can be found in Table 1 and Fig. S3.†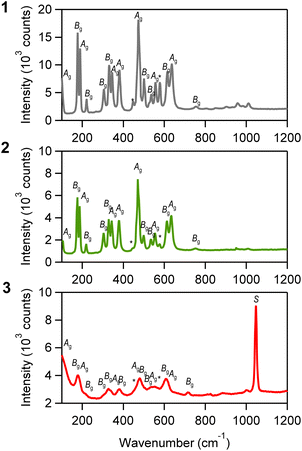 | ||
| Fig. 3 Raman spectra of 1–3. Asterisks denote the unknown peaks. Unassigned peaks in the range of 760–1030 cm−1 are overtone or combination peaks. | ||
| Mode unit: cm−1 | 1 | 2 | 3 | |||
|---|---|---|---|---|---|---|
| Position | (Width) | Position | (Width) | Position | (Width) | |
| Ag | 97 | (15) | 102 | (11) | 93 | (91) |
| Bg | 177 | (6) | 175 | (7) | 175 | (15) |
| Ag | 189 | (6) | 187 | (7) | 184 | (21) |
| Bg | 221 | (7) | 219 | (7) | 211 | (27) |
| Bg | 305 | (11) | 304 | (11) | 303 | (28) |
| Bg | 331 | (10) | 329 | (10) | 324 | (27) |
| Ag | 346 | (10) | 344 | (10) | 341 | (26) |
| Ag | 380 | (12) | 379 | (13) | 382 | (34) |
| Ag | 474 | (15) | 472 | (15) | 479 | (34) |
| Bg | 502 | (10) | 499 | (14) | 503 | (41) |
| Bg | 536 | (14) | 534 | (12) | 531 | (32) |
| Ag | 557 | (10) | 555 | (12) | 554 | (35) |
| Bg | 615 | (13) | 612 | (13) | 608 | (34) |
| Ag | 636 | (16) | 634 | (18) | 634 | (42) |
| Bg | 753 | (39) | 754 | (35) | 755 | (46) |
| S | — | — | — | — | 1047 | (11) |
Absorption spectrum in THz wave region
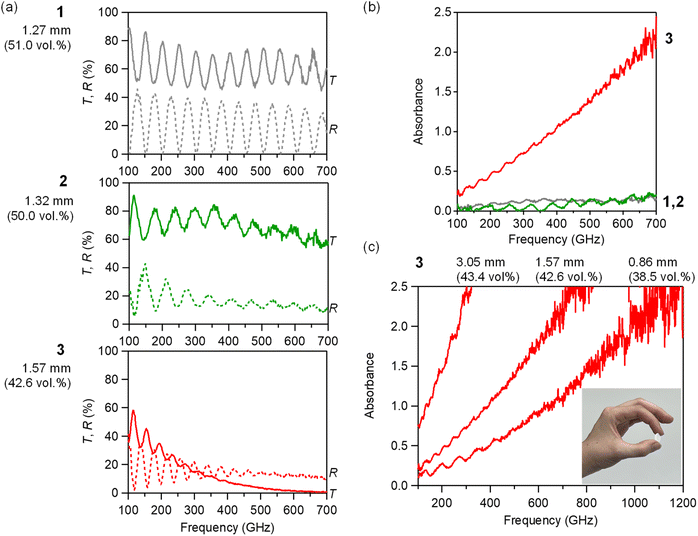
The optical properties of the m-ZrO2 nanoparticles in the THz and sub-THz wave region were measured by THz-TDS (Advantest TAS 7400TS). A THz pulse was irradiated onto the sample and the transmitted and reflected THz pulses were measured in the time domain, Fig. S5.† The spectra are obtained by Fourier transformation. 13 mmφ pellet samples were prepared for the measurement, where the thicknesses (d) were 1.27 mm, 1.32 mm and 1.57 mm, and the volume filling ratios were 51.0 vol%, 50.1 vol% and 42.6 vol% for 1, 2 and 3, respectively. Note that the effective path length is almost the same: 0.66 mm for 1, 0.66 mm for 2, and 0.67 mm for 3. The pellets were dried in vacuum at 60 °C overnight before the measurement. The transmittance and reflection spectra for each sample are shown in Fig. 4a, and the subsequent absorption spectra are shown in Fig. 4b. For all samples, the absorption increases with increasing frequency, and fringe patterns are observed which are caused by multiple reflections within the samples. The absorbance at 300 GHz is 0.12 for 1, 0.03 for 2 and a significantly higher 0.74 for 3. The calibrated absorbances, considering the thickness and filling ratios are 0.18 mm−1 for 1, 0.04 for mm−1 for 2 and 1.11 mm−1 for 3.To further investigate the THz wave absorption performance of 3, we prepared two additional samples with varying pellet thicknesses (Fig. 4c). Notably, the sample with a thickness of 3.05 mm (effective path: 1.33 mm) showed complete absorbance of the 300 GHz millimetre wave, achieving an absorbance of 2.5 (99.7% absorption). At a higher frequency of 1 THz, 3 demonstrates the absorbance of 2.0 (99% absorption), even with a thickness of 0.86 mm (effective path: 0.33 mm). Absorbers reported for the THz wave region are mainly metamaterials.46–49 3 exhibits absorption properties even as a single-phase material.
Complex permittivity in THz wave region
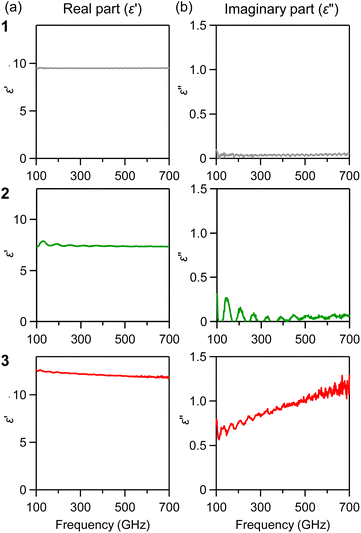
The complex permittivity (ε = ε′ + iε′′) is an intrinsic parameter regarding the material's absorption properties. We derived the complex permittivity from the absorption spectra, considering both the pellet thickness, multiple reflections, and volume filling ratios. Fig. 5a shows the real part (ε′), which is almost constant in the sub-THz region, e.g., the ε′ values at 300 GHz are 9.5 for 1, 7.4 for 2 and 12.2 for 3. The imaginary part (ε′′), often referred to as the dielectric loss since this term contributes to energy dissipation, increases with increasing frequency (Fig. 5b). The ε′′ value greatly increases for the smallest particle size, e.g., the ε′′ values at 300 GHz are 0.04 for 1, 0.01 for 2 and 0.82 for 3.Mechanism of increase of THz wave absorption
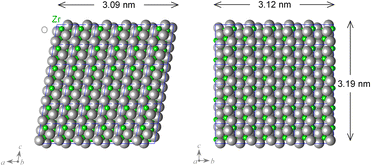
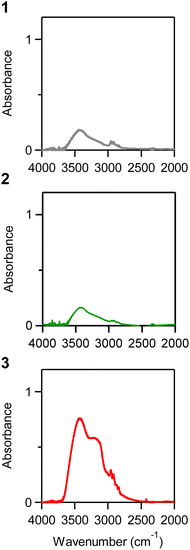
One possible reason that m-ZrO2 with small particle size (3) exhibits stronger THz wave absorption might be due to chemisorbed water on the surface. Smaller particles can possess a larger surface area in comparison to their volume, leading to an increase in chemisorbed water. For simplicity, let us consider a cubic shaped ZrO2 nanoparticle with edge lengths of 93 nm, 28 nm and 3 nm. The percentages of the undercoordinated atoms exposed on the surface are approximately 1.1%, 3.7% and 30%, respectively (Fig. 6). Therefore, at this small size, the proportion of chemisorbed water on the surface of the nanoparticle in comparison to the nanoparticle volume, can be increased compared to larger particles. It should be noted that ZrO2 is known for its propensity to chemisorb water molecules on its surface.50–52 The water molecules on the surface can increase the dielectric loss through the relaxation of the water molecule dipoles.53,54 Therefore, we investigated the IR spectra of the samples. Each sample was dried in vacuum at 60 °C overnight before the measurement, ground with a set amount of KBr, and then pelletized. Fig. 7 shows the IR spectra. 1 and 2 show a small broad peak at 3450 cm−1 which is attributed to the stretching of OH bonds indicating an existence of small amount of water molecules on the surface.55 In 3, the broad peak at 3400 cm−1 becomes 4.4 times stronger compared to 1. The relaxation of the dipole moment of chemisorbed water molecules results in an increase in dielectric loss ε′′ in the sub-THz region, leading to the absorption of sub-THz waves. With smaller particles, the amount of chemisorbed water on the surface proportionally increases, and sub-THz absorption intensity increases. As above, while the ratio of surface atoms is 1.1% for 93 nm and 3.7% for 28 nm size particles, it reaches 30% for 3 nm size m-ZrO2 particles, which is why the effect is significantly evident in 3.Conclusions
In the present study, we investigated m-ZrO2 nanoparticles with different crystalline sizes, i.e., 93 nm, 27 nm, and 2.6 nm. The absorbance and dielectric loss increase for the sample with very small particle size, e.g., at 300 GHz, the ε′′ value is 0.04 (1), 0.01 (2) and 0.82 (3). The IR spectra show the existence of water molecules in 3, chemisorbed on the particle surface, indicating the absorption performance is due to a proportional increase in chemisorbed water molecules. It is important to observe the optical properties of m-ZrO2 nanoparticles in the sub-THz wave region. In addition, the particle size effect on the optical properties in THz wave region shows the importance of controlling particle size when developing new functional nanomaterials.56–59 The present study showed that small particle size m-ZrO2 has potential to be an absorber in THz wave technologies such as beyond 5G, advanced driver assistance systems (ADAS) and non-contact biological monitoring, in order to ensure stable operation with reduced noise.60–72Conflicts of interest
There are no conflicts to declare.Acknowledgements
This work was supported in part by a Grant-in-Aid for Scientific Research (A, B) from the Japan Society for the Promotion of Science (JSPS) (Grant Number 20H00369, 23H01920). We recognize the Cryogenic Research Center at The University of Tokyo, DOWA Technofund, and the Center for Nano Lithography & Analysis at The University of Tokyo. We are grateful to Daiichi Kigenso Kagaku Kogyo Co., Ltd. for providing the samples and discussions.Notes and references
- P. F. Manicone, P. Rossi Iommetti and L. Raffaelli, J. Dent., 2007, 35, 819–826 CrossRef CAS PubMed.
- R. H. J. Hannink, P. M. Kelly and B. C. Muddle, J. Am. Ceram. Soc., 2000, 83, 461–487 CrossRef CAS.
- J. Chevalier, L. Gremillard, A. V. Virkar and D. R. Clarke, J. Am. Ceram. Soc., 2009, 92, 1901–1920 CrossRef CAS.
- V. V. Kharton, F. M. B. Marques and A. Atkinson, Solid State Ionics, 2004, 174, 135–149 CrossRef CAS.
- C. Piconi and G. Maccauro, Biomaterials, 1999, 20, 1–25 CrossRef CAS PubMed.
- S. B. Adler, Chem. Rev., 2004, 104, 4791–4844 CrossRef CAS PubMed.
- U. Anselmi-Tamburini, J. N. Woolman and Z. A. Munir, Adv. Funct. Mater., 2007, 17, 3267–3273 CrossRef CAS.
- R. Ramamoorthy, P. K. Dutta and S. A. Akbar, J. Mater. Sci., 2003, 38, 4271–4282 CrossRef CAS.
- J. Xue, J. Xie, W. Liu and Y. Xia, Acc. Chem. Res., 2017, 50, 1976–1987 CrossRef CAS PubMed.
- J. Yang, J. Ren, H. Guo, X. Qin, B. Han, J. Lin and Z. Li, RSC Adv., 2015, 5, 59935–59945 RSC.
- J. Dou, R. Zhang, X. Hao, Z. Bao, T. Wu, B. Wang and F. Yu, Appl. Catal., B, 2019, 254, 612–623 CrossRef CAS.
- E. W. Leib, R. M. Pasquarelli, J. J. do Rosário, P. N. Dyachenko, S. Döring, A. Puchert, A. Y. Petrov, M. Eich, G. A. Schneider, R. Janssen, H. Weller and T. Vossmeyer, J. Mater. Chem. C, 2015, 4, 62–74 RSC.
- D. K. Smith and W. Newkirk, Acta Crystallogr., 1965, 18, 983–991 CrossRef CAS.
- T. K. Gupta, J. H. Bechtold, R. C. Kuznicki, L. H. Cadoff and B. R. Rossing, J. Mater. Sci., 1977, 12, 2421–2426 CrossRef CAS.
- G. Teufer, Acta Crystallogr., 1962, 15, 1187 CrossRef CAS.
- M. H. Bocanegra-Bernal and S. D. de la Torre, J. Mater. Sci., 2002, 37, 4947–4971 CrossRef CAS.
- A. Suresh, M. J. Mayo, W. D. Porter and C. J. Rawn, J. Am. Chem. Soc., 2003, 86, 360–362 CAS.
- A. H. Heuer, R. Chaim and V. Lanteri, Acta Metall., 1987, 35, 661–666 CrossRef CAS.
- P. Bouvier, E. Djurado, G. Lucazeau and T. Le Bihan, Phys. Rev. B: Condens. Matter Mater. Phys., 2000, 62, 8731–8737 CrossRef CAS.
- M. Yashima, T. A. Kato, M. Kakihana, M. A. Gulgun, Y. Matsuo and M. Yoshimura, J. Mater. Res., 1997, 12, 2575–2583 CrossRef CAS.
- J. Cheng, H. Zhang, M. Ning, H. Raza, D. Zhang, G. Zheng, Q. Zheng and R. Che, Adv. Funct. Mater., 2022, 32, 2200123 CrossRef CAS.
- Y. Yan, G. Xie, M. P. J. Lavery, H. Huang, N. Ahmed, C. Bao, Y. Ren, Y. Cao, L. Li, Z. Zhao, A. F. Molisch, M. Tur, M. J. Padgett and A. E. Willner, Nat. Commun., 2014, 5, 4876 CrossRef CAS PubMed.
- S. Rangan, T. S. Rappaport and E. Erkip, Proc. IEEE, 2014, 102, 366–385 Search PubMed.
- S. Koenig, D. Lopez-Diaz, J. Antes, F. Boes, R. Henneberger, A. Leuther, A. Tessmann, R. Schmogrow, D. Hillerkuss, R. Palmer, T. Zwick, C. Koos, W. Freude, O. Ambacher, J. Leuthold and I. Kallfass, Nat. Photonics, 2013, 7, 977–981 CrossRef CAS.
- J. Capmany and D. Novak, Nat. Photonics, 2007, 1, 319–330 CrossRef CAS.
- J. Ma, R. Shrestha, J. Adelberg, C.-Y. Yeh, Z. Hossain, E. Knightly, J. M. Jornet and D. M. Mittleman, Nature, 2018, 563, 89–93 CrossRef CAS PubMed.
- R. Appleby and R. N. Anderton, Proc. IEEE, 2007, 95, 1683–1690 CAS.
- J. Federici and L. Moeller, J. Appl. Phys., 2010, 107, 111101 CrossRef.
- S. Ohkoshi and H. Tokoro, Bull. Chem. Soc. Jpn., 2013, 86, 897–907 CrossRef CAS.
- J. Jin, K. Hashimoto and S. Ohkoshi, J. Mater. Chem., 2005, 15, 1067–1071 RSC.
- S. Sakurai, J. Jin, K. Hashimoto and S. Ohkoshi, J. Phys. Soc. Jpn., 2005, 74, 1946–1949 CrossRef CAS.
- J. Tuček, L. Machala, S. Ono, A. Namai, M. Yoshikiyo, K. Imoto, H. Tokoro, S. Ohkoshi and R. Zbořil, Sci. Rep., 2015, 5, 15091 CrossRef PubMed.
- S. Ohkoshi, A. Namai, K. Imoto, M. Yoshikiyo, W. Tarora, K. Nakagawa, M. Komine, Y. Miyamoto, T. Nasu, S. Oka and H. Tokoro, Sci. Rep., 2015, 5, 14414 CrossRef CAS PubMed.
- S. Sakurai, S. Kuroki, H. Tokoro, K. Hashimoto and S. Ohkoshi, Adv. Funct. Mater., 2007, 17, 2278–2282 CrossRef CAS.
- S. Ohkoshi, A. Namai and S. Sakurai, J. Phys. Chem. C, 2009, 113, 11235–11238 CrossRef CAS.
- M. Yoshikiyo, K. Yamada, A. Namai and S. Ohkoshi, J. Phys. Chem. C, 2012, 116, 8688–8691 CrossRef CAS.
- J. Macdougall, A. Namai, M. Yoshikiyo and S. Ohkoshi, Chem. Lett., 2023, 52, 229–232 CrossRef CAS.
- R. H. French, S. J. Glass, F. S. Ohuchi, Y.-N. Xu and W. Y. Ching, Phys. Rev. B: Condens. Matter Mater. Phys., 1994, 49, 5133–5142 CrossRef CAS PubMed.
- X. Zhao and D. Vanderbilt, Phys. Rev. B: Condens. Matter Mater. Phys., 2002, 65, 075105 CrossRef.
- M. L. Matias, E. Carlos, R. Branquinho, H. do Valle, J. Marcelino, M. Morais, A. Pimentel, J. Rodrigues, T. Monteiro, E. Fortunato, R. Martins and D. Nunes, Energies, 2022, 15, 6452 CrossRef CAS.
- E. F. López, V. S. Escribano, M. Panizza, M. M. Carnasciali and G. Busca, J. Mater. Chem., 2001, 11, 1891–1897 RSC.
- L. Saviot, D. B. Murray, G. Caputo, M. del C. M. de Lucas and N. Pinna, J. Mater. Chem. C, 2013, 1, 8108–8116 RSC.
- D. Michel, M. P. y Jorba and R. Collongues, J. Raman Spectrosc., 1976, 5, 163–180 CrossRef CAS.
- L. A. Falkovsky, J. Exp. Theor. Phys., 2006, 102, 155–159 CrossRef CAS.
- G. G. Siu, M. J. Stokes and Y. Liu, Phys. Rev. B: Condens. Matter Mater. Phys., 1999, 59, 3173–3179 CrossRef CAS.
- D. Kim, D. Kim, S. Hwang and J. Jang, Opt. Express, 2012, 20, 13566–13572 CrossRef CAS PubMed.
- J. Woo, M. Kim, H. Kim and J. Jang, Appl. Phys. Lett., 2014, 104, 081106 CrossRef.
- R. Kakimi, M. Fujita, M. Nagai, M. Ashida and T. Nagatsuma, Nat. Photon., 2014, 8, 657–663 CrossRef CAS.
- Q. Wen, H. Zhang, Y. Xie, Q. Yang and Y. Liu, Appl. Phys. Lett., 2009, 95, 241111 CrossRef.
- R. Sato, S. Ohkuma, Y. Shibuta, F. Shimojo and S. Yamaguchi, J. Phys. Chem. C, 2015, 119, 28925–28933 CrossRef CAS.
- S. Kouva, K. Honkala, L. Lefferts and J. Kanervo, Catal. Sci. Technol., 2015, 5, 3473–3490 RSC.
- Z. Wang, Y. Lu, S. Yuan, L. Shi, Y. Zhao, M. Zhang and W. Deng, J. Colloid Interface Sci., 2013, 396, 9–15 CrossRef CAS PubMed.
- C. Gabriel, S. Gabriel, E. H. Grant, B. S. J. Halstead and D. M. P. Mingos, Chem. Soc. Rev., 1998, 27, 213–224 RSC.
- J. Ph. Ansermet and E. Baeriswyl, J. Mater. Sci., 1994, 29, 2841–2846 CrossRef CAS.
- A. V. Radha, O. Bomati-Miguel, S. V. Ushakov, A. Navrotsky and P. Tartaj, J. Am. Ceram. Soc., 2009, 92, 133–140 CrossRef CAS.
- K. Nie, Y. Yuan, X. Qu, B. Li, Y. Zhang, L. Yi, X. Chen and Z. Liu, J. Colloid Interface Sci., 2024, 656, 168–176 CrossRef CAS PubMed.
- B. Li, K. Nie, Y. Zhang, L. Yi, Y. Yuan, S. Chong, Z. Liu and W. Huang, Adv. Mater., 2023, 35, 2303285 CrossRef CAS PubMed.
- K. Nie, N. Li, B. Li, Y. Yuan, Y. Zhang, P. Liu, S. Chong, J. Hu, Z. Liu and W. Huang, Chem. Eng. J., 2023, 475, 146066 CrossRef CAS.
- Y. Zhang, K. Nie, L. Yi, B. Li, Y. Yuan, Z. Liu and W. Huang, Adv. Sci., 2023, 10, 2302301 CrossRef CAS PubMed.
- M. Matsumoto and Y. Miyata, IEEE Trans. Magn., 1997, 33, 4459–4464 CrossRef.
- S. Sugimoto, S. Kondo, K. Okayama, H. Nakamura, D. Book, T. Kagotani, M. Homma, H. Ota, M. Kimura and R. Sato, IEEE Trans. Magn., 1999, 35, 3154–3156 CrossRef CAS.
- M. Pardavi-Horvath, J. Magn. Magn. Mater., 2000, 215–216, 171–183 CrossRef CAS.
- S. Ohkoshi, S. Kuroki, S. Sakurai, K. Matsumoto, K. Sato and S. Sasaki, Angew. Chem., Int. Ed., 2007, 46, 8392–8395 CrossRef CAS PubMed.
- S. Sakurai, J. Shimoyama, K. Hashimoto and S. Ohkoshi, Chem. Phys. Lett., 2008, 458, 333–336 CrossRef CAS.
- V. G. Harris, IEEE Trans. Magn., 2012, 48, 1075–1104 CAS.
- X. Huang, J. Zhang, M. Lai and T. Sang, J. Alloys Compd., 2015, 627, 367–373 CrossRef CAS.
- A. Namai, S. Sakurai, M. Nakajima, T. Suemoto, K. Matsumoto, M. Goto, S. Sasaki and S. Ohkoshi, J. Am. Chem. Soc., 2009, 131, 1170–1173 CrossRef CAS PubMed.
- S. Ohkoshi, M. Yoshikiyo, K. Imoto, K. Nakagawa, A. Namai, H. Tokoro, Y. Yahagi, K. Takeuchi, F. Jia, S. Miyashita, M. Nakajima, H. Qiu, K. Kato, T. Yamaoka, M. Shirata, K. Naoi, K. Yagishita and H. Doshita, Adv. Mater., 2020, 32, 2004897 CrossRef CAS PubMed.
- A. Houbi, Z. A. Aldashevich, Y. Atassi, Z. Bagasharova Telmanovna, M. Saule and K. Kubanych, J. Magn. Magn. Mater., 2021, 529, 167839 CrossRef CAS.
- R. Kinugawa, K. Imoto, Y. Futakawa, S. Shimizu, R. Fujiwara, M. Yoshikiyo, A. Namai and S. Ohkoshi, Adv. Eng. Mater., 2021, 23, 2001473 CrossRef CAS.
- S. Tsukamoto, Y. Oki, K. Imoto, A. Namai, M. Yoshikiyo and S. Ohkoshi, Adv. Photonics Res., 2022, 3, 2100319 CrossRef CAS.
- A. Namai, Y. Oki, K. Imoto, H. Tokoro and S. Ohkoshi, J. Mater. Chem. C, 2022, 10, 10815–10822 RSC.
Footnote |
| † Electronic supplementary information (ESI) available. See DOI: https://doi.org/10.1039/d3ra07970h |
| This journal is © The Royal Society of Chemistry 2024 |

