
 Open Access Article
 This Open Access Article is licensed under a Creative Commons Attribution-Non Commercial 3.0 Unported Licence
A study of the capacity fade of a LiCoO2/graphite battery during the temperature storage process at 45 °C under different SOCs†
Weigang Liua,
Xinming Fan *ab,
Jingqiang Zhenga,
Zhi Zhanga,
Erke Peng*f,
Zhaoyang Lia,
Zhiyong Chenc,
Hao Jiangc,
Yan Tongc,
Bo Hong*ade and
Jie Liade
*ab,
Jingqiang Zhenga,
Zhi Zhanga,
Erke Peng*f,
Zhaoyang Lia,
Zhiyong Chenc,
Hao Jiangc,
Yan Tongc,
Bo Hong*ade and
Jie Liade
aSchool of Metallurgy and Environment, Central South University, Changsha, 410083, PR China
bResearch Institute of Resource Recycling, Central South University, Changsha 410083, Hunan, China
cGuangdong Mic-power New Energy Co., Ltd, Huizhou, 516000, PR China
dEngineering Research Centre of Advanced Battery Materials, The Ministry of Education, Changsha 410083, Hunan, China
eHunan Provincial Key Laboratory of Value-added Metallurgy, Changsha 410083, Hunan, China
fSchool of Geosciences and Info-Physics, Central South University, Changsha 410083, China. E-mail: fanxinming@csu.edu.cn; erkepeng@gmail.com; bop_hong@163.com
First published on 31st January 2024
Abstract
Lithium-ion batteries with lithium cobalt oxide (LiCoO2) as a cathode and graphite as an anode are promising energy storage systems. However, the high-temperature storage mechanism under different states of charge (SOCs) conditions in batteries remains inadequately elucidated, and a clear storage policy has yet to be established. This study investigates and compares the capacity decay mechanism of a 63 mA h LiCoO2/graphite battery at 45 °C under various SOCs (100%, 75%, 50%, 30%, 0%), while also analysing the underlying reasons for this decay. The exhibited capacity recovery rates under 30% SOC and 100% SOC were significantly higher compared with those of the 50% and 75% SOC levels. Additionally, an analysis was conducted on battery storage under 0% SOC conditions, revealing its unsuitability for storage. By disassembling and analysing the batteries after storage, it was found that the dead lithium (Li) and cobalt (Co) in the anode gradually increased with the extension of storage time when stored under the same SOC. Finally, storage schemes under different SOCs are proposed, providing valuable suggestions for battery storage.
1. Introduction
Since their commercialization in 1992, lithium-ion batteries (LIBs) have been widely used in 3C (communication, computer, computer) digital, power, and energy storage applications due to their advantages of high voltage, high specific energy, long cycle life, low self-discharge rate, fast charging, and wide operating temperature range.1 The storage of LIBs is a prevalent occurrence in practical applications, commonly occurring during the battery manufacturing process and the sales period. During the storage process of LIBs, especially at high-temperature conditions, the voltage and capacity of the battery will decrease and the impedance will increase, due to the thermodynamic instability.2,3 Therefore, it is particularly important to study the storage performance of LIBs in high-temperature environments.The impact of high-temperature storage on the chemical and electrochemical reactions in batteries has been widely acknowledged.4–6 Exacerbation of side reactions on the electrode surface due to thermodynamic instability during battery storage, leads to loss of capacity and increase in electrochemical impedance.7–12 Some studies have suggested that the interfacial resistance at the cathode is the most important factor contributing to the increase in impedance,13–15 and that changes in the structure of the cathode during storage are the main reason for the degradation of battery performance,16,17 these views mainly attribute the decay of electrical properties to lithium depletion due to structural changes in the active material, and loss of active material.18–21 Other studies have argued that the capacity of lithium-ion batteries during storage decreases due to the instability of the interface between the electrodes and the electrolyte, the formation of excessive solid electrolyte interfaces (SEI), uneven lithium deposition, and the dissolution and decomposition of active substances such as (Co3+) leading to capacity degradation.22–24 In addition, it is commonly acknowledged that temperature is the most important factor affecting the storage life of lithium batteries,25–28 storage at high-temperature accelerates the decomposition of the electrolyte, leading to rapid capacity degradation,29–34 Besides, decomposition products of the electrolyte will accumulate on the surface of the electrodes, leading to an increase in battery resistance and a deterioration in battery multiplication performance.35 In our team's previous work, we have revealed the relationship between dead lithium and lost capacity at high temperature (65 °C).36 However, the SOC and storage decay mechanisms of LiCoO2/graphite battery at high-temperature have not yet been systematically studied.
In this paper, we have studied the electrochemical properties of commercial batteries (standard capacity is 63 mA h) before and after storage at 45 °C under different SOCs. The physico-chemical properties of the cathode, anode materials, and separator after the disassembly of these stored batteries are also tested by various characterization methods such as TEM, SEM, atomic absorption spectrometer (AAS), etc. This investigation will enhance our understanding of a more complete analysis of lithium-ion battery storage decay mechanisms. It was found that SOC has a significant impact on battery storage, and the increase of dead lithium and the migration of Co in the anode were found to be the key contributors to capacity degradation through the study of battery storage in the fully charged state.
2. Experimental methods
For experimental methods on batteries, the test methods are detailed in the ESI.†3. Results and discussion
3.1 Analysis of storage under different SOCs
The battery stored at 45 °C under 0% SOC was first studied, and the relevant data are shown in Table S1.† The initial voltage measured approximately 3.335 V, which significantly declined after a storage period of 1–3 months, and the battery's capacity recovery rates also exhibited a rapid decrease in parallel with the declining voltage. Subsequently, the batteries were dissected to elucidate the underlying factors contributing to their poor storage characteristics. The photographs in Fig. 1a–a2 illustrate the positive shell's condition after being stored for a period of 1–3 months. Upon examining the disassembled positive shell, it becomes evident that an increasing amount of deposit accumulate on its surface as the storage time under 0% SOC prolongs. In addition, the SEM images of the negative and positive electrodes in Fig. 1b–c2 reveal a substantial accumulation of material on their surfaces with prolonged storage time. An increasing number of deposits have been observed to hinder the porosity of the diaphragm (Fig. 1d–d2). Based on the above results, it can be concluded that at 0% charge state, the electrolyte decomposes at a rate and deposits on the surface of electrodes, positive case, and diaphragm, leading to accelerated battery storage failure. From the storage results of 0% SOC at 45 °C, the battery is not suitable for long-term storage in a fully discharged state. Therefore, the following discussion focuses on battery storage under other SOCs. | ||
| Fig. 1 (a)–(a2) Pictures of the positive case of battery which stored for 1–3 months under 0% SOC. (b)–(b2) SEM of the anode in 2 μm size storage of 1–3 months under 0% SOC. (c)–(c2) SEM of the cathode in 1 μm size storage of 1–3 months under 0% SOC. (d)–(d2) SEM of separator in 1 μm size storage of 1–3 months under 0% SOC. | ||
The corresponding retained capacity, restored capacity, and lost capacity of the battery after 1, 2, 3, and 6 months of storage at 45 °C under different SOCs are shown in Fig. 2a. Accordingly, the retained capacity of the battery is gradually decreasing under different SOCs after storing for 1 month to 6 months. After the charge and discharge test for 3 cycles, the rate of lost capacity of the corresponding stored batteries is gradually increasing (Tables S2 and S3,† data are from the average results of four batteries, in this study, four 1254 type batteries were selected for testing and averaged, and the capacity deviation results are shown in Fig. S1).† It is concluded that in the storage at 45 °C, the retention capacity decreases and the lost capacity increases, which may be caused by electrolyte decomposition under long-term high-temperature and intensified interface reaction.
 | ||
| Fig. 2 (a) Capacity bar graph after 1–6 months of storage at 45 °C under different SOCs. (b) The capacity lost ratio of storage at 45 °C under different SOCs. (c) The capacity retention ratio under different SOCs at 45 °C. (d) The change ratio of internal resistance under different SOCs at 45 °C. (e) The projection of the voltage decay under different SOCs at 45 °C. (f) The projection of the capacity recovery ratio at 45 °C under different SOCs. | ||
When stored at 45 °C for 1–6 months, the ratio of lost capacity is the highest under 75% SOC, followed by 50% SOC, as shown in Fig. 2b. After 1–2 months of storage, the storage capacity lost ratio of the battery stored under 30% SOC is less than that under 100% SOC. Nevertheless, after 3 months of storage, the storage capacity lost ratio of the battery under 30% SOC storage is higher than that under 100% SOC storage. The capacity lost ratio of battery storage under 30% SOC appears at a knee point. It is speculated that with storage under 30% SOC for more than 2 months, the internal deterioration of the battery becomes more serious than that under 100% SOC.
The capacity retention ratio after the storage is shown in Fig. 2c, with the extension of storage time, the capacity retention ratio of the battery under different SOCs gradually decreases, with the lowest capacity retention ratio under 75% SOC and the highest capacity retention ratio under 30% SOC. After 3 months of storage, the capacity retention rate of 100% SOC is higher than 50% SOC. Fig. 2d illustrate the change ratio of the internal resistance of the battery gradually increases with storage time. The battery has the highest ratio of change of internal resistance under 100% SOC, a relative minimum under 30% SOC, and 50% SOC in between. After 2 months of storage, there was a sudden spike in the rate of change of the internal resistance of the battery under 75% SOC, indicating an increase in contact resistance within the battery, presumed interfacial side effects.
The voltage decay of the battery after storage at different SOCs are all in a good linear relationship. From Fig. 2e, 30% SOC has the largest voltage degradation trend, while the lowest voltage degradation is observed when stored under 50% SOC. Before storing for 2 months, 30% SOC is lower than 100% SOC and 75% SOC, but after storing for 2 months, the voltage degradation of 30% SOC suddenly increases and exceeds that of other SOCs. Linear fitting of the voltage decay for different SOCs was carried out, the relevant prediction equations are given in eqn (1)–(4) in the ESI,† the relevant data are shown in Table S3.† In addition, the capacity recovery ratio for 1–6 months of battery storage was linearly fitted, as shown in Fig. 2f. The capacity recovery ratio is the lowest at 75% SOC, followed by 50% SOC. In addition, before 3 months of storage, the capacity recovery ratio is higher than that of 100% SOC at 30% SOC, but after 3 months of storage, the capacity recovery rate of 100% SOC is higher than that of the other SOCs (the relevant prediction equations are given in eqn (5)–(9) in the ESI†).
The electrochemical impedance spectroscopy (EIS) curves consist of a semicircle in the high-frequency region, a semicircle in the mid-high-frequency region, and a straight line in the low-frequency region, which represent the solution resistance (Rs), the interfacial film impedance (Rf), the interfacial charge transfer impedance (Rct), and the Li+ diffusion impedance (W1), respectively.37 According to the data in Table S5,† the Rf and Rct after the battery was stored at 45 °C for 1–6 months under different SOCs were plotted respectively, as shown in Fig. 3. At 45 °C, Fig. 3a and b have the same trend, the Rf and Rct values increase with the storage time, suggesting that the battery deteriorates internally.
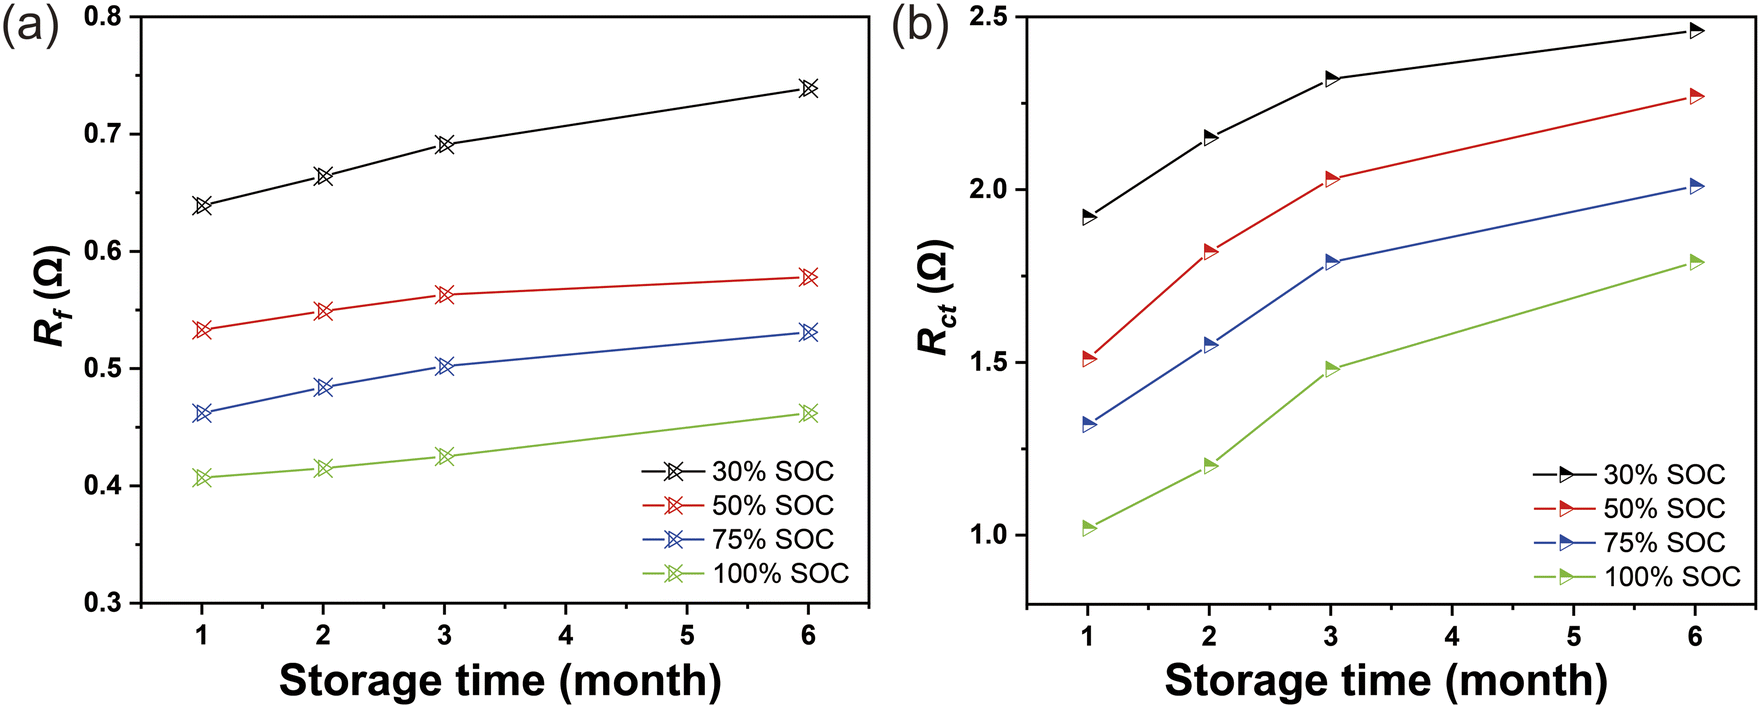 | ||
| Fig. 3 (a) The value of Rf under different SOCs at 45 °C after 1–6 months of storage. (b) Rct under different SOCs at 45 °C stored for 1–6 months. | ||
Rf and Rct values increase with the decrease of SOC, it is speculated that this is related to the electrochemical response inside the batteries stored under different SOCs. The result is also consistent with the results of some previous studies.38,39
To observe the changes in the micromorphology of the electrode after storage, the SEM images of the cathode (alumina-coated separator side), anode, and separator (anode side) of the battery before storage are shown in Fig. S2a–d.† Fig. S3† shows the electron microscope graph of the cathode under different SOCs stored at 45 °C for 1, 3, and 6 months, the structure of the cathode has no significant change. The anode surface appears to be visually obscured in Fig. S4,† suggesting a thickening of the solid-electrolyte interphase (SEI). After 6 months of storage, compared to 100% SOC, the surface of the anode has more obvious deposits under 30% SOC, 50% SOC and 75% SOC, which mainly come from the decomposition of the electrolyte,40 and the decomposition of the electrolyte consumes the active lithium ions, which is also the cause of the capacity decline.
In addition, with the extension of storage time, the separator has a trend of narrowing and blockage (Fig. S5†), this is bound to affect the transmission of Li-ions during the charge and discharge process after storage, which may then affect the capacity recovery of the battery and the increase of the internal resistance. As can be seen in Fig. S6,† the graphite of the negative electrode is easily detached and adheres to the diaphragm, and this tendency to detach increases with storage time, the diaphragm storage under 50% SOC and 75% SOC is more severe than storage at other SOCs. From Fig. S2–S6,† the degradation during battery storage is more concentrated at the negative interface and the surface of the diaphragm, while the changes at the positive interface are not particularly obvious.
After confirming the morphological characteristics of the electrodes, we further investigated on the compositional information of the anode. Quantitative analysis of dead lithium was carried out on anode stored for 1, 3, and 6 months under different SOCs using the AAS method, and the data are shown in Table S6.† It was found that the content of dead lithium in the negative electrodes of batteries stored under all different SOCs gradually increased with increasing storage time, which suggests that the decay of battery capacity is positively correlated with storage time. The results of the quantitative analysis of dead lithium in Table S6,† combined with the electrical performance data under different SOCs, can explain the higher capacity retention and recovery rate within 3 months of storage under 30% SOC compared to other SOCs. And after 6 months of storage, the storage capacity recovery rate was lower under 30% SOC than under 100% SOC, this is also consistent with the higher content of dead lithium in the 30% SOC anode than in the 100% SOC. The dead Li content in the anode under 50% SOC and 75% SOC is higher than that under 30% SOC and 100% SOC, explain the worse capacity recovery ratio after storage under 50% SOC and 75% SOC. The content of dead lithium in the negative electrode after storage, in combination with the capacity return rates of different SOC storage, show that the SOC has an important relationship with the storage performance of the battery.
3.2 Storage decay mechanism
We selected the battery in the fully charged state for a more detailed storage study to reveal the decay mechanism of the battery under storage. Fig. 4a shows the discharge curves of the battery before and after storage. After 1 month, 2 months, 3 months, and 6 months of storage, the retained capacity of the battery is 55.6 mA h, 53.3 mA h, 49.4 mA h, and 45.3 mA h, respectively. Relevant raw data are shown in Table S2.† Fig. 4b shows the charge–discharge curves and the constant current and voltage charge capacity at the third cycle before and after battery storage. After 1 month, 2 months, 3 months, and 6 months of storage, the recovery capacity of the battery was 60.3 mA h, 59.3 mA h, 56.6 mA h, and 54.5 mA h, respectively. In addition, the constant current charge capacity decreases to relatively low values with increasing of the storage time, while the constant voltage charge capacity has been increased, indicated the polarization of the battery has become seriously large, which may be caused by the increased impedance during storage at 45 °C.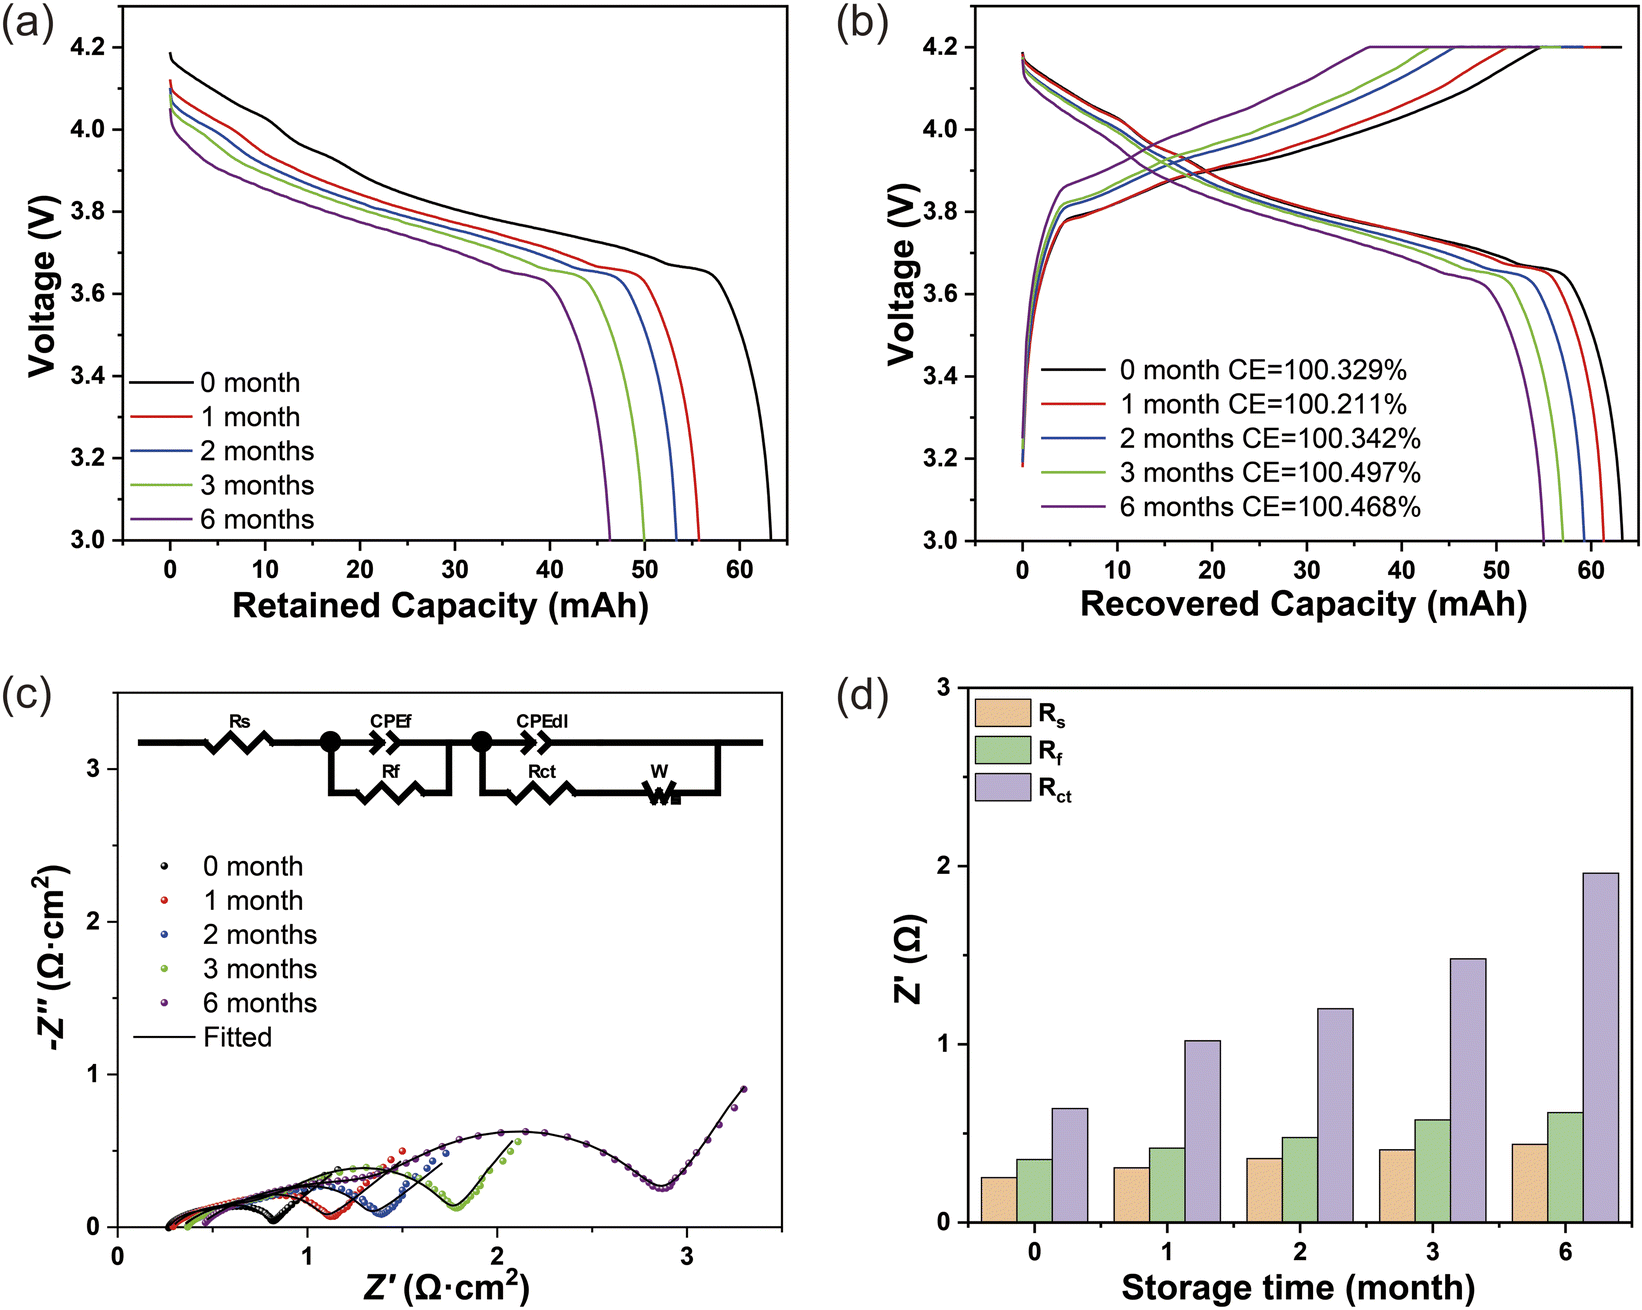 | ||
| Fig. 4 (a) Battery retention capacity discharge curves before and after storage at 45 °C under 100% SOC. (b) Charging and discharging curves of the third cycle before and after storage at 45 °C under 100% SOC. (c) EIS of the battery at 45 °C before storage and storage for 1 month, 2 months, 3 months, and 6 months under 100% SOC, respectively. (d) Bar graph of the fitting results of Rs, Rf, and Rct at different storage times under 100% SOC. | ||
EIS tests were carried out to determine the different impedance values before and after battery storage as can be seen from Fig. 4c, the results of the correlation fits for impedance are shown in Table S4.† The detailed values of Rs, Rf and Rct can be derived from the fitted circuit diagrams, as shown in Table S5.† Moreover, with increasing storage time from 1 month to 6 months, the impedance value is increasing, as is shown in Fig. 4d.
The storage fading capacity is divided into two parts: the restored capacity and the lost capacity. The restored capacity is mainly the recovery capacity, and a part is the capacity of the hysteresis effect after three charge–discharge cycles, this capacity of the hysteresis effect is negligible as it represents a small proportion of the initial capacity. The lost capacity includes the capacity caused by interface side reaction, impedance increase, and internal micro short circuits. From Table 1, the ratio of restored capacity to storage fading capacity is decreasing, and the lost capacity is increasing, these indicate a gradual deterioration of the battery internals with storage time.
| C0 | Storage time | C1 | C2 | Cf = C0 − C1 | Cre = C2 − C1 | Cre/Cf (%) | Clost = C0 − C2 |
|---|---|---|---|---|---|---|---|
| 61.93 | 1 month | 55.58 | 60.32 | 6.35 | 4.74 | 74.65 | 1.61 |
| 62.5 | 2 months | 53.3 | 59.25 | 9.2 | 5.95 | 64.67 | 3.25 |
| 61.4 | 3 months | 49.35 | 56.6 | 12.05 | 7.25 | 60.17 | 4.8 |
| 62.18 | 6 months | 45.33 | 54.5 | 16.85 | 9.17 | 54.42 | 7.68 |
To test changes in the crystal structure of LCO and graphite, XRD analysis is performed on the discharged state of the batteries. Fig. 5a shows the XRD patterns of the discharged LCO cathode before and after storage. From the images of the characteristic peaks (003), and (104) peaks of LCO in Fig. 5a, the peaks of (003) and (104) shift significantly to the high angle with the extension of storage time and the intensity of the peaks gradually decreases.41,42 The intensity of the peak reduced indicates that the cathode electrolyte interphase (CEI) film is gradually thickening. The offset of the peak and the calculation of the peak intensity ratio of 003/104 show that the value of 003/104 is becoming smaller, indicating that the layered structure of the lithium cobalt oxide is changing and the structure is becoming worse. This also corresponds to the gradual increase of Co elements found in the negative electrode in Table S7.† The XRD patterns of the graphite electrode in the fully discharged state before and after the storage are shown in Fig. 5b. It can be seen that both the (002) and (004) peaks represent the characteristic peaks of graphite in the XRD patterns of the anode.43 It can be seen that the (002) and (004) peaks located at 26.4° and 50°–52° are shifted to the low angle as the storage time increases, indicating that the interlayer spacing of graphite gradually becomes larger, which might be ascribed to the dead Li embedded in graphite or the detrimental interfacial reaction. This also corresponds to the gradual increase of Li elements found in the anode in Table S7.†
 | ||
| Fig. 5 (a) XRD patterns of LCO cathode before storage at 45 °C and stored for 1 to 6 months. (b) XRD plots of graphite anode before storage at 45 °C and stored for 1–6 months. (c)–(f) XPS spectra of F 1s, C 1s, P 2p, and Li 1s for the anode in the discharged at 45 °C stored for 1 to 6 months, respectively. | ||
After determining the crystal structure changes after storage, we investigated the crystal interface. To better understand the elemental distribution of the anode interface, XPS analysis is performed on the discharged state of the batteries. Fig. 5c–f shows the XPS spectrum of F, C, P, and Li before and after storage at 45 °C. For the F 1s spectrum, the Li–F peak is at 685.3 eV, and the peaks located at 687.2 eV and 688.2 eV are assigned to the electrolyte decomposition product such as LixPOyFz, etc., and C–F bond (Fig. 5c).44 As shown in Fig. 5d, the C–O (286.9 eV) and O–C![[double bond, length as m-dash]](https://www.rsc.org/images/entities/char_e001.gif) O (289 eV) peaks correspond to the components of the SEI film during the cycling process.45 In the P 2p spectrum Fig. 5e, the characteristic peaks located at 133.6 eV and 137.4 eV correspond to LixPOyFz and LixPFy, respectively,46 both of which are assigned to the decomposition products of the carbonate electrolyte. It can be observed from Fig. 5f that the intensity of the lattice Li+ peak (55.4 eV) is significantly enhanced with the increase of storage time,47 indicating the large amount of dead Li deposition on the anode surface. It can be seen that the peak intensity of O–CO gradually increases with the increase of storage time, demonstrating that the SEI film is growing thicker. These results are consistent with the results of the XRD analysis and SEM analysis. The decomposition of the electrolyte on the anode surface increases as the storage time increases, resulting in an increase of Li+ in the anode. This is one of the reasons affecting the deterioration of the electrochemical performance of the battery.
O (289 eV) peaks correspond to the components of the SEI film during the cycling process.45 In the P 2p spectrum Fig. 5e, the characteristic peaks located at 133.6 eV and 137.4 eV correspond to LixPOyFz and LixPFy, respectively,46 both of which are assigned to the decomposition products of the carbonate electrolyte. It can be observed from Fig. 5f that the intensity of the lattice Li+ peak (55.4 eV) is significantly enhanced with the increase of storage time,47 indicating the large amount of dead Li deposition on the anode surface. It can be seen that the peak intensity of O–CO gradually increases with the increase of storage time, demonstrating that the SEI film is growing thicker. These results are consistent with the results of the XRD analysis and SEM analysis. The decomposition of the electrolyte on the anode surface increases as the storage time increases, resulting in an increase of Li+ in the anode. This is one of the reasons affecting the deterioration of the electrochemical performance of the battery.
To observe the interface changes more directly, TEM analysis was performed on the positive and negative electrodes after storage. Compare to Fig. 6a–d, it can be found that an amorphous SEI film is formed on the surface of the anode and its thickness increases as the storage time. After storage, the anode surface has the formation of SEI film, but uneven and dispersed state, with the storage time extension, the anode surface of the SEI film gradually thickened, and dense. The formation of SEI naturally consumes Li in the electrolyte, which is one of the reasons of the decrease in capacity, and is also consistent with the XRD results and SEM results in the previous results. Fig. 6e shows the SEI film on the surface of the anode and the formation of dead lithium in the anode during storage. Fig. S7† shows the TEM images of the cathode materials during storage at 45 °C. From Fig. S7a–d,† it can be seen that the surface of the cathode (LCO) is no visible CEI film formed before storage. As the storage time increases, a thin and dense CEI film gradually forms on the surface of the positive electrode and gradually thickens, this is also consistent with the XRD results in Fig. 6. As the storage time increases, both the positive CEI film and the negative SEI film tend to become thicker. However, the consumption of lithium in film formation is mainly in the negative SEI.
 | ||
| Fig. 6 (a)–(d) TEM of the graphite anode before storage, and stored for 1 month, 3 months, and 6 months, respectively. (e) Schematic diagram of SEI film formation in the anode. | ||
The lost capacity of the batteries during the different months of storage was converted into lithium mass and compared with the increment of dead lithium in the anode. From Table 2, it can be seen that the increment of dead lithium in the anode is always greater than the quantity of lithium converted by the lost capacity, indicating that the dead lithium in the anode has other sources, which may come from the decomposition of electrolyte LiPF6 on the surface of the anode and the formation of SEI film, and the mass of the dead lithium originating from other sources is increasing with the extension of storage time.
| Storage time/m | Lost capacity/mA h | Lost capacity converted into lithium quality/mg | Increments of dead Li in the anode/mg | Increments of dead Li in the anode/lost capacity converted into lithium quality |
|---|---|---|---|---|
| 1 month | 1.5 | 0.41 | 0.43 | 1.0488 |
| 2 months | 3 | 0.82 | 0.89 | 1.0854 |
| 3 months | 5 | 1.36 | 1.55 | 1.1397 |
| 6 months | 6.9 | 1.875 | 2.43 | 1.2960 |
The relationship between the lost capacity and the Li that cannot be de-embedded from the graphite anode (dead lithium) is a fundamental question to understanding capacity decay during the storage process. The proportions of Li and Co contents in the negative electrode after storage are fitted linearly. The test results of the dead Li and Co in the discharged negative electrode before and after storage are shown in Table S7.† From Table S7,† we can conclude that the dead lithium and cobalt gradually increase in the negative electrode. The data from Tables S7† and 2 are plotted, as shown in Fig. 7, Fig. 7a shows that the determination coefficient of the linear fit is high, which can be predicted for the battery, as presented in eqn (9) and (10).† The ratio of the increment of dead lithium in the anode to the quality of lithium in the lost capacity can be predicted by eqn (11), corresponding to Fig. 7b. Eqn (9)–(11) are detailed in the ESI.†
 | ||
| Fig. 7 (a) Actual and predicted percentage of Li and Co content in graphite anode after storage at different times. (b) The actual value and prediction graph of Li mass in anode/Li mass lost in capacity after 1–6 months of storage at 45 °C. | ||
4. Conclusions
In this work, we have studied the capacity decay mechanism of the LiCoO2/graphite battery during the temperature storage process at 45 °C under the different SOCs. The mechanism of capacity fading after storage and the suggestion of storage at 45 °C can be concluded below:(1) With the extension of the storage time at 45 °C, the interface reaction caused the thickening of the CEI membrane, and the SEI membrane at the interface of the cathode and anode, this is also the reason why the increase of the interfacial impedance, and the reduction of the membrane porosity. The loss of active lithium in the anode is the main reason for the loss of storage capacity, during storage, the changes in the interface are mainly concentrated on the anode. The SOC of the battery has a great influence on the loss of capacity of the battery during storage. Different SOCs show different storage performances in different storage durations. The battery was stored in a fully discharged state, showing the most severe interfacial reactions and electrolyte decomposition. No matter which SOC is chosen for storage, the amount of dead lithium in the anode after storage is negatively correlated with the capacity recovery rate.
(2) At 45 °C, it is not recommended at all that battery be stored under 0% SOC. If short-term storage, it is recommended to store the battery under a low SOC (30%), and suggested for no more than 3 months. If stored for more than three months, it is recommended that the battery be stored in a fully charged state, and no more than 9 months through the prediction formula established in this paper.
Author contributions
Weigang Liu: investigation, data curation, visualization, methodology, writing-original draft, writing-review & editing. Jingqiang Zheng: formal analysis, writing-review & editing. Zhi Zhang: data curation, validation, soft-ware. Zhaoyang Li: data curation, validation, soft-ware. Xinming Fan: methodology, writing-review & editing. Zhiyong Chen: funding acquisition, writing-review. Hao Jiang: formal analysis, writing-review & editing. Yan Tong: funding acquisition, writing-review & editing, supervision. Bo Hong: funding acquisition, writing-review & editing, supervision. Erke Peng: writing-review & editing, supervision. Jie Li: writing-review & editing, supervision.Conflicts of interest
The authors declare that they have no known competing financial interests or personal relationships that could have appeared to influence the work reported in this paper.Acknowledgements
We gratefully acknowledge the National Natural Science Foundation of China (No. 52034011 and 52204328) and the support from Guangdong Mic-power New Energy Co., Ltd, Natural Science Foundation of Hunan Province (No. 2022JJ40595).References
- E. Meissner and G. Richter, Battery monitoring and electrical energy management: precondition for future vehicle electric power systems, J. Power Sources, 2003, 116, 79–98 CrossRef CAS.
- L. Bodenes, R. Naturel and H. Martinez, et al., Lithium secondary batteries working at very high temperature: capacity fade and understanding of aging mechanisms, J. Power Sources, 2013, 236(25), 265–275 CrossRef CAS.
- K. Jalkanen, J. Karppinen and L. Skogström, et al., Cycle aging of commercial NMC/graphite pouch cells at different temperatures, Appl. Energy, 2015, 154, 160–172 CrossRef CAS.
- J.-S. Hong, H. Maleki and S. Al Hallaj, et al., Electrochemical calorimetric studies of lithium-ion cells, J. Electrochem. Soc., 1998, 145, 1489–1501 CrossRef CAS.
- H. Liu, Z. Wei, W. He and J. Zhao, Thermal issues about Li-ion batteries and recent progress in battery thermal management systems: a review, Energy Convers. Manage., 2017, 150, 304–330 CrossRef CAS.
- L. Hou, X. Zhang, B. Li and Q. Zhang, Cycling a lithium metal anode at 90 °C in a liquid electrolyte, Angew. Chem., Int. Ed., 2020, 59, 15109–15113 CrossRef CAS PubMed.
- J. Vetter, P. Novák and M. R. Wagner, et al., Ageing mechanisms in lithium-ion batteries, J. Power Sources, 2005, 147, 269–281 CrossRef CAS.
- S. Zhong, M. Li and Q. Zhang, et al., Research on high temperature storage performance of the lithium-rich manganese-based cathode material, Nonferrous Met. Sci. Eng., 2013, 4(03), 45–48 CAS.
- J. Schmitt, A. Maheshwari and M. Heck, et al., Impedance change and capacity fade of lithium nickel manganese cobalt oxide-based batteries during calendar aging, J. Power Sources, 2017, 183–194 CrossRef CAS.
- N. Motoko, M. Takuya and N. Kei, et al., Surface state change of lithium metal anode in full cell during long term cycles, Electrochemistry, 2019, 87, 84–88 CrossRef.
- D. R. Sorensen, M. Heere and J. Zhu, et al., Fatigue in High-Energy Commercial Li Batteries while Cycling at Standard Conditions: An In Situ Neutron Powder Diffraction Study, ACS Appl. Energy Mater., 2020, 3, 6611–6622 CrossRef.
- D. R. Sørensen, M. Heere and J. Zhu, et al., Enabling stable lithium metal anode through electrochemical kinetics manipulation, Adv. Funct. Mater., 2019, 29, 1904629 CrossRef.
- C. H. Chen, J. Liu and M. E. Stoll, et al., Aluminum-doped lithium nickel cobalt oxide electrodes for high-power lithium-ion batteries, J. Power Sources, 2004, 128, 278–285 CrossRef CAS.
- D. Mori, H. Kobayashi and M. Shikano, et al., Bulk and surface structure investigation for the positive electrodes of degraded lithium-ion cell after storage test using X-ray absorption near-edge structure measurement, J. Power Sources, 2009, 189, 676–680 CrossRef CAS.
- T. Sasaki, T. Nonaka and H. Oka, et al., Capacity-Fading Mechanisms of LiNiO2-Based Lithium-Ion Batteries, J. Electrochem. Soc., 2009, 156(5), A371–A377 CrossRef.
- S. Watanabe, M. Kinoshita and T. Hosokawa, et al., Capacity fade of LiAlyNi(1-x-y)CoxO2 cathode for lithium-ion batteries during accelerated calendar and cycle life test (surface analysis of LiAlyNi1-x-yCoxO2 cathode after cycle tests in restricted depth of discharge ranges), J. Power Sources, 2014, 258, 210–217 CrossRef CAS.
- Y. Du, K. Fujita and S. Shironita, et al., Capacity fade characteristics of nickel-based lithium-ion secondary battery after calendar deterioration at 80 °C, J. Power Sources, 2021, 501, 230005 CrossRef CAS.
- M. Klett, R. Eriksson and J. Groot, et al., Non-uniform aging of cycled commercial LiFePO4//graphite cylindrical cells revealed by post-mortem analysis, J. Power Sources, 2014, 257, 126–137 CrossRef CAS.
- K. Honkura, K. Takahashi and T. Horiba, Capacity-fading prediction of lithium-ion batteries based on discharge curves analysis, J. Power Sources, 2011, 196, 10141–10147 CrossRef CAS.
- I. Bloom, J. Christophersen and K. Gering, et al., Differential voltage analyses of high-power lithium-ion cells: 2. Applications, J. Power Sources, 2005, 139, 295–303 CrossRef CAS.
- I. Bloom, L. K. Walker and J. K. Basco, Differential voltage analyses of high-power lithium-ion cells. 4. Cells containing NMC, J. Power Sources, 2010, 877–882 CrossRef CAS.
- B. Stiaszny, J. C. Ziegler and E. E. Krauß, et al., Electrochemical characterization and post-mortem analysis of aged LiMn2O4-Li(Ni0.5Mn0.3Co0.2)O2/graphite lithium ion batteries. Part I: cycle aging, J. Power Sources, 2014, 251, 439–450 CrossRef CAS.
- C. R. Birkl, M. R. Roberts and E. McTurk, et al., Degradation diagnostics for lithium ion cells, J. Power Sources, 2017, 341, 373–386 CrossRef CAS.
- M. S. D. Darma, M. Lang and K. Kleiner, The influence of cycling temperature and cycling rate on the phase specific degradation of a positive electrode in lithium ion batteries: a post mortem analysis, J. Power Sources, 2016, 327, 714–725 CrossRef CAS.
- J. Vetter, P. Novák and M. R. Wagner, et al., Ageing mechanisms in lithium ion batteries, J. Power Sources, 2005, 147, 269–281 CrossRef CAS.
- V. Etacheri, R. Marom and R. Elazari, et al., Challenges in the development of advanced Li-ion batteries: a review, Energy Environ. Sci., 2011, 4, 3243–3262 RSC.
- A. Barré, B. Deguilhem and S. Grolleau, et al., A review on lithium-ion battery ageing mechanisms and estimations for automotive applications, J. Power Sources, 2013, 241, 680–689 CrossRef.
- W. Thomas, I. Amaia and K. Michael, et al., Review-post-mortem analysis of aged lithium-ion batteries: disassembly methodology and physico-chemical analysis techniques, J. Electrochem. Soc., 2016, 163, A2149–A2164 CrossRef.
- Y. Itou and Y. Ukyo, Performance of LiNiCoO2 materials for advanced lithium-ion batteries, J. Power Sources, 2005, 146, 39–44 CrossRef CAS.
- J. Purewal, J. Wang and J. Graetz, et al., Degradation of lithium ion batteries employing graphite negatives and nickel-cobalt-manganese oxide + spinel manganese oxide positives: part 1, aging mechanisms and life estimation, J. Power Sources, 2014, 269, 937–948 CrossRef.
- M. Uitz, M. Sternad and S. Breuer, et al., Aging of Tesla's 18650 lithium-ion cells: correlating solid-electrolyte interphase evolution with fading in capacity and power, J. Electrochem. Soc., 2017, 164, A3503–A3510 CrossRef CAS.
- I. Bloom, B. W. Cole and J. J. Sohn, et al., An accelerated calendar and cycle life study of Li-ion cells, J. Power Sources, 2001, 101, 238–247 CrossRef CAS.
- S. F. Schuster, T. Bach and E. Fleder, et al., Nonlinear aging characteristics of lithium-ion cells under different operational conditions, J. Energy Storage, 2015, 1, 44–53 CrossRef.
- T. Matsuda, M. Myojin, K. Ando and D. Imamura, Degradation analyses of commercial lithium-ion cells by temperature/C-rate controlled cycle test, ECS Trans., 2015, 64, 69–75 CrossRef CAS.
- D. Aurbach, B. Markovsky and A. Rodkin, et al., On the capacity fading of LiCoO2 intercalation electrodes: the effect of cycling, storage, temperature, and surface film forming additives, Electrochim. Acta, 2002, 47, 4291–4306 CrossRef CAS.
- W. Liu, J. Zheng and Z. Zhang, et al., The Capacity decay mechanism of the 100% SOC LiCoO2/graphite battery after high-temperature storage, J. Power Sources, 2023, 580, 233330 CrossRef CAS.
- R. G. Jungst, G. Nagasubramanian and H. L. Case, Accelerated calendar and pulse life analysis of lithium-ion cells, J. Power Sources, 2003, 119–121, 870–873 CrossRef CAS.
- Y. Luo, C. A. Gong, L. Chang, AC impedance technique for dynamic and static state of charge analysis for Li-ion battery, 2013 IEEE International Symposium on Consumer, Electronics (ISCE), 2013, pp. 9–10 Search PubMed.
- P. Suresh, A. K. Shukla and N. Munichandraiah, Temperature dependence studies of a.c. impedance of lithium-ion cells, J. Appl. Electrochem., 2002, 32(3), 267–273 CrossRef CAS.
- V. A. Agubra, J. W. Fergus, R. Fu and S.-Y. Choe, Analysis of effects of the state of charge on the formation and growth of the deposit layer on graphite electrode of pouch type lithium ion polymer batteries, J. Power Sources, 2014, 270, 213–220 CrossRef CAS.
- H. Gabrisch, R. Yazami and B. Fultz, Hexagonal to Cubic Spinel Transformation in Lithiated Cobalt Oxide: TEM Investigation, J. Electrochem. Soc., 2004, 151(6), A891–A897 CrossRef CAS.
- G. Ceder and A. Van der Ven, Phase diagrams of lithium transition metal oxides: investigations from first principles, Electrochim. Acta, 1999, 45, 131–150 CrossRef CAS.
- M. Kenza and Y. Rachid, A study of lithium ion batteries cycle aging by thermodynamics techniques, J. Power Sources, 2014, 247, 527–533 CrossRef.
- J.-G. Han, J. B. Lee and A. Cha, et al., Unsymmetrical fluorinated malonatoborate as an amphoteric additive for high-energy-density lithium-ion batteries, Energy Environ. Sci., 2018, 11, 1552 RSC.
- W. Zhao, G. Zheng and M. Lin, et al., Toward a stable solid-electrolyte-interfaces on nickel-rich cathodes: LiPO2F2 salt-type additive and its working mechanism for LiNi0.5Mn0.25Co0.25O2 cathodes, J. Power Sources, 2018, 380, 149 CrossRef CAS.
- R. Dedryvère, H. Martinez and S. Leroy, et al., Surface film formation on electrodes in a LiCoO2/graphite cell: a step by step XPS study, J. Power Sources, 2007, 174, 462–468 CrossRef.
- J. Chen, L. Xing and X. Yang, et al., Outstanding electrochemical performance of high-voltage LiNi1/3Co1/3Mn1/3O2 cathode achieved by application of LiPO2F2 electrolyte additive, Electrochim. Acta, 2018, 290, 568 CrossRef CAS.
Footnote |
| † Electronic supplementary information (ESI) available. See DOI: https://doi.org/10.1039/d3ra07938d |
| This journal is © The Royal Society of Chemistry 2024 |