 Open Access Article
Highly specific colorimetric detection based on aggregation of L-cysteine functionalized gold nanoparticles for cypermethrin in water samples†
Thitima Rujiralai *ab,
Nitchakarn Leelaharatab and
Wilairat Cheewasedtham
 b
b
aCenter of Excellence for Innovation in Chemistry and Division of Physical Science, Faculty of Science, Prince of Songkla University, Hat Yai, Songkhla 90110, Thailand. E-mail: thitima.r@psu.ac.th
bAnalytical Chemistry and Environment Research Unit, Division of Science, Faculty of Science and Technology, Prince of Songkla University, Pattani, 94000, Thailand
First published on 18th March 2024
Abstract
A fast, simple, and selective colorimetric assay for quantifying cypermethrin in water samples is proposed using L-cysteine functionalized gold nanoparticles (AuNPs@Cyst). Cypermethrin is hydrolyzed by potassium hydroxide to obtain hydrolyzed cypermethrin in the form of 3-phenoxybenzaldehyde by-product (HCy). The detection strategy is based on the aggregation of AuNPs@Cyst caused by hydrogen-bonding recognition between the aldehyde group of HCy and the amine group of L-cysteine on the surface of AuNPs@Cyst. As a result, in the presence of HCy under optimal pH 7, AuNPs@Cyst aggregates within 7 min, exhibiting a distinct color change from red to blue-gray, which can be evaluated with the naked eye and UV-visible spectrophotometry. From FE-TEM image, the stable and spherical AuNPs@Cyst had an average size of 13.8 ± 1.6 nm, and from zeta potential analysis, the charge of AuNPs@Cyst was −25.04 ± 1.66 mV. The surface plasmon resonance band of dispersed AuNPs@Cyst was red shifted from 525 nm to 634 nm when AuNPs@Cyst was aggregated. The absorbance ratio (A634/A525) was linearly related to cypermethrin concentrations from 0.5 to 13.0 mg L−1. The limit of detection was 0.2 mg L−1 and precision, expressed as relative standard deviations (RSDs), ranged from 1.9 to 7.3%. In the presence of interfering pesticides (carbaryl, ethion, profenofos and abamectin), only cypermethrin produced a significantly different response, confirming the selectivity of AuNPs@Cyst. Finally, AuNPs@Cyst was applied to determine cypermethrin in water samples, achieving very satisfied recoveries (>98.6%) and RSDs lower than 6.1%.
1. Introduction
Cypermethrin is the most commonly applied insecticide in the pyrethroid group. It affects the central nervous system of insects and controls insect infestations quickly in agricultural areas and households.1 Since cypermethrin can enter the body through inhalation and skin contact, people who handle it can be affected, developing symptoms that include dizziness, itching and burning.1,2 The widespread use of cypermethrin in agriculture can be a serious problem for human health. It is also highly toxic to bees and aquatic life and can accumulate in plants and the environment. Several studies have reported cypermethrin contamination in fruits, vegetables, and water. For example, cypermethrin in chili peppers had the highest detection rate among certified farms, and higher residual levels were detected in certified farms than uncertified farms.3 In water, concentrations of cypermethrin were found to be higher in winter than summer.4 In a study of 68 pesticides, residues of cypermethrin in yellow peach, loquat and sweet spring tangelo ranged from 0.005 to 0.024 mg kg−1 but exposure assessments found these levels safe for human consumption.5 The US EPA has identified cypermethrin as having the potential to cause cancer in humans (Group C).1 In various vegetable and food crops, the Department of Agricultural Standards of Thailand has set the maximum residue limit (MRL) of cypermethrin in the range of 0.05–5.00 mg kg−1 whereas the EU has set the standard of pesticides and total pesticides at 0.1 and 0.5 μg L−1, respectively, in drinking water.6,7 In this context, the effective and rapid monitoring of cypermethrin is important for the protection of human health and the environment.The common analytical methods used to determine cypermethrin are based on gas chromatography-electron capture detection3,8 and high-performance liquid chromatography coupled with UV-vis detection4,9 or tandem mass spectrometry.5 These methods offer excellent selectivity and sensitivity with accurate results and low limit of detections (LOD) ranging from to 0.05 μg L−1 to 0.05 mg L−1, but require costly maintenance, trained personnel and tedious preparation steps which restrict in situ analysis and fast detection. In areas such as environmental and food monitoring and biotechnology, alternative detection strategies are preferred that enable quicker results. Gold nanoparticles (AuNPs) have attracted interest for the detection of various substances. AuNPs provide large surface area-to-volume ratios, size- and shape-related optoelectronic properties, biocompatibility, low toxicity, and inertness.10,11 AuNPs can be made specific to most analytes by surface modification. They are ideal for real-time and onsite optical sensing due to the rapid changes of color from red to violet to gray that they produce after interacting with target analytes. Cypermethrin has been determined by surface-enhanced Raman scattering (SERS) with AuNPs-zirconia nanofibers,12 Au/Ag/Au nanorod arrays,13 AuNPs core–shell molecularly imprinted polymer (MIP),14 and bacterial nanocellulose decorated with AuNPs.15 A lateral flow immunoassay strip using AuNPs labeled with mAb 2 G7H9,16 and an immunochromatographic strip-based sensor using polymer carbon dots have been fabricated.17 Recently, gold-functionalized magnetic nanoparticle combined with a broad-spectrum antibody CL-CN/1D2 was developed as a sensor for pyrethoids.18 LODs in the range from 0.35 μg L−1 to 416.3 mg L−1 were achieved by these methods.12–18 Moreover, other approaches for cypermethrin detection gained low LODs, for example, UV-vis spectrophotometry based on hydrolyzed cypermethrin reacting with iron(III) chloride to form ferricyanide complex ions (LOD of 0.023 mg L−1),19 electrochemical sensor based on anatase TiO2-carbon paste obtaining LOD of ∼0.1 mg L−1,20 fluorescence nanosensor related to MIP-CdSe/CdS/ZnS quantum dots (LOD of 0.3 μg L−1)21 and silver nanorods for SERS (LOD ∼0.42 mg L−1).22 Despite the fact that these strategies are highly responsive and specific, they are associated with cumbersome functionalization procedures and sophisticated Raman equipment.
L-cysteine is a neutral, polar amino acid containing main functional groups of thiol (–SH), amine (–NH2) and carboxyl (–COOH) on the side chain.23–28 It can form a stable cysteine-nanoparticles conjugate through the co-ordination between nanoparticles and the sulfur of thiol. Functionalization of AuNPs with L-cysteine has been reported to interact various analytes such as Hg2+,24 Cd2+,25 carbaryl and methomyl,26 and E. coli.27 Kodir et al.28 applied a colorimetric approach, using silver nanoparticles modified with L-cysteine for cypermethrin and monosultap. The method was simpler but the assay detected compounds in a very high concentration range (20–100 mg L−1) and the functionalization time was relatively long. Therefore, simple and fast quantification of cypermethrin with a lower detection limit could possibly be achieved using AuNPs stabilized with L-cysteine.
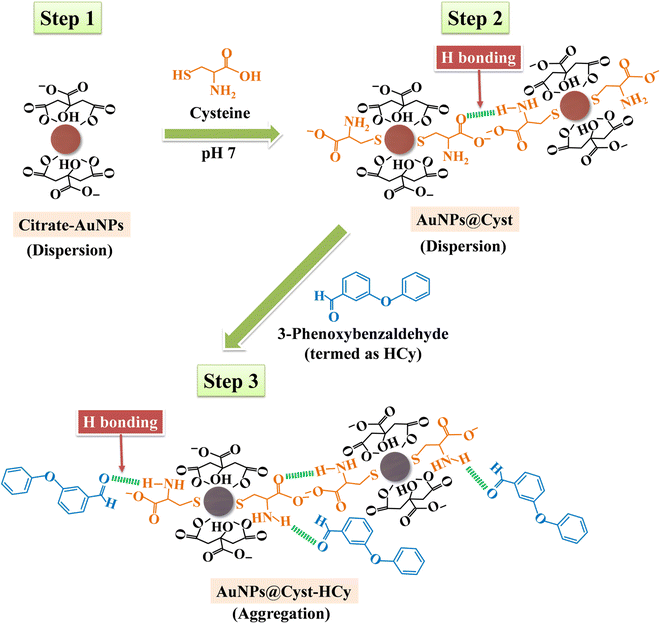
In this work, we developed a colorimetric probe for cypermethrin based on the aggregation of L-cysteine functionalized AuNPs (AuNPs@Cyst) in the presence of hydrolyzed cypermethrin (Fig. 1). Cypermethrin is easily hydrolyzed by potassium hydroxide (KOH) before reacting with freshly prepared AuNPs@Cyst. The as-prepared AuNPs@Cyst probe is well-dispersed in the medium due to the electrostatic repulsion between the negatively charged carboxylate group of L-cysteine on AuNPs. The color of the probe is red. After adding the hydrolyzed by-product of cypermethrin, namely 3-phenoxybenzaldehyde (HCy), the amine group of L-cysteine interacts with the aldehyde group of 3-phenoxybenzaldehyde via the hydrogen bonding, causing the AuNPs@Cyst probe to aggregate. The aggregation yields a red shift in the UV-vis absorption spectrum and a distinct color change from red to blue-gray. The proposed system is based on the significant aggregation of AuNPs@Cyst induced by HCy to produce a selective and sensitive colorimetric response towards cypermethrin that is detectable with the naked eye and can be evaluated by spectrophotometry.
2. Materials and methods
2.1 Materials
Gold(III) chloride trihydrate (HAuCl4·3H2O), L-cysteine and cypermethrin were obtained from Sigma Aldrich (USA). Trisodium citrate, di-sodium hydrogen phosphate dodecahydrate (Na2HPO4·12H2O) and sodium dihydrogen phosphate dihydrate (NaH2PO4·2H2O) were from Ajax Finechem (Australia). Methanol and potassium hydroxide (KOH) were from RCI Labscan (Thailand). Ultrapure water from the ELGA Nanopure system (18.2 MΩ cm) was degassed before use. Phosphate buffers at different pH were prepared using appropriate amounts of Na2HPO4·12H2O and NaH2PO4·2H2O and the required pH was adjusted by the dropwise addition of 0.1 M HCl or 0.1 M NaOH. Prior to use, glassware was soaked in 3![[thin space (1/6-em)]](https://www.rsc.org/images/entities/char_2009.gif) :
:![[thin space (1/6-em)]](https://www.rsc.org/images/entities/char_2009.gif) 1 HCl/HNO3 (aqua regia), washed thoroughly with detergents, rinsed several times with ultrapure water and then oven dried. A series of standard solutions of cypermethrin was prepared in methanol.
1 HCl/HNO3 (aqua regia), washed thoroughly with detergents, rinsed several times with ultrapure water and then oven dried. A series of standard solutions of cypermethrin was prepared in methanol.
2.2 Instrumentation
UV-vis spectra were recorded on a Shimadzu UV-visible 2600 spectrophotometer. Morphology of nanoparticles was acquired on a field emission transmission electron microscope (FE-TEM) (Talos F200i, Thermo Scientific, Czech Republic). Particle size and zeta potential were analyzed using dynamic light scattering (DLS) (NanoBrook ZetaPALS, Brookhaven Instruments). Functional groups between 400 and 4000 cm−1 were identified by Fourier transform infrared (FTIR) spectrometry (Bruker VERTEX 70). The pH of solutions was measured with a Bante pH meter.2.3 Preparations of AuNPs and AuNPs@Cyst
AuNPs were synthesized through the citric acid reduction reaction of HAuCl4·3H2O after Zhou et al.29 with slight modification. Briefly, 100 mL of 0.015% (w/v) HAuCl4·3H2O were vigorously boiled in a conical flask at about 100 °C under magnetic stirring on a hot plate. Then, 3.5 mL of 1% (w/v) trisodium citrate were injected rapidly into the solution under stirring. The solution color changed from pale yellow to wine red during heating, which continued for 20 min under continuous stirring. After being cooled to room temperature, the colloidal AuNPs solution was transferred to an amber bottle and kept at 4 °C before use.The AuNPs@Cyst probe was prepared following the work of Chai et al.24 with slight modification. In a beaker, 10 mL of as-synthesized AuNPs and 20 μL of 1 mM L-cysteine solution were stirred for 2 h at room temperature. The AuNPs@Cyst probe was prepared freshly before being used to detect cypermethrin.
2.4 Detection of cypermethrin using AuNPs@Cyst probe
Before reacting with AuNPs@Cyst, cypermethrin was hydrolyzed to obtain the specific detection. A cypermethrin solution of 500 μL was mixed with 270 μL of 75 mM KOH for 5 min at room temperature to obtain HCy. To detect cypermethrin at room temperature, 200 μL of fresh AuNPs@Cyst probe and 100 μL of 1 mM phosphate buffer (pH 7) were placed in a 1 mL Eppendorf tube and mixed by vortex. Then, 300 μL of HCy were added to the tube and mixed by vortex again. Finally, the color change of the resulting solution was photographed using a mobile phone camera. The absorption spectra were measured with a UV-vis spectrophotometer in the wavelength range of 400–800 nm.3. Results and discussion
3.1 Detection principle of cypermethrin
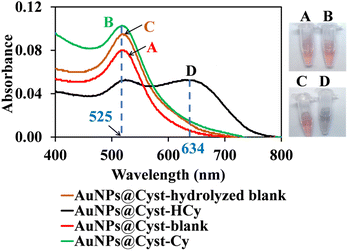
In the AuNPs synthesis, citrate is used as a reducing and electrostatic stabilizing agent. Carboxylic and hydroxy groups assemble on the surfaces of AuNPs, building negatively charged citrate layers.29 The as-prepared AuNPs remain dispersed in the colloidal suspension (Fig. 2, step 1) because electrostatic forces repel neighboring AuNPs, preventing aggregation. The suspension is red and maximum absorbance occurs at 525 nm, which is characteristic of gold surface plasmon resonance (SPR). When the AuNPs are modified with L-cysteine in phosphate buffer at pH 7, the –SH group on the side chain of L-cysteine binds to AuNPs by an Au–S covalent bond (AuNPs@Cyst), exposing –COO− and –NH2 groups of L-cysteine23,30 (Fig. 2, step 2). This Au–S bond is formed by ligand exchange reaction between L-cysteine and citrate modified AuNPs.23 Moreover, as seen in Fig. 2 (step 2) hydrogen bonds between L-cysteine moiety on one AuNPs@Cyst and L-cysteine adsorbed on adjacent particles can be possibly formed. Prepared with low concentration of L-cysteine (about 1 μM in detection system), the AuNPs@Cyst probe is still red, and the absorption spectrum is unchanged (Fig. 3A). This result confirmed the good stability of AuNPs@Cyst and was likely due to electrostatic repulsion between negatively charged carboxylate groups of L-cysteine, which prevented aggregation.31Initially, nonhydrolyzed cypermethrin (Cy) was visually quantified with the AuNPs@Cyst probe (AuNPs@Cyst-Cy). It was found that Cy did not induce the aggregation of AuNPs@Cyst while its absorption spectrum (Fig. 3B) resembled that of the original AuNPs@Cyst (as blank solution) (Fig. 3A). The color of AuNPs@Cyst-Cy was red. Therefore, we hydrolyzed cypermethrin using KOH to obtain hydrolyzed cypermethrin (termed as HCy) and quantified HCy with AuNPs@Cyst. In the alkaline system, ester hydrolysis of cypermethrin occurs, and the main breakdown product of the reaction is 3-phenoxybenzaldehyde.32,33 In the present work, the –NH2 moiety of L-cysteine on the outer surface of AuNPs@Cyst could interact with –CHO of HCy through hydrogen bonding (Fig. 2, step 3), leading to a red shift in plasmon band energy and aggregation of AuNPs@Cyst. Due to the reduced intensity of the plasmon peak, AuNPs@Cyst-HCy produces an absorbance peak at 634 nm and a color change from red to blue-gray (Fig. 3D). This result confirms the hydrolyzed cypermethrin is favorable to the aggregation of AuNPs@Cyst which relates to the hydrogen-bonding recognition. Thus, it can be mentioned that the detection principle does not directly involve cypermethrin itself, but it detects the aldehyde by-product (HCy) which causes the significant aggregation of AuNPs@Cyst to visualize the concentration of cypermethrin in the sample.
3.2 Characterization
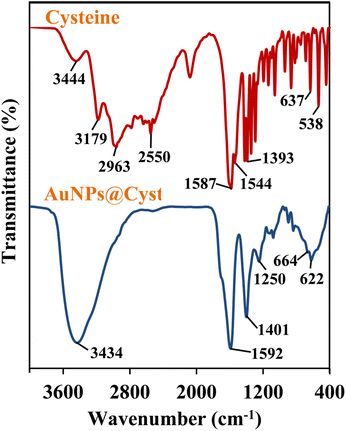
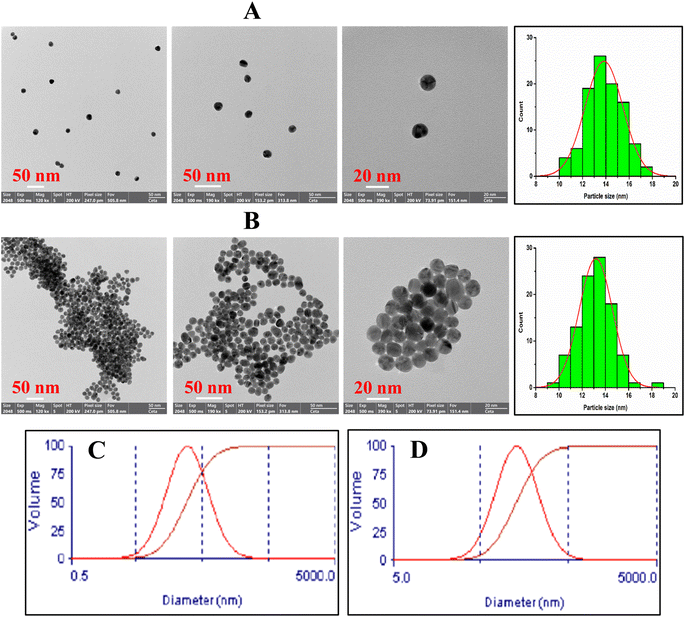
The functional groups of AuNPs@Cyst and pure L-cysteine were identified from FTIR spectra (Fig. 4). In L-cysteine, peaks at 1587 and 1393 cm−1 and 1544 cm−1 corresponded to the asymmetric and symmetric stretching of COO− and N–H bending, respectively.34 Additionally, the S–H group of L-cysteine was found at 2550 cm−1.34 The broad peak between 3000 and 3500 cm−1 attributed to N–H stretching vibration. The FTIR spectrum of AuNPs@Cyst showed a wavenumber shift and reduced transmittance of various peaks at roughly 500–1600 cm−1, possibly due to dipole moment changes when cysteine bound on surface of AuNPs with high electron density.34 Significantly, the S–H peak was not present in the AuNPs@Cyst spectrum, indicating the interaction between Au and S. This result was in accordance with the findings of previous works.34,35 The presented results confirmed the successful functionalization of AuNPs with cysteine.The morphological characteristics of the AuNPs@Cyst in the absence and presence of HCy were analyzed by FE-TEM and the size distribution from FE-TEM result was estimated by ImageJ program (Fig. 5A and B). In the absence of HCy, the AuNPs@Cyst was uniform spherical and monodispersed nanoparticles (Fig. 5A) with the respective average particle size of 13.8 ± 1.6 nm. After mixing with HCy, the FE-TEM image of AuNPs@Cyst was distinguishable from that obtained by AuNPs@Cyst alone which appeared like a cluster of nanoparticles (Fig. 5B) with the respective average size of 13.2 ± 1.4 nm. This result indicates the aggregation state of AuNPs@Cyst. Furthermore, the DLS analysis of AuNPs@Cyst showed significantly increased hydrodynamic diameter from 106.5 ± 12.9 nm (Fig. 5C) to 270.9 ± 4.4 nm (Fig. 5D) when addition of HCy. As expected, the measured hydrodynamic diameters for AuNPs@Cyst and AuNPs@Cyst with HCy are larger than sizes measured by FE-TEM since the DLS analysis measures the hydrodynamic diameter of the nanoparticles and describes the electrical double layer surrounding the charged surfaces of AuNPs which can increase the overall hydrodynamic diameter.36 However, both TEM and DLS results confirmed that HCy induced aggregation of AuNPs@Cyst.
Recently, the process of recyclable AuNPs is of much interest. In the preliminary result of de-aggregation process for AuNPs@Cyst to be used several times, we have tested AuNPs@Cyst in the presence of HCy by heating the solution at 90 °C for 10 min.37 The result led to some degree of de-aggregation which could be observed by color change back from blue-gray to violet (Fig. S1†). As evidenced by the TEM image, after heating the solution of AuNPs@Cyst with HCy, the particles that had aggregates (Fig. S1B†) became more dispersed (Fig. S1C†), observing through less amounts of particle cluster formation but both statuses maintained spherically shaped AuNPs. This demonstrates possibly of AuNPs@Cyst recycling by heating. The optimization of de-aggregation parameters will be expanded in our subsequent projects.
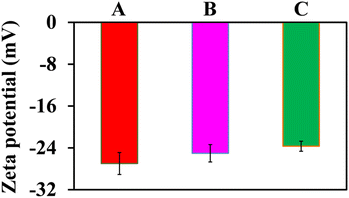
The surface potentials of AuNPs and AuNPs@Cyst without and with HCy were investigated by zeta potential analysis (Fig. 6). The surface charge of AuNPs was −26.99 ± 2.11 mV, which was high enough to prevent aggregation. Thus, AuNPs were highly stable. After modifying AuNPs with L-cysteine (AuNPs@Cyst), the charge decreased only slightly to −25.04 ± 1.66 mV and the dispersion was still stable. In the presence of HCy, the surface charge of AuNPs@Cyst was reduced to −23.69 ± 0.96 mV, indicating a decrease in the stability of the nanoparticles. This might be due to the formation of hydrogen bonds between –NH2 and –CHO groups which enables the aggregation of AuNPs@Cyst. The results of FE-TEM, DLS and zeta potential analysis were consistent with the UV-vis absorption spectra and color changes and confirmed the aggregation of AuNPs@Cyst with HCy.
3.3 Optimization of experimental parameters
To improve the sensitivity and efficiency of colorimetric sensing by our AuNPs@Cyst probe, some reaction conditions were optimized by recording the UV-vis absorption spectra of AuNPs@Cyst-HCy solutions. Each experiment was performed in three replicates.The influence of phosphate buffer pH on the aggregation of AuNPs@Cyst-HCy was investigated from 5 to 8 (Fig. 7A). The pH solution affected the SPR band of AuNPs@Cyst. Initially, we tested the system without hydrolyzed cypermethrin (blank control). The result showed that pH 8 shifted the SPR band of AuNPs@Cyst (data not shown), indicating the aggregation of the blank solution. This change was possibly due to unstable AuNPs. In the presence of HCy, the degree of aggregation increased with pH increments from pH 5 to pH 7, pH 7 giving the best response. L-cysteine molecules have pKa values of 1.96 for the carboxylic group and 8.18 for the amine group and are present in ionic forms at higher pH.23 At ∼pH 7, the COO− and NH2 groups of L-cysteine are exposed (Fig. 2), allowing the –NH2 of AuNPs@Cyst to react more easily with the –CHO of HCy. Accordingly, pH 7 was the optimal pH for the proposed colorimetric system. Even though a spectrum at pH 8 showed an obvious shift of absorption maximum, its blank solution could also aggregate, and thus pH 8 was not selected.
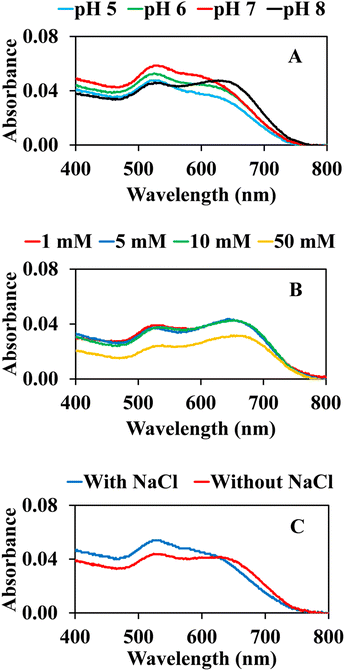 | ||
| Fig. 7 Effect of (A) pH of 1 mM phosphate buffer, (B) concentration of phosphate buffer (pH 7) and (C) 25 mM NaCl on the absorption response of AuNPs@Cyst with HCy. | ||
The concentration of the buffer could affect the colorimetric reaction; thus, we investigated this variable from 1 to 50 mM (Fig. 7B). The absorption spectra of AuNPs@Cyst with HCy showed no noticeable change after the addition of 1–10 mM, reflecting the similar aggregation of AuNPs@Cyst. The absorbance of AuNPs@Cyst-HCy with a 50 mM buffer at pH 7 was considerably lower because the high concentration of the buffer made AuNPs@Cyst unstable. This concentration was unfavorable for the aggregation of AuNPs@Cyst, therefore we chose 1 mM of phosphate buffer as the optimal condition.
Many reports have observed that NaCl can increase the aggregation of AuNPs,17,24,38 so the AuNPs@Cyst system in 1 mM buffer at pH 7 was investigated in the presence and absence of 25 mM NaCl. As seen in Fig. 7C, with NaCl, AuNPs@Cyst showed a weak response to HCy at the absorption maximum (634 nm) in comparison to the system without NaCl. Therefore, NaCl was not added to the detection system.
3.4 Selectivity of colorimetric detection
The selectivity of the AuNPs@Cyst probe was studied by observing the absorbance ratio at 634 nm (aggregation) and 525 nm (dispersion) in the presence of other pesticides. The response to cypermethrin at 1 mg L−1 was compared to the responses to carbaryl, ethion and profenofos at 1 mg L−1, and abamectin at 2 mg L−1. All interfering pesticides were hydrolyzed in the same condition as cypermethrin. The color changes and absorbance ratios in the absence (blank solution) and presence of the hydrolyzed compounds are shown in Fig. 8. Carbaryl, ethion, profenofos and abamectin did not induce aggregation and the AuNPs@Cyst aggregated after the addition of cypermethrin. The absorbance ratio of AuNPs@Cyst incubated with other pesticides was the same as the blank, while the absorbance ratio of AuNPs@Cyst-HCy was more than double that of the blank. This confirmed the selectivity of the proposed AuNPs@Cyst probe for the determination of cypermethrin.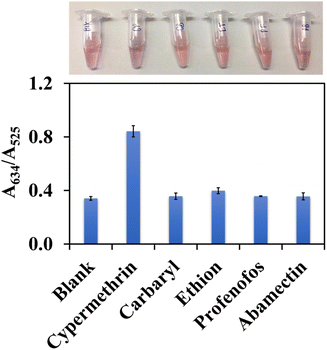 | ||
| Fig. 8 Selectivity results showing color images and absorbance ratios (A634/A525) of AuNPs@Cyst in the absence (blank) and presence of various pesticides. | ||
3.5 Analytical evaluation of AuNPs@Cyst
Based on the selectivity of AuNPs@Cyst toward HCy in the optimum condition, the calibration curve for cypermethrin determination was constructed. Fig. 9 shows that the absorbance ratio (A634/A525) increased when cypermethrin concentration increased from 0.5 to 19.0 mg L−1. The increased aggregation of AuNPs@Cyst was also indicated by gradual color changes from red to blue-gray. The absorbance ratio (y axis) was linearly related to cypermethrin concentration (x axis) from 0.5 to 13.0 mg L−1 with a regression equation of y = 0.0644x + 0.0776 (R2 = 0.9990). The limit of detection (LOD) for the cypermethrin assay was calculated from the equation LOD = 3σ/k, where σ refers to the standard deviation of the blank (n = 9) and k is the slope of the calibration curve. The LOD of this assay was 0.2 mg L−1. The test solution color changed from red to blue-gray with increasing cypermethrin concentration (Fig. 9). With the naked eye, the LOD was 0.5 mg L−1.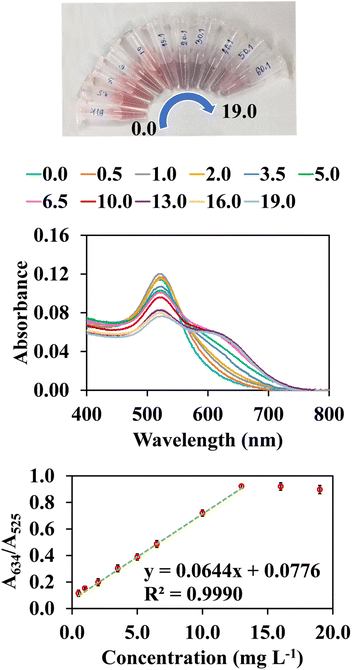 | ||
| Fig. 9 Colorimetric changes, UV-vis spectra and their correlation with absorbance ratios (A634/A525) and final concentrations of hydrolyzed cypermethrin (0.5–19.0 mg L−1). | ||
Intraday precision was evaluated by analyzing three replicates a day of three standard concentrations (3.0, 6.5 and 13.0 mg L−1). The relative standard deviations (RSDs) ranged from 1.9 to 4.2%. Interday precision was studied by analysing three replicates a day of the same standard concentrations over three consecutive days. The RSDs ranged from 6.1 to 7.3%.
The applicability of the proposed assay for the determination of cypermethrin was conducted using water treatment samples. All samples were initially filtered under vacuum, using a 0.2 μm nylon membrane to remove any dust, and degassed for 30 min. Before analysis, samples were kept in clean PTFE containers at 4 °C. Recovery was also evaluated in a real matrix at two levels of cypermethrin (3 and 8 mg L−1, final concentration) in three replicates. As shown in Fig. 10, the real sample contained no cypermethrin, which was indicated by the similarity between the spectrum of the real sample (green line) and the spectrum of the blank (red line). Recoveries were 98.7% (RSD = 5.9%) and 98.8% (RSD = 6.0%) for 3 and 8 mg L−1, respectively. This result indicated that colorimetric quantification of cypermethrin using the proposed AuNPs@Cyst probe was applicable for real sample analysis.
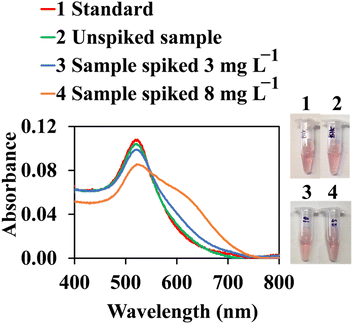 | ||
| Fig. 10 Color images and UV-vis absorption spectra of AuNPs@Cyst for cypermethrin standard, unspiked sample and samples spiked with 3 and 8 mg L−1 of cypermethrin for recovery test. | ||
3.6 Comparison with other reports
The analytical performances, i.e. LOD, linearity and recovery of our method were compared with those of reported methods for determination of cypermethrin (Table 1). The developed method was comparable in the linear range of detection and recovery compared to previous results. The GC, HPLC, SERS based AuNPs substrate, immunoassay and fluorescence assay were more sensitive than our assay, however they have disadvantages in terms of sophisticated and costly instrumentation, and the use of expensive antigens/antibodies. Compared with assays based on silver nanorod substrate for SERS, the LOD of our method is superior. At present, pyrethroids including cypermethrin are not included in the recommended water quality criteria by the US Environmental Protection Agency (US EPA)39 and their concentrations in environmental water samples have been reviewed in the range from ng L−1 level to 13 mg L−1.40 Thus, our LOD could be accepted, however this limitation can be improved by a sample pre-concentration step to increase the detection concentration. Besides, the obvious advantages of our method include fast detection time, low analysis cost and simple operation. This AuNPs@Cyst-based colorimetry could be alternative to sophisticated instrumentation like chromatography and SERS for environmental water samples.| Detection method | LOD | Linearity | Recovery (%) | Reference |
|---|---|---|---|---|
| a AuNPs@BNC = Bacterial nanocellulose decorated with gold nanoparticles; CPE = carbon paste electrode; L-cys-AgNPs = L-cysteine-modified silver nanoparticles; GC-ECD = Gas chromatography-electron capture detection; HPLC-UV = High performance liquid chromatography-ultraviolet detection; Ic-ELISA = Indirect competitive-enzyme-linked immunosorbent assay; LC-MS/MS = Liquid chromatography-tandem mass spectrometry; MIP-CdSe/CdS/ZnS QDs = Molecularly imprinted polymer-CdSe/CdS/ZnS quantum dots; NA = Not available; SERS = Surface-enhanced Raman scattering | ||||
| GC-ECD | 0.05 mg L−1 | 0.10–2.00 mg L−1 | 73.9–102.6 | 3 |
| HPLC-UV | 0.03 mg L−1 | 0.1–70 mg L−1 | 83.7–97.0 | 4 |
| LC-MS/MS | 0.05 μg L−1 | 0.1–100 μg L−1 | 84.0–103.0 | 5 |
| SERS-AuNPs@BNC | 0.04 mg L−1 | 0.04–41.63 mg L−1 | NA | 15 |
| Ic-ELISA and colloidal gold lateral flow immunoassay and color strip | 0.40 μg L−1 | 0.40–7.87 μg L−1 (IC10–IC90) | 78.8–87.6 | 16 |
| Voltammetry based on anatase TiO2-CPE | ∼0.1 mg L−1 | 0.1–1.0 mg L−1 | NA | 20 |
| Fluorescence method with MIP-CdSe/CdS/ZnS QDs | 0.30 μg L−1 or 5.0 μg kg−1 | 0.1–20.0 mg L−1 | 92.3–99.7 | 21 |
| SERS-silver nanorods | ∼0.42 mg L−1 | 0.4–416.3 mg L−1 | NA | 22 |
| L-cys-AgNPs-based colorimetry and UV-vis spectrophotometry | NA | 20–100 mg L−1 | NA | 28 |
| AuNPs@Cyst-based colorimetry and UV-vis spectrophotometry | 0.2 mg L−1 | 0.5–13.0 mg L−1 | 98.7–98.8 | This work |
4. Conclusions
A sensitive and selective colorimetric test of cypermethrin was developed using gold nanoparticles and L-cysteine (AuNPs@Cyst). The detection principle detects the 3-phenoxybenzaldehyde by-product from the alkaline hydrolysis of cypermethrin which produces a –CHO group that interacts with the –NH2 group of L-cysteine on AuNPs@Cyst through hydrogen bonding. The presence of hydrolyzed cypermethrin caused the aggregation of AuNPs@Cyst, accompanied by a red shift in the absorption spectrum and a color change from red to blue-gray. In the optimum condition, the method was precise and accurate. Moreover, the effects of other pesticide residues were negligible, confirming the selectivity of AuNPs@Cyst toward cypermethrin. It is expected that our AuNPs@Cyst colorimetric assay can sufficiently determine cypermethrin in water samples with an LOD of 0.2 mg L−1.Author contributions
Thitima Rujiralai: conceptualization, formal analysis, funding acquisition, investigation, project administration, validation, visualization, writing – original draft, writing – review & editing. Nitchakarn Leelaharat: investigation, visualization. Wilairat Cheewasedtham: validation, visualization, writing – review & editing.Conflicts of interest
There are no conflicts to declare.Acknowledgements
This research was supported by the National Science, Research and Innovation Fund (NSRF) and Prince of Songkla University (Ref. no. SCI6601229S). We gratefully acknowledge the Center of Excellence for Innovation in Chemistry (PERCH-CIC), Ministry of Higher Education, Science, Research and Innovation, Faculty of Science, Prince of Songkla University. We thank Mr Thomas Duncan Coyne for English editing.References
- National Pesticide Information Center (NPIC), Cypermethrin, accessed February 2024, online http://npic.orst.edu/factsheets/cypermethrin.pdf.
- A. –M. Saillenfait, D. Ndiaye and J. –P. Sabaté, Int. J. Hyg. Environ. Health, 2015, 218, 281–292 CrossRef CAS PubMed.
- I. Jan, A. A. Dar, A. A. Wani, M. Mukhtar, J. A. Sofi and G. I. Hassen, Biomed. Chromatogr., 2022, 36, e5373 CrossRef CAS PubMed.
- I. M. Shaheed and S. A. Dhahir, IOP Conf. Ser.: Mater. Sci. Eng., 2020, 871, 012029 CAS.
- H. –T. Liao, C. –J. Hsieh, S. –Y. Chiang, M. –H. Lin, P. –C. Chen and K. –Y. Wu, J. Chromatogr. B, 2011, 879, 1961–1966 CrossRef CAS PubMed.
- TAS 9002-2008. Pesticide Residues: Maximum Residue Limits. Thai Agricultural Standard, National Bureau of Agricultural Commodity and Food Standards, Ministry of Agriculture and Cooperatives..
- WHO/EU drinking water standards comparative table. Online, accessed February 2024, https://www.lenntech.com/who-eu-water-standards.htm.
- M. Yusuf, R. Idroes, Saiful, Lelifajri, T. K. Bakri, M. Satria, H. Nufus, I. Yuswandi, Z. Helwani, Muslem and Marlina, IOP Conf. Ser.: Earth Environ. Sci., 2021, 667, 012039 CrossRef.
- K. Ayyavoo and C. Tamilselvan, International Journal of Advance Research, Ideas and Innovations in Technology, 2019, 5, 44–50 Search PubMed.
- Y. –C. Yeh, B. Creran and V. M. Rotello, Nanoscale, 2012, 4, 1871–1880 RSC.
- S. Hussain and M. Amjad, Int. J. Nanomater. Nanotechnol. Nanomed., 2021, 7, 019–025 Search PubMed.
- H. Lee, J. –D. Liao, K. Sivashanmugan, B. H. Liu, W. Fu, C. –C. Chen, G. D. Chen and Y. –D. Juang, Nanomaterials, 2018, 8, 402 CrossRef PubMed.
- K. Sivashanmugan, K. Lee, C. –H. Syu, B. H. –C. Liu and J. –D. Liao, J. Taiwan Inst. Chem. Eng., 2017, 75, 287–291 CrossRef CAS.
- J. Sitjar, Y. –C. Hou, J. –D. Liao, H. Lee, H. –Z. Xu, W. –E. Fu and G. D. Chen, Coatings, 2020, 10, 751 CrossRef CAS.
- S. Zhang, J. Xu, Z. Liu, Y. Huang and S. Jiang, ACS Sustainable Chem. Eng., 2022, 10, 13059–13069 CrossRef CAS.
- L. Huang, F. Zhang, F. Li, Y. Jia, M. Wang, X. Hua and L. Wang, Biosensors, 2022, 12, 1058 CrossRef CAS PubMed.
- Y. Zhao, X. Ruan, Y. Song, J. N. Smith, N. Vasylieva, B. D. Hammock, Y. Lin and D. Du, Anal. Chem., 2021, 93, 13658–13666 CrossRef CAS PubMed.
- S. Hou, C. Huang, D. Zhang, Y. Shang, G. Sun, D. Peng, Y. Chen and Y. Wang, J. Hazard. Mater., 2023, 451, 131141 CrossRef CAS PubMed.
- T. S. Mashuni and M. Jahiding, Asian J. Chem., 2017, 29, 346–348 CrossRef CAS.
- M. Nurdin, M. Maulidiyah, L. O. A. Salim, M. Z. Muzakkar and A. A. Umar, Microchem. J., 2019, 145, 756–761 CrossRef CAS.
- R. –r. Zhang, X. –j. Li, A. –i. Sun, S. –q. Song and X. –z. Shi, Food Control, 2022, 132, 108438 CrossRef CAS.
- W. Leung, S. Limwichean, N. Nuntawong, P. Eiamchai, S. Kalasung, O. Nimittrakoolchai and N. Houngkamhang, Key Eng. Mater., 2020, 853, 102–106 Search PubMed.
- A. Mocanu, I. Cernica, G. Tomoaia, L. –D. Bobos, O. Horovitz and M. Tomoaia-Cotisel, Colloids Surf., A, 2009, 338, 93–101 CrossRef CAS.
- F. Chai, C. Wang, T. Wang, Z. Ma and Z. Su, Nanotechnology, 2010, 21, 025501 CrossRef PubMed.
- Sonia and R. Seth, Mater. Today: Proc., 2020, 24, 2375–2382 CAS.
- T. Rujiralai, W. Cheewasedtham, T. J. Jayeoye, S. Kaewsara and S. Plaisen, Anal. Lett., 2020, 53, 574–588 CrossRef CAS.
- V. Raj, A. N. Vijayan and K. Joseph, Sens. Bio-Sens. Res., 2015, 5, 33–36 CrossRef.
- A. Kodir, C. Imawan, I. S. Permana and W. Handayani, Pesticide Colorimetric Sensor Based on Silver Nanoparticles Modified by L-Cysteine, Presented in Part at Conference International Seminar on Sensors, Instrumentation, Measurement and Metrology (ISSIMM), Malang, Indonesia, 2016 Search PubMed.
- Y. Zhou, H. Dong, L. Liu, M. Li, K. Xiao and M. Xu, Sens. Actuators, B, 2014, 196, 106–111 CrossRef CAS.
- P. K. Sudeep, S. T. Shibu Joseph and K. G. Thomas, J. Am. Chem. Soc., 2005, 127, 6516–6517 CrossRef CAS PubMed.
- M. Nidya, M. Umadevi and B. J. M. Rajkumar, Spectrochim. Acta, Part A, 2014, 133, 265–271 CrossRef CAS PubMed.
- P. Camilleri, J. Agric. Food Chem., 1984, 32, 1122–1124 CrossRef CAS.
- H. –M. Lin, J. A. Gerrard and I. C. Shaw, Food Addit. Contam., 2005, 22, 15–22 CrossRef CAS PubMed.
- S. Aryal, B. K. C. Remant, N. Dharmaraj, N. Bhattarai, C. H. Kim and H. Y. Kim, Spectrochim. Acta, Part A, 2006, 63, 160–163 CrossRef PubMed.
- S. Devi, B. Singh, A. K. Paul and S. Tyagi, Anal. Methods, 2016, 8, 4398–4405 RSC.
- I. –I. S. Lim, D. Mott, W. Ip, P. N. Njoki, Y. Pan, S. Zhou and C. –J. Zhong, Langmuir, 2008, 24, 8857–8863 CrossRef CAS PubMed.
- S. Mandal, A. Gole, N. Lala, R. Gonnade, V. Ganvir and M. Sastry, Langmuir, 2001, 17, 6262–6268 CrossRef CAS.
- N. Bi, Y. Chen, H. Qi, X. Zheng, Y. Chen, X. Liao, H. Zhang and Y. Tian, Sens. Actuators, B, 2021, 166–167, 766–771 Search PubMed.
- The US Environmental Protection Agency. National Recommended Water Quality Criteria - Human Health Criteria Table, accessed February 2024, online https://www.epa.gov/wqc/national-recommended-water-quality-criteria-human-health-criteria-table.
- W. Tang, D. Wang, J. Wang, Z. Wu, L. Li, M. Huang, S. Xu and D. Yan, Chemosphere, 2018, 191, 990–1007 CrossRef CAS PubMed.
Footnote |
| † Electronic supplementary information (ESI) available. See DOI: https://doi.org/10.1039/d3ra07626a |
| This journal is © The Royal Society of Chemistry 2024 |


