DOI:
10.1039/D3RA07556G
(Paper)
RSC Adv., 2024,
14, 4614-4622
Impacts of pre-treatment methods on the morphology, crystal structure, and defects formation of hydroxyapatite extracted from Nile tilapia scales
Received
5th November 2023
, Accepted 27th January 2024
First published on 5th February 2024
Abstract
The comprehensive control of hydroxyapatite (HAp), involving morphological and structural variations, particle sizes, and defect formations, has garnered considerable attention for its versatile functionalities, rendering it applicable in diverse contexts. This work examined the shape, structure and optical characteristics, and defect formation in hydroxyapatite (HAp) extracted from Nile tilapia (Oreochromis niloticus) scales with various pre-treatments through experiments and density functional theory (DFT) calculations. Utilizing scanning electron microscopy, our findings revealed that dried fish scales (FS-D) exhibited a layered pattern of collagen fibers, while boiled fish scales (FS-B) had smoother surfaces and significantly reduced collagen content. After calcination, the FS-D sample produced nanorods with an average length of 150 ± 44 nm, whereas the FS-B samples yielded agglomerated spherical particles whose size increased with the rising calcining temperature. In-depth analysis through X-ray diffraction and Fourier-transform infrared spectroscopy confirmed the presence of biphasic calcium phosphates in the FS-B samples, while the FS-D sample presented a pure HAp phase. The boiled fish scale calcined at 800 °C (FS-B800) exhibited an optical band gap (Eg) of 5.50 eV, whereas the dried fish scale calcined at 800 °C (FS-D800) showed two Eg values of 2.87 and 3.97 eV, as determined by UV-visible spectroscopy. DFT calculations revealed that the band gap of 3.97 eV correlated with OH− vacancies, while that of 2.87 eV indicated Mn-substituted HAp, explaining the blue powder. The Eg value for the white powder resembled pure HAp, S− and Cl− substituted OH− vacancies, and various cations substituting Ca sites of HAp. Different pre-treatment procedures influence the characteristics of HAp, offering opportunities for applications in bone replacement and scaffolds for bone tissue engineering.
1 Introduction
Hydroxyapatite (HAp) is the primary inorganic component of bone tissue and is a calcium phosphate-derived mineral with the chemical formula Ca10(PO4)6(OH)2.1 Owing to its structural resemblance to human bone, excellent biocompatibility, and high bioactivity, HAp has a wide range of applications in biomedicine, including bone defect filling, aesthetic surgery, and bone tissue engineering.2 The particle size, morphology, and microstructure of HAp have significantly impacted its physical, chemical, and biological characteristics.3 For instance, plate-like HAp particles can improve absorption properties and be used as reinforcing materials and adsorbents for chromatography.4 HAp powders of the whisker or fiber type can be added to promote the self-hardening of bone cement.5 Spherical HAp with a large surface area is needed for surface coating and bone fillers.6
For the past few decades, various research projects have aimed to create pure and crystallized HAp with regulated morphology, particle size, and desirable properties for unique applications.7 Researchers have developed several preparation techniques, including thermal treatment,8 molten salt synthesis,9 electrochemical deposition,10 and hydrothermal methods.11 Several doped-HAps synthesized through hydrothermal processes have exhibited needle- or rod-like forms and reduced average particle sizes.12,13 During the preparation of HAp, additional calcium phosphate impurities are always present. These impurities contribute to the distortion effect of the dopant atom, which reduces the average particle and crystallite sizes and modifies the shape of HAp.14
Based on numerous experimental studies, the band gap of HAp, a dielectric material, has been found to range from 3.8 to 4.5 eV,15 which is slightly lower than the estimated values of >5 eV derived from computational calculations.16 These discrepancies in the estimated band gap are attributed to different structural defects in HAp.15,17 For example, during the manufacture and treatment of HAp samples, heating at specific temperatures can lead to the removal of OH− groups, resulting in the formation of dehydrated HAp, which alters the band gap.17 Transition metal doping is another approach to reduce the band gaps of wide-gap semiconductors to as low as 2–3 eV,16,18 which can result in optical absorbance in the visible region and alter the electrical properties.19 Doping has become a feasible option to manage these crucial variables for bio applications, such as creating biocompatible multifunctional pigments for the cosmetics industry. Furthermore, the size and shape of semiconductors can also impact the band gap and optical characteristics. Therefore, it can be concluded that the synthetic process and the inherent characteristics of the final product have a significant impact on the band gap and optical properties of HAp.18
The biocompatibility and affordable production of HAp derived from natural sources have garnered significant interest. In bone structures, HAp crystallizes in conjunction with the organic component (collagen) and living bone cells.15,20 Naturally occurring HAp found in living things exhibits structural heterogeneities, stoichiometric imbalances, numerous trace elements, and defects that distinguish it from ideal synthesized HAp.21 Defective natural HAp structures promote greater biocompatibility, adhesion, attachment of bone cells, and their proliferation because they more closely resemble biological HAp.15 Prepared HAp from various natural sources produces extremely disparate morphologies and structures. For instance, an elongated mixture of HAp and β-TCP was extracted from black tilapia fish wastes, which later transformed into a normal shape when heated at higher temperatures.22 Calcining Nile tilapia powder at 800 °C for five hours produced micrometer-scaled irregularly shaped particles with a specific surface area of 8.25 m2 g−1.8 The transformation from flower-like to agglomerated spherical and irregularly shaped poultry eggshell-derived HAp structures was observed at elevated calcining temperatures.23 The HAp extracted from Pangasius hypophthalmus fish bone exhibited agglomerated and porous structures on an oval shape.24 It is seen that the precise control of HAp in terms of morphology, structure, and optical properties is paramount for its biomedical applications, influencing key biological characteristics such as biocompatibility, bioactivity, stability, and mechanical properties. Different morphologies of HAp can exert varying effects on biological responses, including protein adsorption, cell viability, and cytotoxicity.7,25 Notably, HAp with a higher specific surface area and increased surface roughness, attributed to distinct morphologies and particle sizes, has demonstrated improved biological performance, enhanced resorbability, and increased HAp proliferation.26 For instance, nanophase HAp exhibited an 11% higher absorption of fetal bovine serum proteins compared to conventional HAp.27 Structural control is equally crucial. In biphasic calcium phosphate ceramics (BCPs), the ratio between HAp and β-TCP stands out as a pivotal factor influencing osteoinduction and controlled biodegradability, critical aspects in bone substitution for reconstructive surgery.28 Optical control also gains significance when HAp is employed in drug delivery systems and diagnostic imaging, alongside its utilization in oral care products,29 and its integration into pigment components within face powder and oil-absorbing blotting paper.16
In this study, we present experimental findings on the variation in shape, structure, optical characteristics, and defects formation of HAp extracted from Nile tilapia (Oreochromis niloticus) scales through different pre-treatment procedures, namely boiling and drying. To characterize these variations, we utilized a range of analytical techniques, including X-ray diffraction (XRD), Fourier-transform infrared spectroscopy (FTIR), field emission scanning electron microscopy (FE-SEM), and UV-visible spectroscopy (UV-vis). Combining experimental observations with density functional theory (DFT) calculations facilitates the elucidation of a straightforward and non-chemical technique for obtaining HAp with diverse characteristics. The variations in morphology, structure, and optical properties in HAp, resulting from distinct pre-treatment procedures, offer opportunities for various and specific applications. These applications include diverse positions in bone replacement, osteoinduction and controlled biodegradability for reconstructive surgery, as well as applications in aesthetic contexts.
2 Experimental section
2.1 Preparation of hydroxyapatite powder from Nile tilapia scales
In this study, Nile tilapia (Oreochromis niloticus) scales obtained as a by-product from a local fish market in the northeast of Thailand were utilized as the starting material. Fig. 1 shows that two different extraction methods were employed to obtain the HAp powders. In the first method, the scales were cleaned and stripped of soft tissues, lipids, and other organic contaminants by boiling them for three hours and then washing them under running water. Subsequently, the scales were sun-dried for three days. Based on the literature,30 the decomposition of collagen, water, and organic residues in tilapia scales could occur at temperatures below 550 °C, and the appearance of a slight weight loss at this temperature signifies the development of the crystalline HAp phase. The formation and improved maturation of the crystalline HAp necessitate further heating.31 The scales obtained were calcined at 600, 700, 800, and 900 °C, with a heating rate of 5 °C min−1 for 2 hours in an air atmosphere, and then cooled naturally in an electric furnace (Vulcan 3-550 Furnace, USA). The resulting product was then processed for 10 minutes in an electric herb grinder to obtain the HAp powders designated as FS-B600, FS-B700, FS-B800, and FS-B900, respectively. In the second method, the boiling step of the tilapia scales was omitted, and after being sun-dried, they were calcined at 800 °C under the same conditions as in the first method. The final product was labeled as FS-D800 powder. The shape, elemental composition, crystal structure, and band gap of the HAp powders produced using different extraction methods were compared and analyzed.
 |
| | Fig. 1 Diagram of HAo powder extracted from Nile Tilapia scales using two different pre-treatment processes. | |
2.2 Characterizations
The specific surface area of all powders was measured using N2 adsorption/desorption and the Brunauer–Emmett–Teller (BET) method with a Micromeritics 3Flex Adsorption Analyzer (USA). The morphology of all powders was characterized by FE-SEM with a Zeiss AURIGA (Germany) instrument, operating at 5 kV in secondary electron (SE) mode. Given the non-conductive nature of tilapia scales, a layer of gold coating was applied to the specimen surface to mitigate surface charging effects during SEM analysis. Particle size analysis was obtained using ImageJ software, covering a total area of 3.83 μm2. The elemental composition of FS-B800 and FS-D800 powders was analyzed using X-ray fluorescence spectrometry (XRF) with a S8 Tiger instrument from Bruker (USA). The functional groups in the powders within the range of 4000–500 cm−1 were identified by FTIR using the diamond lens Attenuated Total Reflectance (ATR) probe, integrated into TENSOR27 instrument from Bruker (USA). The phase structures of all powders were determined using XRD at room temperature with a PANalytical EMPYREAN instrument (The Netherlands), with data collected at 2θ values ranging from 10° to 60°. UV-vis spectra were obtained using a Shimadzu UV-VIS-NIR-3101PC scanning spectrophotometer (Japan), which was equipped with an integrating sphere, covering the wavelength range of 300–800 nm. The measurements were conducted on both FS-B800 and FS-D800 powders, as well as reference material (BaSO4). The indirect transition band gap (Eg) of the HAp powder was calculated using a modified Kubelka–Munk equation:32,33| | |
(F(R∞) × hν)1/2 = B(hν − Eg)
| (1) |
where F(R∞) or α is a measure of the ratio of scattering to absorption in the material, which can be determined by α = (1−R)2/2R. R is the reflectance of the material, h is the Planck constant, ν is the photon's frequency, B is a constant, and Eg is the band gap energy. Therefore, the (F(R∞) × hν)1/2 vs. hν was plotted to determine the Eg values of the FS-B800 and FS-D800 powders.
2.3 Computational details
The simulations were performed using periodic DFT with a generalized gradient approximation (GGA) functional by Perdew, Burke, and Ernzerhof,34 implemented in the Vienna Ab initio Simulation Package (VASP).35 The projector augmented wave (PAW) method36 was used to describe the electron wave functions, and plane waves were included up to a cutoff energy of 520 eV. Specific k-points were chosen using a 3 × 3 × 7 Monkhorst–Pack grid37 for Brillouin zone integration. Convergence of the self-consistent iterations was assumed when the total energy and force difference between cycles were less than 0.001 meV per atom and 0.01 meV Å−1, respectively. The hexagonal crystal structure of HAp (space group P63/m, No. 176) with 44 atoms (10 Ca atoms, 6 P atoms, 2 H atoms, and 26 O atoms) was used in the simulations. The Ca atoms in HAp have two non-equivalent Ca sites (Ca-1 and Ca-2). The Ca-1 site is coordinated by six PO43− tetrahedra, while the Ca-2 site is coordinated by six PO43− tetrahedra with one oxygen atom belonging to the OH group. In the model doping processes, one Ca atom was replaced with an M atom. The defect formation energy for the substitution of ionic species M2+ with Ca2+ in HAp was calculated using the following equation:38| | |
Ef = Etd − Etp + μCa2+ − μM2+
| (2) |
In the above equation, the value of Etd represents the total energy of the doped HAp structure with the substitution of ionic species M2+. The value of Etp represents the total energy of a perfect, undoped HAp structure. The chemical potentials of Ca2+ and M2+ are denoted by μCa2+ and μM2+, respectively. These chemical potentials are determined by the total energy of one Ca atom in bulk Ca and one M atom in bulk M, respectively.
3 Results and discussion
3.1 FE-SEM analysis of dried and boiled fish scales
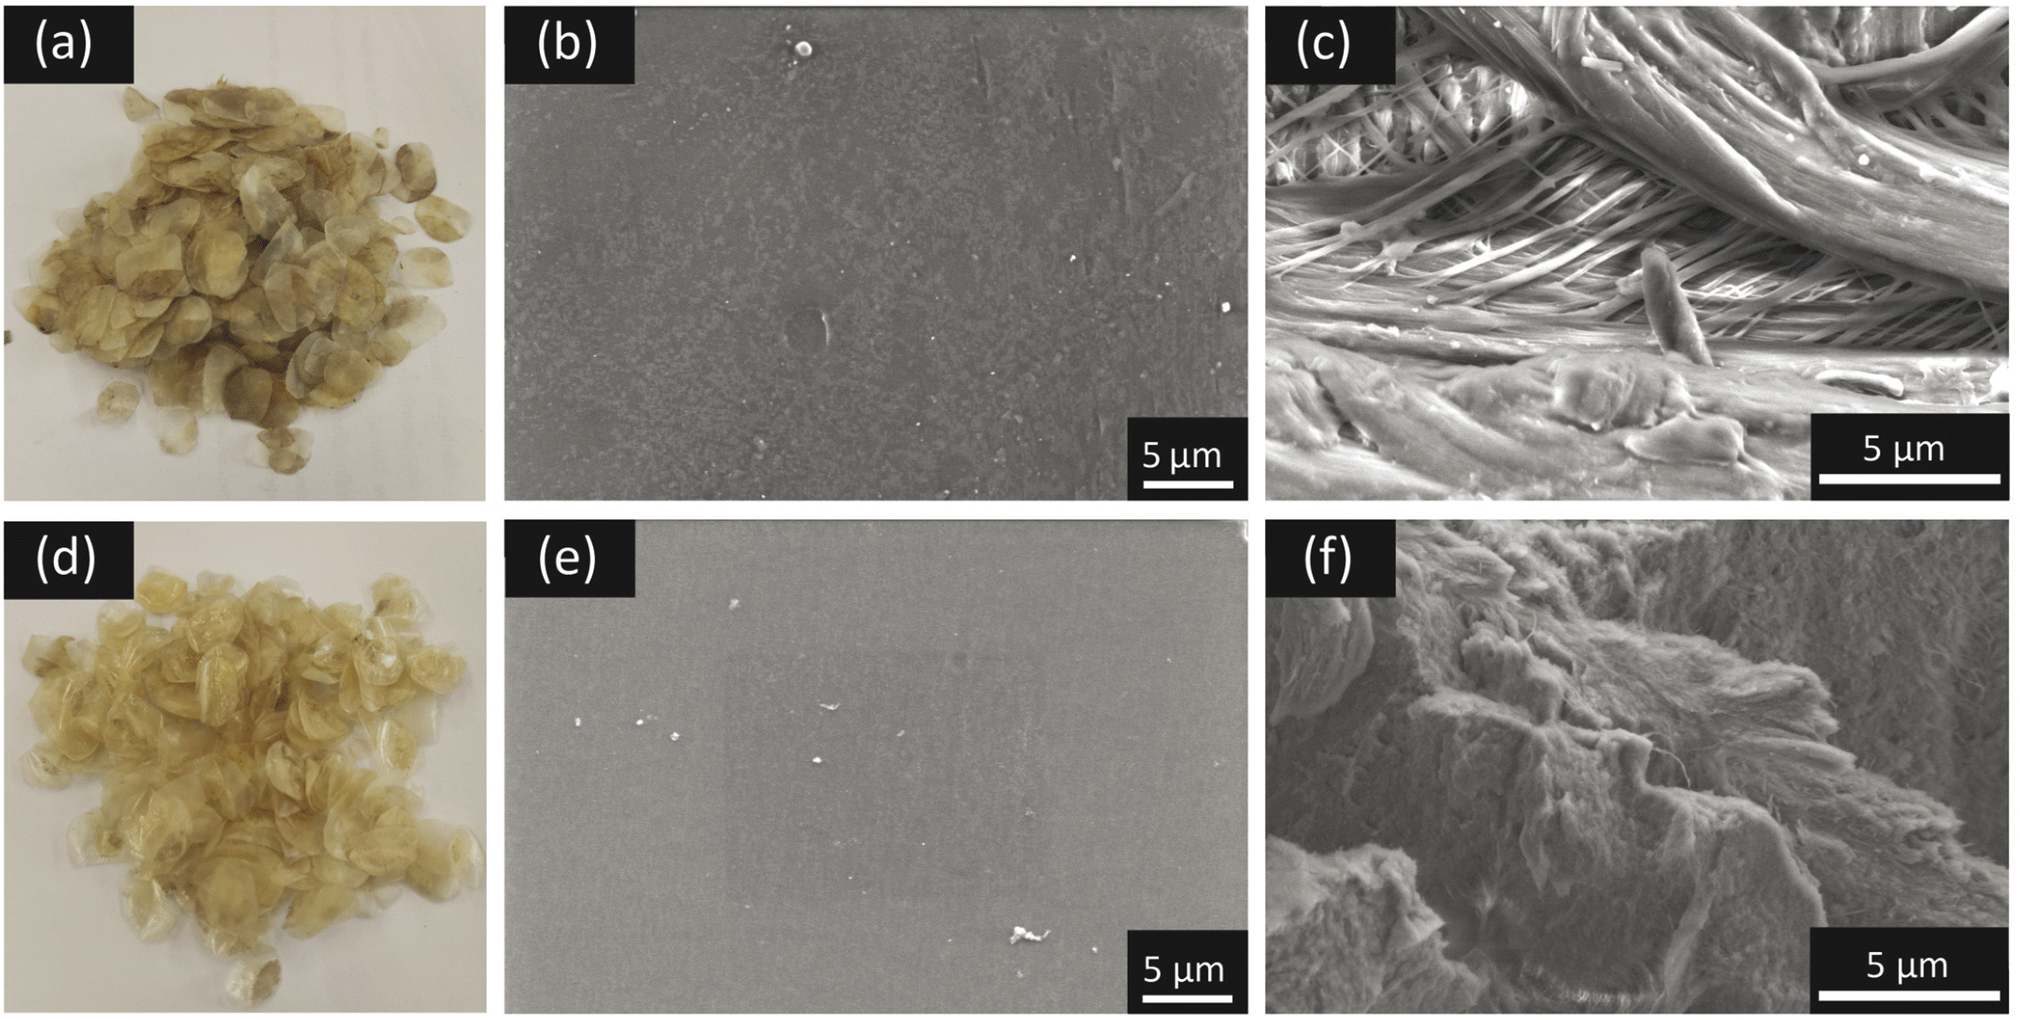
Tilapia scales are typically composed of type I collagen fibers, which account for 30–55% of the total weight, and inorganic components, including HAp particles and trace elements (such as Mg, Na, Mn, Sr, etc.), which make up 7–25% of the weight. These components are well-arranged and distributed throughout the inner scales, with the inorganic components adhered to the collagen fiber, forming the main component of the extracellular matrix.39 To investigate the morphology of tilapia scales after boiling and drying, the samples were characterized through FE-SEM. Photographic and SEM images of the precursors after boiling and drying are shown in Fig. 2. The analysis revealed that the dried sample exhibited a brownish scale with a high degree of surface roughness. As depicted in Fig. 2c, the collagen fibers were arranged in a layered pattern and random network on the fish scale. Conversely, the boiled sample demonstrated a brighter color and smoother surface (Fig. 2d and e). Notably, the SEM image of the boiled sample revealed a noticeable difference suggesting a significant reduction in collagen content, as compared to the dried sample. This observation suggests that boiling is critical for removing contaminants, reducing surface roughness, and degrading collagen in fish scales.
 |
| | Fig. 2 Comparative characterization of fish scales subjected to different processing methods. (a) Photographic representation, (b) low-resolution and (c) high-resolution SEM images illustrating the microstructure of dried fish scales. (d–f) Corresponding representations for fish scales subjected to boiling. The images provide insight into the visual and structural changes induced by the drying and boiling processes. | |
3.2 Appearance, morphology and surface area of HAp powders
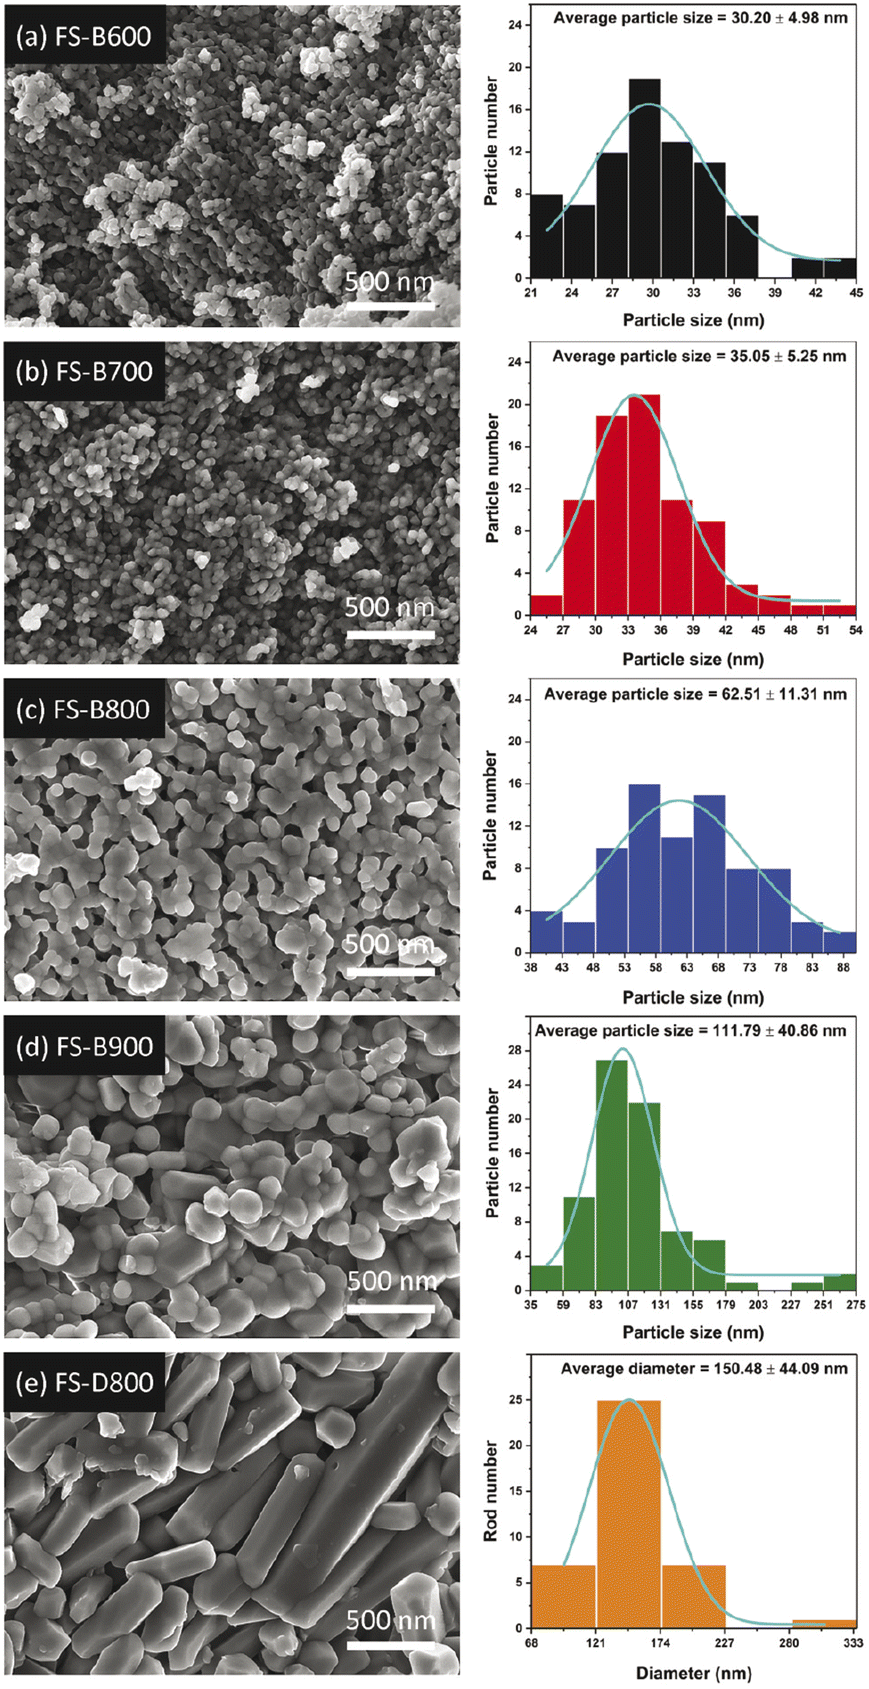
The initial assessment of various properties of HAp powders extracted from different pre-treatments focuses on the variation in color. As indicated in Table 1 presents the variations in color, particle size, and surface area of calcined tilapia scales prepared using different calcination temperatures and preparation methods. It was observed that the FS-B600 powder initially appeared as a light brown color and subsequently turned white at higher temperatures, indicating the presence of organic elements in the FS-B600 powder. The FS-B700, FS-B800, and FS-B900 powders were white, indicating the complete removal of organic elements. However, the FS-D800 powder was blue, suggesting a distinct mechanism involved in this preparation method. Previous studies have investigated the chemical method and heat treatment process for extracting HAp powder from tilapia scales, and they have reported HAp powders in a range of colors, including white, soft blue, soft pink, light yellow, and white-blue, which may be due to trace elements or defects.31 The color change from pale yellow to white during the calcination process of the tilapia scales is attributed to the complete or incomplete decomposition of organic matter. Therefore, the change from white to blue and other characteristics observed in the HAp powders extracted from tilapia scales is interesting. This study aims to analyze and discuss the differences between the white and blue powders in greater detail.
Table 1 Effect of calcination temperature on color, average particle size, and surface area of HAp powders extracted from tilapia scales
| Sample |
Calcination temperature (°C) |
Color |
Average particle size (nm) |
Surface area (m2 g−1) |
| Average diameter (nm). |
| FS-B600 |
600 |
Light brown |
30.20 ± 4.89 |
83.50 |
| FS-B700 |
700 |
White |
35.05 ± 5.25 |
41.55 |
| FS-B800 |
800 |
White |
62.51 ± 11.31 |
15.43 |
| FS-B900 |
900 |
White |
111.79 ± 40.86 |
10.73 |
| FS-D800 |
800 |
Blue |
150.48 ± 44.09a |
6.74 |
To confirm the distinct behavior between HAp powders obtained from different calcination temperatures and preparation methods, FE-SEM images at a magnification of 50 k and particle size analysis of HAp were utilized, as illustrated in Fig. 3. Fig. 3a to d present the morphology of the HAp powders extracted from boiled scales. These particles were observed to have spherical shapes, and their size increased with increased calcination temperature. This increase in size may be attributed to the enhanced driving force, leading to melting and larger HAp particle formation.40 However, the FS-D800 powder exhibited a rod-like shape (Fig. 3e). The formation of nanorods in the FS-D800 powder may be due to the strong reaction between the amino acid composition of collagen fiber and HAp in the tilapia scales, which facilitates nanorod nucleation and growth during calcination.41 The length of these rods varied from 275 to 1315 nm, with an average diameter of 150 ± 44 nm, which is larger than that of the spherical HAp particles. BET analysis revealed that the FS-B600 powder had a high surface area of up to 83.5 m2 g−1, which decreased with increased calcination temperature. The FS-D800 powder had a surface area of 6.74 m2 g−1, much lower than the FS-B samples due to its larger particle size.
 |
| | Fig. 3 SEM micrographs of the (a) FS-B600, (b) FS-B700, (c) FS-B800, (d) FS-B900, and (e) FS-D800 at 50 k magnification. The right panels show histograms to determine their particle sizes. | |
3.3 Elemental composition of FS-B800 and FS-D800 powders
The elemental compositions of the FS-B800 and FS-D800 powders were determined by XRF analysis, and the results are presented in Table 2. These samples contain not only the main compositions of Ca and P but also other trace elements, including Mg, Na, Cl, S, Si, Sr, Mn, K, Zn, Fe, and Al, with light elements such as C, O, and H as the remaining balance. These elements are commonly found in human bones and teeth.2,22 The Ca, P, and Mg compositions are similar between the two samples, while the Na, Cl, S, and Mn contents of the FS-D800 powder are moderately higher than those of the FS-B800 powder. These differences may be attributed to residual organic compounds in the starting precursors.
Table 2 Elemental composition of FS-B800 and FS-D800 powders
| Element |
Amount (at%) |
| FS-B800 |
FS-D800 |
| Ca |
36.32 ± 0.80 |
34.17 ± 1.03 |
| P |
20.66 ± 0.55 |
19.47 ± 0.58 |
| Mg |
1.03 ± 0.04 |
1.08 ± 0.03 |
| Na |
0.88 ± 0.07 |
1.12 ± 0.03 |
| Cl |
≤0.04 |
0.15 ± 0.01 |
| S |
0.16 ± 0.01 |
0.24 ± 0.01 |
| Si |
≤0.06 |
— |
| Sr |
≤0.03 |
≤0.05 |
| Mn |
≤0.01 |
≤0.04 |
| K |
— |
≤0.03 |
| Zn |
≤0.01 |
≤0.01 |
| Fe |
≤0.01 |
— |
| Al |
≤0.03 |
— |
| Light elements (i.e., C, O, and H) |
Balanced |
Balanced |
3.4 FTIR analysis
The chemical compositions of all samples were confirmed by studying their functional groups using FTIR. This analysis provides insights into the specific chemical bonds present in the samples, contributing to a comprehensive understanding of their molecular structures. Fig. 4 illustrates the FTIR spectra of the calcined powders. The absorption bands at 1087, 1020, and 962 cm−1 correspond to the ν1 and ν3 vibrational modes of the phosphate group, indicating the presence of HAp in all powders. The ν4 vibrational band of the phosphate group is represented by the bands at 602 and 566 cm−1. The bands at 3570 and 635 cm−1 are assigned to hydroxyl groups of the HAp crystal. The broad bands observed around 3000 cm−1 may indicate the OH−1 vibration modes of adsorbed water or CH groups.2 The presence of peaks around 1400–1500 and 870 cm−1 is associated with CO32− groups, indicating the presence of remaining carbonates or carbonate apatite (CHAp) in the calcined powders, typically found in natural HAp.42 The FS-B samples showed an increase in the PO43− doublet absorption bands at approximately 982 and 947 cm−1, indicating the formation of the β-TCP phase at elevated temperatures.43 In contrast, there were no β-TCP bands in the FS-D800 sample, but additional bands between 700–800 cm−1 were observed, which can be attributed to the remaining organic molecules.
 |
| | Fig. 4 FTIR spectra of HAp powders obtained from dried and boiled fish scales. | |
3.5 Crystal structure of fish bone powders
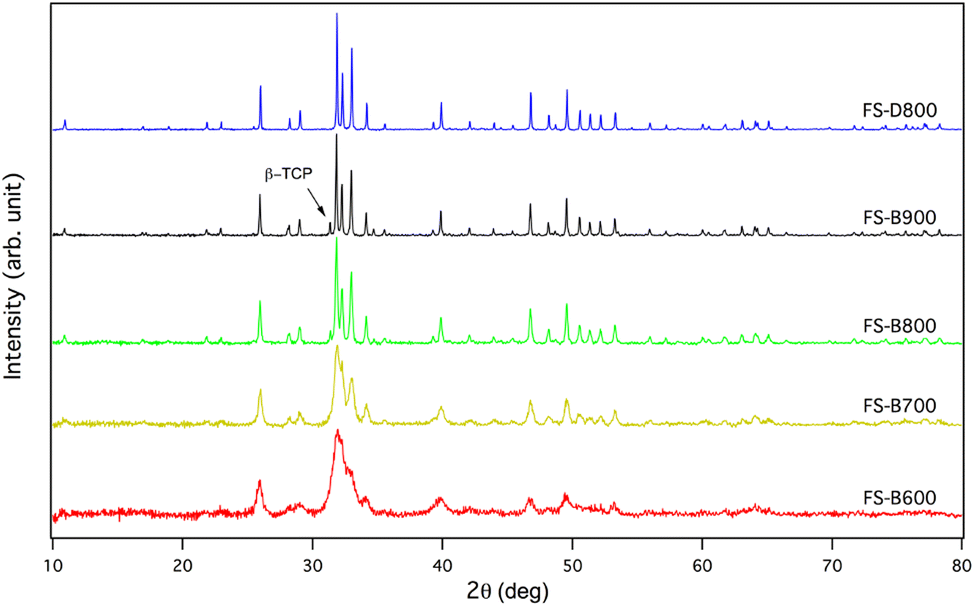
The differences in phase structure and composition were studied through the examination of crystal structures using XRD. XRD analysis provides insights into the crystalline phases present in the samples, facilitating a comprehensive characterization of their material properties. Fig. 5 illustrates the room-temperature XRD patterns of all calcined powders. The FS-D800 powder displayed Bragg reflections that agreed with the patterns indexed as HAp (JCPDS No. 01-072-1243). On the other hand, the FS-B samples exhibited biphasic calcium phosphates, consisting of HAp with small quantities of β-tricalcium phosphate (β-TCP) phase (JCPDS No. 01-070-2065), without any other impurities. The calcined boiled powders displayed sharper XRD peaks without a new phase, indicating the improvement of crystallinity with elevated operating temperature, consistent with earlier studies.44 According to Scherrer's equation, an increase in crystallite size from 24.64 to 143.96 nm was calculated from the highest non-overlapping peaks (i.e., 2θ ∼ 26, 29, and 33°).45 The FS-B900 powders contained up to 15% of the β-TCP phase, which may be attributed to the HAp decomposition.46
 |
| | Fig. 5 Powder X-ray diffraction patterns of FS-B600, FS-B700, FS-B800, FS-B900, and FS-D800 powders. | |
Remarkably, the FS-D800 powder obtained was pure HAp without any β-TCP phase, which is unusual since β-TCP is typically observed at this calcining temperature. One possible explanation is that it includes trace elements like Mg, which can prevent phase transformation, leading to consistently sized HAp particles. The rich organic/collagen environment may also contribute to this effect.47,48 The trace elements are more evident in cases where HAp particles are strongly bonded with collagen fibers, as revealed by SEM and XRF analysis. This environment may help confine the trace components within the structure and stabilize HAp, preventing its decomposition into β-TCP. This is consistent with prior research that showed blue-colored calcium phosphates could only be obtained in a pure HAp sample when Mn ions or other contaminants were substituted in its special structure.49
3.6 UV-vis and color powders
The identification of absorption spectra and determination of their corresponding optical band gap were carried out using UV-vis spectra and the modified Kubelka–Munk equation. This approach allows for a comprehensive understanding of the electronic and optical properties of our HAp powders. Fig. 6a presents the UV-vis spectra of FS-B800 and FS-D800 powders. The FS-B800 powder displayed an absorption band at approximately 300 nm, with no apparent absorption in the visible region (380–750 nm). This result is consistent with previous reports on undoped-HAp.50,51 In contrast, the FS-D800 powder exhibited a distinct absorption band around 650 nm, with increased intensity at around 320 nm wavelength. This outcome may have been caused by trace elements in the HAp environment, which have been observed in several doped HAps.50,51 The blue color of this sample corresponds to the absorption of orange spectra (∼650 nm), which subsequently reflects blue color. Subsequently, a Tauc plot was employed to calculate the band gap energy (Eg) of each sample, as shown in Fig. 6b.52 By extrapolating the absorption edge of each sample, the indirect band gap was determined. FS-B800 has an Eg of 5.50 eV, while FS-D800 has two Eg values of 2.87 eV and 3.97 eV (indicated by the dashed lines in Fig. 6b). These Eg values are consistent with the colors of the samples.
 |
| | Fig. 6 (a) UV-visible profiles of FS-B800 and FS-D800 powders. (b) Tauc plot for determination of energy band gap (Eg). | |
The band gap of HAps can be influenced by several factors, including their particle size, morphology, and chemical composition. For example, nanosized HAps have been shown to have a slightly larger band gap than larger particles due to quantum confinement effects.53,54 Additionally, the shape of HAp particles can also affect their band gap due to the variation of their porosity, pore sizes, and surface roughness.54 However, the band gap changes in our work are distinct and could instead be affected by various defects and compositions, as defects and disorders in the crystal lattice can introduce energy levels within the band gap. Substitution of various cations and anions into HAps can alter their electronic properties by introducing energy levels within the band gap.
3.7 Density of states and formation energy calculations
Density of states (DOS) and formation energy (Eform) calculations were conducted to investigate the distinct behaviors of samples with different dopings/defects in HAp. Fig. 7, pure HAp exhibited a calculated Eg of 5.28 eV, consistent with a previous report.16 Introducing one or two OH− vacancies in the HAp structure reduced the band gap, with values decreasing to 3.81/1.55 eV and 3.46 eV, respectively. When anions such as S− and Cl− were substituted into these OH− vacancies (SOH and ClOH), the band gap increased to 4.93 and 5.46 eV, respectively. It is evident that most transition metal cations prefer to be doped into the Ca sites of HAp. The band gaps of 4.74–5.32 eV were determined for Mg2+ (Mg-HAp), Na1+ (Na-HAp), Sr2+ (Sr-HAp), and Zn2+ (Zn-HAp) substitution in the Ca site, respectively, while Mn2+ substituted HAp (Mn-HAp) showed a much smaller band gap of 2.88 eV. The observed 5.5 eV band gap of the white FS-B800 sample is similar to that of pure HAp, ClOH, SOH, and Mg, Na, Sr, and Zn-HAp defects. The band gap of 1OHv, 2OHv, and Mn-HAp defects is consistent with that of the FS-D800 sample.
 |
| | Fig. 7 Displays the calculated total density of states, represented in units of states per electronvolt (states/eV), for several scenarios. These scenarios include a pristine HAp structure, one or two groups of OH− vacancies (1OHv and 2OHv), anions substitution in one group of OH− (SOH and ClOH), and various cations substitution in a Ca atom of HAp. | |
The formation energy (Eform) can be determined to assess the energy required to form defects in HAp. It is observed that all cases have a higher Eform compared to pure HAp, implying that it requires energy to form all defects. Higher formation energy indicates that these scenarios are more challenging to form or easier to remove. To form OH− vacancies, 5.66 and 10.87 eV are required for 1OHv and 2OHv, respectively. This value exceeds that of ClOH, SOH, and pure HAp. For Ca1 and Ca2 substitution, Mn-HAp has the highest Eform with values of 7.85 and 7.61 eV, respectively. The Eform values for Mg, Na, Sr, and Zn range from 0.38–5.13 eV and are shown in Table 3.
Table 3 The calculated defect formation energies for defect models in HAp
| Doping/defect model |
Eg (eV) |
Eform (eV) |
Doping/defect model |
Eg (eV) |
Eform (eV) |
| Ca1 |
Ca2 |
| Reference formation energy. |
| Pure-HAp |
5.28 |
0a |
Mn-HAp |
2.88 |
7.85 |
7.61 |
| 1OHv |
3.81/1.55 |
5.66 |
Mg-HAp |
5.08 |
2.06 |
2.11 |
| 2OHv |
3.46 |
10.87 |
Na-HAp |
5.12 |
4.96 |
5.13 |
| SOH |
4.93 |
4.96 |
Sr-HAp |
5.32 |
0.38 |
0.41 |
| ClOH |
5.46 |
1.49 |
Zn-HAp |
4.74 |
4.82 |
4.83 |
Regarding the case of FS-D800, the band gap is consistent with 1OHv, 2OHv, and Mn-HAp, indicating that the calcination process provides enough energy to form these defects. This result is consistent with the previously observed blue color in pure HAp described by Mn ions substitution in its special structure rather than the white color in TCP.49 It also suggests that when preparing HAp in the precursors with collagen/organic matrix, trace components should be better bonded in the HAp structure. This encourages HAp phase stabilization, enabling it to host the transition metal in its unique crystal structure.49 On the other hand, when the fish bone is boiled in a water environment with an abundance of O and H bonds, it is possible that the OH− will fill the vacancies or prefer to form into the β-TCP phase. As demonstrated in Fig. 2, boiling can detach collagen/matrix and may remove defects with high Eform, such as Mn-HAp, from the structure.
4 Conclusions
The results of our study reveal important insights into the influence of pre-treatment techniques on hydroxyapatite (HAp) properties and emphasize that the control of morphological, structural, and optical properties of HAp is crucial for its intended applications. We demonstrated the non-chemical control of HAp properties using different pre-heating techniques, namely boiling and drying. The main difference between these approaches is that dried scales had tightly attached collagen fibers in the HAp matrix, whereas boiled scales did not. The boiled HAp samples are white, with spherical and agglomerated particles, biphasic calcium phosphates, and indirect band gap (Eg) values of 5.50 eV. In contrast, the dried sample is blue and has a rod-like morphology. It exhibited a pure HAp phase with Eg values of 2.87 eV and 3.97 eV. The DFT calculations revealed that the band gap of 3.97 eV can be attributed to OH− vacancies, while the band gap of 2.87 eV indicated the incorporation of Mn in the HAp structure. On the other hand, the band gap value of the boiled sample closely resembled that of pure HAp. Furthermore, it suggested the presence of S− and Cl− substituting OH− vacancies and several cations substituting Ca sites in the HAp structure. Integrating experimental observations with DFT calculations has proven invaluable in establishing a straightforward and non-chemical methodology for producing HAp with diverse characteristics. The variations obtained in morphology, structure, and optical properties of HAp, influenced by distinct pre-treatment procedures, present versatile opportunities for specific applications. These variations in properties could significantly impact different aspects, including mechanical properties, biocompatibility, and resorbability. Such tailored properties make HAp suitable for specific applications, ranging from bone replacement with specific mechanical requirements to various tissue engineering applications or aesthetic uses.
Author contributions
Tanachat Eknapakul: conceptualization, investigation, validation, visualization and writing – original draft. Surasak Kuimalee: data curation and formal analysis. Wutthigrai Sailuam: formal analysis, investigation, methodology and visualization. Sujittra Daengsakul: methodology and resources. Nantawat Tanapongpisit: data curation and formal analysis. Peerawat Laohana: data curation and formal analysis. Wittawat Saenrang: methodology, investigation and validation. Atipong Bootchanont: validation and writing – review & editing. Atchara Khamkongkaeo: conceptualization, methodology, investigation, validation, visualization and writing – review & editing. Rattikorn Yimnirun: funding acquisition and supervision.
Conflicts of interest
There are no conflicts to declare.
Acknowledgements
The authors would like to thank the Faculty of Science, Khon Kaen University, for providing the XRD measurement, UV-vis, and FTIR facilities. We gratefully acknowledge the Center for Scientific and Technological Equipment Suranaree University of Technology for providing the SEM facility. This research work has received funding support from the NRFS via the Program Management Unit for Human Resources & Institutional Development, Research, and Innovation (PMU-B) (grant number B05F640090).
References
- H. L. Jang, K. Jin, J. Lee, Y. Kim, S. H. Nahm, K. S. Hong and K. T. Nam, ACS Nano, 2014, 8, 634–641 CrossRef CAS PubMed.
- T. Goto and K. Sasaki, Ceram. Int., 2014, 40, 10777–10785 CrossRef CAS.
- I. S. Neira, Y. V. Kolen’ko, O. I. Lebedev, G. Van Tendeloo, H. S. Gupta, F. Guitián and M. Yoshimura, Cryst. Growth Des., 2009, 9, 466–474 CrossRef CAS.
- K. Inoue, K. Sassa, Y. Yokogawa, Y. Sakka, M. Okido and S. Asai, Mater. Trans., 2003, 44, 1133–1137 CrossRef CAS.
- H. H. Xu and C. G. Simon Jr, J. Orthop. Res., 2004, 22, 535–543 CAS.
- S. Sotome, T. Uemura, M. Kikuchi, J. Chen, S. Itoh, J. Tanaka, T. Tateishi and K. Shinomiya, Mater. Sci. Eng., C, 2004, 24, 341–347 CrossRef.
- C. Zhou, Y. Hong and X. Zhang, Biomater. Sci., 2013, 1, 1012–1028 RSC.
- A. Khamkongkaeo, T. Boonchuduang, W. Klysubun, P. Amonpattaratkit, H. thaichnok Chunate, N. Tuchinda, A. Pimsawat, S. Daengsakul, P. Suksangrat, W. Sailuam, D. Vongpramate, A. Bootchanont and B. Lohwongwatana, Ceram. Int., 2021, 47, 34575–34584 CrossRef CAS.
- A. C. Taş, J. Am. Ceram. Soc., 2001, 84, 295–300 CrossRef.
- W. Ye and X.-X. Wang, Mater. Lett., 2007, 61, 4062–4065 CrossRef CAS.
- W. Suchanek and M. Yoshimura, J. Mater. Res., 1998, 13, 94–117 CrossRef CAS.
- E. A. Ofudje, A. I. Adeogun, M. A. Idowu and S. O. Kareem, Heliyon, 2019, 5, e01716 CrossRef.
- K. Poovendran, K. J. Wilson, M. Revathy, A. Ayeshamariam and K. Kaviyarasu, Surf. Interfaces, 2020, 19, 100474 CrossRef CAS.
- T. Nagyné-Kovács, L. Studnicka, A. Kincses, G. Spengler, M. Molnár, M. Tolner, I. E. Lukács, I. M. Szilagyi and G. Pokol, Ceram. Int., 2018, 44, 22976–22982 CrossRef.
- K. Baltacis, V. Bystrov, A. Bystrova, Y. Dekhtyar, T. Freivalds, J. Raines, K. Rozenberga, H. Sorokins and M. Zeidaks, Materials, 2020, 13, 4575 CrossRef CAS.
- A. V. Sadetskaya, N. P. Bobrysheva, M. G. Osmolowsky, O. M. Osmolovskaya and M. A. Voznesenskiy, Mater. Charact., 2021, 173, 110911 CrossRef CAS.
- L. A. Avakyan, E. V. Paramonova, J. Coutinho, S. Öberg, V. S. Bystrov and L. A. Bugaev, J. Chem. Phys., 2018, 148, 154706 CrossRef.
- H. Pan, Y. Zhang, Y. Hu and H. Xie, Optik, 2020, 208, 164560 CrossRef CAS.
- I. A. Neacsu, A. E. Stoica, B. S. Vasile and E. Andronescu, Nanomaterials, 2019, 9, 239 CrossRef CAS PubMed.
- V. S. Bystrov, Math. Biol. Bioinf., 2017, 12, 14–54 CrossRef CAS.
- V. S. Bystrov, J. Coutinho, A. V. Bystrova, Y. D. Dekhtyar, R. C. Pullar, A. Poronin, E. Palcevskis, A. Dindune, B. Alkan, C. Durucan and E. V. Paramonova, J. Phys. D: Appl. Phys., 2015, 48, 195302 CrossRef.
- A. Fara, G. Pragash and H. Z. Abdullah, Adv. Mater. Res., 2015, 1125, 474–478 Search PubMed.
- O. Agbabiaka, I. Oladele, A. Akinwekomi, A. Adediran, A. O. Balogun, O. Olasunkanm and T. Olayanju, Sci. Afr., 2020, 8, e00452 Search PubMed.
- P. L. Hariani, M. Said and Salni, IOP Conf. Ser.: Mater. Sci. Eng., 2019, 509, 012109 CrossRef CAS.
- M. Sadat-Shojai, M.-T. Khorasani, E. Dinpanah-Khoshdargi and A. Jamshidi, Acta Biomater., 2013, 9, 7591–7621 CrossRef CAS PubMed.
- Y. Wang, L. Liu and S. Guo, Polym. Degrad. Stab., 2010, 95, 207–213 CrossRef CAS.
- C. K. Chan, T. S. Kumar, S. Liao, R. Murugan, M. Ngiam and S. Ramakrishnan, Nanomed, 2006, 1, 177–188 CrossRef CAS PubMed.
- W. R. Weinand, J. A. Cruz, A. N. Medina, W. M. Lima, F. Sato, R. da Silva Palacios, M. S. Gibin, E. A. Volnistem, J. M. Rosso, I. A. Santos, J. H. Rohling, A. C. Bento, M. L. Baesso, C. G. da Silva, E. X. dos Santos, D. B. Scatolim, A. Gavazzoni, A. F. Queiroz, M. V. P. Companhoni, T. U. Nakamura, L. Hernandes, T. G. M. Bonadio and L. C. M. Miranda, Spectrochim. Acta, Part A, 2022, 279, 121407 CrossRef CAS PubMed.
- J. M. Ramis, C. C. Coelho, A. Córdoba, P. A. Quadros and M. Monjo, Cosmetics, 2018, 5, 53 CrossRef.
- M. E. O. Martins, J. R. Sousa, R. L. Claudino, S. C. O. Lino, D. A. d. Vale, A. L. C. Silva, J. P. S. Morais, M. d. S. M. De Souza Filho and B. W. De Souza, J. Aquat. Food Prod. Technol., 2018, 27, 1120–1133 CrossRef CAS.
- N. Mustafa, M. H. I. Ibrahim, R. Asmawi and A. M. Amin, Appl. Mech. Mater., 2015, 773, 287–290 Search PubMed.
- V. Kalaiselvi, R. Mathammal, S. Vijayakumar and B. Vaseeharan, Int. J. Vet. Sci., 2018, 6, 286–295 CrossRef CAS PubMed.
- P. Makuła, M. Pacia and W. Macyk, J. Phys. Chem. Lett., 2018, 9, 6814–6817 CrossRef PubMed.
- J. P. Perdew, K. Burke and M. Ernzerhof, Phys. Rev. Lett., 1996, 77, 3865–3868 CrossRef CAS PubMed.
- G. Kresse and J. Furthmüller, Comput. Mater. Sci., 1996, 6, 15–50 CrossRef CAS.
- J. P. Perdew and A. Zunger, Phys. Rev. B: Condens. Matter Mater. Phys., 1981, 23, 5048–5079 CrossRef CAS.
- H. J. Monkhorst and J. D. Pack, Phys. Rev. B: Solid State, 1976, 13, 5188–5192 CrossRef.
- N. Martínez and J. Rodriguez M, J. Phys.: Conf. Ser., 2016, 743, 012007 CrossRef.
- T. Wang, Y.-C. Lai, C.-C. Chiang, Y.-R. Cheng, Y.-K. Hsieh and C.-F. Wang, Environ. Monit. Assess., 2016, 188, 1–12 CrossRef CAS.
- A. N. K. Ahmad Fara and H. Z. Abdullah, Development and Investigation of Materials Using Modern Techniques, 2016, pp. 151–155 Search PubMed.
- H. Elhendawi, R. M. Felfel, B. M. Abd El-Hady and F. M. Reicha, ISRN Biomater., 2014, 897468 Search PubMed.
- D. H. Butler and R. Shahack-Gross, Sci. Rep., 2017, 7, 3610 CrossRef.
- U. K. Nahar, B. Shovon, D. R. Chandra, P. S. Chandra, B. Shukanta, M. Muhammed and S. M. D. Islam, J. Bioeng. Biomed. Sci., 2017, 7, 2–5 Search PubMed.
- S. Ramesh, Z. Z. Loo, C. Y. Tan, W. K. Chew, Y. C. Ching, F. Tarlochan, H. Chandran, S. Krishnasamy, L. T. Bang and A. A. Sarhan, Ceram. Int., 2018, 44, 10525–10530 CrossRef CAS.
- N. S. Gultom, H. Abdullah and D.-H. Kuo, Appl. Catal., B, 2020, 272, 118985 CrossRef CAS.
- C.-J. Liao, F.-H. Lin, K.-S. Chen and J.-S. Sun, Biomaterials, 1999, 20, 1807–1813 CrossRef CAS.
- K. Salma-Ancane, L. Stipniece, A. Putnins and L. Berzina-Cimdina, Ceram. Int., 2015, 41, 4996–5004 CrossRef CAS.
- C. Piccirillo, R. Pullar, E. Costa, A. Santos-Silva, M. Pintado and P. M. Castro, Mater. Sci. Eng., C, 2015, 51, 309–315 CrossRef CAS.
- Y. Li, C. Klein, X. Zhang and K. De Groot, Biomaterials, 1993, 14, 969–972 CrossRef CAS.
- R.-M. Ion, T. Nyokong, N. Nwahara, I.-R. Suica-Bunghez, L. Iancu, S. Teodorescu, I. D. Dulama, R. M. Stirbescu, A. Gheboianu and R. M. Grigorescu, Heritage Sci., 2018, 6, 1–12 Search PubMed.
- A. Amedlous, O. Amadine, Y. Essamlali, K. Daanoun, M. Aadil and M. Zahouily, RSC Adv., 2019, 9, 14132–14142 RSC.
- Q. Zhou, L. Li, Z. Xin, Y. Yu, L. Wang and W. Zhang, J. Alloys Compd., 2020, 813, 152190 CrossRef CAS.
- Y. A. Hariyanto, A. Taufiq, Sunaryono and S. Soontaranon, J. Korean Phys. Soc., 2019, 75, 708–715 CrossRef CAS.
- C. Beh, E. Cheng, N. M. Nasir, E. Z. M. Tarmizi, S. Eng, M. A. Majid, M. Ridzuan, S. Khor and F. A. Saad, J. Mater. Res. Technol., 2020, 9, 14267–14282 CrossRef CAS.
|
| This journal is © The Royal Society of Chemistry 2024 |
Click here to see how this site uses Cookies. View our privacy policy here. 
 Open Access Article
 This Open Access Article is licensed under a Creative Commons Attribution-Non Commercial 3.0 Unported Licence
 e,
Peerawat Laohana
e,
Peerawat Laohana