 Open Access Article
A theoretical investigation on the structural stability, superconductivity, and optical and thermodynamic properties of Ir2P under pressure†
Xiao-Wei Sun*ab,
Meng-Ru Chen a,
Xi-Long Doub,
Ning Lib,
Tong Wangb and
Ting Songb
aSchool of Mechanical Engineering, Lanzhou Jiaotong University, Lanzhou 730070, PR China. E-mail: sunxw_lzjtu@yeah.net
bSchool of Mathematics and Physics, Lanzhou Jiaotong University, Lanzhou 730070, PR China
First published on 3rd January 2024
Abstract
The potential applications of Ir2P are promising due to its desirable hardness, but its fundamental properties are still not fully understood. In this study, we present a systematic investigation of Ir2P's structural, electronic, superconducting, optical, and thermodynamic properties of Ir2P under pressure. Our calculations show that Ir2P has a Fm![[3 with combining macron]](https://www.rsc.org/images/entities/char_0033_0304.gif) m structure at ambient pressure, which matches well with experimental data obtained from high-pressure synchrotron X-ray diffraction. As pressure increases, a transition from the Fm
m structure at ambient pressure, which matches well with experimental data obtained from high-pressure synchrotron X-ray diffraction. As pressure increases, a transition from the Fm![[3 with combining macron]](https://www.rsc.org/images/entities/char_0033_0304.gif) m to the I4/mmm phase occurs at 103.4 GPa. The electronic structure and electron-phonon coupling reveal that the Fm
m to the I4/mmm phase occurs at 103.4 GPa. The electronic structure and electron-phonon coupling reveal that the Fm![[3 with combining macron]](https://www.rsc.org/images/entities/char_0033_0304.gif) m and I4/mmm phases of Ir2P are superconducting materials with superconducting transition temperatures of 2.51 and 0.89 K at 0 and 200 GPa, respectively. The optical properties of Ir2P indicate that it has optical conductivity in the infrared, visible, and ultraviolet regions. Additionally, we observed that the reflectivity R(ω) of Ir2P is higher than 76% in the 25–35 eV energy range at different pressures, which suggests that it could be used as a reflective coating. We also explored the finite-temperature thermodynamic properties of Ir2P, including the Debye temperature, the first and second pressure derivatives of the isothermal bulk modulus, and the thermal expansion coefficient up to 2000 K using the quasi-harmonic Debye model. Our findings offer valuable insights for engineers to design better devices.
m and I4/mmm phases of Ir2P are superconducting materials with superconducting transition temperatures of 2.51 and 0.89 K at 0 and 200 GPa, respectively. The optical properties of Ir2P indicate that it has optical conductivity in the infrared, visible, and ultraviolet regions. Additionally, we observed that the reflectivity R(ω) of Ir2P is higher than 76% in the 25–35 eV energy range at different pressures, which suggests that it could be used as a reflective coating. We also explored the finite-temperature thermodynamic properties of Ir2P, including the Debye temperature, the first and second pressure derivatives of the isothermal bulk modulus, and the thermal expansion coefficient up to 2000 K using the quasi-harmonic Debye model. Our findings offer valuable insights for engineers to design better devices.
1. Introduction
The combination of 4d and 5d transition metals with low-Z elements (IIIA–VIA) has been proven to be an effective strategy for designing new hard and superhard materials.1–3 The idea is that the high electron concentration of transition metals and the directional bonding created by strong hybridizations between d electrons of transition metals and s, p electrons of light (low-Z) elements can effectively withstand both elastic and plastic deformations.4 Some promising candidates, such as OsB2, Ir4B5, ReB2, WB4, TaC, ReC, ReC2, Zr3N4, and Mo3N5 have been experimentally synthesized and studied.5–13 First-principles density functional theory (DFT) calculations are a powerful tool for predicting the structural, electronic, elastic, and thermodynamic properties of carbides, nitrides and borides with transition-metal elements in a large region of the periodic table.14–23 However, the study of transition-metal phosphides (TMPs), especially noble-metal phosphides, is relatively limited.TMPs are a group of compounds that possess unique chemical and physical properties. These properties make them highly attractive for potential applications in various fields, such as photonics, electronics, magnetism, hard materials, and catalysis.24–26 Systematic computational investigations have shown that phosphorus atoms in TMPs play a crucial role in hydrogen evolution reactions.27 Phosphorus atoms with higher electronegativity can draw electrons from metal atoms, and negatively charged phosphate groups can act as a base in electrochemical hydrogen evolution reactions. Generally, TMPs with a higher metal content exhibit more metallic characteristics because metal atoms contribute more electrons to the compound, leading to a lower overall electronegativity and a more metallic nature. Additionally, as the atomic ratio of phosphorus to metal increases, the bonding between the phosphorus and metal atoms becomes weaker, which can also promote metallic behavior.28 Silica-supported palladium and ruthenium phosphide catalysts, such as Pd3P, Pd5P2, Ru2P, and RuP, were recently synthesized and studied by Bowker et al.29 to investigate the hydrodesulfurization properties of dibenzothiophene. The properties of these phases were compared with those of the sulfides of the noble metals. Although Ir2P was first reported in 1935 by Blatz et al.,30 there have been comparatively few studies of its synthesis routes and crystal structures. Rundqvist et al.31 examined the crystal structures of three phosphides, namely, Rh2P and Ir2P with the anti-fluorite structure and PtP2 with the pyrite structure. Raub et al.32 discovered that only the Ir2P exhibited a metallic behavior among the family of Ir2X and IrX (where X = P, As, Sb, and Bi) Pt-metal alloys. Sweeney et al.33 explored the feasibility of hydrogen reduction annealing of metal phosphates as a selected pathway to phosphides for rhodium and iridium. Unfortunately, there is limited information available on the high-pressure properties of Ir2P due to the difficulty in synthesizing it, even though high-pressure synthesis is a powerful method for preparing novel materials with unique electrical and mechanical properties. In 2016, Ir2P was successfully synthesized under high-pressure conditions, and it was found to have an anti-fluorite structure with space group Fm![[3 with combining macron]](https://www.rsc.org/images/entities/char_0033_0304.gif) m, as determined from synchrotron X-ray diffraction (XRD) pattern analysis. The structure remains stable at room temperature and pressures ranging from 0 to 40.6 GPa. In this structure, each Ir atom is surrounded by four P atoms, forming [IrP4] tetrahedrons, which are located at the edges of the unit cell.34 Research indicates that Ir2P has a significant bulk modulus (B) (320 and 342 GPa) and a relatively modest shear modulus (G) (42 and 64 GPa) derived from generalized gradient approximation (GGA) and local density approximation (LDA) calculations respectively. This indicates a complex bonding profile for Ir2P, encompassing metallic, ionic, and covalent characteristics. Subsequently, the ground-state structure of Ir2P is predicted to be Fm
m, as determined from synchrotron X-ray diffraction (XRD) pattern analysis. The structure remains stable at room temperature and pressures ranging from 0 to 40.6 GPa. In this structure, each Ir atom is surrounded by four P atoms, forming [IrP4] tetrahedrons, which are located at the edges of the unit cell.34 Research indicates that Ir2P has a significant bulk modulus (B) (320 and 342 GPa) and a relatively modest shear modulus (G) (42 and 64 GPa) derived from generalized gradient approximation (GGA) and local density approximation (LDA) calculations respectively. This indicates a complex bonding profile for Ir2P, encompassing metallic, ionic, and covalent characteristics. Subsequently, the ground-state structure of Ir2P is predicted to be Fm![[3 with combining macron]](https://www.rsc.org/images/entities/char_0033_0304.gif) m, while the high-pressure structure is expected to be I4/mmm. It was shown that the predicted ground-state structure is consistent with the experimentally obtained structure and its phase transition pressure is 86.4 GPa.35
m, while the high-pressure structure is expected to be I4/mmm. It was shown that the predicted ground-state structure is consistent with the experimentally obtained structure and its phase transition pressure is 86.4 GPa.35
We have conducted a comprehensive theoretical analysis of Ir2P, a material about which limited information is available. Our analysis is based on first-principles calculations within the framework of DFT using GGA and LDA. We have optimized its geometric structure and explored its energy-volume equation of state (EOS), as well as delving into its electronic band structures, elastic properties, and superconductivity characteristics. We have also predicted the complex dielectric function, reflectivity, absorption coefficient, optical conductivity, and loss function of Ir2P to obtain the regular behavior of these optical parameters with pressure. Additionally, we have predicted the finite-temperature thermodynamic properties of cubic Ir2P, including the isothermal bulk modulus, and its first and second pressure derivatives, thermal expansion coefficient, and Debye temperature at the atomic level by means of density functional total energy calculations in combination with the quasi-harmonic Debye (QHD) model. These findings can potentially guide further research and help in the development of practical applications for this material.
2. Theoretical methods
The Vienna ab initio Simulation Package (VASP) code, within the framework of DFT, was used to the calculate the mechanical and electronic properties of Ir2P.36 The interaction between valence electrons and ions in Ir2P was modeled using the ultrasoft pseudopotential.37 The exchange and correlation potentials were described by the GGA-PBEsol38 and the LDA,39 respectively. The use of ultrasoft pseudopotentials can provide a more accurate description of the electronic structure of materials, especially for systems with complex valence-electron configurations like Ir and P, where 5d7 6s2 and 3s2 3p3 selected should be compatible with the special type of GGA or LDA. After the convergence test, the Brillouin zone integrations for the primitive unit cell of Fm![[3 with combining macron]](https://www.rsc.org/images/entities/char_0033_0304.gif) m and I4/mmm structures were sampled using 12 × 12 × 12 and 15 × 15 × 18 meshes according to the Monkhorst–Pack method with plane-wave cut-off energies of 600 and 850 eV, respectively.40 The BFGS minimization technique was used in the geometry optimization at different hydrostatic pressures ranging from 0 to 200 GPa, after which elastic constants were calculated.41 Prior research has suggested that the BFGS minimization technique is capable of providing a fast way of finding the lowest energy structure.
m and I4/mmm structures were sampled using 12 × 12 × 12 and 15 × 15 × 18 meshes according to the Monkhorst–Pack method with plane-wave cut-off energies of 600 and 850 eV, respectively.40 The BFGS minimization technique was used in the geometry optimization at different hydrostatic pressures ranging from 0 to 200 GPa, after which elastic constants were calculated.41 Prior research has suggested that the BFGS minimization technique is capable of providing a fast way of finding the lowest energy structure.
In this study, a convergence threshold was set at 5.0 × 10⁻⁷ eV per atom, to determine if the iterative process of updating the electronic wave functions and potentials has reached a stable solution, for the self-consistent progress. The convergence criterion for energy, force, ionic displacement, and stress were set to 5.0 × 10⁻⁶ eV per atom, 0.01 eV Å−1, 5.0 × 10⁻⁴ Å, and 0.02 GPa, respectively. When calculating elastic properties, the force on the atom refers to the force applied to the atom during the simulation, while the atomic position displacement refers to the change in the position of the atoms between computational cycles. To prevent excessive strain on the atom and maintain the stability of the simulation, these values are limited to 0.002 eV Å−1 and 1.0 × 10⁻⁴ Å, respectively. The maximum strain amplitude is set to be 0.003, which is the maximum amount the atoms can be deformed during the simulation. Six distorted structures were generated within this limit, likely for further analysis or study. These parameters and settings were chosen to ensure that the calculated elastic properties are accurate and reliable, while also maintaining computational efficiency.
The strained energy for cubic and tetragonal Ir2P is expressed by the law from ref. 42. The mechanical stability criteria obtained from elastic stiffness coefficients can be found in ref. 43 or 44. Currently, the stress–strain method is being used. The phonon dispersions for Fm![[3 with combining macron]](https://www.rsc.org/images/entities/char_0033_0304.gif) m and I4/mmm structures were calculated on 2 × 2 × 2 supercells which contain 48 and 96 atoms, respectively, using density-functional perturbation theory (DFPT) method implemented in the PHONOPY code.45 The forces result from VASP.
m and I4/mmm structures were calculated on 2 × 2 × 2 supercells which contain 48 and 96 atoms, respectively, using density-functional perturbation theory (DFPT) method implemented in the PHONOPY code.45 The forces result from VASP.
The electron-phonon coupling (EPC) calculations for Ir2P were performed using the QUANTUM-ESPRESSO package46 with ultrasoft pseudopotential for core-valence interaction. The kinetic energy cutoff of 60 Ry was chosen as the plane-wave expansion. The k meshes and q meshes of 12 × 12 × 12 and 3 × 3 × 3, 24 × 24 × 12 and 3 × 3 × 2 were selected as the first Brillouin zone for Fm![[3 with combining macron]](https://www.rsc.org/images/entities/char_0033_0304.gif) m and I4/mmm of Ir2P, respectively. Taking into account that the EPC parameters λ of I4/mmm for Ir2P is smaller than 1.5, the superconducting transition temperature (Tc) is estimated through McMillan equation47
m and I4/mmm of Ir2P, respectively. Taking into account that the EPC parameters λ of I4/mmm for Ir2P is smaller than 1.5, the superconducting transition temperature (Tc) is estimated through McMillan equation47
 | (1) |
 | (2) |
 | (3) |
The complex dielectric function ε(ω) is often used to characterize the optical properties of a material. Due to the metallic nature of Ir2P, a semi-experiential Drude term and Gaussian smearing of 0.5 eV are used to calculate the frequency-dependent dielectric constants48
| ε(ω) = ε1(ω) + iε2(ω). | (4) |
In the formula above, the complex dielectric function, ε(ω), is a complex number representing the ratio of the electric field to the electric displacement in a material. The symbol ω refers to the frequency of the incident photon, while ε1(ω) and ε2(ω) refers to the real and imaginary parts of the complex dielectric function, respectively. The ε2(ω) value is calculated from the momentum matrix element between the occupied and unoccupied electronic states, and the ε1(ω) is derived from the imaginary part using the Kramers–Kronig relation.
To study the behavior of Ir2P under finite temperature conditions, a QHD model was used to determine the Debye temperature, isothermal bulk modulus, and its first and second pressure derivatives, as well as the thermal expansion coefficient. These properties are important thermodynamic characteristics of materials. The GIBBS software program49 was used to implement the QHD model.
Since Ir is a metal containing d electrons, we explore the magnetim of the Fm![[3 with combining macron]](https://www.rsc.org/images/entities/char_0033_0304.gif) m and I4/mmm phases. We perform energy mapping of all conceivable magnetic configurations and calculate the spin-polarized density of states for both phases, as shown in Fig. S1 and S2.† The absence of a non-zero magnetic moment per Ir atom in the considered magnetic configurations, and the symmetric density of states, confirmed that both phases are nonmagnetic. Therefore, this study does not incorporate spin polarization.
m and I4/mmm phases. We perform energy mapping of all conceivable magnetic configurations and calculate the spin-polarized density of states for both phases, as shown in Fig. S1 and S2.† The absence of a non-zero magnetic moment per Ir atom in the considered magnetic configurations, and the symmetric density of states, confirmed that both phases are nonmagnetic. Therefore, this study does not incorporate spin polarization.
3. Results and discussion
3.1 Structural stability
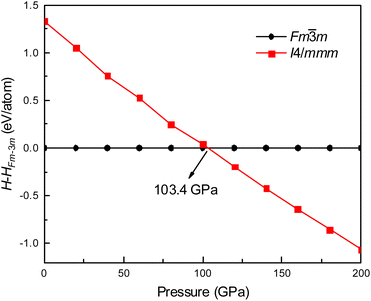
Fig. 1 shows the enthalpy–pressure curves of Ir2P for the I4/mmm phase relative to the Fm![[3 with combining macron]](https://www.rsc.org/images/entities/char_0033_0304.gif) m phase. It indicates that the Fm
m phase. It indicates that the Fm![[3 with combining macron]](https://www.rsc.org/images/entities/char_0033_0304.gif) m phase is most energetically favorable at ambient pressure. However, as pressure increases, the phase changes to the I4/mmm phase at 103.4 GPa. The crystal structures of Ir2P are shown in Fig. 2. It can be observed that the Fm
m phase is most energetically favorable at ambient pressure. However, as pressure increases, the phase changes to the I4/mmm phase at 103.4 GPa. The crystal structures of Ir2P are shown in Fig. 2. It can be observed that the Fm![[3 with combining macron]](https://www.rsc.org/images/entities/char_0033_0304.gif) m and I4/mmm phase of Ir2P consist of four and two formula units per unit cell, respectively. In the Fm
m and I4/mmm phase of Ir2P consist of four and two formula units per unit cell, respectively. In the Fm![[3 with combining macron]](https://www.rsc.org/images/entities/char_0033_0304.gif) m structure, the Ir atom is linked to the surrounding four P atoms to form the IrP4 tetrahedron, with an Ir–P bond length of 2.405 Å. In the I4/mmm structure, the two Ir atoms share four P atoms to form the Ir2P4 regular octahedron, with an Ir–P bond length of 2.466 Å.
m structure, the Ir atom is linked to the surrounding four P atoms to form the IrP4 tetrahedron, with an Ir–P bond length of 2.405 Å. In the I4/mmm structure, the two Ir atoms share four P atoms to form the Ir2P4 regular octahedron, with an Ir–P bond length of 2.466 Å.
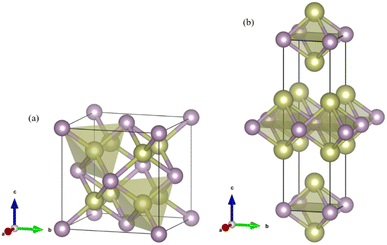 | ||
Fig. 2 Crystal structures for the (a) Fm![[3 with combining macron]](https://www.rsc.org/images/entities/char_0033_0304.gif) m and (b) I4/mmm phases of Ir2P. The gold and purple spheres represent Ir and P atoms, respectively. m and (b) I4/mmm phases of Ir2P. The gold and purple spheres represent Ir and P atoms, respectively. | ||
Several geometry optimizations were conducted using the LDA and GGA approximations. Fig. 3 shows the dependence of the calculated relative volume on the external pressure up to 80 GPa at zero temperature for Ir2P. Previous studies have indicated that the pressure dependence of the volume ratio is a more direct measure of compressibility compared to the description of physical properties alone.34 For comparison, the experimental and theoretical data up to 40.6 GPa provided by Wang et al.34 are also plotted Fig. 3, along with the theoretical P–V/V0 data of conventional superhard materials such as diamond and c-BN50 at T = 0 K up to 80 GPa. Our results obtained with DFT calculations match well with that of Wang et al.34 Due to the discrepancy between GGA and LDA for exchange-correlation potentials within the DFT framework, the average of GGA and LDA values is employed as the rescaled estimate. It is evident from Fig. 3 that the anti-fluorite structured Ir2P is more compressible than conventional superhard materials, such as c-BN and diamond. This implies that the anti-fluorite structure may exhibit a higher degree of flexibility or less resistance to pressure, compared to the conventional superhard materials.
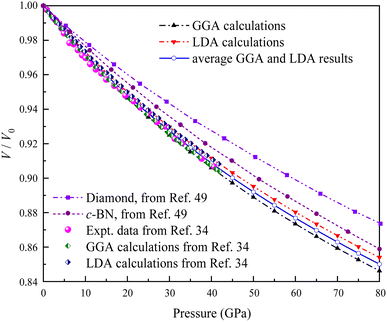 | ||
| Fig. 3 Comparison of the calculated pressure versus volume ratio of 0 K isotherms for the anti-fluorite structure of Ir2P with experiments and other theoretical data. | ||
Table 1 lists the parameters of the fitted equation of state (EOS) for Ir2P with the cubic anti-fluorite structure. These parameters include a0, V0, K0 and  , which were obtained from the 3rd-order Birch–Murnaghan EOS51 using the Eosfit52 software.52 To analyze the results from EOS, we have also included the results from DFT and experiments by Wang et al.34 in Table 1. Unfortunately, we cannot compare the results of equilibrium lattice parameter a0 and equilibrium volume V0 among studies due to the lack of data. However, the values of bulk modulus K0 and its first pressure derivative
  obtained from DFT calculations are in very good agreement with the theoretical results and are also comparable to the ones obtained from the X-ray diffraction experiment data of Wang et al.34 This indicates that our calculations are accurate, and the methods can be used to predict other properties of Ir2P with the anti-fluorite structure.
 from the 3rd-order Birch–Murnaghan equation for Ir2P with the anti-fluorite structure compared with the experimental and other theoretical data
In order to better understand the structural stability of cubic Ir2P under strain, it is important to calculate the elastic constants of the material. Table 2 presents the calculated elastic constants C11, C12, and C44, G, Young's modulus (E), and Poisson's ratio (υ) for Ir2P with the anti-fluorite structure at zero pressure and zero temperature. The values for E, G, and υ are derived according to the Voight–Reuss–Hill averaging scheme.53 For any crystal to be mechanically stable, it must have a positive strain energy.54 The elastic constants obtained suggest that the Ir2P with anti-fluorite structure is mechanically stable. However, despite its elastic stability, Ir2P with an anti-fluorite structure has smaller B (316.520 and 343.068 GPa), lower G (117.656 and 129.203 GPa), and larger υ (0.335 and 0.333) when calculated using GGA and LDA in the DFT framework. This suggests that its mechanical properties are inferior in comparison to conventional superhard materials like diamond and c-BN.50
| Method | C11 (GPa) | C12 (GPa) | C44 (GPa) | G (GPa) | E (GPa) | υ | |
|---|---|---|---|---|---|---|---|
| DFT-GGA | 679.459 | 135.050 | 61.741 | 117.656 | 314.055 | 0.335 | This work |
| DFT-LDA | 739.766 | 144.719 | 68.134 | 129.203 | 344.377 | 0.333 | This work |
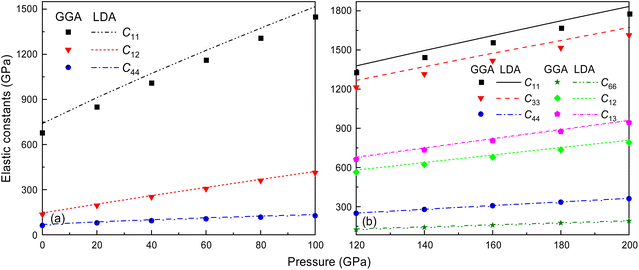
It is well-documented that GGA in first-principles calculations often overestimates volume and underestimates bulk modulus.55 This shortcoming is also extended to the elastic constant calculations at high pressure, like C11, for the Fm![[3 with combining macron]](https://www.rsc.org/images/entities/char_0033_0304.gif) m and I4/mmm phases of Ir2P, as shown in Fig. 4. It is found that the effect of the pressure on C11 (679.459 and 1307.119 GPa for GGA and 739.766 and 1373.326 GPa for LDA calculations at 0 and 80 GPa, respectively), which represents elasticity in length, is much larger than that on C12 (135.050 and 360.009 GPa for GGA and 144.719 and 368.275 GPa for LDA calculations at 0 and 80 GPa, respectively) and C44 (61.741 and 117.102 GPa for GGA and 68.134 and 124.536 GPa for LDA calculations at 0 and 80 GPa, respectively), which characterize the elasticity in shape in the pressure range of 0–80 GPa. However, this little discrepancy in the presentation doesn't influence the judgment of the high-pressure structural stability for the cubic Ir2P. The obtained elastic constants exhibited in Fig. 4(b) show that the I4/mmm phase satisfies the Born criteria for tetragonal crystal systems in the pressure range studied.
m and I4/mmm phases of Ir2P, as shown in Fig. 4. It is found that the effect of the pressure on C11 (679.459 and 1307.119 GPa for GGA and 739.766 and 1373.326 GPa for LDA calculations at 0 and 80 GPa, respectively), which represents elasticity in length, is much larger than that on C12 (135.050 and 360.009 GPa for GGA and 144.719 and 368.275 GPa for LDA calculations at 0 and 80 GPa, respectively) and C44 (61.741 and 117.102 GPa for GGA and 68.134 and 124.536 GPa for LDA calculations at 0 and 80 GPa, respectively), which characterize the elasticity in shape in the pressure range of 0–80 GPa. However, this little discrepancy in the presentation doesn't influence the judgment of the high-pressure structural stability for the cubic Ir2P. The obtained elastic constants exhibited in Fig. 4(b) show that the I4/mmm phase satisfies the Born criteria for tetragonal crystal systems in the pressure range studied.
It is widely accepted that a stable crystalline structure requires all phonon frequencies to be positive at zero temperature. To ensure this stability, the phonon dispersion calculation has been performed within the finite displacement theory using the PHONOPY code for the Fm![[3 with combining macron]](https://www.rsc.org/images/entities/char_0033_0304.gif) m and I4/mmm phases at 0, 100 and 120, 200 GPa, respectively. As demonstrated in Fig. 5, there are no imaginary frequencies present in the entire Brillouin zone at the selected pressures. This finding indicates that both phases are dynamically stable, meaning that the material remains stable under the applied pressure conditions, as there are no negative phonon frequencies that would suggest an instability in the crystalline structure. The absence of imaginary phonon frequencies also confirms that the material's elastic properties are well-defined and robust, rendering it suitable for a wide range of applications.54 The phonon spectra of the Fm
m and I4/mmm phases at 0, 100 and 120, 200 GPa, respectively. As demonstrated in Fig. 5, there are no imaginary frequencies present in the entire Brillouin zone at the selected pressures. This finding indicates that both phases are dynamically stable, meaning that the material remains stable under the applied pressure conditions, as there are no negative phonon frequencies that would suggest an instability in the crystalline structure. The absence of imaginary phonon frequencies also confirms that the material's elastic properties are well-defined and robust, rendering it suitable for a wide range of applications.54 The phonon spectra of the Fm![[3 with combining macron]](https://www.rsc.org/images/entities/char_0033_0304.gif) m and the I4/mmm phases are divided into two modes, low and high frequency modes. Both phases demonstrate notable phononic gaps within the frequency ranges of 6.3–9.9 THz and 8.2–11.9 THz, respectively, along the optical branch at 0 GPa and 120 GPa. These broader phononic gaps separate the optical phonon modes into high and low-frequency modes. Moreover, both phases exhibit an increasing phononic gap with increasing pressure, with the value increasing from 3.6 (0 GPa) to 5.9 (100 GPa) for the Fm
m and the I4/mmm phases are divided into two modes, low and high frequency modes. Both phases demonstrate notable phononic gaps within the frequency ranges of 6.3–9.9 THz and 8.2–11.9 THz, respectively, along the optical branch at 0 GPa and 120 GPa. These broader phononic gaps separate the optical phonon modes into high and low-frequency modes. Moreover, both phases exhibit an increasing phononic gap with increasing pressure, with the value increasing from 3.6 (0 GPa) to 5.9 (100 GPa) for the Fm![[3 with combining macron]](https://www.rsc.org/images/entities/char_0033_0304.gif) m phase and 3.7 (120 GPa) to 4 (200 GPa) for the I4/mmm phase. This finding suggests that Ir2P hold potential as materials for phononic devices, including applications in phonon waveguides, cavities, and filters.56–58 Subsequently, the GGA with a correction of the Perdew–Burke–Ernzerhof version, the PBEsol, which is known to yield better results for solids, is used to investigate the electronic and finite-temperature thermodynamic properties of Ir2P with the anti-fluorite structure.
m phase and 3.7 (120 GPa) to 4 (200 GPa) for the I4/mmm phase. This finding suggests that Ir2P hold potential as materials for phononic devices, including applications in phonon waveguides, cavities, and filters.56–58 Subsequently, the GGA with a correction of the Perdew–Burke–Ernzerhof version, the PBEsol, which is known to yield better results for solids, is used to investigate the electronic and finite-temperature thermodynamic properties of Ir2P with the anti-fluorite structure.
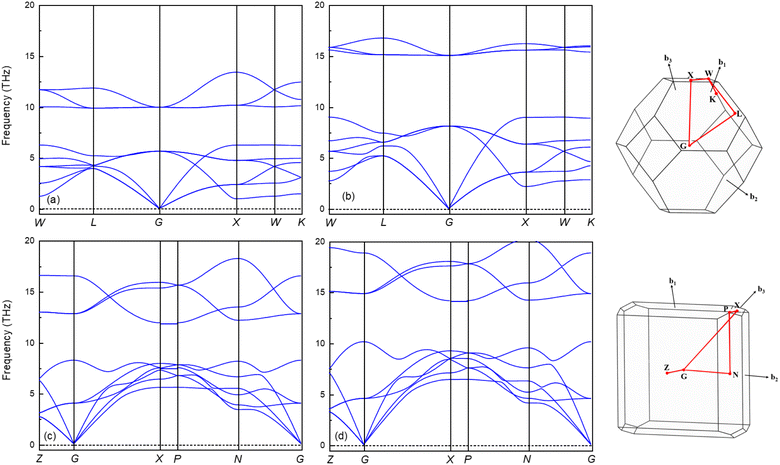 | ||
Fig. 5 The calculated phonon dispersion curves of Ir2P for Fm![[3 with combining macron]](https://www.rsc.org/images/entities/char_0033_0304.gif) m at (a) 0 and (b) 100 GPa and I4/mmm phases at (c) 120 and (d) 200 GPa, respectively. m at (a) 0 and (b) 100 GPa and I4/mmm phases at (c) 120 and (d) 200 GPa, respectively. | ||
3.2 Electronic structure
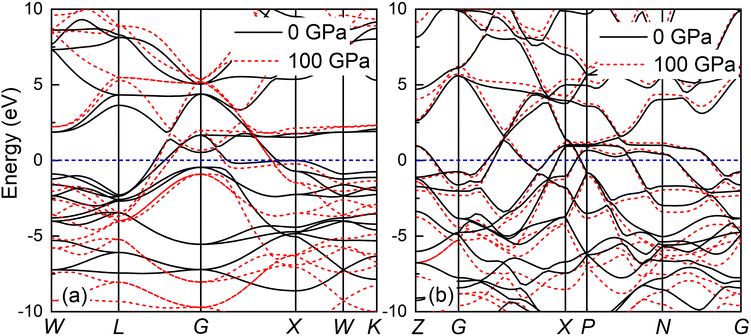
The band structure and total density of states (TDOS) of Fm![[3 with combining macron]](https://www.rsc.org/images/entities/char_0033_0304.gif) m and I4/mmm with and without spin–orbit coupling (SOC) at 0 and 120 GPa are calculated to assess the potential impact of SOC, as shown in Fig. S3.† The results indicate that the band structure and TDOS near the Fermi level (Ef) remains essentially unchanged with the inclusion of SOC, suggesting the weak influence of SOC in Ir2P. Fig. 6 and 7 show their band structure, TDOS and partial density of states (PDOS) without SOC. As shown in Fig. 6, the valence band of the Fm
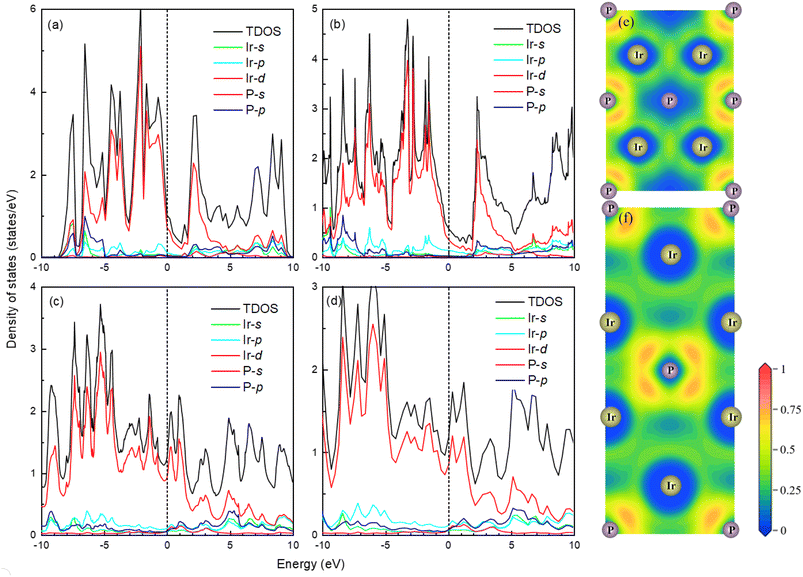
m and I4/mmm with and without spin–orbit coupling (SOC) at 0 and 120 GPa are calculated to assess the potential impact of SOC, as shown in Fig. S3.† The results indicate that the band structure and TDOS near the Fermi level (Ef) remains essentially unchanged with the inclusion of SOC, suggesting the weak influence of SOC in Ir2P. Fig. 6 and 7 show their band structure, TDOS and partial density of states (PDOS) without SOC. As shown in Fig. 6, the valence band of the Fm![[3 with combining macron]](https://www.rsc.org/images/entities/char_0033_0304.gif) m phase crosses the Ef and meets with the conduction band between the G and X points, while for the I4/mmm phase both the valence and conduction bands cross the Ef. The absence of an energy gap indicates metallic features for both structures, which is consistent with other results.33,34 The calculated PDOS reveals that the Ir-d orbitals near the Ef play a leading role in the metallicity of both structures. Moreover, significant orbital hybridization below and above the Ef for P–p and Ir-d implies that there are strong interactions between P and Ir atoms. To further investigate their chemical bonding in detail, the electronic localization functions (ELF) of the Fm
m phase crosses the Ef and meets with the conduction band between the G and X points, while for the I4/mmm phase both the valence and conduction bands cross the Ef. The absence of an energy gap indicates metallic features for both structures, which is consistent with other results.33,34 The calculated PDOS reveals that the Ir-d orbitals near the Ef play a leading role in the metallicity of both structures. Moreover, significant orbital hybridization below and above the Ef for P–p and Ir-d implies that there are strong interactions between P and Ir atoms. To further investigate their chemical bonding in detail, the electronic localization functions (ELF) of the Fm![[3 with combining macron]](https://www.rsc.org/images/entities/char_0033_0304.gif) m and I4/mmm phases in the (110) planes are subsequently calculated at 0 and 120 GPa, respectively, as illustrated in Fig. 7(e) and (f). In both phases, adjacent Ir atoms exhibit metallic bonding, as evidenced by the proximity of the ELF value to 0.5. Conversely, the electrons between neighboring P atoms exhibit high delocalization, signifying a non-bonded state, as indicated by an ELF value close to zero. The ELF analysis reveals the manifestation of polar covalent and metallic bonding between neighboring Ir and P atoms. This is evident in the presence of a local maximum that distinctly favors the P atoms, with an ELF value of about 0.5 near the central region. Further Bader charge analysis reveals that, due to the electronegativity difference between Ir and P atoms in both Fm
m and I4/mmm phases in the (110) planes are subsequently calculated at 0 and 120 GPa, respectively, as illustrated in Fig. 7(e) and (f). In both phases, adjacent Ir atoms exhibit metallic bonding, as evidenced by the proximity of the ELF value to 0.5. Conversely, the electrons between neighboring P atoms exhibit high delocalization, signifying a non-bonded state, as indicated by an ELF value close to zero. The ELF analysis reveals the manifestation of polar covalent and metallic bonding between neighboring Ir and P atoms. This is evident in the presence of a local maximum that distinctly favors the P atoms, with an ELF value of about 0.5 near the central region. Further Bader charge analysis reveals that, due to the electronegativity difference between Ir and P atoms in both Fm![[3 with combining macron]](https://www.rsc.org/images/entities/char_0033_0304.gif) m and I4/mmm phases, each P atom transfers a charge of 0.210e (0 GPa) and 0.265e (120 GPa) to the Ir atom, respectively. This charge transfer process substantiates the formation of ionic bonds between Ir and P atoms (see Table S1†). The analysis above reveals a multifaceted nature of the bond for both phases, encompassing ionic, covalent, and metallic components. Notably, the presence of covalent and ionic bonds contributes to structural stability and imparts excellent mechanical properties to the material. These findings show that Ir2P is a potential candidate for hard conductors in extreme conditions. With the pressure increase from 0 (120 GPa) to 100 GPa (200 GPa) for the Fm
m and I4/mmm phases, each P atom transfers a charge of 0.210e (0 GPa) and 0.265e (120 GPa) to the Ir atom, respectively. This charge transfer process substantiates the formation of ionic bonds between Ir and P atoms (see Table S1†). The analysis above reveals a multifaceted nature of the bond for both phases, encompassing ionic, covalent, and metallic components. Notably, the presence of covalent and ionic bonds contributes to structural stability and imparts excellent mechanical properties to the material. These findings show that Ir2P is a potential candidate for hard conductors in extreme conditions. With the pressure increase from 0 (120 GPa) to 100 GPa (200 GPa) for the Fm![[3 with combining macron]](https://www.rsc.org/images/entities/char_0033_0304.gif) m (I4/mmm) phase, the bond length among atoms in structures decrease monotonously. As a consequence, the number of charge transfers between Ir and P increases (see Table S1†), as shown in the band structure that conduction bands move up while valence bands move down. Furthermore, both structures are expected to have superconductivity because they both have steep and flat energy bands near Ef and high DOS values at Ef.
m (I4/mmm) phase, the bond length among atoms in structures decrease monotonously. As a consequence, the number of charge transfers between Ir and P increases (see Table S1†), as shown in the band structure that conduction bands move up while valence bands move down. Furthermore, both structures are expected to have superconductivity because they both have steep and flat energy bands near Ef and high DOS values at Ef.
3.3 Superconductivity
The superconductivity of these two structures continues is being investigated based on their electronic structures. The EPC and Tc are calculated and presented in Table 3. The Tc decreases as pressure increases, with the value changing from 2.51 (Fm![[3 with combining macron]](https://www.rsc.org/images/entities/char_0033_0304.gif) m at 0 GPa) to 0.83 K (I4/mmm at 200 GPa). To understand the change in superconductivity, the projected phonon densities of states (PHDOS), Eliashberg phonon spectral function α2F(ω) and integrated electron-phonon coupling λ(ω) of the Ir2P at 0 and 200 GPa are analyzed, as seen Fig. 8. The PHDOS for the Fm
m at 0 GPa) to 0.83 K (I4/mmm at 200 GPa). To understand the change in superconductivity, the projected phonon densities of states (PHDOS), Eliashberg phonon spectral function α2F(ω) and integrated electron-phonon coupling λ(ω) of the Ir2P at 0 and 200 GPa are analyzed, as seen Fig. 8. The PHDOS for the Fm![[3 with combining macron]](https://www.rsc.org/images/entities/char_0033_0304.gif) m and I4/mmm phases reveal that their high-frequency modes are both associated with the vibrations of P atoms. The low-frequency modes of the former are connected to the vibrations of Ir atoms, while the latter are linked to the coupling of Ir and P atoms. This observation indicates that the phononic gaps displayed in Fig. 5 in both phases arise from the significant mass disparity between the heavy Ir atoms and the lighter P atoms. The relevant parameters are listed in Table 3. For Fm
m and I4/mmm phases reveal that their high-frequency modes are both associated with the vibrations of P atoms. The low-frequency modes of the former are connected to the vibrations of Ir atoms, while the latter are linked to the coupling of Ir and P atoms. This observation indicates that the phononic gaps displayed in Fig. 5 in both phases arise from the significant mass disparity between the heavy Ir atoms and the lighter P atoms. The relevant parameters are listed in Table 3. For Fm![[3 with combining macron]](https://www.rsc.org/images/entities/char_0033_0304.gif) m phase, the λ and the ωlog are 0.63 and 94 K at 0 GPa. From the PHDOS and Eliashberg phonon spectral function α2F(ω) as well as integrated electron-phonon coupling λ(ω) presented in the left panel of Fig. 8, it is clear that the total λ is mainly donated by the Ir atoms, P atoms by only 8%. In comparison, the I4/mmm phase at 200 GPa has a larger ωlog with a value of 283.7 K, while λ decreases to 0.38. In combination with the electronic structures of both structures [Fig. 7(a) and (d)], one can find that a key factor for small λ is PDOS of Ir atoms at the Ef, which weakens the Tc in I4/mmm compared to the Fm
m phase, the λ and the ωlog are 0.63 and 94 K at 0 GPa. From the PHDOS and Eliashberg phonon spectral function α2F(ω) as well as integrated electron-phonon coupling λ(ω) presented in the left panel of Fig. 8, it is clear that the total λ is mainly donated by the Ir atoms, P atoms by only 8%. In comparison, the I4/mmm phase at 200 GPa has a larger ωlog with a value of 283.7 K, while λ decreases to 0.38. In combination with the electronic structures of both structures [Fig. 7(a) and (d)], one can find that a key factor for small λ is PDOS of Ir atoms at the Ef, which weakens the Tc in I4/mmm compared to the Fm![[3 with combining macron]](https://www.rsc.org/images/entities/char_0033_0304.gif) m phase. Specifically, the pressure facilitates charge transfer from Ir to P atoms in the I4/mmm phase at 200 GPa when comparing to Fm
m phase. Specifically, the pressure facilitates charge transfer from Ir to P atoms in the I4/mmm phase at 200 GPa when comparing to Fm![[3 with combining macron]](https://www.rsc.org/images/entities/char_0033_0304.gif) m at 0 GPa. As a consequence, the PDOS of Ir atoms at the Ef decrease [Fig. 7(a) and (d)], which strengthens the Ir–P bonds, and thus enhances the Ir–P vibration coupling, as shown in PHDOS for I4/mmm and Fm
m at 0 GPa. As a consequence, the PDOS of Ir atoms at the Ef decrease [Fig. 7(a) and (d)], which strengthens the Ir–P bonds, and thus enhances the Ir–P vibration coupling, as shown in PHDOS for I4/mmm and Fm![[3 with combining macron]](https://www.rsc.org/images/entities/char_0033_0304.gif) m phase presented in Fig. 8. The resulting smaller λ decreases the Tc.
m phase presented in Fig. 8. The resulting smaller λ decreases the Tc.
![[3 with combining macron]](https://www.rsc.org/images/entities/char_0033_0304.gif) m and I4/mmm at different pressure (GPa)
m and I4/mmm at different pressure (GPa)
| Phase | Pressure | NEf | λ | ωlog | Tc (μ* = 0.1) | Tc (μ* = 0.13) |
|---|---|---|---|---|---|---|
Fm![[3 with combining macron]](https://www.rsc.org/images/entities/char_0033_0304.gif) m m |
0 | 0.91 | 0.63 | 94.00 | 2.51 | 1.83 |
| I4/mmm | 200 | 0.95 | 0.38 | 283.71 | 0.89 | 0.35 |
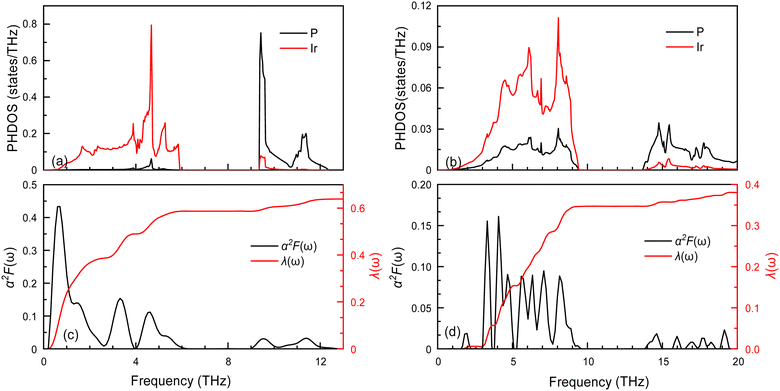 | ||
Fig. 8 The projected phonon densities of states PHDOS, Eliashberg phonon spectral function α2F(ω) and integrated electron-phonon coupling λ(ω) of the (a) and (c) Fm![[3 with combining macron]](https://www.rsc.org/images/entities/char_0033_0304.gif) m and (b) and (d) I4/mmm. m and (b) and (d) I4/mmm. | ||
3.4 Optical properties
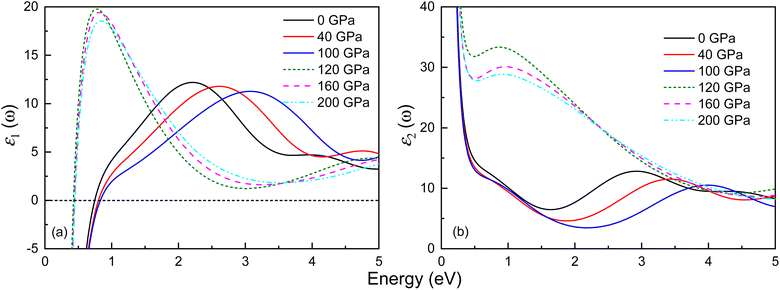
The optical properties of both phases of Ir2P have been studied by calculating the variation of the dielectric function’ ε1(ω) and ε2(ω) with energy at different pressures. The outcomes for the low-energy and high-energy regions are depicted in Fig. 9 and S4,† respectively. Both phases exhibit Drude behavior, which is a characteristic feature of metallic systems, as indicated by substantial negative values of ε1(ω) in the low-energy range below 1 eV. Their ε1(ω) curves show a general trend of increasing and then decreasing with rising energy. In the high-energy region, their values become negative, signifying that the material behaves opaquely (see Fig. S4†). All observable peaks of ε2(ω) are within the energy range of 0–5 eV, and above 20 eV, the value of ε2(ω) tends to zero. The ε2(ω) curves of the Fm![[3 with combining macron]](https://www.rsc.org/images/entities/char_0033_0304.gif) m and I4/mmm phases exhibit peaks at 2.93 and 0.88 eV at 0 and 120 GPa, respectively. Their shift of ε2(ω) towards the high-energy region, indicating a blueshift, with increasing pressure, is associated with the enhancement of electron transition at high pressure.
m and I4/mmm phases exhibit peaks at 2.93 and 0.88 eV at 0 and 120 GPa, respectively. Their shift of ε2(ω) towards the high-energy region, indicating a blueshift, with increasing pressure, is associated with the enhancement of electron transition at high pressure.
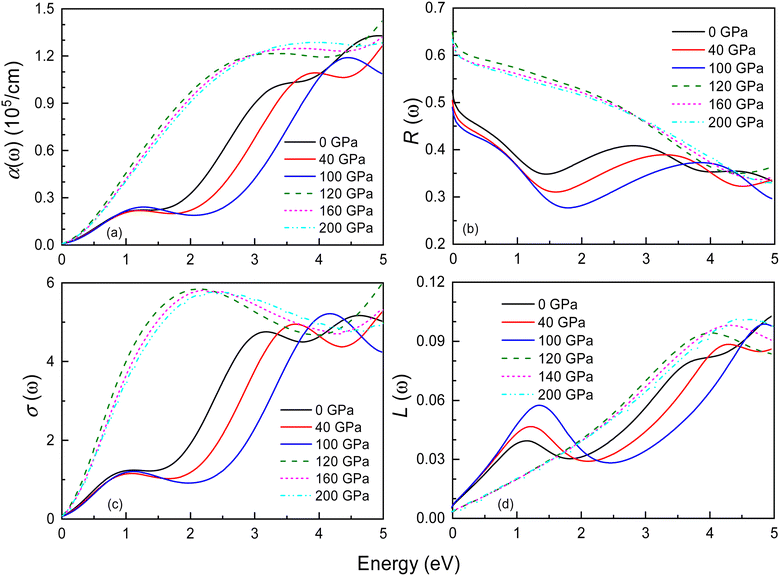
Fig. 10 and S5† display the optical properties of Ir2P under pressure in the low-energy and high-energy regions, including the absorption coefficient α(ω), reflectivity R(ω), optical conductivity σ(ω), and loss function L(ω). The starting point of optical absorption coefficient at zero photon energy indicates that Ir2P has metallicity, which is consistent with its electronic structures (see Fig. 6 and 7). In Fig. 10(a) and S5,† the optical absorption spectra of both structures show a broad, continuous absorption characteristic, distinct from the well-defined absorption peaks in semiconductors or insulators. This is attributed to the continuous band structure of metallic materials, lacking a band gap, which allows electrons to move freely, leading to a more uniform absorption of light. The presence of these inconspicuous absorption peaks is associated with electron transition, as incident light imparts energy to electrons, prompting their transition from the ground state to the excited state. Additionally, their values progressively rise with energy, peaking at 14.9 (0 GPa) and 15.4 eV (120 GPa), respectively, implying the materials' proficiency as ultraviolet absorbers. Their overall absorption region and peaks exhibit an increase with rising pressure. These findings suggest that applying pressure can broaden the photoresponse range of Ir2P and improve its light absorption in the ultraviolet region [see Fig. S5(a)†]. Both structures exhibit reflectivity values exceeding 76% in the 25–35 eV, suggesting that Ir2P can serve effectively as a reflective coating within this energy range [see Fig. S5(b)†]. With increasing energy, their optical conductivity initiates an ascent from a photon energy of zero, attributed to the absence of a bandgap in Ir2P, and culminates in a maximum in the ultraviolet region [see Fig. 10(c) and S5(c)†]. The research reveals that Ir2P exhibits optical conductivity across the infrared, visible, and ultraviolet wavelength ranges. Based on Fig. 10(d) and S5(d),† it is evident that the Fm![[3 with combining macron]](https://www.rsc.org/images/entities/char_0033_0304.gif) m and I4/mmm phases exhibit smaller loss function in the visible region, and their maximum energy loss peaks occur at 26.2 eV (0 GPa) and 31.3 eV (120 GPa), corresponding to their plasmonic frequencies, respectively. When the incident photon energy surpasses its plasma frequency, the absorption coefficient and reflectivity decrease drastically, and the Ir2P becomes transparent, implying that the Ir2P changes from a metal response to a dielectric response. Moreover, both structures exhibit a blueshift in reflectivity, optical conductivity and loss function with increasing pressure towards the high-energy region.
m and I4/mmm phases exhibit smaller loss function in the visible region, and their maximum energy loss peaks occur at 26.2 eV (0 GPa) and 31.3 eV (120 GPa), corresponding to their plasmonic frequencies, respectively. When the incident photon energy surpasses its plasma frequency, the absorption coefficient and reflectivity decrease drastically, and the Ir2P becomes transparent, implying that the Ir2P changes from a metal response to a dielectric response. Moreover, both structures exhibit a blueshift in reflectivity, optical conductivity and loss function with increasing pressure towards the high-energy region.
3.5 Thermodynamic properties
Thermodynamic quantities for the Fm![[3 with combining macron]](https://www.rsc.org/images/entities/char_0033_0304.gif) m structure of Ir2P at different pressures and temperatures have been obtained using the QHD model. The calculated energy-volume points at zero temperature and pressure are used to generate the results shown in Fig. 11. The volume curves become steeper with increasing temperature, indicating that the anti-fluorite structure of Ir2P is more easily compressed under higher temperatures. The isothermal bulk modulus B increases with increasing pressure but generally decreases with rising temperature when looking at the overall trend of the results (Fig. 11). Upon careful examination, it is discovered that B slightly and linearly decreases with temperature at a constant pressure, and increases with pressure at a fixed temperature. This is consistent with the volume expansion trend. These findings suggest that pressure has a more significant impact on B than temperature for Ir2P.
m structure of Ir2P at different pressures and temperatures have been obtained using the QHD model. The calculated energy-volume points at zero temperature and pressure are used to generate the results shown in Fig. 11. The volume curves become steeper with increasing temperature, indicating that the anti-fluorite structure of Ir2P is more easily compressed under higher temperatures. The isothermal bulk modulus B increases with increasing pressure but generally decreases with rising temperature when looking at the overall trend of the results (Fig. 11). Upon careful examination, it is discovered that B slightly and linearly decreases with temperature at a constant pressure, and increases with pressure at a fixed temperature. This is consistent with the volume expansion trend. These findings suggest that pressure has a more significant impact on B than temperature for Ir2P.
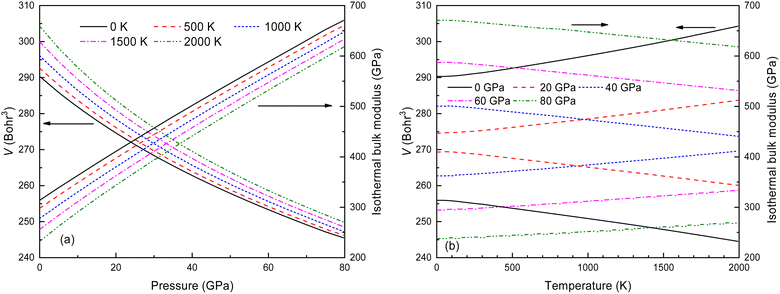 | ||
Fig. 11 The calculated volume and bulk modulus for the Fm![[3 with combining macron]](https://www.rsc.org/images/entities/char_0033_0304.gif) m phase of Ir2P (a) as a function of pressure at different temperatures and (b) as a function of temperatures at various pressures. m phase of Ir2P (a) as a function of pressure at different temperatures and (b) as a function of temperatures at various pressures. | ||
The B value of Ir2P changes regularly with temperature and pressure. However, the first and second pressure derivatives of B,  and
and  show some variation with changes in pressure and temperature, as shown in Fig. 12. Li et al.59 noted that the
  and
and  derived from the three-parameter Vinet or Rose EOS often deviate significantly from experimental observations, indicating the need for further development of the EOS with improved performance. As shown in Fig. 12(a) and (b),
  increases with the temperature throughout the pressure range of 0–80 GPa, while
  decreases rapidly at low pressures, and moderately at higher pressures with an increase in temperature. For Ir2P, reducing pressure has a similar effect on
  as increasing temperature. When the pressure is less than 30 GPa,
  changes sharply, and gradually becomes gentler with an increase in pressure, remaining relatively stable after the pressure exceeds 40 GPa. Therefore, under high-pressure conditions, the response of
  in Ir2P to temperature change is relatively slow.
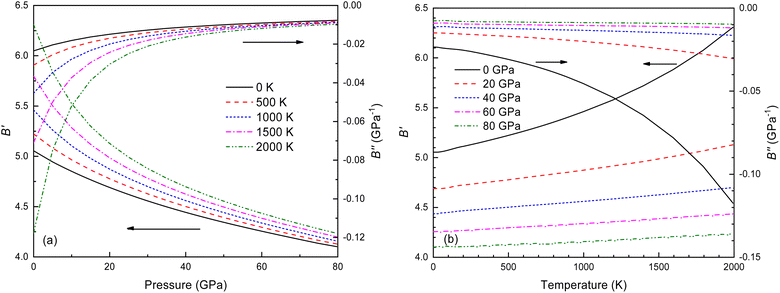 | ||
Fig. 12 (a) Pressure dependence of the  and and  at different temperatures and (b) temperature dependence of the at different temperatures and (b) temperature dependence of the  and and  at various pressures for Fm at various pressures for Fm![[3 with combining macron]](https://www.rsc.org/images/entities/char_0033_0304.gif) m phase of Ir2P. m phase of Ir2P. | ||
In the quasi-harmonic approximation, anharmonicity is limited to thermal expansion. Fig. 13 shows how the volume thermal expansion coefficient α changes with temperature under different pressures. As seen in Fig. 13(a) and (b), α decreases significantly with increasing pressure at various temperatures, and increases with rising temperature at different pressures. This indicates that anharmonic effects have a significant impact on the antifluorite structure of Ir2P under low-pressure and high-temperature conditions.
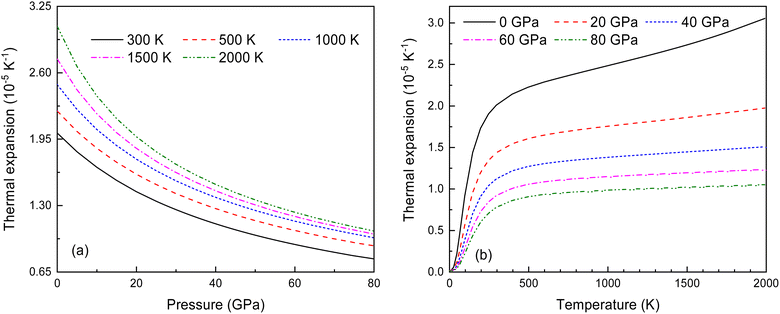 | ||
Fig. 13 (a) The pressure-dependent thermal expansion coefficient α at various temperatures and (b) the temperature-dependent α at various pressures for Fm![[3 with combining macron]](https://www.rsc.org/images/entities/char_0033_0304.gif) m phase of Ir2P. m phase of Ir2P. | ||
Fig. 14 illustrates the relationship between the Debye temperature, pressure and temperature for Ir2P with the anti-fluorite structure. As displayed in Fig. 14(a) and (b), it can be observed that θD values increase with the rise in pressure. At low pressures, the θD value undergoes a significant reduction when the temperature varies from 0 to 2000 K. Nonetheless, as the pressure increases, the extent of this reduction becomes less significant. To the best of our knowledge, this is the first quantitative theoretical prediction for Ir2P concerning the pressure and temperature dependence of the Debye temperature. Further research is needed to experimentally confirm these findings.
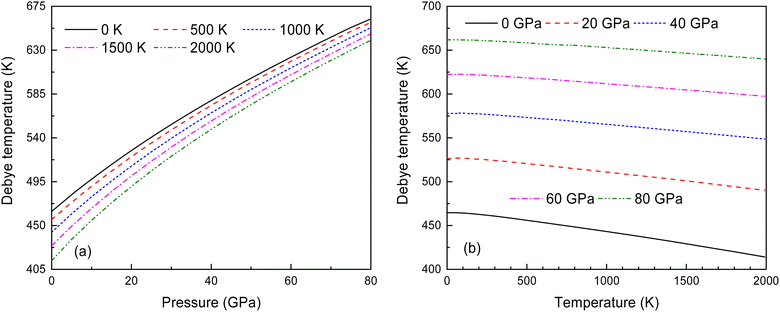 | ||
Fig. 14 (a) Pressure dependence of the θD at various temperatures and (b) temperature dependence of θD at various pressures for Fm![[3 with combining macron]](https://www.rsc.org/images/entities/char_0033_0304.gif) m phase of Ir2P. m phase of Ir2P. | ||
4. Conclusions
First-principles calculations and the quasi-harmonic approximation were employed to examine the ground-state characteristics and the elastic, electronic, and finite-temperature thermodynamic properties of Ir2P as a function of pressure and temperature. The study found that the GGA is more suitable than the LDA for describing the ground-state properties of Ir2P. Good agreement has been achieved with existing experimental and theoretical studies, indicating that the GGA provides a more accurate representation of the material's properties. The analysis of the calculated results indicates that the anti-fluorite structure of Ir2P is a potential candidate for being one of the hard materials. With further increase in pressure, the Fm![[3 with combining macron]](https://www.rsc.org/images/entities/char_0033_0304.gif) m phase changes to the I4/mmm phase at 103.4 GPa. The mechanical and dynamical stabilities of Ir2P in the studied pressure range are verified by the calculated elastic constants and phonon dispersion curves. The electronic structure and EPC reveal that the Fm
m phase changes to the I4/mmm phase at 103.4 GPa. The mechanical and dynamical stabilities of Ir2P in the studied pressure range are verified by the calculated elastic constants and phonon dispersion curves. The electronic structure and EPC reveal that the Fm![[3 with combining macron]](https://www.rsc.org/images/entities/char_0033_0304.gif) m and I4/mmm phases of Ir2P are superconducting materials with Tc of 2.51 and 0.89 K at 0 and 200 GPa, respectively. Calculated optical properties show that both the Fm
m and I4/mmm phases of Ir2P are superconducting materials with Tc of 2.51 and 0.89 K at 0 and 200 GPa, respectively. Calculated optical properties show that both the Fm![[3 with combining macron]](https://www.rsc.org/images/entities/char_0033_0304.gif) m and I4/mmm phases of Ir2P are photoconductive in the infrared, visible, and ultraviolet regions. More interestingly, both the Fm
m and I4/mmm phases of Ir2P are photoconductive in the infrared, visible, and ultraviolet regions. More interestingly, both the Fm![[3 with combining macron]](https://www.rsc.org/images/entities/char_0033_0304.gif) m and I4/mmm phases of Ir2P have reflectance higher than 76% in the energy range of 25–35 eV at different pressures, which suggests that both materials can be used as reflective coatings. The pressure and temperature dependencies of the primitive-cell volume, θD, B,
m and I4/mmm phases of Ir2P have reflectance higher than 76% in the energy range of 25–35 eV at different pressures, which suggests that both materials can be used as reflective coatings. The pressure and temperature dependencies of the primitive-cell volume, θD, B,  ,
,  , and α of Fm
![[3 with combining macron]](https://www.rsc.org/images/entities/char_0033_0304.gif) m phase were also evaluated within the ranges of 0–80 GPa and 0–2000 K using the QHD model. The fluctuation of
m phase were also evaluated within the ranges of 0–80 GPa and 0–2000 K using the QHD model. The fluctuation of  and
and  , which hold a crucial position in developing approximate EOS, has been forecasted for the anti-fluorite structure of Ir2P within an expanded pressure and temperature range. The outcomes showed that the two parameters do not reach constant values as presumed in the EOS exploration at high pressures and temperatures. Here, the
  escalates with the rise in temperature, and the impact of declining pressure is equivalent to that of increasing temperature. Furthermore, for Ir2P, the
  at high pressures is a weak function of temperature. Our calculations show that Ir2P is a hard multifunctional material with superconductivity and excellent photoconductivity and reflectivity.
Conflicts of interest
The authors declare that they have no known competing financial interests or personal relationships that could have appeared to influence the work reported in this paper.Acknowledgements
This study was supported by the Key Natural Science Foundation of Gansu Province (No. 20JR5RA427).References
- K. Zhao, Q. Wang, W. Li, Q. Yang, H. Yu, F. Han, H. Liu and S. Zhang, Phys. Rev. B, 2022, 105, 094104 CrossRef CAS.
- S. Liu, D. Xu, R. Liu, Z. Yao and P. Wang, Dalton Trans., 2023, 52, 1000–1008 RSC.
- S. B. Schneider, D. Baumann, A. Salamat, Z. Konôpková, H.-P. Liermann, M. R. Schwarz, W. Morgenroth, L. Bayarjargal, A. Friedrich, B. Winkler and W. Schnick, Chem. Mater., 2012, 24, 3240–3246 CrossRef CAS.
- Z. Zhao, K. Bao, D. Li, D. Duan, F. Tian, X. Jin, C. Chen, X. Huang, B. Liu and T. Cui, Sci. Rep., 2014, 4, 4797 CrossRef PubMed.
- R. W. Cumberland, M. B. Weinberger, J. J. Gilman, S. M. Clark, S. H. Tolbert and R. B. Kaner, J. Am. Chem. Soc., 2005, 127, 7264–7265 CrossRef CAS PubMed.
- B. Petermüller, C. Neun, K. Wurst, L. Bayarjargal, D. Zimmer, W. Morgenroth, M. Avalos-Borja, I. G. Becerril-Juarez, M. J. Mühlbauer, B. Winkler and H. Huppertz, Inorg. Chem., 2018, 57, 10341–10351 CrossRef PubMed.
- Y. Wang, J. Zhang, L. L. Daemen, Z. Lin, Y. Zhao and L. Wang, Phys. Rev. B: Condens. Matter Mater. Phys., 2008, 78, 224106 CrossRef.
- M. Xie, R. Mohammadi, Z. Mao, M. M. Armentrout, A. Kavner, R. B. Kaner and S. H. Tolbert, Phys. Rev. B, 2012, 85, 064118 CrossRef.
- E. Bykova, S. V. Ovsyannikov, M. Bykov, Y. Yin, T. Fedotenko, H. Holz, S. Gable, B. Merle, S. Chariton, V. B. Prakapenka, N. Dubrovinskaia, A. F. Goncharov and L. Dubrovinsky, J. Mater. Chem. A, 2022, 10, 20111–20120 RSC.
- W. Sun, X. Kuang, H. Liang, X. Xia, Z. Zhang, C. Lu and A. Hermann, Phys. Chem. Chem. Phys., 2020, 22, 5018–5023 RSC.
- S. Khandarkhaeva, T. Fedotenko, M. Bykov, E. Bykova, S. Chariton, P. Sedmak, K. Glazyrin, V. Prakapenka, N. Dubrovinskaia and L. Dubrovinsky, Eur. J. Inorg. Chem., 2020, 2020, 2186–2190 CrossRef CAS.
- F. Kawamura, Y. Shibazaki, H. Yusa and T. Taniguchi, Cryst. Growth Des., 2023, 23, 2504–2510 CrossRef CAS.
- T. Sasaki, T. Yamamoto, S. Asano, K. Niwa and M. Hasegawa, Dalton Trans., 2023, 52, 469–475 RSC.
- Y. Jin, W. Huang, J. Zhang, S. Li, S. Cheng, W. Sun, M. Ju and C. Zhang, Arabian J. Chem., 2023, 16, 104546 CrossRef CAS.
- C. Cui, J. Bi and C. Lu, Cryst. Growth Des., 2022, 22, 6201–6206 CrossRef CAS.
- R. Zhang, D. Legut, Z. Lin, Y. Zhao, H. Mao and S. Veprek, Phys. Rev. Lett., 2012, 108, 255502 CrossRef CAS PubMed.
- K. Zhao, Q. Wang, W. Li, Q. Yang, H. Yu, F. Han, H. Liu and S. Zhang, Phys. Rev. B, 2022, 105, 094104 CrossRef CAS.
- X.-W. Sun, Q.-F. Chen, X.-R. Chen, L.-C. Cai and F.-Q. Jing, J. Appl. Phys., 2011, 110, 103507 CrossRef.
- Y. Liang, J. Yang, L. Xi, C. Liu, G. Zhang and W. Zhang, Mater. Today Phys., 2018, 7, 54–60 CrossRef.
- Y. Liang, C. Li, W. Guo and W. Zhang, Phys. Rev. B: Condens. Matter Mater. Phys., 2009, 79, 024111 CrossRef.
- M. Kavitha, G. Sudha Priyanga, R. Rajeswarapalanichamy and K. Iyakutti, J. Phys. Chem. Solids, 2015, 77, 38–49 CrossRef CAS.
- Y. Li, Y. Gao, B. Xiao, T. Min, Z. Fan, S. Ma and L. Xu, J. Alloys Compd., 2010, 502, 28–37 CrossRef CAS.
- Q. Wei, C. Zhao, M. Zhang, H. Yan and B. Wei, Phys. Lett. A, 2019, 383, 2429–2435 CrossRef CAS.
- X. Jiang, Q. Xiong, S. Nam, F. Qian, Y. Li and C. M. Lieber, Nano Lett., 2007, 7, 3214–3218 CrossRef CAS.
- K. Y. Yoon, Y. Jang, J. Park, Y. Hwang, B. Koo, J.-G. Park and T. Hyeon, J. Solid State Chem., 2008, 181, 1609–1613 CrossRef CAS.
- A.-M. Alexander and J. S. Hargreaves, Chem. Soc. Rev., 2010, 39, 4388–4401 RSC.
- P. Liu and J. A. Rodriguez, J. Am. Chem. Soc., 2005, 127, 14871–14878 CrossRef CAS.
- Y. Shi and B. Zhang, Chem. Soc. Rev., 2016, 45, 1529–1541 RSC.
- R. H. Bowker, M. C. Smith, B. A. Carrillo and M. E. Bussell, Top. Catal., 2012, 55, 999–1009 CrossRef CAS.
- W. Blatz, F. Weibke and E. May, Z. Anorg. Allg. Chem., 1935, 223, 129–143 CrossRef.
- S. Rundqvist, Nature, 1960, 185, 31–32 CrossRef.
- C. J. Raub, W. Zachariasen, T. Geballe and B. Matthias, J. Phys. Chem. Solids, 1963, 24, 1093–1100 CrossRef CAS.
- C. M. Sweeney, K. L. Stamm and S. L. Brock, J. Alloys Compd., 2008, 448, 122–127 CrossRef CAS.
- P. Wang, Y. Wang, L. Wang, X. Zhang, X. Yu, J. Zhu, S. Wang, J. Qin, K. Leinenweber, H. Chen, D. He and Y. Zhao, Sci. Rep., 2016, 6, 21787 CrossRef CAS PubMed.
- X. Li, X. Ma, W. Gao and Y. Liu, Chin. J. High Pressure Phys., 2019, 33, 011103 Search PubMed.
- G. Kresse and J. Furthmüller, Phys. Rev. B: Condens. Matter Mater. Phys., 1996, 54, 11169 CrossRef CAS PubMed.
- D. Vanderbilt, Phys. Rev. B: Condens. Matter Mater. Phys., 1990, 41, 7892 CrossRef PubMed.
- J. P. Perdew, A. Ruzsinszky, G. I. Csonka, O. A. Vydrov, G. E. Scuseria, L. A. Constantin, X. Zhou and K. Burke, Phys. Rev. Lett., 2008, 100, 136406 CrossRef PubMed.
- J. P. Perdew and A. Zunger, Phys. Rev. B: Condens. Matter Mater. Phys., 1981, 23, 5048 CrossRef CAS.
- H. J. Monkhorst and J. D. Pack, Phys. Rev. B: Solid State, 1976, 13, 5188 CrossRef.
- T. H. Fischer and J. Almlof, J. Phys. Chem., 1992, 96, 9768 CrossRef CAS.
- L. Fast, J. Wills, B. Johansson and O. Eriksson, Phys. Rev. B, 1995, 51, 17431 CrossRef CAS PubMed.
- C. Asker, L. Vitos and I. A. Abrikosov, Phys. Rev. B: Condens. Matter Mater. Phys., 2009, 79, 214112 CrossRef.
- G. Grimvall, B. Magyari-Köpe, V. Ozoliņš and K. A. Persson, Rev. Mod. Phys., 2012, 84, 945 CrossRef CAS.
- A. Togo, F. Oba and I. Tanaka, Phys. Rev. B: Condens. Matter Mater. Phys., 2008, 78, 134106 CrossRef.
- P. Giannozzi, S. Baroni, N. Bonini, M. Calandra, R. Car, C. Cavazzoni, D. Ceresoli, G. L. Chiarotti, M. Cococcioni and I. Dabo, J. Phys.: Condens. Matter, 2009, 21, 395502 CrossRef PubMed.
- W. McMillan, Phys. Rev., 1968, 167, 331 CrossRef CAS.
- M. Gajdoš, K. Hummer, G. Kresse, J. Furthmüller and F. Bechstedt, Phys. Rev. B: Condens. Matter Mater. Phys., 2006, 73, 045112 CrossRef.
- M. Blanco, E. Francisco and V. Luana, Comput. Phys. Commun., 2004, 158, 57–72 CrossRef CAS.
- Y. Liang and B. Zhang, Phys. Rev. B: Condens. Matter Mater. Phys., 2007, 76, 132101 CrossRef.
- F. Birch, Phys. Rev., 1947, 71, 809 CrossRef CAS.
- R. J. Angel, Rev. Mineral. Geochem., 2000, 41, 35–59 CrossRef.
- R. Hill, Proc. Phys. Soc. A, 1952, 65, 349 CrossRef.
- M. Born and K. Huang, Dynamical Theory of Crystal Lattices, Oxford University, New York, 1998 Search PubMed.
- J. Muscat, V. Swamy and N. M. Harrison, Phys. Rev. B: Condens. Matter Mater. Phys., 2002, 65, 224112 CrossRef.
- M. E. Kilic and K. R. Lee, Phys. Rev. Mater., 2021, 5, 065404 CrossRef CAS.
- M. E. Kilic and K. R. Lee, Carbon, 2021, 174, 368–381 CrossRef CAS.
- M. E. Kilic and K. R. Lee, Carbon, 2022, 195, 154–164 CrossRef CAS.
- J. Li, X. Dai, S. Liang, K. Tai, Y. Kong and B. Liu, Phys. Rep., 2008, 455, 1–134 CrossRef CAS.
Footnote |
| † Electronic supplementary information (ESI) available. See DOI: https://doi.org/10.1039/d3ra07464a |
| This journal is © The Royal Society of Chemistry 2024 |

