 Open Access Article
Effects of isotropic strain on the structure and transport properties of half-Heusler alloy BiBaK: a first-principles investigation
Junhong Wei *a,
Yongliang Guoa and
Guangtao Wangb
aSchool of Science, Henan Institute of Technology, Xinxiang 453003, China. E-mail: weijh@hait.edu.cn; ylguo@hait.edu.cn
bSchool of Physics, Henan Normal University, Xinxiang 453007, China. E-mail: wangtao@htu.cn
First published on 2nd January 2024
Abstract
In this study, using density functional and Boltzmann transport theories, we systematically investigated the effects of tensile and compressive strains on the elastic properties, phonon dispersion relation, electronic structure, and transport properties of the half-Heusler compound BiBaK. We calculated the elastic constants and phonon dispersion curves for BiBaK, which demonstrated its mechanical and thermodynamic stability, respectively, under different isotropic strains. Further, calculations showed that the electronic structure and energy bandgap of BiBaK changed with the application of isotropic strain. A high power factor and low thermal conductivity are key to improving the performance of thermoelectric materials. The figure of merit of BiBaK is 0.6 when it is unstrained and reaches a maximum value of 0.93 at −9% compressive strain and a temperature of 1200 K, indicating that under isotropic compressive strain, BiBaK compounds are efficient thermoelectric materials for high-temperature applications.
1. Introduction
The ever-increasing global demand for energy is expected to grow further over the upcoming decades.1,2 Currently, the energy crisis, climate change, and environmental pollution are major problems facing humanity. Therefore, exploring various green3–7 and efficient energy conversion technologies8–16 has gained considerable research attention. Thermoelectric materials, which can convert heat into electricity, are attractive for solid-state scalable-device applications, such as waste heat recovery17 and thermal management.18 Therefore, thermoelectric technologies will play an important role in sustainable economies.The performance of thermoelectric devices is essentially determined by the transport properties of the material, which can be evaluated via the dimensionless parameter  , where S is the Seebeck coefficient, σ is the electrical conductivity, T is the absolute temperature, and κ is the total thermal conductivity, which is related to the electron (κe) and lattice (κι) thermal conductivities as κ = κι + κe.19,20 A high ZT value implies that the material has a high conversion efficiency. However, the parameters that determine ZT are correlated, making any improvements therein challenging.21
Two methods are generally used to improve ZT: reducing the thermal conductivity (κ) and increasing the power factor (PF = S2σ). κ depends on κe and κι, and κe is proportional to σ; therefore, reducing κe causes the PF to decrease. Thus, κ should be reduced only by reducing κι, which can be achieved via several different approaches, including the design of new materials, nanostructuring, and solid-solution alloying.22–26 The PF can be improved using various band-tuning techniques, such as introducing resonance states,27 applying strain,28 and performance doping.29 Applying strain can alter the electronic structure of a material, and because the transport properties of the material are correlated with its electronic structure, the strain affects the related transport properties. In recent years, several studies have reported significant improvement in material properties under strain.30–38 Using the Tran–Blaha modified Becke–Johnson density functional theory, Guo et al. studied the strain effects on doped Bi2O2Se to optimize its thermoelectric properties, and they found that the n- and p-type Seebeck coefficients could be increased under compressive and tensile in-plane strains, respectively.30 Zou et al. found that the in-plane and out-of-plane power factors of n-type SrTiO3 increased under compressive and tensile strains, respectively, and attributed this dependence to strain-induced electron redistribution.31 Lv et al. verified that the thermoelectric performance of phosphodiene could be improved via strain-induced band convergence.32 In another study, they reported that under the action of biaxial tensile strain, the Seebeck coefficient of ZrS2 monolayer films increased and its thermal conductivity decreased, resulting in optimized thermoelectric properties.33 Yadav et al. studied the effect of static strain (up to 10%) on the topology and thermoelectric performance of BaPtS, and they found that at room temperature, ZT attained its maximum value of 0.222 at a strain of 1%.34 Khandy et al. obtained better room-temperature thermoelectric performance via strain engineering, achieving ZTe values of up to 0.81 with minimal fluctuation over a broad temperature range.35 Saini et al. investigated the effects of isotropic strain on the electronic structure and transport properties of the half-Heusler alloy LiScGe. Their calculations showed that increasing the tensile and compressive strains led to an overall increase in the ZT values of n- and p-type semiconductors, respectively.36
Here in this work, we aim to investigate the effect of different isotropic strains on the electronic band structure and the transport properties of half-Heusler compound BiBaK. Half-Heusler compounds exhibit good thermal and mechanical stabilities, rich elemental compositions, environmental friendliness, and excellent thermoelectric properties at mid-to high temperatures, rendering them promising candidates for thermoelectric applications.39 Numerous half-Heusler compounds have been researched and developed for various thermoelectric applications. Fu et al.40 reported novel p-type FeNb1−xTixSb (0.04 ≤ x ≤ 0.24) half-Heusler thermoelectric materials with a maximum ZT of 1.1 at 1100 K, where a Ti content of up to x = 0.2 optimized the power factor and reduced the lattice thermal conductivity. Sun et al.41 predicted a notably high ZT of 7.38 at 700 K for the n-type half-Heusler compound BCaGa. Zhu et al.42 studied a p-type TaFeSb-based half-Heusler compound, demonstrating an unprecedentedly high ZT of ∼1.52 at 973 K. Fang et al.43 predicted a significantly high ZT value of 1.54 at 1200 K in p-type half-Heusler RuTaSb. Shen et al.44 reported that FeNb0.9−x Hf0.1TixSb (0 ≤ x ≤ 0.1) showed a maximum figure of merit ZT of 1.32 at 1200 K.
So, in this study, we aimed to investigate thermoelectric materials for better performance, and we selected the half-Heusler compound BiBaK mainly owing to its low lattice thermal conductivity at 300 K, as reported by Feng et al.45 (2.26 W m−1 K−1) and Han et al.46 (1.82 W m−1 K−1), which makes it promising as a good thermoelectric material. And so far, there are few reports about the effccts of isotropic strain on the structure and transport properties of BiBaK. In order to explore the properties under isotropic strain of BiBaK, using first principles, we investigated the effect of isotropic strain on the electronic band structure and transport properties of the half-Heusler compound BiBaK.
2. Methodology
We conducted simulations on the half-Heusler compound BiBaK using the density functional theory along with the full-potential linearized augmented plane wave47 method employed in the WIEN2k software.48 The exchange-correlation functional was solved within the restraints of the Perdew–Burke–Ernzerhof generalized-gradient approximation.49 To obtain accurate band structures and bandgap values, we adopted the modified Becke–Johnson (mBJ) potential50 via spin–orbit coupling (SOC) calculations. The plane-wave expansion cutoff energy was set to 600 eV, and the standard for each ion convergence was set below 0.001 eV Å−1, with a convergence threshold set to 10−7 eV for the total energy calculation in the electronic self-consistent. A 30 × 30 × 30 k-mesh was used for the Brillouin zone to calculate the electronic properties of BiBaK under various isotropic strains. To investigate the dynamic stability of the BiBaK structures, the phonon dispersions were calculated under various strains. The phonon spectrum was calculated using the supercell method51 implemented in the PHONOPY code,52 where the supercell comprised 3 × 3 × 3 cells based on the optimized crystallographic primitive cell. The Brillouin zone integration was selected via a 2 × 2 × 2 k-point mesh. The forces induced by small displacements were calculated within the Vienna ab initio simulation package.53–56 To calculate the thermoelectric properties of unstrained and strained structures, we used the semi-classical Boltzmann transport theory with the constant scattering time approximation,57 as implemented in the BoltzTraP code,58,59 and the rigid band approximation. The thermoelectric properties were determined with 40![[thin space (1/6-em)]](https://www.rsc.org/images/entities/char_2009.gif) 000 k-points in the dense k-mesh.
000 k-points in the dense k-mesh.
The computation of the transport properties with BoltzTraP used the constant relaxation time approximation (τ), which varies with compound, temperature, and carrier concentration. With the exception of the Seebeck coefficient (S), which is independent of τ, the transport coefficients were computed in units of τ, that is, σ and κe were computed as σ/τ and κe/τ. To determine σ and κe, we calculated τ using the deformation potential theory,60,61 which can effectively describe electron–acoustic phonon interactions. For three-dimensional systems, the relaxation time in the α direction at temperature T can be expressed as
 | (1) |
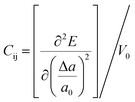 , where E is the total energy of the system, a0 is the lattice constant along the direction of α, Δa = a − a0 is the corresponding lattice distortion, and V0 is the equilibrium volume of the unit cell. The deformation potential constant Eα is calculated as
  , which represents the shift in band edges (VBM or CBM) per unit strain; and the effective mass m∗ is given by
  . These three quantities: Cij, Eα, and m∗, can be readily determined via first-principles calculations.
The lattice thermal conductivity (κι) of BiBaK subjected to isotropic strain was calculated using both Slack's equation and the Callaway model62,63 as follows:
 | (2) |
 | (3) |
Finally, by changing the lattice parameter, we simulated a series of isotropic compressive and tensile strains of up to −9% and 10%, respectively. The implemented strain was defined as ε = (a − a0)/a0, where a is the strained lattice constant and a0 is the equilibrium lattice constant. Positive values of ε signify tensile strain, whereas negative values denote compressive strain. We investigated the effects of various isotropic strains on the electronic band structure, phonon dispersion, and elastic and transport properties of the half-Heusler compound BiBaK.
3. Results and discussion
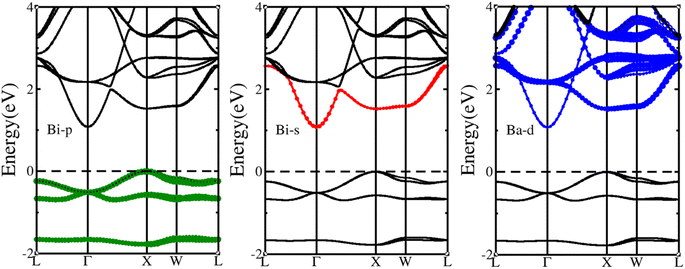
The half-Heusler alloy BiBaK exhibits the cubic antiflourite MgAgAs-type crystal structure of ABC with space group F![[4 with combining macron]](https://www.rsc.org/images/entities/char_0034_0304.gif) 3m (216),65 with the A, B, and C atoms located in the Wyckoff positions 4c (0.25, 0.25, 0.25), 4b (0.5, 0.5, 0.5), and 4a (0, 0, 0), respectively. Another study on BiBaK revealed Wyckoff positions at 4c (0.25, 0.25, 0.25), 4a (0, 0, 0), and 4b (0.5, 0.5, 0.5) for A, B, and C, respectively.45 Some studies have predicted that for half-Heusler alloys with 8 or 18 valence electrons per protocell, the electronic structure and properties are related to the atom that occupies the 4c position,66 which we verified in our previous study.67 Here, we first optimized the lattice parameter for BiBaK (8.437 Å), which was in agreement with other reported values, 8.4 (ref. 68) and 8.45 (ref. 46) Å. To better study the structural characteristics of BiBaK and observe the distribution of various states near the Fermi level, we drew the projected density of states (Fig. 1) and band structure (Fig. 2) of unstrained BiBaK, using the optimized stable lattice constant.
3m (216),65 with the A, B, and C atoms located in the Wyckoff positions 4c (0.25, 0.25, 0.25), 4b (0.5, 0.5, 0.5), and 4a (0, 0, 0), respectively. Another study on BiBaK revealed Wyckoff positions at 4c (0.25, 0.25, 0.25), 4a (0, 0, 0), and 4b (0.5, 0.5, 0.5) for A, B, and C, respectively.45 Some studies have predicted that for half-Heusler alloys with 8 or 18 valence electrons per protocell, the electronic structure and properties are related to the atom that occupies the 4c position,66 which we verified in our previous study.67 Here, we first optimized the lattice parameter for BiBaK (8.437 Å), which was in agreement with other reported values, 8.4 (ref. 68) and 8.45 (ref. 46) Å. To better study the structural characteristics of BiBaK and observe the distribution of various states near the Fermi level, we drew the projected density of states (Fig. 1) and band structure (Fig. 2) of unstrained BiBaK, using the optimized stable lattice constant.
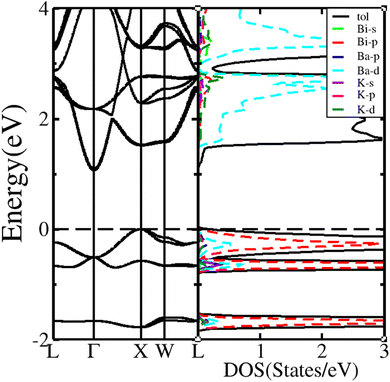 | ||
| Fig. 1 Band structure and projected density of states of the unstrained BiBaK compound. The Fermi level is set at 0 eV. | ||
Fig. 1 shows that unstrained BiBaK is a semiconductor with an indirect bandgap of 1.05 eV along the Γ–X direction, CBM located at the Γ point, and VBM located at the X point. The calculated bandgap energy (Eg) is larger than that calculated in previous studies (0.75 eV46). The stable structure assumed in our calculations (Bi is located at the 4c site) is different from that assumed by Guo et al.69 (Ba is located at the 4c site). Therefore, the bandgap value (1.05 eV) of the BiBaK compound calculated with the SOC + mBJ approximation is different from that calculated by Guo et al.69 (0.7 eV). In addition, considering the SOC but not the mBJ approximation, Han et al.46 obtained a bandgap value of 0.75 eV for the KBiBa compound using the hybrid Heyd–Scuseria–Ernzerhof functional; this value is lower than our calculated value (1.05 eV) because no mBJ correction was considered.46
In the valence band of −1.5 to 2 eV, the density of states is primarily determined by the Bi-p state, with smaller contributions from the Ba-d, K-d, and K-s states, whereas from −0.81 to 0 eV, the Bi-P state has the largest contribution, with smaller contributions from the Ba-d, Ba-p, K-s, and K-d states. The density of states for the bottom of the conduction band mainly contains the Ba-d state, with small contributions from the Bi-p and K-d states. The distribution of these states plays a crucial role in the size of the BiBaK bandgap and properties of the material under various strains.
3.1. Effect of isotropic strain on electronic structure
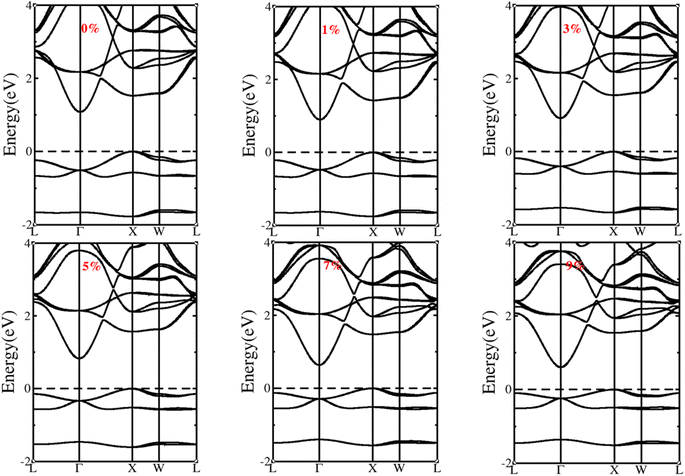
The application of strain also changes the electronic structure of a semiconductor, which further alters its properties. The effective mass (m∗) is an important parameter that depends on band edge curvature. Different strains induce different changes in the electronic structure, resulting in changes in the effective mass at the valence band maximum (VBM) and conduction band minimum (CBM) of the band structure. Tables 1 and 2 present the calculated electronic structure properties and effective masses under the influence of various compressive and tensile strains. Fig. 3 and 4 show the changes in electronic structure under various compressive and tensile strains, respectively. , effective mass of hole
  , and bandgap of BiBaK under various compressive strains
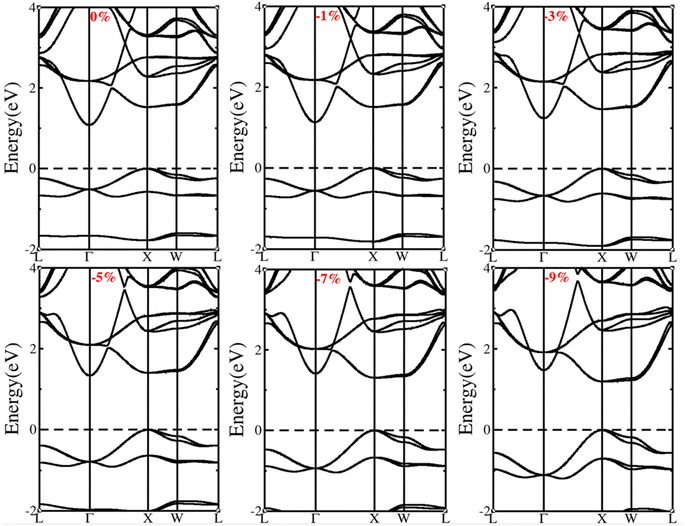 | ||
| Fig. 3 Computed electronic band structures of BiBaK under an isotropic compressive strain of up to −9%. | ||
Fig. 3 and Table 1 show that the bandgap increases with increasing compressive strain. In contrast, Fig. 4 and Table 2 show that the bandgap decreases with increasing tensile strain. BiBaK is an indirect bandgap semiconductor under both tensile and partial-compressive strains. As shown in Fig. 3, BiBaK converts from an indirect to direct bandgap semiconductor when the compressive strain reaches ε = −7%.
 , effective mass of hole
  , and bandgap of BiBaK under various tensile strains
Under various isotropic strains, the energy of both the valence and conduction bands changed. Under tensile strain, the bandgap at the CBM tended to be steep, whereas the band valley at the VBM tended to be flat (Fig. 4); the bandgap decreased with increasing tensile strain. This phenomenon occurs mainly because of the strain on the material structure, which alters the contributions of various orbitals of the atoms present near the Fermi level (Fig. 2). For the CBM, the high-symmetry point G is mainly composed of Bi-s orbitals, and the X and W points are composed of Ba-d orbitals. For the VBM, the high-symmetry point G is mainly composed of Bi-p orbitals. The s-orbital is more expanded than the localized d-orbital. When tensile strain is applied (Fig. 4), the band energy of both s- and d- orbitals is reduced.
The s-orbital band energy decreased faster than that of the d-orbital bands because of the expanded orbital characteristic. Therefore, the s-orbital bands at point G lowered at the CBM and rose at the VBM, whereas the d-orbital bands at the X and G points hardly moved. Consequently, the bandgap gradually decreased, and the band valley at the VBM tended to be flat. A flatter band has a larger effective mass, indicating that the material has excellent thermoelectric properties. Under compressive strain, the band energies of both the s- and d- orbitals increased. The s-orbital bands increased faster than the d-orbital bands; therefore, the band structure of BiBaK changed from an indirect to a direct bandgap when the compressive strain reached −7% (Fig. 3). As the compressive strain gradually increased, the bandgap increased, and the band valley near the VBM tended to steepen. A steeper band curve implies a small effective mass. The application of isotropic strain changes the orbitals of various atoms in a material, thus changing the bandgap and band edge curvature near the CBM and VBM. Therefore, the effective electron mass  increases with increasing compressive strain and decreases with increasing tensile strain, whereas the hole effective mass
  decreases with increasing compressive strain and increases with increasing tensile strain.
The transport properties of the material are dominated by narrow boundary regions of the electronic structure; therefore, all changes that affect the electronic structure around the VBM and CBM have a strong effect on the thermoelectric properties of the material.
3.2. Dynamic properties
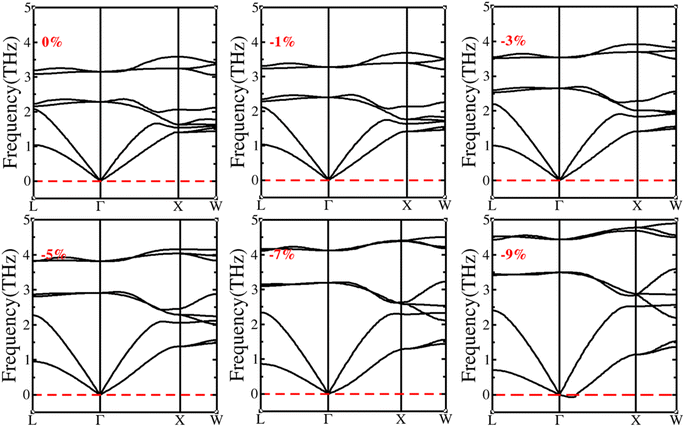
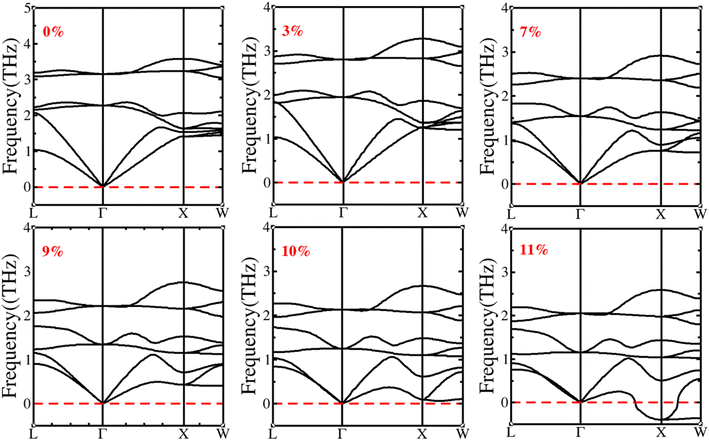
Phonon dispersion is an important parameter for the optical and thermal properties of materials. The phonon dispersion curve also reflects the thermal stability of the material in the absence of an imaginary frequency. Fig. 5 shows the phonon dispersion curves of unstrained BiBaK (ε = 0%) along the symmetry points. The BiBaK primordial cell has three atoms and produces nine phonon branches, three of which are acoustic modes with low frequencies and six are optical modes. Fig. 5 and 6 show the phonon dispersion curves of BiBaK under various isotropic compressive and tensile strains, respectively, along the high symmetry lines in the Brillouin zone. Under compressive strain, the transverse phonon frequency decreases. When the compressive strain reaches −9%, an imaginary frequency appears, and the structure becomes unstable. With increasing tensile strain, the acoustic and optical band frequencies decrease. This is expected, as under tensile strain, the distance between atoms increases, thereby increasing the bond length and strength. This leads to a decrease in phonon frequencies and group velocity. When the tensile strain reaches ε = 11%, the phonon spectrum acquires an imaginary frequency, indicating an unstable structure.3.3. Elastic properties
We calculated the elastic properties of BiBaK, including the elastic constants (Cij), shear modulus (G), bulk modulus (B), Young's modulus (Y), Poisson's ratio (υ), longitudinal velocity (υl), transverse velocity (υs), and average sound velocity (υm), under isotropic strain. The material parameters of BiBaK under isotropic compressive and tensile strains are listed in Tables 3 and 4, respectively. If the calculated elastic constants under various strains meet the Born–Huang stability criteria,70 the material is considered mechanically stable under all compressive and tensile strains up to −9% and 10%, respectively.| C11 > 0, C44 > 0, C11 − C12 > 0 and C11 + 2C12 > 0 | (4) |
| Parameter | Value under compressive strain | |||||
|---|---|---|---|---|---|---|
| 0% | −1% | −3% | −5% | −7% | −9% | |
| C11 (GPa) | 30.06 | 31.69 | 35.56 | 39.51 | 44.05 | 49.02 |
| C12 (GPa) | 10.48 | 12.21 | 16.33 | 21.49 | 27.94 | 35.81 |
| C44 (GPa) | 7.44 | 7.46 | 7.35 | 6.54 | 4.89 | 1.22 |
| B (GPa) | 17.07 | 18.71 | 22.74 | 27.50 | 33.31 | 40.21 |
| Y (GPa) | 21.42 | 21.69 | 21.92 | 20.47 | 16.92 | 7.61 |
| G (GPa) | 8.30 | 8.30 | 8.19 | 7.44 | 5.98 | 2.59 |
| B/G | 2.05 | 2.25 | 2.78 | 3.70 | 5.57 | 15.51 |
| γ | 1.71 | 1.82 | 2.04 | 2.37 | 2.81 | 3.69 |
| υ | 0.29 | 0.31 | 0.40 | 0.38 | 0.42 | 0.47 |
| νι (m s−1) | 2566.35 | 2603.17 | 2684.20 | 2743.16 | 2790.70 | 2778.33 |
| νs (m s−1) | 1395.61 | 1374.44 | 1323.72 | 1223.12 | 1061.84 | 676.89 |
| νm (m s−1) | 1556.91 | 1536.53 | 1486.15 | 1380.03 | 1204.54 | 772.99 |
| ΘD (K) | 125.8 | 125.4 | 123.8 | 117.4 | 104.6 | 68.6 |
Based on these stability conditions, the following elastic properties were defined:71
 | (5) |
 | (6) |
 | (7) |
 | (8) |
 | (9) |
 | (10) |
 | (11) |
The data in Table 4 shows that the bulk modulus B decreases with increasing tensile strain. This represents an increase in the lattice constant owing to an increase in the volume of a single unit cell. Conversely, Table 3 shows that B increases with increasing compressive strain.
| Parameter | Value under tensile strain | ||||||
|---|---|---|---|---|---|---|---|
| 0% | 1% | 3% | 5% | 7% | 9% | 10% | |
| C11 (GPa) | 30.06 | 29.06 | 26.01 | 23.15 | 21.57 | 17.82 | 17.18 |
| C12 (GPa) | 10.48 | 8.47 | 5.86 | 3.77 | 1.93 | 1.88 | 1.02 |
| C44 (GPa) | 7.44 | 6.774 | 5.90 | 4.71 | 3.37 | 1.65 | 0.44 |
| B (GPa) | 17.07 | 15.33 | 12.57 | 10.23 | 8.47 | 7.04 | 5.99 |
| Y (GPa) | 21.42 | 20.43 | 18.39 | 15.72 | 13.08 | 9.08 | 7.20 |
| G (GPa) | 8.30 | 7.99 | 7.32 | 6.32 | 5.26 | 3.54 | 2.77 |
| B/G | 2.05 | 1.92 | 1.72 | 1.62 | 1.61 | 1.99 | 2.16 |
| γ | 1.71 | 1.64 | 1.53 | 1.47 | 1.46 | 1.68 | 1.77 |
| υ | 0.29 | 0.28 | 0.24 | 0.24 | 0.24 | 0.29 | 0.30 |
| νι (m s−1) | 2566.35 | 2506.26 | 2392.58 | 2250.58 | 2109.67 | 1889.26 | 1738.65 |
| νs (m s−1) | 1395.61 | 1389.78 | 1369.71 | 1309.64 | 1229.51 | 1036.18 | 929.82 |
| νm (m s−1) | 1556.91 | 1548.09 | 1521.75 | 1452.93 | 1363.85 | 1155.20 | 1038.39 |
| ΘD (K) | 125.8 | 123.8 | 119.4 | 111.8 | 103 | 85.6 | 76.3 |
The B/G ratio measures the brittleness and ductility of a material; a B/G ratio higher than 1.75 indicates a ductile material; otherwise, a brittle material.72 Tables 3 and 4 reveal that with the exception of tensile strains of 3%, 5%, and 7%, the B/G ratio for BiBaK under strain is higher than 1.75. All compressive strains produce a ductile material. The Cauchy pressure (C12 − C44) also determines the ductility/brittleness of a material; a positive Cauchy pressure indicates a ductile material; otherwise, brittle.73 Tables 3 and 4 show that the Cauchy pressure is positive under all tensile and compressive strains except the tensile strains of 3%, 5%, and 7%, which confirms the toughness and brittleness of the material at various tensile and compressive strains. The calculated Young's modulus measures the resistance of a material to uniaxial tension and also reflects its stiffness.74
If the Poisson's ratio is between 0.25 and 0.50, the interaction force between atoms is naturally central.74 Other than the 3%, 5%, and 7% tensile strains, the calculated Poisson's ratios are all between 0.25 and 0.50, reflecting a central interaction force between atoms. Tables 3 and 4 show that υ decreases as the tensile strain gradually increases up to 9%; under compressive strain, υ increases with increasing strain.
Based on the resulting Poisson ratios, we calculated the average Grüneisen parameters (γ) under various strains,75 as follows:
 | (12) |
γ gradually decreases as the tensile strain increases up to 9%; however, for compressive strains, γ increases with increasing strain (see Tables 3 and 4).
The Debye temperature (ΘD), an important parameter for calculating lattice thermal conductivity, is determined using the average sound velocity at all strains. The Debye temperature is defined as76
 | (13) |
3.4. Transport properties
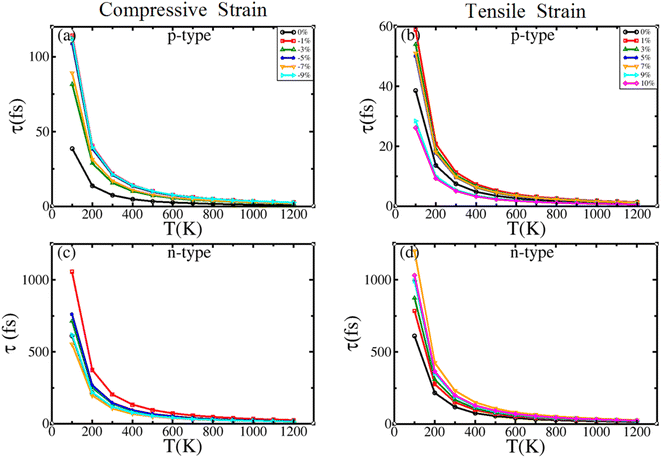
The relaxation time (τ) was calculated as a function of temperature for BiBaK under isotropic strain and is shown in Fig. 7, which reveals that under a compressive strain of up to −9% or tensile strain of up to 10%, τ decreases with increasing temperature for both n- and p-type semiconductors. Except for the n-type BiBaK under compressive strain, τ increases with increasing strain at all temperatures [Fig. 7(a), (b) and (d)]. Moreover, the τ of n-type BiBaK is considerably larger than that of p-type BiBaK at each compressive or tensile strain value because electrons move in a nearly empty band and holes move in a nearly filled band.
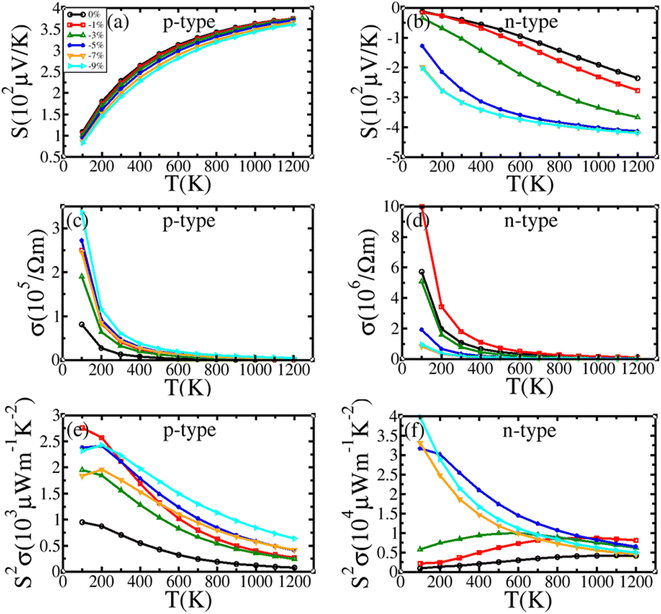 | ||
| Fig. 8 (a) and (b) Seebeck coefficient, (c) and (d) electrical conductivity, and (e) and (f) power factor of BiBaK under isotropic compressive strain. | ||
Fig. 8(a) and (b) show that with increasing compressive strain, the S of p-type BiBaK decreases, whereas the absolute value of S for n-type BiBaK increases. Fig. 9(a) and (b) show that with increasing tensile strain, S increases for p-type BiBaK but decreases when the temperature is higher than 800 K, whereas for n-type BiBaK under tensile strain, S does not change substantially at low temperature and decreases with increasing strain when T is higher than 400 K. These trends can be explained by the change in the effective mass. S can be expressed as78
 | (14) |
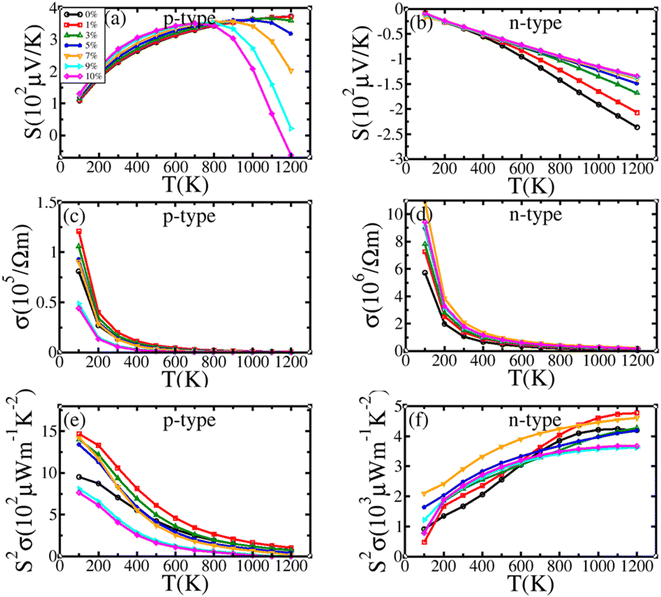 | ||
| Fig. 9 (a) and (b) Seebeck coefficient, (c) and (d) electrical conductivity, and (e) and (f) power factor of BiBaK under isotropic tensile strain. | ||
Fig. 8(c) and (d) show that with increasing compressive strain, σ for p-type BiBaK first increases up to −1% strain and then decreases up to −3% strain, before increasing again. In general, the values of σ for BiBaK under compressive strains are higher than those for unstrained BiBaK. For n-type BiBaK, σ first increases with increasing compressive strain up to −1%, before decreasing. Except for the value of σ when ε = −1%, σ for BiBaK under compressive strain is lower than that for the unstrained material.
Fig. 9(c) and (d) show that with increasing tensile strain, σ for p-type BiBaK first increases up to 1% strain and then decreases, whereas for n-type BiBaK, σ gradually increases with increasing compressive strain. The change in σ with applied strain can be explained by observing the trend of the bandgap under strain. Under compressive strain, the bandgap increases with increasing strain, which hinders electron transfer to the conduction band; therefore, σ decreases. In contrast, under tensile strain, the energy bandgap decreases and σ increases.
Moreover, for both p- and n-type BiBaK, σ decreases with increasing temperature over all strain values. This can be attributed to an increase in stream scattering at higher temperatures, ultimately reducing the carrier mobility (μ). The relationship between σ and  is defined as σ = neμ; therefore, when μ decreases, σ decreases.
Fig. 8(e) and (f) shows that the power factor (PF = S2σ) is enhanced in both p- and n-type materials. For p-type BiBaK, PF decreases with increasing temperature; for n-type BiBaK under compressive strain, when T is less than 800 K, the value of PF increases over 0–3% strain, whereas strain from −5% to −9% causes a decrease significantly greater than the increase under lower strains. The PF of BiBaK subjected to a tensile strain of up to 10% is presented in Fig. 9(e) and (f). For p-type BiBaK, PF first increases considerably at 1% strain before decreasing with an increase in tensile strain beyond 3%. In the case of n-type BiBaK, PF increases with increasing tensile strain when T is below 700 K; at higher temperatures, the PF value first increases at 1% strain and then decreases with increasing tensile strain.
3.4.3.1. Electronic thermal conductivity. Fig. 10 shows the electronic thermal conductivity κe as a function of temperature under different isotropic strains. According to the Wiedemann–Franz law,
| κe = LσT | (15) |
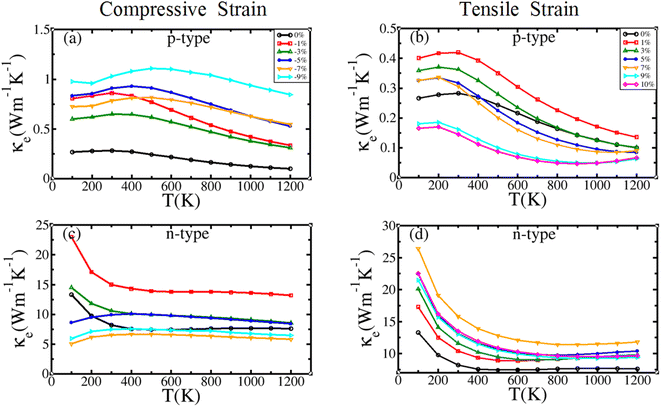 | ||
| Fig. 10 Temperature-dependent electronic thermal conductivity (κe) of BiBaK under (a) and (c) compressive and (b) and (d) tensile strains. | ||
3.4.3.2. Lattice thermal conductivity. Fig. 11 presents the temperature-dependent variation of κι for both compressive and tensile strains. Under different strains, the lattice thermal conductivity decreases with increasing temperature, owing to phonon scattering.
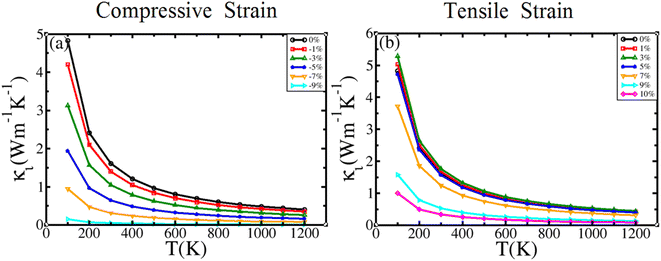 | ||
| Fig. 11 Temperature-dependent lattice thermal conductivity (κι) of BiBaK under (a) compressive and (b) tensile strains. | ||
When compressive strain is applied, κι decreases with increasing strain [Fig. 11(a)]. When tensile strain is applied, κι first increases up to 3% strain before decreasing between 3% and 10% strain [Fig. 11(b)]. The calculated values of κι for the unstrained BiBaK compound are 1.62 and 0.55 W m−1 K−1 at T = 300 and 900 K, respectively, in agreement with the values 1.82 and 0.6 W m−1 K−1, respectively, reported by Han et al.46 for the same temperatures.
3.4.3.3. Total thermal conductivity. The variation of thermal conductivity with temperature for both p- and n-type BiBaK under isotropic tensile and compressive strains is presented in Fig. 12, which shows that κ decreases with increasing temperature. This may be caused by an increase in carrier scattering at higher temperatures.
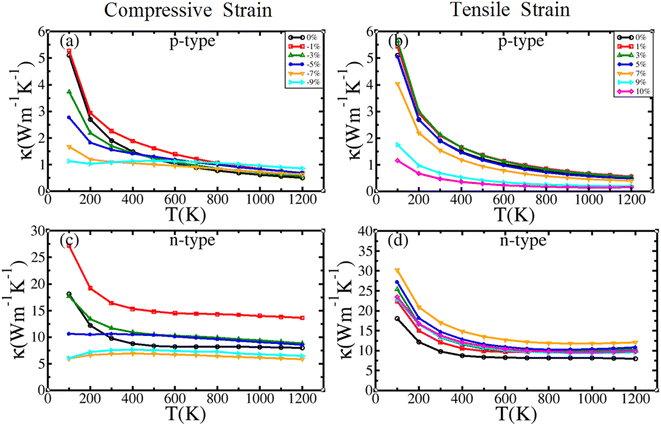 | ||
| Fig. 12 Temperature-dependent total thermal conductivity (κ) of BiBaK under (a) and (c) compressive and (b) and (d) tensile strains. | ||
For p-type BiBaK under compressive strain at T below 400 K [Fig. 12(a)], κ first increases up to −1% strain and then decreases gradually with strain increasing from −1% to −9%. However, when T is higher than 400 K, the thermal conductivity curve between −1% and −9% strain shows a slight zigzagged fluctuation that is higher than that without strain. For n-type BiBaK under compressive strain [Fig. 12(c)], κ first increases up to −1% strain and then decreases with an increase in strain from −1% to −9%, and it is greater than that for unstrained BiBaK except at −7% to −9% strain.
For tensile-strained p-type BiBaK [Fig. 12(b)], κ first increases up to 1% strain and then decreases with an increase in strain from 1% to 10%; κ remains lower than that in unstrained BiBaK except at 1% and 3% strains. For n-type BiBaK [Fig. 12(d)], κ increases with increasing tensile strain. In the range of 900–1200 K, κ increases gradually at low tensile strains.
![[thin space (1/6-em)]](https://www.rsc.org/images/entities/char_2009.gif) K.
K.
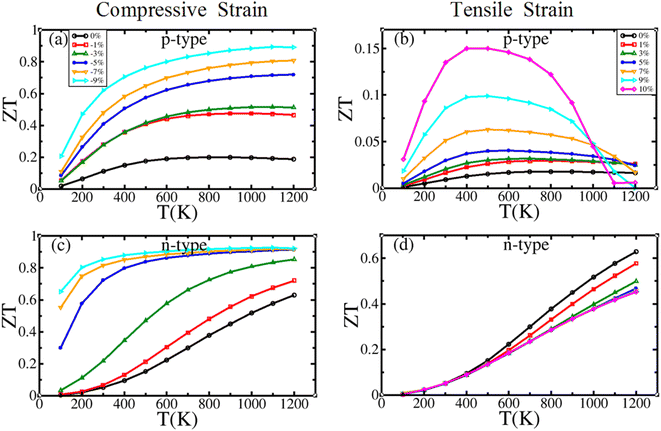 | ||
| Fig. 13 Temperature-dependent figure of merit (ZT) of BiBaK under (a) and (c) compressive and (b) and (d) tensile strains. | ||
The calculated transport parameters show that the ZT values of p- and n-type BiBaK improve significantly under the action of compressive strain. Therefore, compressive strain can be used for improving the thermoelectric performance of BiBaK compounds.
4. Conclusions
In this study, using density functional and semi-classical Boltzmann transport theories, we investigated the effects of isotropic tensile (up to 10%) and compressive (up to −9%) strains on the electronic structure and transport properties of the half-Heusler alloy BiBaK. The results indicate stable mechanical and thermodynamic properties for all strained and unstrained structures. Isotropic strain significantly alters the electronic structure, causing changes in the effective mass and bandgap. The bandgap increases with increasing compressive strain and decreases with increasing tensile strain. The Seebeck coefficient (S) is approximately proportional to m* under all strains, and the conductivity (σ) is inversely proportional to the Seebeck coefficient. Under compressive strain, the power factor (S2σ) increases for both p- and n-type BiBaK. Using Slack's equation, we calculated the lattice thermal conductivity (κι), which decreased with increasing strain for both compressive and tensile strains. The lattice thermal conductivity reached its minimum value under compressive strain, which can aid in improving the figure of merit (ZT). At T = 1200![[thin space (1/6-em)]](https://www.rsc.org/images/entities/char_2009.gif) K, the ZT value for n-type BiBaK reached a maximum of 0.93 under a compressive strain of −9%. Therefore, the transport properties of n-type BiBaK compounds can be effectively improved by adjusting the electronic structure of the material via the application of compressive strain.
K, the ZT value for n-type BiBaK reached a maximum of 0.93 under a compressive strain of −9%. Therefore, the transport properties of n-type BiBaK compounds can be effectively improved by adjusting the electronic structure of the material via the application of compressive strain.
Conflicts of interest
There are no conflicts to declare.Acknowledgements
This project was supported by the National Natural Science Foundation of China (Grant No. 11904081), Basic Research Program of Education Bureau of Henan Province (Grant No. 20A140007), and Research Initiation Fund of Henan Institute of Technology (Grant No. KQ1853). The calculations were supported by the High Performance Computing Center of Henan Normal University.References
- T. Kober, et al., Global energy perspectives to 2060 – WEC's World Energy Scenarios 2019, Energy Strategy Rev., 2020, 31, 100523 CrossRef.
- K. Kaygusuz, Energy for sustainable development: A case of developing countries, Renewable Sustainable Energy Rev., 2012, 16(2), 1116–1126 CrossRef.
- X. Chen, et al., Efficient C–N coupling in the direct synthesis of urea from CO2 and N2 by amorphous SbxBi1-xOy clusters, Proc. Natl. Acad. Sci. U. S. A., 2023, 120(39), e2306841120 CrossRef CAS PubMed.
- W. Li, et al., Enhanced cocatalyst-support interaction and promoted electron transfer of 3D porous g-C3N4/GO-M (Au, Pd, Pt) composite catalysts for hydrogen evolution, Appl. Catal., B, 2021, 288, 120034 CrossRef CAS.
- G. Liu, et al., Confining single-atom Pd on g-C3N4 with carbon vacancies towards enhanced photocatalytic NO conversion, Appl. Catal., B, 2021, 284, 119683 CrossRef CAS.
- C. Wang, et al., Ultralow Ru doping induced interface engineering in MOF derived ruthenium-cobalt oxide hollow nanobox for efficient water oxidation electrocatalysis, Chem. Eng. J., 2021, 420, 129805 CrossRef CAS.
- Q. Yu, Theoretical studies of non-noble metal single-atom catalyst Ni1/MoS2: Electronic structure and electrocatalytic CO2 reduction, Sci. China Mater., 2023, 66(3), 1079–1088 CrossRef CAS.
- H. Zhu, Y. Lu and L. Cai, Wavelength-shift-free racetrack resonator hybrided with phase change material for photonic in-memory computing, Opt. Express, 2023, 31(12), 18840–18850 CrossRef CAS PubMed.
- Y. Lu, et al., Mixed-Mode Operation of Hybrid Phase-Change Nanophotonic Circuits, Nano Lett., 2017, 17(1), 150–155 CrossRef CAS PubMed.
- S. Du, et al., Competition Pathways of Energy Relaxation of Hot Electrons through Coupling with Optical, Surface, and Acoustic Phonons, J. Phys. Chem. C, 2023, 127(4), 1929–1936 CrossRef CAS.
- B. Zhang, et al., Determination and assessment of a complete and self-consistent electron-neutral collision cross-section set for the C4F7N molecule, J. Phys. D: Appl. Phys., 2023, 56(13), 134001 CrossRef.
- J. Zhang, et al., Deep red PhOLED from dimeric salophen Platinum(II) complexes, Dyes Pigm., 2019, 162, 590–598 CrossRef CAS.
- P. Zhao, et al., Theoretical and experimental investigations on the phase stability and fabrication of high-entropy monoborides, J. Eur. Ceram. Soc., 2023, 43(6), 2320–2330 CrossRef CAS.
- C. Zhao, C. F. Cheung and P. Xu, High-efficiency sub-microscale uncertainty measurement method using pattern recognition, ISA Trans., 2020, 101, 503–514 CrossRef PubMed.
- L. Zhou, F. Meng and Y. Sun, Numerical study on infrared detectors cooling by multi-stage thermoelectric cooler combined with microchannel heat sink, Appl. Therm. Eng., 2024, 236, 121788 CrossRef CAS.
- F. Yu, et al., Molecular engineering of biomimetic donor-acceptor conjugated microporous polymers with full-spectrum response and an unusual electronic shuttle for enhanced uranium(VI) photoreduction, Chem. Eng. J., 2023, 466, 143285 CrossRef CAS.
- S. LeBlanc, Thermoelectric generators: Linking material properties and systems engineering for waste heat recovery applications, Sustainable Mater. Technol., 2014, 1–2, 26–35 CrossRef.
- G. Li, et al., Integrated microthermoelectric coolers with rapid response time and high device reliability, Nat. Electron., 2018, 1(10), 555–561 CrossRef CAS.
- J. Mao, et al., Advances in thermoelectrics, Adv. Phys., 2018, 67(2), 69–147 CrossRef.
- Z. Liu, et al., High thermoelectric performance of α-MgAgSb for power generation, Energy Environ. Sci., 2018, 11(1), 23–44 RSC.
- G. J. Snyder and E. S. Toberer, Complex thermoelectric materials, Nat. Mater., 2008, 7(2), 105–114 CrossRef CAS PubMed.
- S. Perumal, S. Roychowdhury and K. Biswas, Reduction of thermal conductivity through nanostructuring enhances the thermoelectric figure of merit in Ge1−xBixTe, Inorg. Chem. Front., 2016, 3(1), 125–132 RSC.
- J. Dong, et al., Reducing Lattice Thermal Conductivity of MnTe by Se Alloying toward High Thermoelectric Performance, ACS Appl. Mater. Interfaces, 2019, 11(31), 28221–28227 CrossRef CAS PubMed.
- H. Alam and S. Ramakrishna, A review on the enhancement of figure of merit from bulk to nano-thermoelectric materials, Nano Energy, 2013, 2(2), 190–212 CrossRef CAS.
- H. Kleinke, New bulk Materials for Thermoelectric Power Generation: Clathrates and Complex Antimonides, Chem. Mater., 2010, 22(3), 604–611 CrossRef CAS.
- Z.-Z. Luo, et al., Extraordinary role of Zn in enhancing thermoelectric performance of Ga-doped n-type PbTe, Energy Environ. Sci., 2022, 15(1), 368–375 RSC.
- Q. Zhang, et al., Enhancement of thermoelectric figure-of-merit by resonant states of aluminium doping in lead selenide, Energy Environ. Sci., 2012, 5(1), 5246–5251 RSC.
- J. P. Heremans, et al., Enhancement of Thermoelectric Efficiency in PbTe by Distortion of the Electronic Density of States, Science, 2008, 321(5888), 554–557 CrossRef CAS PubMed.
- C.-K. Dai, et al., Improving thermoelectric properties of ZrPtSn-based half-Heusler compound by Sb doping, Rare Met., 2021, 40(10), 2838–2846 CrossRef CAS.
- D. Guo, et al., Strain Effects To Optimize Thermoelectric Properties of Doped Bi2O2Se via Tran–Blaha Modified Becke–Johnson Density Functional Theory, J. Phys. Chem. C, 2013, 117(41), 21597–21602 CrossRef CAS.
- D. Zou, et al., Effect of strain on thermoelectric properties of SrTiO3: First-principles calculations, Chem. Phys. Lett., 2013, 586, 159–163 CrossRef CAS.
- H. Y. Lv, et al., Enhanced thermoelectric performance of phosphorene by strain-induced band convergence, Phys. Rev. B, 2014, 90(8), 085433 CrossRef CAS.
- H. Y. Lv, et al., Strain-induced enhancement in the thermoelectric performance of a ZrS2 monolayer, J. Mater. Chem. C, 2016, 4(20), 4538–4545 RSC.
- A. Yadav, et al., Strain effect on topological and thermoelectric properties of half Heusler compounds XPtS (X= Sr, Ba), J. Phys.: Condens. Matter, 2021, 33(34), 345701 CrossRef CAS PubMed.
- S. A. Khandy and J.-D. Chai, Strain engineering of electronic structure, phonon, and thermoelectric properties of p-type half-Heusler semiconductor, J. Alloys Compd., 2021, 850, 156615 CrossRef CAS.
- A. Saini, et al., Unraveling the effect of isotropic strain on the transport properties of half-Heusler alloy LiScGe, J. Alloys Compd., 2021, 859, 158232 CrossRef CAS.
- L. Kong and G. Liu, Synchrotron-based infrared microspectroscopy under high pressure: An introduction, Matter Radiat. Extremes, 2021, 6(6), 068202 CrossRef CAS.
- L. Zhu, Z. Li and K. Hou, Effect of radical scavenger on electrical tree in cross-linked polyethylene with large harmonic superimposed DC voltage, High Voltage, 2023, 8(4), 739–748 CrossRef.
- R. J. Quinn and J.-W. G. Bos, Advances in half-Heusler alloys for thermoelectric power generation, Mater. Adv., 2021, 2(19), 6246–6266 RSC.
- C. Fu, et al., Band engineering of high performance p-type FeNbSb based half-Heusler thermoelectric materials for figure of merit zT > 1, Energy Environ. Sci., 2015, 8(1), 216–220 RSC.
- H.-L. Sun, et al., Remarkably High Thermoelectric Efficiencies of the Half-Heusler Compounds BXGa (X = Be, Mg, and Ca), ACS Appl. Mater. Interfaces, 2020, 12(5), 5838–5846 CrossRef CAS PubMed.
- H. Zhu, et al., Discovery of TaFeSb-based half-Heuslers with high thermoelectric performance, Nat. Commun., 2019, 10(1), 270 CrossRef PubMed.
- T. Fang, et al., Computational prediction of high thermoelectric performance in p-type half-Heusler compounds with low band effective mass, Phys. Chem. Chem. Phys., 2017, 19(6), 4411–4417 RSC.
- J. Shen, et al., Enhancing thermoelectric performance of FeNbSb half-Heusler compound by Hf-Ti dual-doping, Energy Storage Mater., 2018, 10, 69–74 CrossRef.
- Z. Feng, et al., Characterization of rattling in relation to thermal conductivity: Ordered half-Heusler semiconductors, Phys. Rev. B, 2020, 101(6), 064301 CrossRef CAS.
- S. H. Han, et al., High thermoelectric performance of half-Heusler compound BiBaK with intrinsically low lattice thermal conductivity, J. Phys.: Condens. Matter, 2020, 32(42), 425704 CrossRef CAS PubMed.
- P. Blaha, et al., Full-potential, linearized augmented plane wave programs for crystalline systems, Comput. Phys. Commun., 1990, 59(2), 399–415 CrossRef CAS.
- P. Blaha, K. Schwarz, G. K. H. Madsen, D. Kvasnicka and J. Luitz, WIEN2k: An Augmented Plane Wave Plus Local Orbitals Program for Calculating Crystal Properties, Vienna University of Technology, 2001 Search PubMed.
- J. P. Perdew, K. Burke and M. Ernzerhof, Generalized Gradient Approximation Made Simple, Phys. Rev. Lett., 1996, 77(18), 3865–3868 CrossRef CAS PubMed.
- F. Tran and P. Blaha, Accurate Band Gaps of Semiconductors and Insulators with a Semilocal Exchange-Correlation Potential, Phys. Rev. Lett., 2009, 102(22), 226401 CrossRef PubMed.
- L. Zhang and D. J. Singh, Electronic structure and thermoelectric properties of layered {PbSe-WSe2 materials, Phys. Rev. B, 2009, 80(7), 075117 CrossRef.
- D. J. Singh, Doping-dependent thermopower of PbTe from Boltzmann transport calculations, Phys. Rev. B, 2010, 81(19), 195217 CrossRef.
- G. Kresse and J. Hafner, Ab initio molecular dynamics for open-shell transition metals, Phys. Rev. B, 1993, 48(17), 13115–13118 CrossRef CAS PubMed.
- G. Kresse and J. Furthmüller, Efficient iterative schemes for ab initio total-energy calculations using a plane-wave basis set, Phys. Rev. B, 1996, 54(16), 11169–11186 CrossRef CAS PubMed.
- G. Kresse and J. Hafner, Ab initio molecular dynamics for liquid metals, Phys. Rev. B, 1993, 47(1), 558–561 CrossRef CAS PubMed.
- B. Zhang, et al., Ab initio molecular dynamics calculations on electron ionization induced fragmentations of C4F7N and C5F10O for understanding their decompositions under discharge conditions, Phys. Chem. Chem. Phys., 2023, 25(10), 7540–7549 RSC.
- N. F. Hinsche, I. Mertig and P. Zahn, Effect of strain on the thermoelectric properties of silicon: an ab initio study, J. Phys.: Condens. Matter, 2011, 23(29), 295502 CrossRef CAS PubMed.
- D. Parker and D. J. Singh, High-temperature thermoelectric performance of heavily doped PbSe, Phys. Rev. B, 2010, 82(3), 035204 CrossRef.
- A. F. May, D. J. Singh and G. J. Snyder, Influence of band structure on the large thermoelectric performance of lanthanum telluride, Phys. Rev. B, 2009, 79(15), 153101 CrossRef.
- J. Bardeen and W. Shockley, Deformation Potentials and Mobilities in Non-Polar Crystals, Phys. Rev., 1950, 80(1), 72–80 CrossRef CAS.
- J. Xi, et al., First-principles prediction of charge mobility in carbon and organic nanomaterials, Nanoscale, 2012, 4(15), 4348–4369 RSC.
- D. T. Morelli and G. A. Slack, High Lattice Thermal Conductivity Solids, in High Thermal Conductivity Materials, ed. S. L. Shindé and J. S. Goela, Springer New York, New York, NY, 2006, pp. 37–68 Search PubMed.
- J. Callaway, Model for Lattice Thermal Conductivity at Low Temperatures, Phys. Rev., 1959, 113(4), 1046–1051 CrossRef CAS.
- Y. Gupta, M. M. Sinha and S. S. Verma, Theoretical study of thermo-dynamical and thermoelectric properties of novel half-Heusler alloys AlNiAs and AlNiSb, Mater. Today Commun., 2021, 27, 102195 CrossRef CAS.
- J. Ma, et al., Computational investigation of half-Heusler compounds for spintronics applications, Phys. Rev. B, 2017, 95(2), 024411 CrossRef.
- T. Graf, C. Felser and S. S. P. Parkin, Simple rules for the understanding of Heusler compounds, Prog. Solid State Chem., 2011, 39(1), 1–50 CrossRef CAS.
- J. Wei, Y. Guo and G. Wang, Exploring structural, mechanical, and thermoelectric properties of half-Heusler compounds RhBiX (X = Ti, Zr, Hf): A first-principles investigation, RSC Adv., 2023, 13(17), 11513–11524 RSC.
- Z. F. Meghoufel, et al., Ab-initio investigation on the electronic and thermoelectric properties of new half-Heusler compounds KBiX (X = Ba and Sr), J. Phys.: Condens. Matter, 2021, 33(39), 395701 CrossRef CAS PubMed.
- S. Guo, T. Jia and Y. Zhang, Electrical Property Dominated Promising Half-Heusler Thermoelectrics through High-Throughput Material Computations, J. Phys. Chem. C, 2019, 123(31), 18824–18833 CrossRef CAS.
- M. Born, K. Huang and M. Lax, Dynamical Theory of Crystal Lattices, Am. J. Phys., 1955, 23(7), 474 CrossRef.
- Z.-j. Wu, et al., Crystal structures and elastic properties of superhard IrN2 and IrN3 from first principles, Phys. Rev. B, 2007, 76(5), 054115 CrossRef.
- S. F. Pugh, XCII. Relations between the elastic moduli and the plastic properties of polycrystalline pure metals, Lond. Edinb. Dublin philos. mag. j. sci., 1954, 45(367), 823–843 CrossRef CAS.
- D. G. Pettifor, Theoretical predictions of structure and related properties of intermetallics, Mater. Sci. Technol., 1992, 8(4), 345–349 CrossRef CAS.
- D. Chattaraj, C. Majumder and S. Dash, Structural, electronic, elastic and thermodynamic properties of Zr2Fe and Zr2FeH5: A comprehensive study using first principles approach, J. Alloys Compd., 2014, 615, 234–242 CrossRef CAS.
- K. Kaur and R. Kumar, High temperature thermoelectric performance of p-type TaRhSn half Heusler compound: A computational assessment, Ceram. Int., 2017, 43(17), 15160–15166 CrossRef CAS.
- P. Wachter, M. Filzmoser and J. Rebizant, Electronic and elastic properties of the light actinide tellurides, Phys. B, 2001, 293(3), 199–223 CrossRef CAS.
- Y. Cai, G. Zhang and Y.-W. Zhang, Polarity-Reversed Robust Carrier Mobility in Monolayer MoS2 Nanoribbons, J. Am. Chem. Soc., 2014, 136(17), 6269–6275 CrossRef CAS PubMed.
- M. Cutler, J. F. Leavy and R. L. Fitzpatrick, Electronic Transport in Semimetallic Cerium Sulfide, Phys. Rev., 1964, 133(4A), A1143–A1152 CrossRef.
- Nisha, H. S. Saini, S. Srivastava and M. K. Kashyap, et al., Enhanced figure of merit of TaIrGe Half-Heusler alloy for thermoelectric applications under the effect of isotropic strain, J. Solid State Chem., 2021, 303, 122524 CrossRef CAS.
- K. Kaur, R. Kumar and D. P. Rai, A promising thermoelectric response of HfRhSb half Heusler compound at high temperature: A first principle study, J. Alloys Compd., 2018, 763, 1018–1023 CrossRef CAS.
| This journal is © The Royal Society of Chemistry 2024 |

