
 Open Access Article
 This Open Access Article is licensed under a Creative Commons Attribution-Non Commercial 3.0 Unported Licence
New adsorbent materials based on PILs for Freon refrigerants
Mingyuan Xinab,
Qiang Wang *a,
Qiang Wanga,
Haoyu Wangb,
Furqan Muhammada and
Guanze Niea
*a,
Qiang Wanga,
Haoyu Wangb,
Furqan Muhammada and
Guanze Niea
aKey Laboratory of Coal Cleaning Conversion and Chemical Engineering Process, Xinjiang Uyghur Autonomous Region, College of Chemical Engineering, Xinjiang University, Urumqi, Xinjiang 830017, PR China. E-mail: wangqiang@xju.edu.cn
bDandong Chemical Engineering Institute Co., LTD., Dandong, Liaoning, China
First published on 2nd January 2024
Abstract
The development of refrigerant adsorbent materials is not only essential for enhancing the efficiency of refrigeration systems but also plays a pivotal role in environmental conservation and addressing global warming challenges. However, traditional adsorbent materials are often limited in widespread applications in industrial scales due to various disadvantages, such as low adsorption efficiency, difficulties in desorption, and poor reusability. In this context, three distinct PILs, P[EVIM][PF6], P[BVIM][PF6] and P[HVIM][PF6], were synthesized and characterized. In addition, their structure as well as adsorption capacities towards three different Freon refrigerants (R12, R22 and R134a) were explored. The results indicated that the synthesized PILs had high thermal stability and exceptional adsorption capabilities, with P[EVIM][PF6] demonstrating the best adsorption performance. These PILs consistently maintain a stable saturated adsorption capacity throughout nine consecutive adsorption–desorption cycles, and the desorption rate of the adsorbent tubes consistently exceeded 96%. Thus, the superior recyclability of these PILs was verified. These PILs provide a promising route for efficient adsorption of Freon refrigerants, highlighting their potential significance in pertinent industries and environmental conservation efforts.
1 Introduction
Global warming is a pressing environmental issue, primarily attributable to greenhouse gas emissions. Various industries are seeking methods to reduce carbon emissions in response to this challenge. Particularly in the refrigeration industry, recycling and regenerating refrigerants for reuse not only aids in addressing the pressure of greenhouse gas emission reductions, but also effectively alleviates the demand pressure for refrigerants. The Montreal Protocol, a global accord on environmental matters, was designed to safeguard the ozone layer by gradually eliminating substances that reduce it.1 This protocol underscores the importance of refrigerant recycling and reuse to manage these compounds properly, reducing environmental pollution and resource wastage.2 In implementing the Montreal Protocol, many countries have adopted a series of innovative strategies and technologies to promote the recycling, reuse and regeneration of refrigerants. These strategies include establishing recycling systems, enhancing recovery efficiency, and developing alternative refrigerants that have less impact on the ozone layer and climate. Through these efforts, the international community is advancing towards a more sustainable and environmentally friendly refrigeration industry for long-term environmental conservation and global climate stability.3,4Against this broad backdrop, the recovery of chloro-fluorocarbon refrigerants from discarded equipment has become an important research direction in environmental protection. In adsorption separation, ionic liquids (ILs) provide a new solution for green chemical processes. Lee et al.5 prepared an ionic liquid based on 1-hexyl-3-methylimidazolium (HMIM) and evaluated its performance in selectively absorbing refrigerants R134a and R1234yf. It was found that this material had superior refrigerant absorption performance for R134a compared to R1234yf, suggesting the possibility of selective separation using ionic liquids. Nevertheless, in the practical application of ILs, researchers have found that additional steps may be required to separate the target product from the ILs when ILs exist in a liquid state. Meanwhile, the difficulty in shaping ILs adversely affects the efficiency of gas adsorption. These issues limit the effectiveness of these materials in practical applications.
Fortunately, scholars discovered a significant increase in adsorption capacity when the ionic liquid was transformed into a PIL compared to the ILs.6
Polymeric ionic liquids (PILs) are new materials developed on the basis of ILs. Similar to ionic liquids (ILs), polymeric ionic liquids (PILs) not only exhibit superior surface properties but also demonstrate significant thermal stability, chemical stability, and radiolytic stability.7–11 These characteristics endow PILs with tremendous potential in a variety of application fields, particularly in environments with high temperatures, harsh chemical reactions, and radiation exposure.12,13 Compared to ILs (existing in liquid or molten states at low temperatures), PILs usually exist in solid states,14 with a small amount in-gel states. Like ILs, PILs possess favorable surface properties.11,12 Additionally, PILs exhibit specific characteristics of polymers (e.g., excellent mechanical stability).15 These properties may make some PILs competitive candidates for the best refrigerant adsorbents. PILs have be extensively applied to gas adsorption separation, especially in the capture and utilization of carbon dioxide and carbon monoxide.16–18 Nevertheless, the researches on the use of ionic liquids in adsorptive separation of refrigerants are still relatively limited.
Therefore, this study aims to prepare a novel refrigerant adsorbent material based on PILs. In this study, three types of linear vinylimidazolium class polyionic liquids, including P[EVIM][PF6], P[BVIM][PF6], and P[HVIM][PF6], were synthesized, using the polymerization of 1-vinyl-3-alkylimidazolium hexafluoro-phosphate ([CnVIM][PF6], n = 2, 4, 6, 8) ILs double bonds, through the free radical polymerization method. The adsorption and desorption properties of the three types of PolyIonic Liquids (PILs) materials were evaluated under three Freon refrigerants R22, R134a, and R12. Concurrently, the adsorption heat and desorption activation energy of the three gases on the three PILs materials were determined in a scholarly and professional manner according to Inverse Gas Chromatography (IGC) and intrinsic kinetic methods. The adsorption and desorption effects, reusability of the three PILs materials adsorption tubes and activated carbon adsorption tubes for the three refrigerants were evaluated experimentally. The in-depth study and optimization of PIL provide a more effective solution for the recovery of refrigerants from waste equipment.
2 Experiment
2.1 Materials
IL monomers included 1-ethyl-3-vinylimidazolium hexa-fluorophosphate ([EVIM][PF6]), 1-butyl-3-vinylimidazolium hexa-fluorophosphate ([BVIM][PF6]) and 1-hexyl-3-vinylimidazolium hexafluorophosphate ([HVIM][PF6]). The IL monomers with a mass fraction of more than 0.99 were purchased from Chengjie Chemical Co. Ltd, China. In the free-radical polymerization, the initiator and solvent used were 2,2′-azobis (isobutyronitrile) (AIBN) and N,N-dimethyl-formamide (DMF) respectively. Ethanol was used as a solvent for precipitation. This study used Freon refrigerant gases purchased from DuPont Trading Co. Ltd, including dichloro-difluoromethane (R12), chlorodifluoromethane (R22), and 1,1,1,2-tetrafluoromethane (R134a). All of which had mass fractions exceeding 0.99. All the solvents and probes utilized for the test were of high purity and obtained from J&K Scientific without further purification.2.2 Preparation and characterization of PILs
The essential PILs were produced via free radical polymerization process of equivalent monomers, as shown in Fig. 1. The “R” substituent represents an alkyl chain attached to the imidazole ring. The value of “n” indicates the number of carbon atoms in the alkyl chain, reflecting the length of the side chain. Specifically, when n equals 2, “R” denotes an ethyl group. “X*” signifies the average degree of polymerization of the polymer chain. The asterisk (*) indicates that this value represents an average. | ||
| Fig. 1 The polymerization process for corresponding IL monomers. | ||
For instance, the preparation of P[EVIM][PF6] involved sequential additions of the ionic liquid monomer, azobisisobu-tyronitrile (around 1% of the monomer weight) and N,N-dimethylformamide to a round-bottom flask, which was stirred at ambient temperature for thorough mixing. The mixture was heated to 343.15 K in an oil bath with N2 safeguarding and magnetically stirred continuously for a reaction duration of 24 hours. After the reaction, the compound was transferred to a beaker, and a sufficient volume of ethanol was introduced to induce polymer precipitation. Prior to precipitation, the residue was rigorously rinsed by ethanol to eliminate the instigator and unprocessed ILs monomer. The resulting dense solid was then dried in a vacuum oven and kept at 343.15 K for 24 hours. Once dried, the substance was crushed in a mortar and pestle. It was rinsed three times with ethanol before drying again.
In order to characterize the prepared PILs, several analytical techniques were employed: Fourier transform infrared spectrometer was used to analyze the infrared spectra of compounds to reveal their structures and functional groups. Considering the type of adsorbate, temperature, pressure, and other operational conditions, the specific surface area and pore size distribution of the samples were measured by using a BSD-PM1 high-performance surface area and micropore analyzer. Molecular weight analysis was performed with the help of a GPC-LS Gel Permeation Chromatograph under specific conditions such as solvent type, flow rate, and column type. MacroMR12-150H-I Nuclear Magnetic Resonance spectrometer was utilized to determine the structure of PILs by measuring the magnetic resonance frequencies of their atomic nuclei.
In this study, Thermogravimetric Analysis (TGA) was conducted on three different PILs to assess their thermal stability under a helium atmosphere. Equipped with platinum crucibles, the experiments were performed by using a TA Instruments Q50 thermogravimetric analyzer. Approximately 8 mg of the PILs sample was loaded into the crucible for each experiment. These experiments were carried out in a helium atmosphere, with a gas flow rate of 40 mL min−1 and a heating rate set at 10 K min−1. The temperature range for the experiments extended from 303.15 K to 973.15 K.19,20
2.3 IGC experimental method
Unlike conventional chromatographic techniques, Inverse Gas Chromatography (IGC) uses the material to be tested as a stationary phase. It employs a series of organic solvents with known properties as probe molecules. The retention time of the probe molecules can be measured at different temperatures and carrier gas flow rates to further calculate the thermodynamic parameters of the material to be tested.21,22 IGC is capable of conducting quantitative analyses because of high sensitivity and rapid analytical capability. Hence, IGC offers significant advantages in detecting and investigating material adsorption properties.23,24 Fig. 2 shows a schematic diagram of the process for characterizing PILs based on IGC technology in this work. | ||
| Fig. 2 Schematic diagram of the process for characterizing PILs based on IGC technology. | ||
The IGC experiment utilized a QP-2010 Gas Chromatograph equipped with a Flame Ionization Detector (FID). It was operated with a high-purity nitrogen gas flow rate of 30 mL min−1. During the experiment, the injector and detector temperatures were maintained at 553.15 K, and the testing temperature was between 303.15 K and 343.15 K. The stationary phase was dried at 363.15 K until it achieved a constant mass and subsequently packed into a stainless-steel chromatographic column. The stationary phase consisted of 25–30% of the sample, with an analytical mass between 0.65 and 0.71 g. The packed column was aged at 363.15 K for 24 hours before testing. Each test was performed three times to ensure repeatability, and the calculation values were averaged.
This mass was dried at 363.15 K until its weight stabilized. Before undergoing testing, the now-filled column was aged at the same temperature at 363.15 K for 24 hours.
2.4 Preparation of the chromatographic packed column
Before measurement, all samples were vacuum-treated for 48 hours to minimize moisture and volatile compounds. Afterwards, they were dissolved in acetonitrile, loaded onto 102 monomer carriers, and dried at 363.15 K. Around 200 mg of PILs material was packed into a stainless-steel tube and purged at 523.15 K under nitrogen to remove impurities. After sealing the tube, the stationary phase was loaded into the chromatographic column using a vacuum pump. The mass of PILs was determined based on the change in the column's mass. This preparation is vital to the accuracy of subsequent chromatographic analyses.2.5 Adsorption heat and measurement
Adsorption heat, denoted as ΔH, is crucial in understanding the interaction between gas molecules and solid materials. It quantifies the energy change during the adsorption process and provides insights into the nature of the interaction, whether it is physisorption or chemisorption. Accurate measurement of adsorption heat is pivotal for evaluating the efficiency and feasibility of adsorption processes in various applications, including separation and storage of gas.The restriction of interaction between gas molecules and the packed solid material in a column was confined to surface interactions as the gas flows through. By measuring the retention time of gas molecules passing through the packed column at different temperatures,25 the heat of saturated adsorption (ΔH) between the gas molecules and the material under test could be determined using eqn (1).
 | (1) |
The mass of the packing material, represented as m(g) in the equation, works with the ideal gas constant R, column temperature T, and retention times t1 and t2 for the gas molecule and reference gas. C is constant, and Fj indicates the corrected flow rate. Fj can be calculated through eqn (2).
 | (2) |
 | (3) |
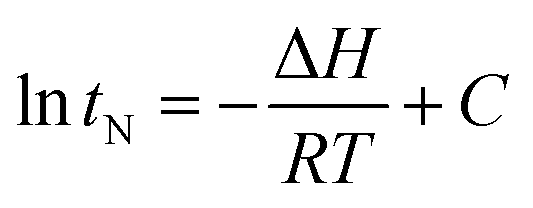
By conducting experiments at different temperatures, we could establish the net retention time under different experimental conditions. When ln![[thin space (1/6-em)]](https://www.rsc.org/images/entities/char_2009.gif) tN was graphed in relation to 1/T, the slope of the resulting fitted line allows for the calculation of ΔH.26
tN was graphed in relation to 1/T, the slope of the resulting fitted line allows for the calculation of ΔH.26
2.6 Desorption activation energy and measurement methods
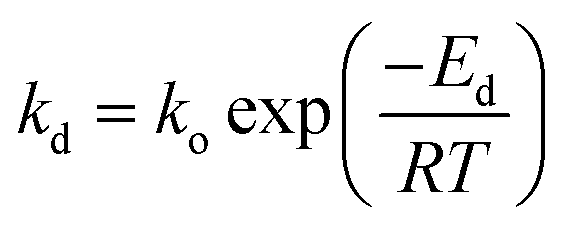
The TPD technique was grounded on the intrinsic kinetic model, and the desorption rate of the adsorbate typically adhered to the following kinetic eqn (4) and (5).27,28
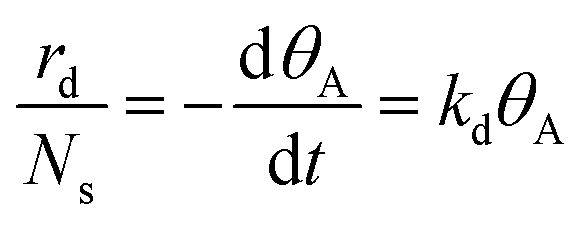 | (4) |
 | (5) |
During the temperature ramping process, with a specific heating rate βH, the relationship between temperature T and time is as follows:
| T = To + βHt | (6) |
As the temperature increased, the desorption rate increases. When the temperature reached a specific point Tp, the desorption rate attained its maximum value. The relationship can be expressed as follows:
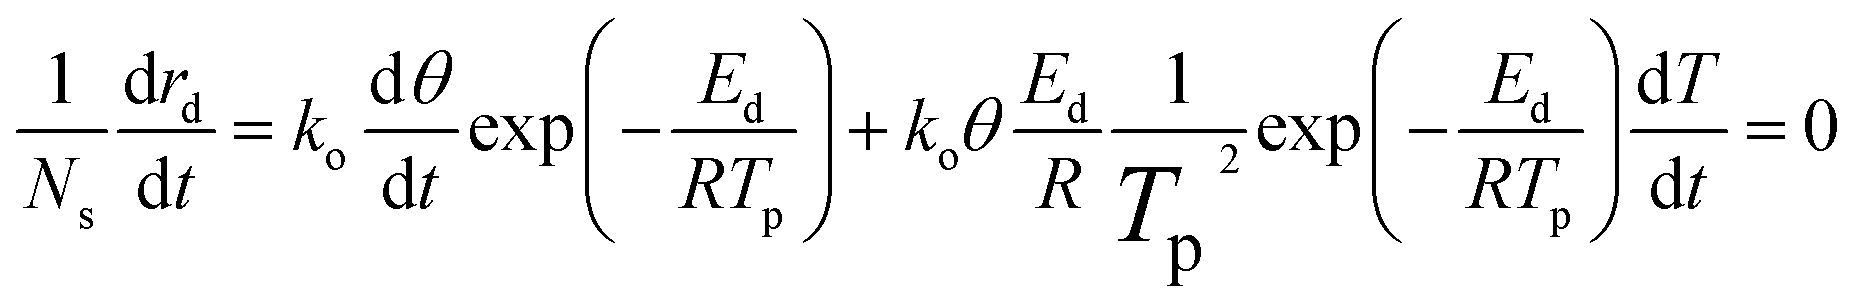 | (7) |
After rearrangement and taking the logarithm, we obtain:
 | (8) |
This equation identifies rd (mol min−1) as the rate of desorption, Ns (mol cm−2) denotes the maximum capacity of adsorption for the adsorbate on a singular adsorption surface, βH (K min−1) is the heating rate, and Ed (kJ mol−1) is the desorption activation energy. k0 is the pre-exponential factor for the desorption rate, kd indicates the desorption rate constant, and θ represents the coverage of the component on the unit adsorbent surface. Different temperature-programmed desorption (TPD) curves and Tp values can be obtained under different heating rate conditions. The value of Ed could be assessed by graphing ln(βH/RTp2) in relation to 1/RTp and analyzing the slope of the resulting line.
Specific experiments to measure the desorption activation energy were performed as follows:29 the gas to be tested was first injected into the chromatographic column containing the aforementioned PILs materials until the saturated adsorption was reached. Subsequently, nitrogen was used to purge any remaining gases at a flow rate of 30 mL min−1. The chromatography was then set with an initial temperature of 303.15 K and subjected to heating rates of 4, 5, 6, 8, and 10 K min−1, up to a terminal temperature of 453.15 K. The experimenter calibrated the rotameter. The rotameter was calibrated with nitrogen as the carrier gas at a rate of 20 mL min−1. Multiple iterations were performed to obtain desorption isotherms, and the average value derived from three separate trials was employed to calculate the desorption activation energy (Ed).
2.7 Adsorption tube evaluation method
The performance of PILs material tubes in adsorbing R12, R22, and R134a was evaluated based on their adsorption capacity at different temperatures, linear range at room temperature, desorption rate, repeatability, and practicality.
 | (9) |
3 Results and discussion
This section describes how to evaluate the performance of adsorption tubes filled with PILs material, focusing on methods to calculate desorption rates, analyze repeatability and assess overall practicality.3.1 Synthesis results and characterization analysis of PILs
Three types of PILs were synthesized in the experiment, i.e., P[EVIM][PF6], P[BVIM][PF6], and P[HVIM][PF6], with yields of approximately 73%, 64% and 83% respectively. P[OVIM][PF6] could not polymerize under similar conditions, possibly due to steric hindrance from the octyl group, making linking vinyl double bonds difficult.Based on an analysis conducted in a wavelength range of 4000–400 cm−1, Fig. 3(a)–(c) presents the infrared characterization results. It portrays the stretching vibration peak of the vinyl C![[double bond, length as m-dash]](https://www.rsc.org/images/entities/char_e001.gif) C bond at 1660 cm−1, and the bending vibration peak of the vinyl C–H bond at 961.88 cm−1, both of which almost disappear. This reveals the polymerization of double bonds in IL monomers.30 The chemical shifts of different protons in PILs and ILs monomers are depicted in Fig. 3(d)–(f). For example, in 1H NMR of P[EVIM][PF6] and [EVIM][PF6], the disappearance of corresponding peaks indicates that the double bonds in the IL monomers have polymerized. As illustrated in Fig. 3(d)–(f), taking the 1H NMR of P[EVIM][PF6] and [EVIM][PF6] as examples, the protons at 9.42–8.71 (br, 1H), 7.96–6.98 (br, 2H), 4.34–3.95 (s, 2H), and 1.68–1.08 (s, 3H) represent the protons in the structural unit of P[EVIM][PF6]. The protons corresponding to the vinyl group in [EVIM][PF6] include 7.00–6.87 (dd, 1H), 5.75–5.62 (dd, 1H), and 5.35–5.26 (dd, 1H). The disappearance of these corresponding peaks demonstrates the polymerization of the double bond in the ILs monomer.
C bond at 1660 cm−1, and the bending vibration peak of the vinyl C–H bond at 961.88 cm−1, both of which almost disappear. This reveals the polymerization of double bonds in IL monomers.30 The chemical shifts of different protons in PILs and ILs monomers are depicted in Fig. 3(d)–(f). For example, in 1H NMR of P[EVIM][PF6] and [EVIM][PF6], the disappearance of corresponding peaks indicates that the double bonds in the IL monomers have polymerized. As illustrated in Fig. 3(d)–(f), taking the 1H NMR of P[EVIM][PF6] and [EVIM][PF6] as examples, the protons at 9.42–8.71 (br, 1H), 7.96–6.98 (br, 2H), 4.34–3.95 (s, 2H), and 1.68–1.08 (s, 3H) represent the protons in the structural unit of P[EVIM][PF6]. The protons corresponding to the vinyl group in [EVIM][PF6] include 7.00–6.87 (dd, 1H), 5.75–5.62 (dd, 1H), and 5.35–5.26 (dd, 1H). The disappearance of these corresponding peaks demonstrates the polymerization of the double bond in the ILs monomer.
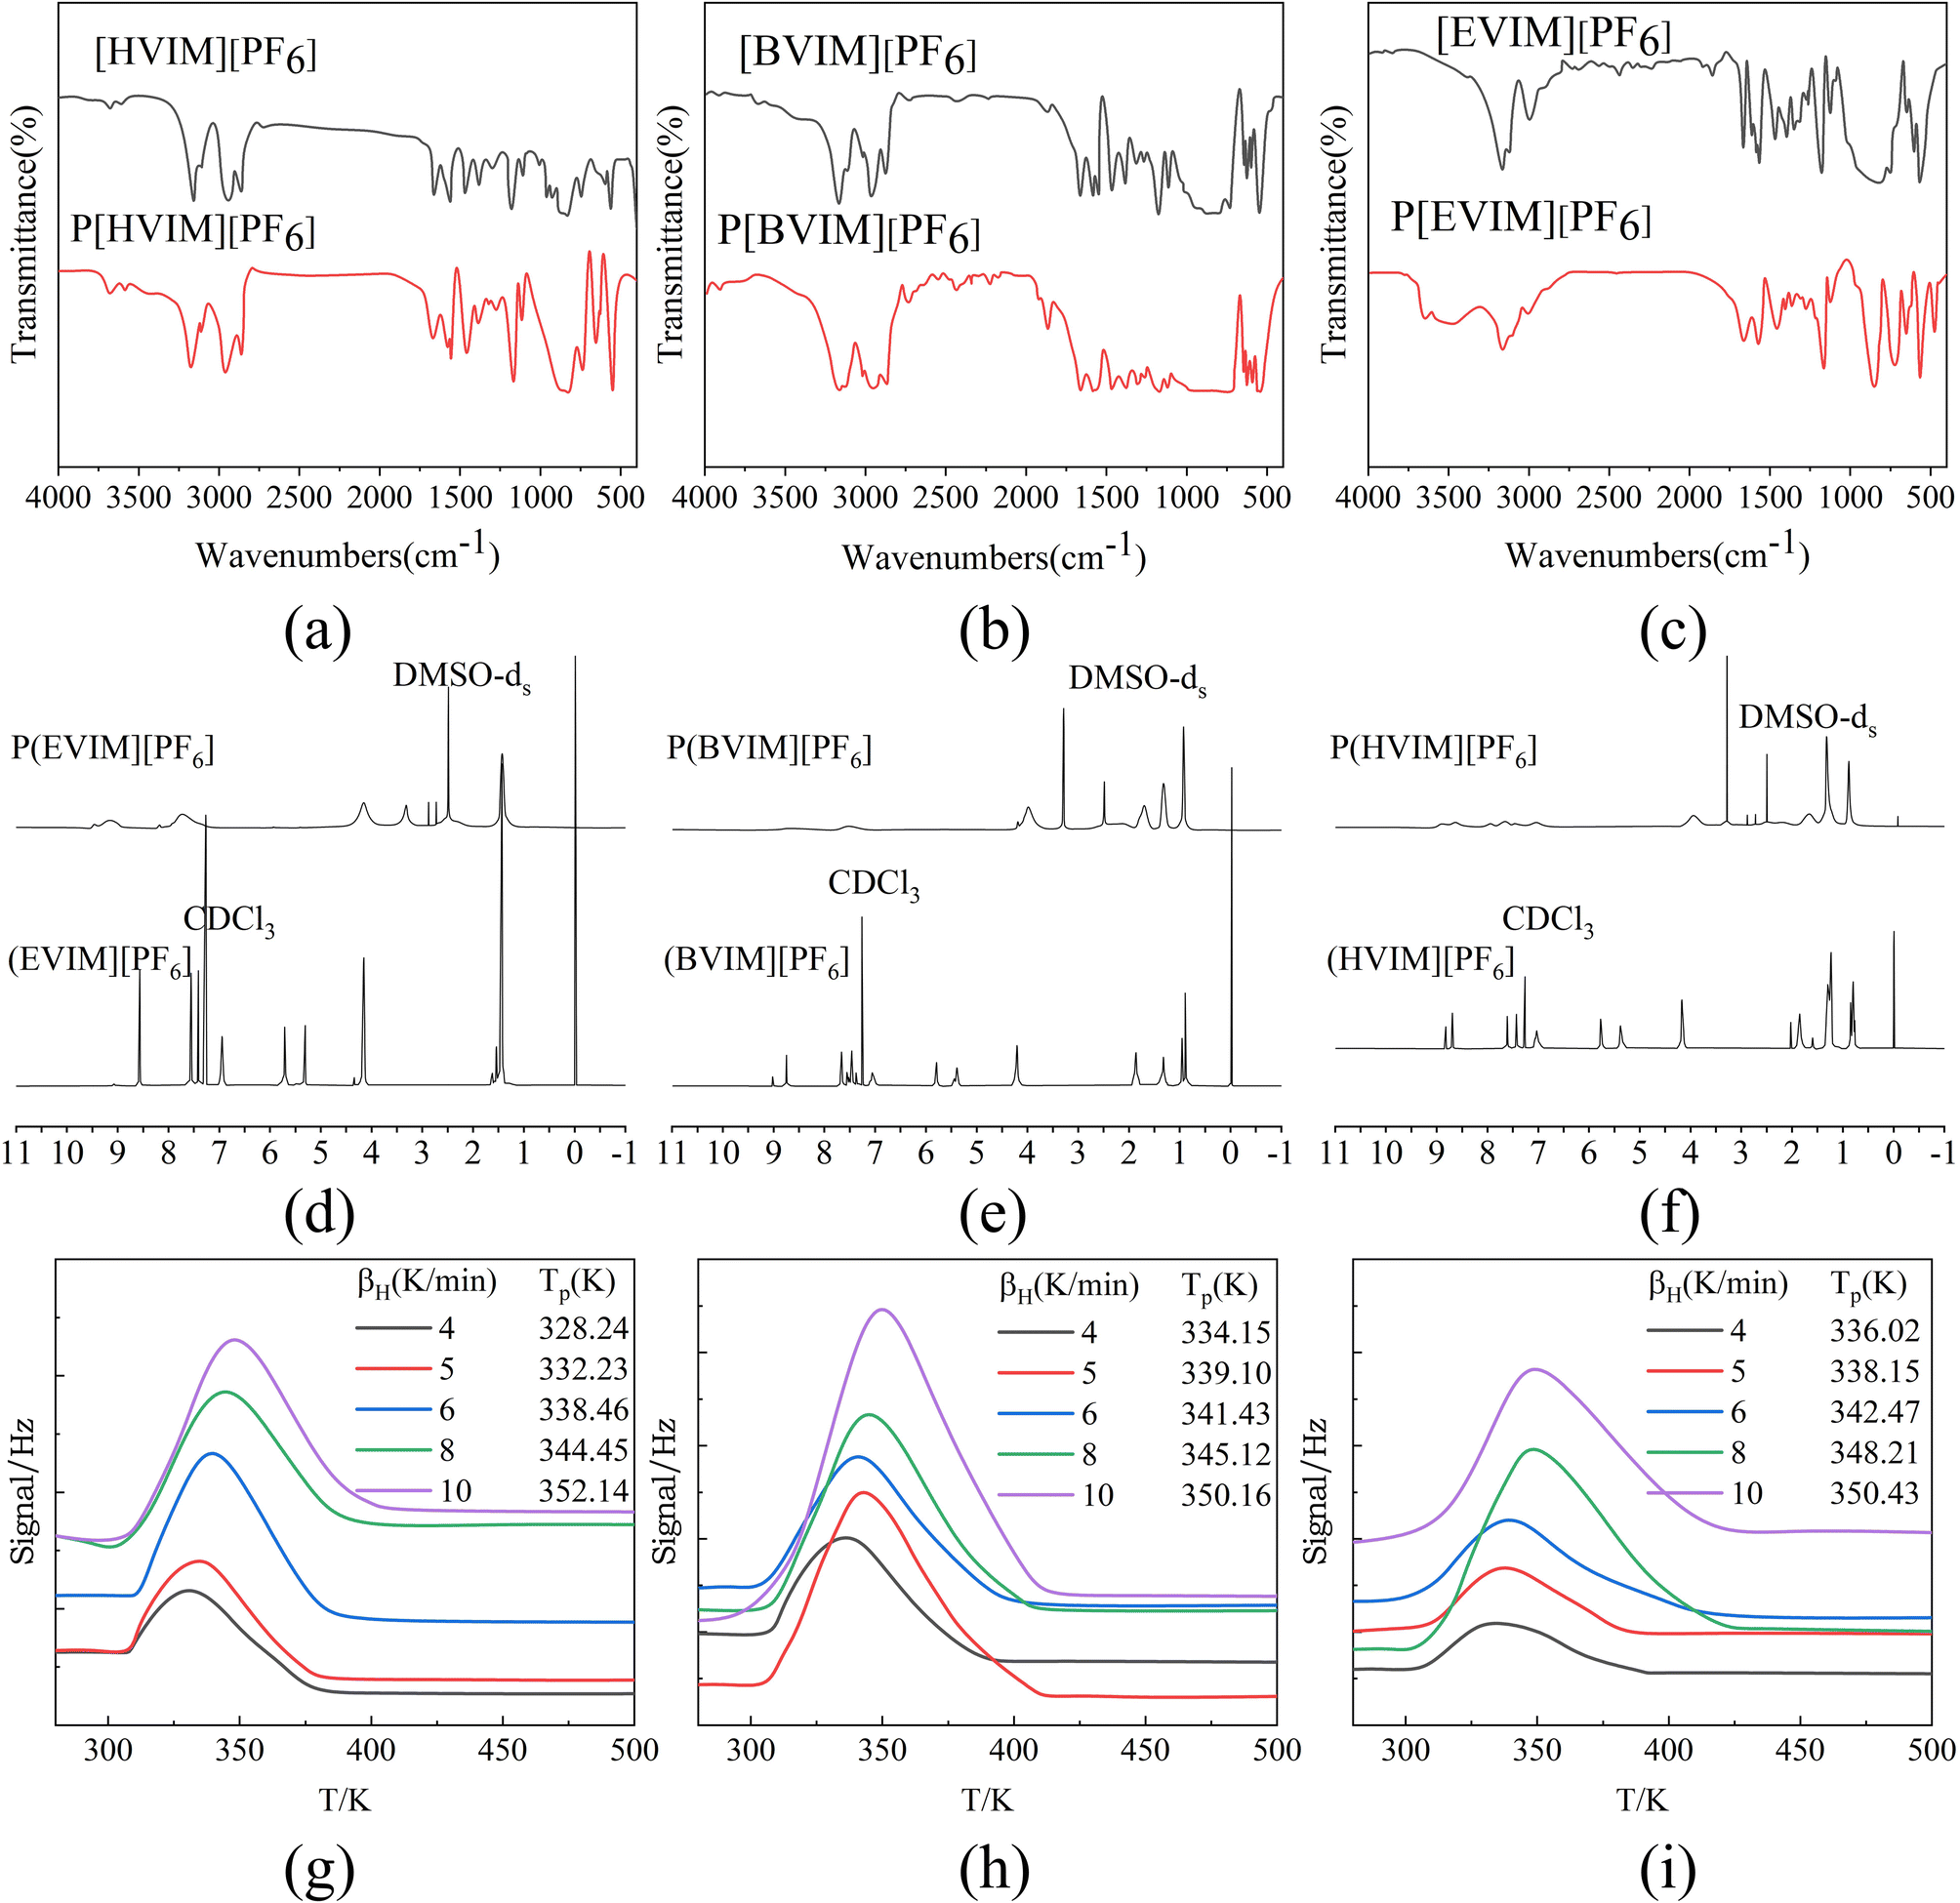 | ||
| Fig. 3 (a–c) Infrared characterization (a) P[EVIM][PF6] and [EVIM][PF6], (b) P[BVIM][PF6] and [BVIM][PF6], (c) P[HVIM][PF6] and [HVIM][PF6]. (d–f) 1H NMR spectra (d) P[EVIM][PF6] and [EVIM][PF6], (e) P[BVIM][PF6] and [BVIM][PF6], (f) P[HVIM][PF6] and [HVIM][PF6]. (g–i) TPD curves of R12 (g) P[EVIM][PF6], (h) P[BVIM][PF6], (i) P[HVIM][PF6]. | ||
A series of characterization experiments were carried out to obtain a deeper understanding of the physical and chemical properties of the synthesized three types of PILs. Initially, through molecular weight characterization, it was concluded that all three PILs were low oligomers with a number-average degree of polymerization ranging between 6 and 7, as detailed in Table 1. Further BET analysis results, as referenced in Table 2, indicate that elongating alkyl side chains on the polymer backbone leads to a decrease in surface area, an increase in pore size, and a reduction in pore volume. This finding aligns with the research of Zulfiqar et al., who proposed that variations in cations, anions, polymer backbones, alkyl substituents, porosity, cross-linking, molecular weight, and moisture content could account for the performance differences observed in PILs.31
| PILs | Number-average molecular | Weight weight-average molecular | Weight Z-average molecular | Weight dispersity index | Number-average degree of polymerization |
|---|---|---|---|---|---|
| P[EVIM][PF6] | 1689 | 3533 | 8271 | 2.09 | 6.35 |
| P[BVIM][PF6] | 1789 | 8669 | 50906 |
4.85 | 6.08 |
| P[HVIM][PF6] | 2233 | 11326 |
58973 |
5.07 | 6.93 |
| PILs | Specific surface area/(m2 g−1) | Pore size/(nm) | Pore volume/(cm3 g−1) |
|---|---|---|---|
| P[EVIM][PF6] | 2.696 | 5.448 | 0.005 |
| P[BVIM][PF6] | 2.353 | 7.337 | 0.004 |
| P[HVIM][PF6] | 2.044 | 7.432 | 0.003 |
As described in Fig. 4, Thermogravimetric analysis results indicate that these PILs exhibit no significant mass loss up to 573.15 K, demonstrating high thermal stability. However, they all underwent substantial mass loss, primarily attributed to the degradation of the polymer backbone within 573.15–773.15 K. Notably, the mass remained stable between 773.15 and 973.15 K without further loss.
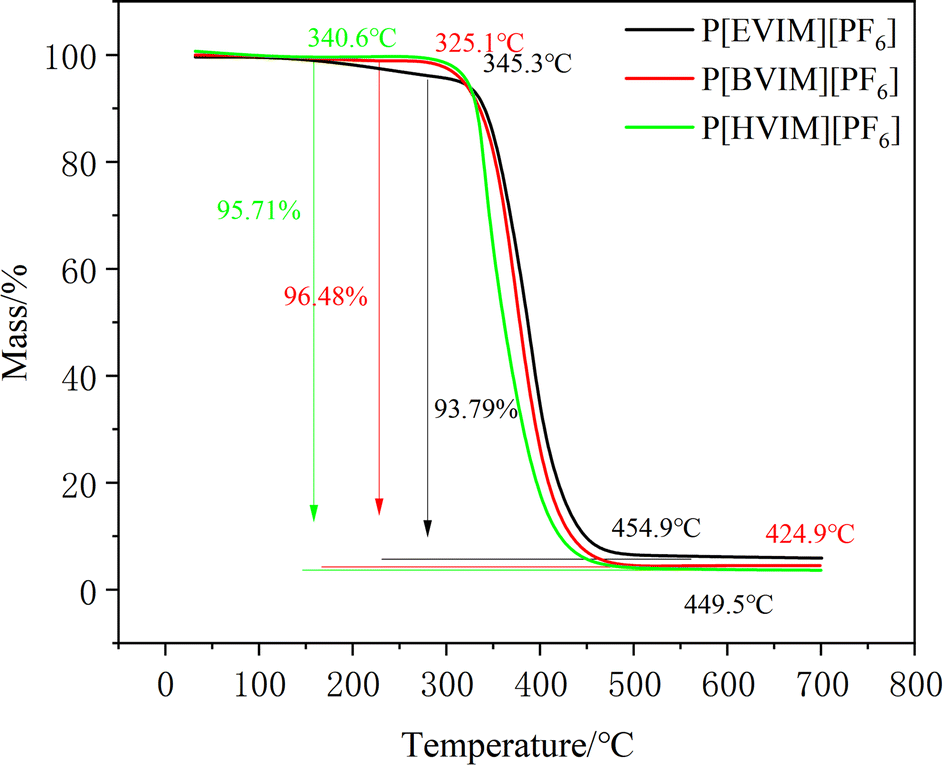 | ||
| Fig. 4 Thermogravimetric curves P[EVIM][PF6], P[BVIM][PF6], P[HVIM][PF6]. | ||
3.2 Adsorption heat
The detailed introduction and meticulous measurement of Adsorption heat are paramount in comprehending the interactions and assessing the efficacy of the PILs in adsorption processes. In the experimental temperature, the net retention time of three Freon refrigerants on three types of PILs filled columns showed different degrees of reduction as the observed temperature increased. This phenomenon indicates that the adsorption interaction between Freon and the surface of the synthesized PILs materials is an exothermic process. Fig. 5(a) displays the assessed values of the heat of saturated adsorption experimented under specific conditions.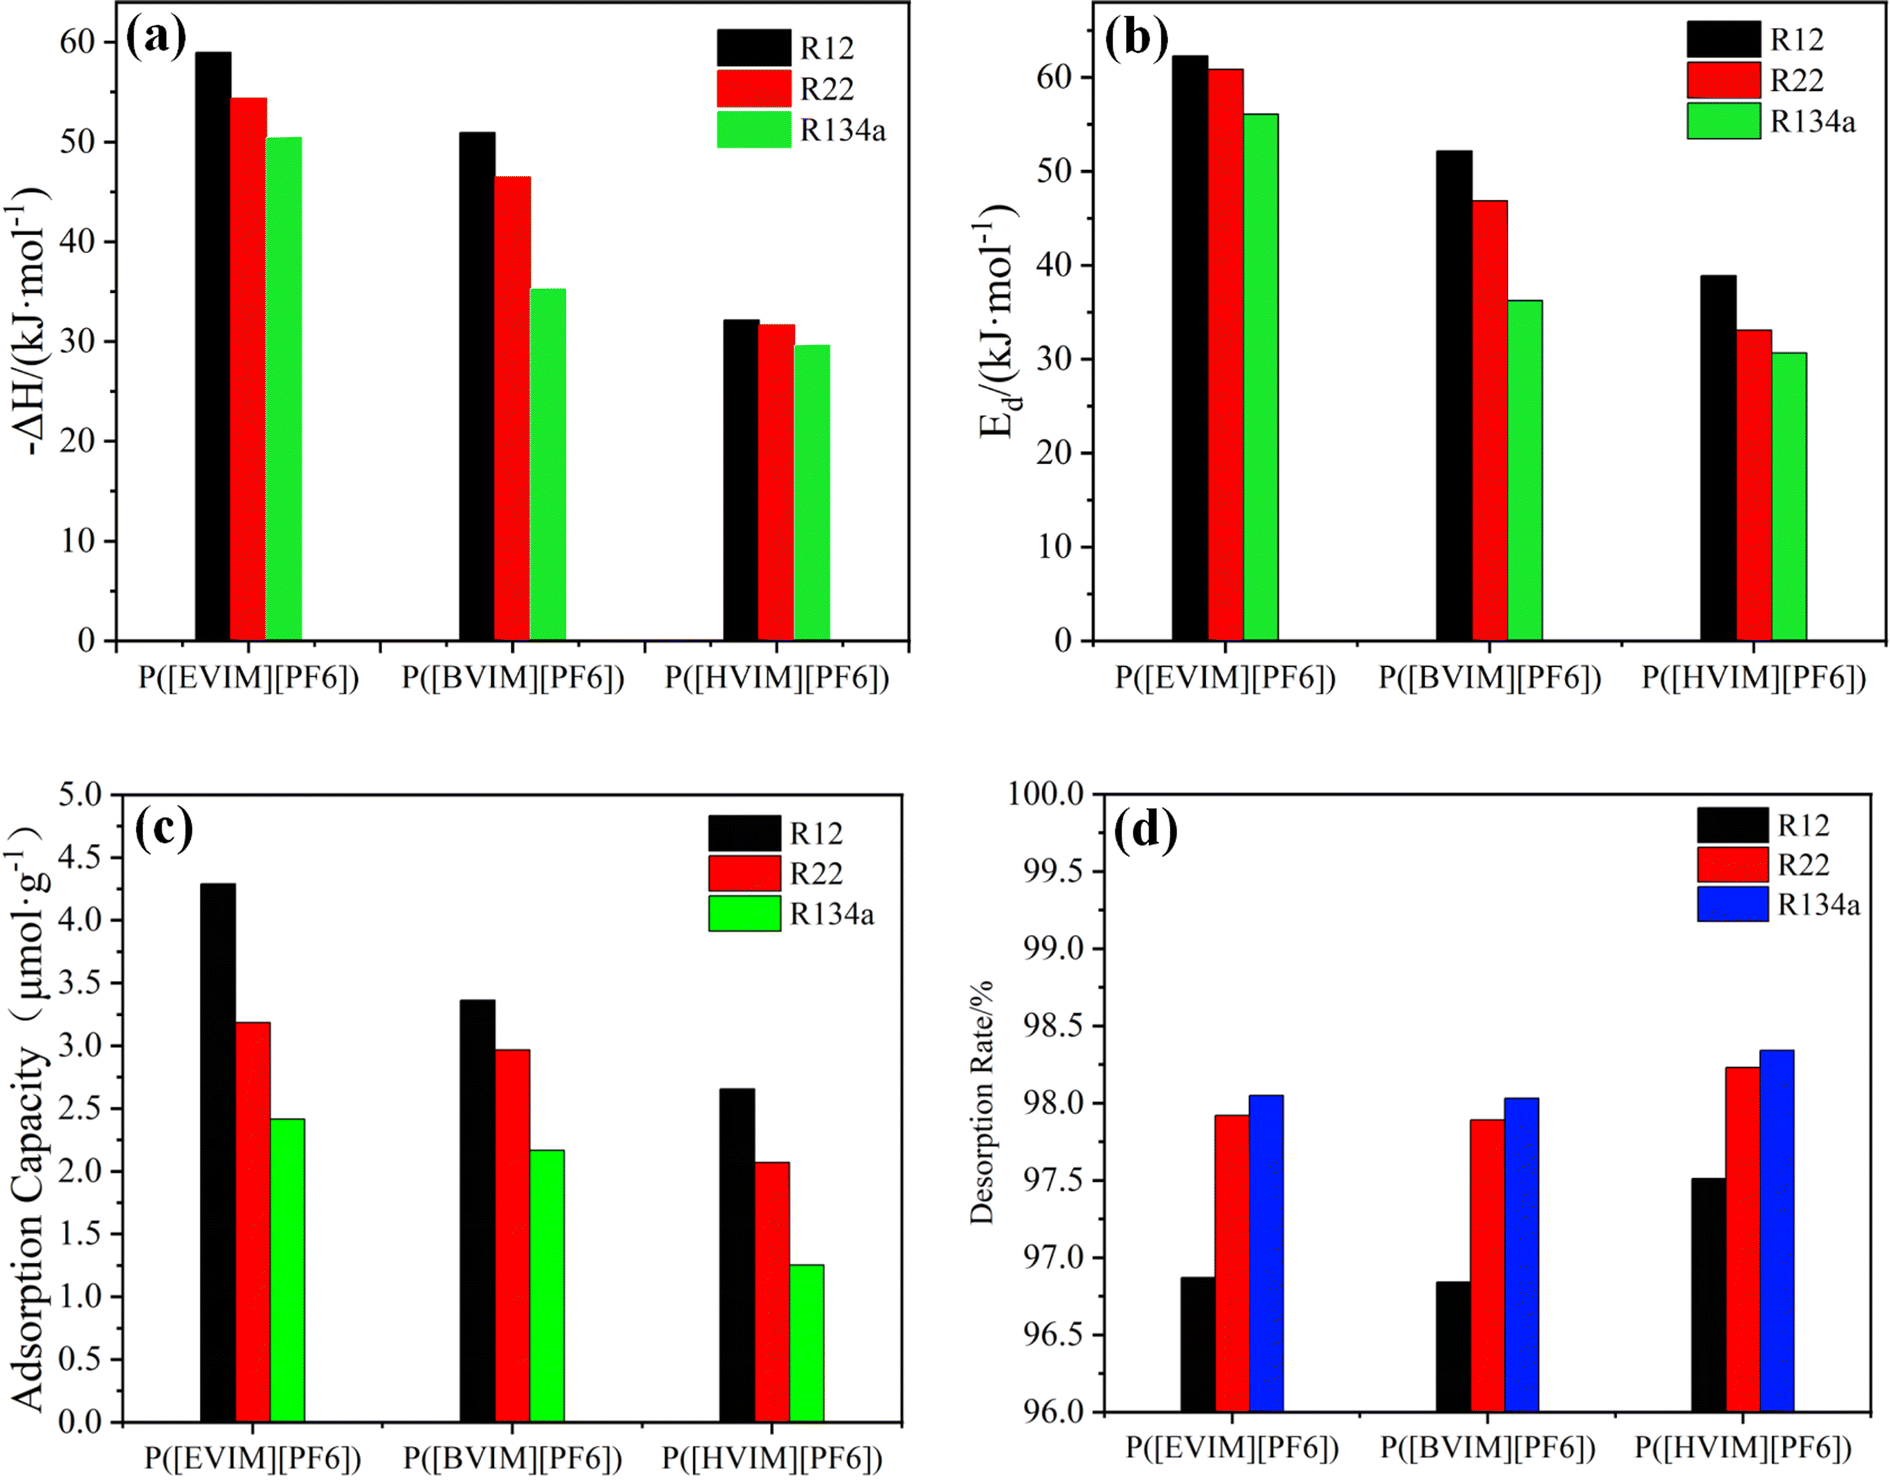 | ||
| Fig. 5 (a) Adsorption heat of Freon gas on the surface of three PILs. (b) Desorption activation energy of Freon gas on the surface of three PILs. (c) Adsorption capacities of PILs for refrigerants R12, R22, and R134a, measured at an adsorption time of 15 minutes under constant conditions of 298.15 K and a flow rate of 5 mL min−1. (d) Desorption rate analysis of Freon gas on PILs. | ||
The magnitude of the heat of adsorption serves as a critical indicator for distinguishing between physical and chemical adsorption processes.32 Physical adsorption typically occurs under the influence of weaker intermolecular forces, such as van der Waals interactions, resulting in relatively lower heats of adsorption, approximately around 40 kJ mol−1. This lower heat of adsorption signifies weaker interactions between the adsorbate and the adsorbent, characteristic of physical adsorption phenomena. Conversely, chemical adsorption involves the formation of stronger chemical bonds, thereby exhibiting significantly higher heats of adsorption, generally ranging from 84 to 417 kJ mol−1. The elevated heat of adsorption in chemical adsorption indicates more robust chemical bonding between the adsorbate and the adsorbent, a hallmark of chemical adsorption processes. Thus, by assessing the heat of adsorption, one can effectively differentiate between the distinct mechanisms of physical and chemical adsorption.
Among the three types of PILs, P[EVIM][PF6] exhibited the highest ΔH values for all three Freons (50.41–58.95 kJ mol−1), while P[HVIM][PF6] had the lowest (29.60–32.12 kJ mol−1). P[EVIM][PF6] and P[BVIM][PF6] both undergo both physical and chemical adsorption, except for P[HVIM][PF6], which undergoes only physical adsorption.
This may stems from the differences in the basicity of the three types of PILs. Since R12, R22, and R134a are acidic, PILs with stronger basicity interact more with these gases.
3.3 Desorption activation energy
Tp values can be calculated in accordance with TPD curves measured at different heating rates. Using R12 as the sample, TPD curves at different heating rates are depicted in Fig. 3(g)–(i). There is only one desorption peak on each TPD curve, indicating uniform adsorption that does not involve multiple adsorption centers or re-adsorption. According to eqn (8), the calculated results for Ed are illustrated in Fig. 5(b). Experimental results indicate that the Ed values for the three refrigerants are highest on P[EVIM][PF6] (56.05–62.27 kJ mol−1), followed by P[BVIM][PF6] (36.23–52.14 kJ mol−1), and are lowest on P[HVIM][PF6] (30.64–38.89 kJ mol−1). A greater Ed value indicates that the adsorbate needs more energy to detach from the adsorbent, suggesting a stronger adsorption. For each type of PILs, the Ed values for the three fluorocarbon refrigerants follow R134a < R22 < R12. Table 3 compares the measured Ed and ΔH values for R12, R22, and R134a on the three types of PILs. It is clear that the Ed values are all higher than the ΔH values. This suggests that the adsorption rates of the three fluorocarbon gas molecules on the three types of PILs surfaces are more significant than their desorption rates. In our study, we observed significant differences in adsorption heats and desorption activation energies even among structurally similar PILs. This finding aligns with the research conducted by Yuan et al., who emphasized the impact of intrinsic differences in the chemical structures and synthesis trends of PILs on their adsorption heats and desorption activation energies.17| PILs | R12 | R22 | R134a | |||
|---|---|---|---|---|---|---|
| −ΔH/(kJ mol−1) | Ed/(kJ mol−1) | −ΔH/(kJ mol−1) | Ed/(kJ mol−1) | −ΔH/(kJ mol−1) | Ed/(kJ mol−1) | |
| P([EVIM][PF6]) | 58.95 | 62.27 | 54.37 | 60.85 | 50.41 | 56.05 |
| P([BVIM][PF6]) | 50.92 | 52.14 | 46.48 | 46.85 | 35.28 | 36.23 |
| P([HVIM][PF6]) | 32.12 | 38.89 | 31.62 | 33.05 | 29.60 | 30.64 |
3.4 Adsorption capacity
The adsorption of refrigerants on PILs tubes was investigated at 298.15 K. For instance, the process of R22 adsorption onto a P[EVIM][PF6] adsorption tube is depicted in Fig. 6. An decrease in the equilibrium adsorption capacity of P[EVIM][PF6] was observed with the increase in R22 flow rate, which aligns with the findings of Tao Wang et al. This decrease was attributed to the reduced contact time between the adsorbate and adsorbent at higher flow rates.33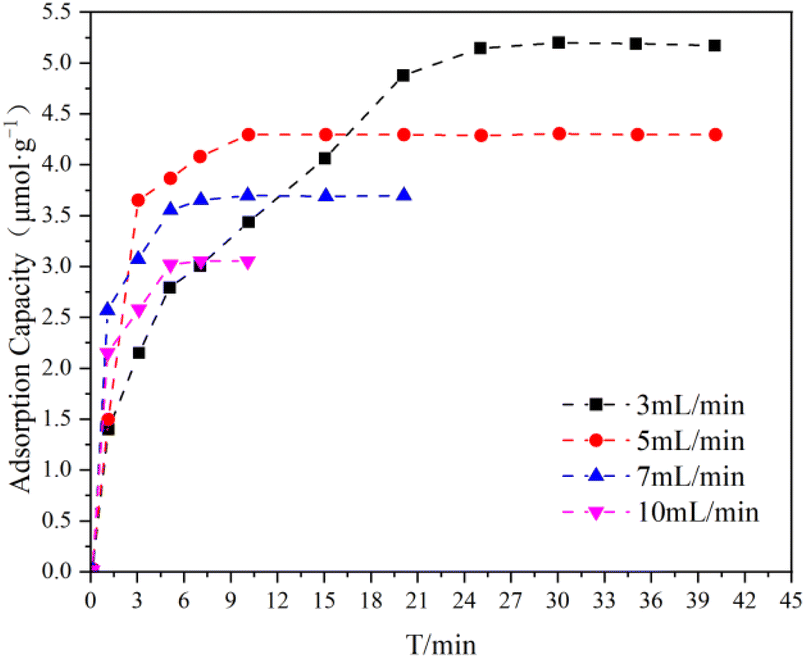 | ||
| Fig. 6 Profiles of R22 adsorption capacity of P[EVIM][PF6] adsorption tube with different flow rates at 298.15 K. | ||
This study also examined the changes in adsorption capacity over time for three types of refrigerants on three kinds of PILs adsorption tubes at 5 mL min−1 and 298.15 K. As can be seen in Fig. 7, the adsorption capacity of the three types of PILs adsorption tubes remains consistent for the refrigerants at an adsorption time duration of 10 minutes. The findings suggest that the adsorption tubes of the three types of PILs maintain a steady adsorption capacity for refrigerants during a 10 minute adsorption timeframe. At the same time, Fig. 5(c) displays the adsorption capacities of R12, R22, and R134a on these adsorption tubes within a temperature scope of 298.15 K and a gas flow velocity of 5 mL min−1. There is an inverse correlation between the adsorption capacity of the three Freon gases on the three PILs adsorption tubes and the elongation of the alkyl side chain on the polymer backbone. This observation aligned with the trend identified during the synthesis process, where the elongation of the alkyl side chain on the polymer backbone led to a reduction in specific surface area, an increase in pore diameter, and a decrease in pore volume. Additionally, the adsorption capacities of the three PILs adsorption tubes for the refrigerants follow the sequence R134a < R22 < R12, consistent with the adsorption heat analysis results for these gases on the PILs surfaces. The higher the adsorption heat value, the stronger the interaction between the gas and the PILs. In summary, the interaction strength between the three Freon gases and the three PILs materials predominantly determines the adsorption capacity.
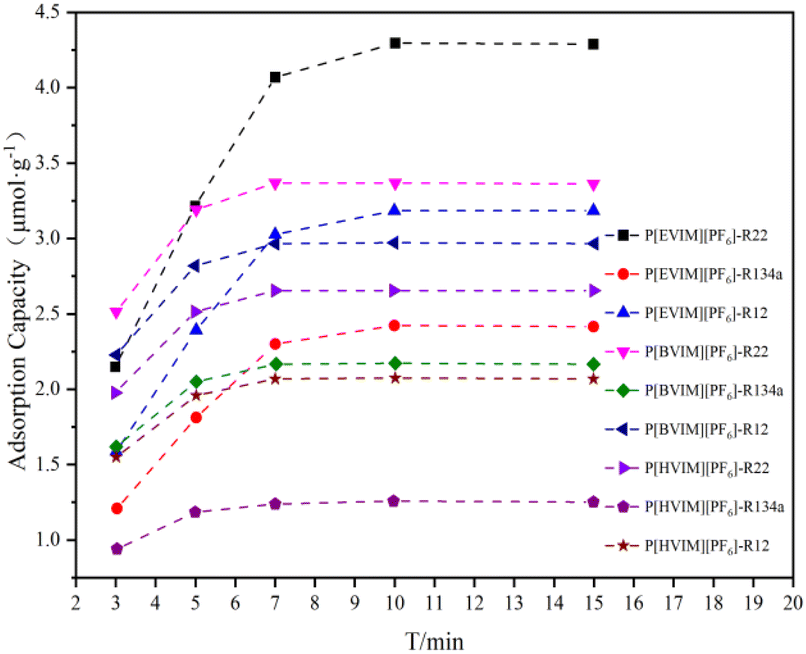 | ||
| Fig. 7 Adsorption capacity of the PILs adsorption tube to the refrigerants with different adsorption time at 298.15 K. | ||
3.5 Standard curve analysis
Standard operation curves at a 298.15 K temperature was established and the relationship between peak area and hypothetical gas mass was examined (Fig. 8). Table 4 displays the equations reflecting fit and matching correlation coefficients of the standard curve. The table below reveals a strong linear correlation between R12, R22, and R134a across the three PILs adsorption tube types across the three PILs adsorption tube types each exceed 0.99. This evident linear relationship suggests that the adsorption effect can be predicted and controlled, thereby aiding in designing efficient refrigerant recovery or separation systems.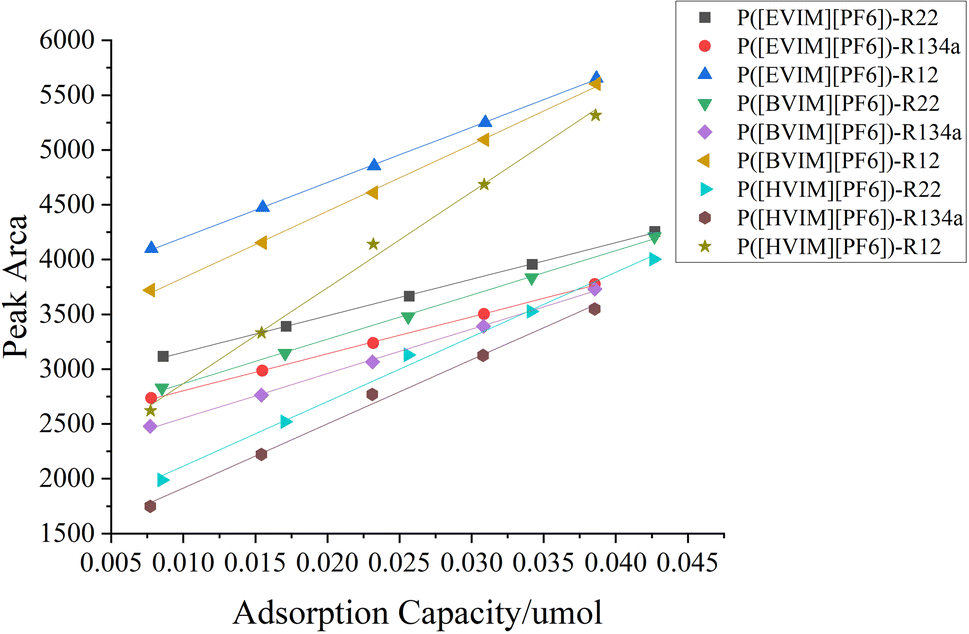 | ||
| Fig. 8 Standard working curves of Freon gas on PILs adsorption tube. | ||
| PILs | Freon gas | Fitting equation | R2 |
|---|---|---|---|
| P([EVIM][PF6]) | R12 | Y = 50497X + 3706 |
0.9995 |
| R22 | Y = 33431X + 2826 |
0.9996 | |
| R134a | Y = 33739X + 2471 |
0.9995 | |
| P([BVIM][PF6]) | R12 | Y = 60632X + 3243 |
0.9924 |
| R22 | Y = 40406X + 2475 |
0.9986 | |
| R134a | Y = 40510X + 2162 |
0.9984 | |
| P([HVIM][PF6]) | R12 | Y = 87944X + 1990 |
0.9946 |
| R22 | Y = 59225X + 1523 |
0.9927 | |
| R134a | Y = 58758X + 1327 |
0.9933 |
3.6 Desorption rate analysis
At 298.15 K, the practical applicability of PILs adsorption tubes was comprehensively evaluated by comparing their performance with activated carbon adsorption tubes under the same conditions, specifically in terms of adsorption capacity, standard curves, and desorption rates for three types of Freon gas refrigerants. The experimental results are shown in Fig. 5(d). The table clearly shows that the linearity and desorption rates in the three PILs adsorption tubes are superior to those found in the activated carbon adsorption tubes. With respect to saturated adsorption capacity, the activated carbon adsorption tubes hold a higher capacity than the three different PILs adsorption tubes due to their more complex pore structure and a larger specific surface area compared to PILs materials.3.7 Reproducibility analysis
Each PILs adsorption tube underwent nine successive adsorption and desorption cycles at 298.15 K, with the adsorption capacity serving as the standard for analyzing reproducibility. The findings from the experiment are depicted in Fig. 9. As repeated uses of the three types of PILs adsorption tubes increase, the saturated adsorption capacity of the refrigerants remains relatively stable.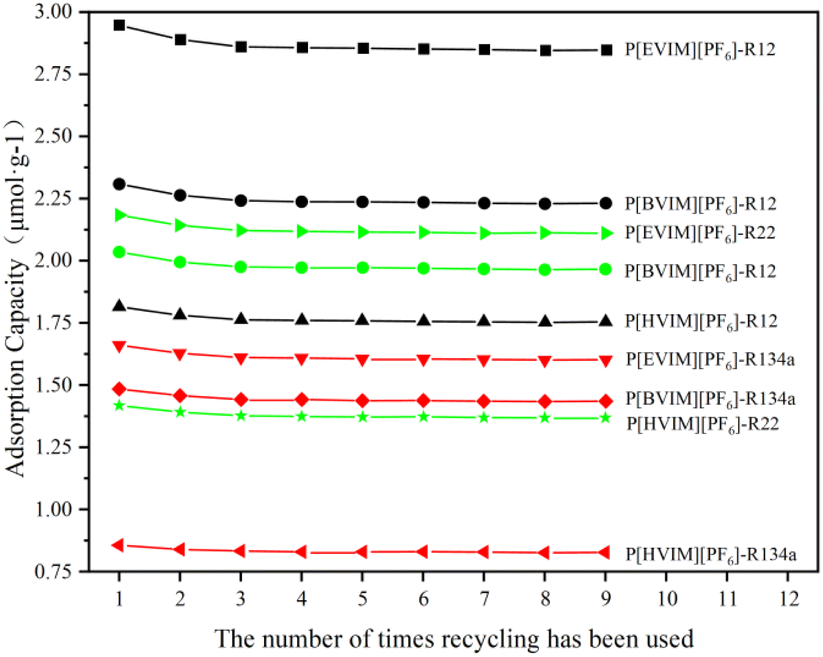 | ||
| Fig. 9 Repeatability analysis of Freon gas on PILs adsorption tubes. | ||
3.8 Practicality analysis
At 298.15 K, the practical applicability of PILs adsorption tubes was comprehensively evaluated by comparing their performance with activated carbon adsorption tubes under the same conditions, specifically in terms of adsorption capacity, standard curves, and desorption rates for three types of Freon gas refrigerants. The experimental results are listed in Table 5. It is obvious that the linearity and desorption rates of the three types of PILs adsorption tubes are superior to those of the activated carbon adsorption tubes. According to Table 6, the saturated adsorption capacity of activated carbon adsorption tubes is higher than that of PILs manufactured from the three different types of materials. This can be attributed to that activated carbon has a more developed pore structure and a larger specific surface area than PILs.| Adsorbent material | Name of the gas | Linear equation | R2 | Desorption rate (%) |
|---|---|---|---|---|
| Activated carbon | R12 | Y = 5113X + 2033 | 0.9724 | 88.36 |
| R134a | Y = 5872X + 1779 | 0.9650 | 92.72 | |
| R22 | Y = 6469X + 2697 | 0.9530 | 89.60 | |
| P[EVIM][PF6] | R12 | Y = 50497X + 3706 |
0.9996 | 96.87 |
| R134a | Y = 33739X + 2471 |
0.9995 | 98.05 | |
| R22 | Y = 33431X + 2826 |
0.9995 | 97.92 | |
| P[BVIM][PF6] | R12 | Y = 60632X + 3243 |
0.9986 | 96.84 |
| R134a | Y = 40510X + 2162 |
0.9984 | 98.03 | |
| R22 | Y = 40406X + 2475 |
0.9924 | 97.89 | |
| P[HVIM][PF6] | R12 | Y = 87944X + 1990 |
0.9927 | 97.51 |
| R134a | Y = 58758X + 1327 |
0.9933 | 98.34 | |
| R22 | Y = 59225X + 1523 |
0.9946 | 98.23 |
| Materials | T/K | Adsorption capacity (μmol g−1) | ||
|---|---|---|---|---|
| R22 | R134a | R12 | ||
| Activated carbon | 298.15 | 4.413 | 2.728 | 3.345 |
| P[EVIM][PF6] | 298.15 | 2.862 | 1.613 | 2.123 |
| P[BVIM][PF6] | 298.15 | 2.243 | 1.445 | 1.978 |
| P[HVIM][PF6] | 298.15 | 1.765 | 0.834 | 1.378 |
4 Conclusion
In current study, three linear PILs materials were synthesized using four ILs as polymerization monomers through a free radical polymerization reaction. The elongation of the alkyl side chain impedes monomer polymerization, which is unfavorable for the synthesis of linear PILs. All three linear PILs are oligomers with a number-average degree of polymerization between 6 and 7, without mass loss at 575.15 K. The adsorption properties were experimentally evaluated by preparing adsorbent tubes using the three PIL materials. It was found that apart from P[HVIM][PF6], which exhibits physical adsorption, both P[EVIM][PF6] and P[BVIM][PF6] undergo simultaneous physical and chemical adsorption. For each PILs, the ΔH and Ed values for the three refrigerants follow R134a < R22 < R12. Moreover, as the alkyl side chain on the polymer backbone elongates, the adsorption efficacy of the PILs materials for the three tracers decreases. After nine consecutive adsorption and desorption cycles, the saturation adsorption capacity on the three PILs adsorption tubes remains stable. The desorption rates of the three PILs adsorption tubes surpass those of activated carbon tubes with excellent linear response. As a result, these three PILs exhibit commendable performance in adsorption linearity, adsorption–desorption properties, and repeatability, suggesting that they have excellent prospects for practical applications.Data availability
Data will be made available on request.Author contributions
Mingyuan Xin: conceptualization; methodology; experiments; manuscript writing. Qiang Wang: conceptualization; experiments; data curation; manuscript reviewing. Qiang WangJ: experiments; data curation; manuscript reviewing. Haoyu Wang: methodology; manuscript reviewing. Furqan Muhammad: supervision; manuscript reviewing. Guanze Nie: conceptualization; supervision; manuscript reviewing.Conflicts of interest
The authors declare that they have no known competing financial interests or personal relationships that could have appeared to influence the work reported in this paper.Acknowledgements
The financial supports from Opening Foundation of Key Laboratory of Xinjiang Uygur Autonomous Region (grant no. 2020D04044).Notes and references
- L. M. Polvani, M. Previdi, M. R. England, G. Chiodo and K. L. Smith, Substantial twentieth-century Arctic warming caused by ozone-depleting substances, Nat. Clim. Change, 2020, 10, 130–133 CrossRef CAS.
- P. J. Young, A. B. Harper, C. Huntingford, N. D. Paul, O. Morgenstern, P. A. Newman, L. D. Oman, S. Madronich and R. R. Garcia, The Montreal Protocol protects the terrestrial carbon sink, Nature, 2021, 596, 384–388 CrossRef CAS PubMed.
- O. Morgenstern, P. Braesicke, M. M. Hurwitz, F. M. O’Connor, A. C. Bushell, C. E. Johnson and J. A. Pyle, The world avoided by the Montreal Protocol, Geophys. Res. Lett., 2008, 35, L16811 CrossRef.
- M. W. Roberts, Finishing the job: the Montreal Protocol moves to phase down hydrofluorocarbons, Rev. Eur. Comp. Int. Environ. Law, 2017, 26, 220–230 CrossRef.
- M. Lee, J. Ham, V. Chinnasamy and H. Cho, Investigation on absorption performance of R134a and R1234yf refrigerants using HMIM-based ionic liquids, J. Environ. Chem. Eng., 2023, 11, 109726 CrossRef CAS.
- J. Tang, H. Tang, W. Sun, H. Plancher, M. Radosz and Y. Shen, Poly (ionic liquid) s: a new material with enhanced and fast CO 2 absorption, Chem. Commun., 2005, 3325–3327 CAS.
- W. Q. Song and L. W. Qian, Research Progress on Ionic Liquids as Adsorption Materials, Mater. Rev., 2016, 30, 120–126+140 Search PubMed.
- C. F. Poole and S. K. Poole, Ionic liquid stationary phases for gas chromatography, J. Sep. Sci., 2011, 34, 888–900 CrossRef CAS PubMed.
- Y. Cao and T. Mu, Comprehensive Investigation on the Thermal Stability of 66 Ionic Liquids by Thermogravimetric Analysis, Ind. Eng. Chem. Res., 2014, 53, 8651–8664 CrossRef CAS.
- B. Wang, L. Qin, T. Mu, Z. Xue and G. Gao, Are Ionic Liquids Chemically Stable?, Chem. Rev., 2017, 117, 7113–7131 CrossRef CAS PubMed.
- Z. Xue, L. Qin, J. Jiang, T. Mu and G. Gao, Thermal, electrochemical and radiolytic stabilities of ionic liquids, Phys. Chem. Chem. Phys., 2018, 20, 8382–8402 RSC.
- U. A. Rana, R. Vijayaraghavan, M. Walther, J. Sun, A. A. Torriero, M. Forsyth and D. R. MacFarlane, Protic ionic liquids based on phosphonium cations: comparison with ammonium analogues, Chem. Commun., 2011, 47, 11612–11614 RSC.
- J. Bautista-Martinez, L. Tang, J.-P. Belieres, R. Zeller, C. Angell and C. Friesen, Hydrogen redox in protic ionic liquids and a direct measurement of proton thermodynamics, J. Phys. Chem. C, 2009, 113, 12586–12593 CrossRef CAS.
- J. Yuan, D. Mecerreyes and M. Antonietti, Poly(ionic liquid)s: an update, Prog. Polym. Sci., 2013, 38, 1009–1036 CrossRef CAS.
- M. Pekař, Inverse gas chromatography of liquid polybutadienes, Polymer, 2002, 43, 1013–1015 CrossRef.
- T. Magalhaes, A. Aquino, F. Dalla Vecchia, F. Bernard, M. Seferin, S. Menezes, R. Ligabue and S. Einloft, Syntheses and characterization of new poly (ionic liquid) s designed for CO 2 capture, RSC Adv., 2014, 4, 18164–18170 RSC.
- S. Zulfiqar, M. I. Sarwar and D. Mecerreyes, Polymeric ionic liquids for CO 2 capture and separation: potential, progress and challenges, Polym. Chem., 2015, 6, 6435–6451 RSC.
- W. Zhang, E. Gao, Y. Li, M. T. Bernards, Y. He and Y. Shi, CO2 capture with polyamine-based protic ionic liquid functionalized mesoporous silica, J. CO2 Util., 2019, 34, 606–615 CrossRef CAS.
- Z. Xue, Y. Zhang, X.-Q. Zhou, Y. Cao and T. Mu, Thermal stabilities and decomposition mechanism of amino- and hydroxyl-functionalized ionic liquids, Thermochim. Acta, 2014, 578, 59–67 CrossRef CAS.
- Y. Chen, Y. Cao, Y. Shi, Z. Xue and T. Mu, Quantitative Research on the Vaporization and Decomposition of [EMIM][Tf2N] by Thermogravimetric Analysis–Mass Spectrometry, Ind. Eng. Chem. Res., 2012, 51, 7418–7427 CrossRef CAS.
- R. Ho and J. Y. Heng, A review of inverse gas chromatography and its development as a tool to characterize anisotropic surface properties of pharmaceutical solids, KONA Powder Part. J., 2013, 30, 164–180 CrossRef CAS.
- Z. Li, H. Wang, H. Xi, Q. Xia, J. Han and L. Luo, Estimation of activation energy of desorption of n-hexanol from activated carbons by the TPD technique, Adsorpt. Sci. Technol., 2003, 21, 125–133 CrossRef CAS.
- J. A. F. Gamelas, The surface properties of cellulose and lignocellulosic materials assessed by inverse gas chromatography: a review, Cellulose, 2013, 20, 2675–2693 CrossRef CAS.
- W. Wang, Q. Hua, Y. Sha, D. Wu, S. Zheng and B. Liu, Surface properties of solid materials measured by modified inverse gas chromatography, Talanta, 2013, 112, 69–72 CrossRef CAS PubMed.
- L. Jia, J. Ma, Q. Shi and C. Long, Prediction of Adsorption Equilibrium of VOCs onto Hyper-Cross-Linked Polymeric Resin at Environmentally Relevant Temperatures and Concentrations Using Inverse Gas Chromatography, Environ. Sci. Technol., 2017, 51, 522–530 CrossRef CAS PubMed.
- B. B. Saha, K. Habib, I. I. El-Sharkawy and S. Koyama, Adsorption characteristics and heat of adsorption measurements of R-134a on activated carbon, Int. J. Refrig., 2009, 32, 1563–1569 CrossRef CAS.
- E. Díaz, S. Ordóñez, A. Vega and J. Coca, Adsorption characterisation of different volatile organic compounds over alumina, zeolites and activated carbon using inverse gas chromatography, J. Chromatogr. A, 2004, 1049, 139–146 CrossRef PubMed.
- J. Li, Z. Li, H.-X. Xi and Q.-B. Xi, Desorption Activation Energy of Benzene on Modified Activated Carbon, J. Process Eng., 2008, 05, 734–737 Search PubMed.
- W. D. Jiang, C. Q. Zhuang, X. Wang and X. E. Cai, Determination of Desorption Order and Desorption Activation Energy of Oxygen and Ethanol on Porapak Samples by Thermal Desorption Method, J. Chem. High. Inst., 2008, 24, 67–69 Search PubMed.
- Y. Zhang, M. Mei, T. Ouyang and X. Huang, Preparation of a new polymeric ionic liquid-based sorbent for stir cake sorptive extraction of trace antimony in environmental water samples, Talanta, 2017, 161, 377–383 CrossRef PubMed.
- J. Yuan, D. Mecerreyes and M. Antonietti, Poly (ionic liquid) s: an update, Prog. Polym. Sci., 2013, 38, 1009–1036 CrossRef CAS.
- W. Steele, Molecular interactions for physical adsorption, Chem. Rev., 1993, 93, 2355–2378 CrossRef CAS.
- T. Wang, K. Ge, Y. Wu, K. Chen, M. Fang and Z. Luo, Designing moisture-swing CO2 sorbents through anion screening of polymeric ionic liquids, Energy Fuels, 2017, 31, 11127–11133 CrossRef CAS.
| This journal is © The Royal Society of Chemistry 2024 |