 Open Access Article
Aminated graphene quantum dots/CdS nanobelts for enhanced photocatalytic degradation of RhB dye under visible light†
Xiangfeng Lin *ab,
Yu Chenab,
Diwen Zhouc,
Menglin Chen*ab,
Weixia Liang*d and
Huazhang Guo*c
aSchool of Environment and Resource, Guangxi Normal University, Guilin 541004, PR China. E-mail: mlchen99@163.com; 310976435@qq.com
bGuangxi Key Laboratory of Environmental Processes and Remediation in Ecologically Fragile Regions, China
cSchool of Environmental and Chemical Engineering, Shanghai University, Shanghai 200444, PR China. E-mail: guohuazhang@shu.edu.cn
dSchool of Medicine and Health, Guangxi Vocational & Technical Institute of Industry, Nanning 530001, China. E-mail: liangwxabc@163.com
First published on 2nd January 2024
Abstract
CdS nanoparticles have wide applications as photocatalysts for degradation of organic pollutants, but due to their limited turnover number and off-pathway charge recombination processes, their degradation efficiency is low. Herein, aminated graphene quantum dots/CdS (GQDs/CdS) nanobelts were successfully fabricated by solvothermal and hydrothermal processes. The prepared GQDs/CdS were characterized by physical methods to investigate their structure, morphology, optical properties, specific surface area, element composition, and chemical state. GQDs/CdS materials promoted efficient charge separation, and showed high efficiency in the photocatalytic degradation of the organic dye Rhodamine B (RhB) under visible light. The degradation efficiency of RhB samples over 0.05 g of catalysts reached 97.40% after 150 min, a much higher efficiency in comparison to pure CdS. Electron paramagnetic resonance (EPR) spectroscopy provided direct evidence for ˙OH and ˙O2− as the reactive oxidative species using DMPO as a spin trap. Consistent with the experimental results, a possible mechanism of RhB photocatalytic degradation by GQDs/CdS under visible light was proposed. This work may provide environmentally friendly photocatalysts for degrading organic dyes and purifying water.
1. Introduction
Organic dyes are widely used in the manufacturing of consumable goods (textiles, glass, paper products, etc.) in modern society. Their prevalence in all facets of life is underscored by estimations that the global organic dyes market will reach over $5.1 billion by the end of 2027.1 Among numerous dyes, RhB is one of the most widely-used organic dyes in printing and in textiles. In spite of its ubiquity, RhB is harmful to human health: exposure to RhB can cause skin irritation, vomiting, and nausea.2 The artificial organic dyes exhibit high toxicity, low biodegradability, chemical stability and difficult degradation, even at low concentrations; these dyes are dangerous and seriously threaten human health and the ecological environment.3 At present, manufacturing processes release a large amount of dye in the wastewater. An estimated 10–20% of dyes run off into the treated wastewater because of inefficiencies in the coloring process.4 Presently, different treatment technologies such as adsorption, biological oxidation, oxidation by chemical reagents, and flocculation/coagulation are extensively used to treat dyes in wastewater.3 However, these technologies have their own limitations, such as selective adsorption, long processing time, large area occupied, low removal efficiency, and noxious byproducts.5 These limitations provide a driving force to explore new techniques to efficiently eliminate dye contaminants from various sources. Photodegradation has attracted great attention for organic wastewater as it is economical, green, and can operate at high removal efficiencies. Moreover, some photocatalysts can use natural, visible light, as opposed to artificial light.4,5 Many semiconductor catalysts such as metal oxides (TiO2, ZnO, WO3, CeO2, etc.), metal sulfides (ZnS, CdS, Mo2S, Bi2S3, etc.), ternary compounds (BaTiO3, Bi2WO6, BiVO4, etc.), and non-metal semiconductors (g-C3N4, black phosphorus, etc.) have shown outstanding performance in photocatalytic degradation of organic pollutants.6–12CdS is a semiconductor with a relatively narrow energy band (2.4 eV), allowing it to be driven by sunlight and used as a visible light photocatalyst. The conduction band position of CdS is sufficiently negative to allow the transfer of the valence electrons from the nanoparticle surface to adsorbed molecules.13 In recent years, CdS semiconductors have gained attention due to its low cost, easy portability, and high electronic mobility.14,15 However, pure CdS materials are not stable and tend to aggregate, which reduces the specific surface area, leading to lower overall reactivity.16 Additionally, CdS is sensitive to severe photodegradation, leading to rapid recombination of photogenerated electron–hole pairs.17 This further limits the overall reactivity of CdS-based catalysts. To solve these problems, modification of CdS morphologies have been developed to enhance the photocatalyst efficiency. These strategies include changing the morphology of CdS from bulk material to nanospheres (either mesoporous or nanorods structures),18–22 and doping with metal/non-metal elements such as Ag, graphene quantum dots (GQDs), g-C3N4,23–25 and other semiconductors like TiO2, WO3, MoS2.26–28 Among these modifications, GQDs are zero-dimensional carbon nanomaterials that are low cost, non-toxic, have excellent optical performance, are biocompatible, and amenable to surface modifications.29 Furthermore, GQDs show very strong visible light absorption properties, have tunable bandgaps, and possess superior photo-stability.24 When GQDs are joined with CdS as GQDs/CdS composites, the GQDs act as the effective electron transfer mediator to improve charge separation efficiency, while CdS is the photocatalytic active center that harvests light and drive various catalytic processes.24 Therefore, GQDs and GQD-based materials such as GQDs/CdS composites have been used in various applications such as CO2 reduction photocatalysts,30 environmental monitoring devices,31 photocatalysts for the photodegradation of organic pollutants,32 H2 or H2O2 evolution catalysts24,33,34 and bioimaging markers.35
Although GQDs/CdS composites have been used in the visible light-driven degradation of organic pollutants, the ability of aminated GQDs/CdS nanobelts to drive photocatalytic degradation of RhB has not yet been thoroughly studied. In this work, we successfully prepared a GQDs/CdS photocatalyst via three simple process: (1) solvothermal synthesis of CdS nanowires, (2) hydrothermal synthesis of GQDs, (3) preparation of GQDs/CdS composites by physical mixing of GQDs and CdS. The structures, morphologies, and optical properties were characterized by physical methods. GQDs/CdS composites showed high photocatalytic performance in degradation of high concentrations of RhB, with visible light as light source. Based on the above results, a possible mechanism of the RhB degradation over GQDs/CdS composites was also proposed. The load of GQDs promoted the separation of carriers and charge transfer efficiency, accelerating the visible light degradation of dye RhB. This study would facilitate our insight into a new strategies to improve the effectiveness of water purification.
2. Experimental
2.1. Chemicals and reagents
Trinitropyrene (purity: 98%) and RhB were purchased from TCI (Shanghai, China). Cd(NO3)2, thiourea, ethylenediamine, and ammonia were analytically pure and supplied by Sinopharm Chemical Reagent Co., Ltd (Shanghai, China). All chemicals and reagents were used without further purification. Deionized water was used in all experiments.2.2. Synthesis of CdS nanobelts
The CdS nanobelts were synthesized by a simple solvothermal process. The typical experiment was as follows: 2.5 g Cd(NO3)2 and 2 g thiourea were mixed. Next, 50 mL ethylenediamine was added into the above mixture and stirred uniformly, then, the well-mixed liquid was transferred into a Teflon-lined stainless steel autoclave, and reacted at 200 °C for 60 h. After cooling naturally to room temperature, the products were washed with water and centrifuged several times until the centrifugal effluent was neutral. Finally, the sediment was washed with absolute ethanol, dried, resulting in CdS nanobelts as a fine yellow powder.2.3. Synthesis of aminated GQDs
The low cost hydrocarbon pyrene (C16H10) was used as precursor of graphene quantum dots. 2.0 g of pyrene dissolved in to 160 mL HNO3 and stirred with a magnetic stir under reflux at 80 °C for 12 h. Then, the solution was left to cool to room temperature, after which the mixture was diluted with distilled water. Next, the solution was filtered with a 0.22 μm microporous membrane to remove the liquid, and washed with water three times. The yellow product was 1,3,6-trinitropyrene. 0.1 g of 1, 3, 6-trinitropyrene was uniformly dispersed in 10 mL deionized water through ultrasonication, then 1 mL of ammonia was slowly added dropwise into the above solution while stirring. Then, the suspension was transferred into a Teflon-lined stainless steel autoclave, and reacted at 200 °C for 12 h. Finally, the aminated GQDs in solution were obtained by filtering the product through a 0.22 μm microporous membrane to remove traces of insoluble impurities.362.4. Preparation of aminated GQDs/CdS composites
The aminated GQDs/CdS composite was prepared by a simple hydrothermal deposition. 0.5 g of CdS was dispersed into different amounts of the aminated GQDs solution via ultrasonication to form a suspension, then was heated under intense magnetic stirring until the solvent completely volatilized. The yellow deposition was washed with water and absolute ethanol, dried, leaving behind the aminated GQDs/CdS composite. The weight ratios of aminated GQDs to CdS were 0%, 0.5%, 1%, 2%, 3%, 4%, and they were named CdS, CdS-0.5, CdS-1, CdS-2, CdS-3 and CdS-4, respectively. Previous literature reveals that NH2-functionalized GQDs improve CO2-to-CH4 selectivity effectively.37 Here the aim of amination of GQDs/CdS is to achieve efficient charge carrier separation and transfer, enhancing the photocatalytic activity of catalysts.382.5. Characterization
The structure and crystallinity of as-prepared catalysts were analyzed by a D8 Bruker X-ray diffractometer (Bruker Corporation, Billerica, USA). The X-ray photoelectron spectroscopy (XPS) measurements were obtained by a PHI 5000C ESCA System X-ray photoelectron spectroscopy (Physical Electronic Corporation, Tumwater, USA). Nitrogen adsorption–desorption measurements were carried out by an automated gas sorption analyzer (QuadraSorb SI, Quantachrome Corporation, Boynton Beach, USA). A Hitachi U4100 UV-vis spectrophotometer equipped with an integrating sphere (Hitachi Ltd., Tokyo, Japan) was used to record the UV-vis diffuse reflectance spectra. The morphology of catalysts was investigated by A Quanta 200 FEG scanning electron microscope (SEM, FEI Corporation, Hillsboro, USA). Electron paramagnetic resonance (EPR) measurement was conducted in a JEOL JES FA200 EPR Spectrometer (JEOL Ltd., Akishima, Japan). The concentration of dyes were measured by UV-vis spectrophotometer (TU-1901, Beijing Purkinje General Instrument Co., Ltd., Beijing, China). Transmission electron microscopy (TEM) measurements were investigated by transmission electron microscope (Hitachi HT7700, Hitachi Limited, Japan). Electrochemical impedance spectroscopy (EIS) analyses were performed in the Autolab (AUT88032) electrochemical workstation (Metrohm, Switzerland).2.6. Photocatalytic degradation of RhB dye
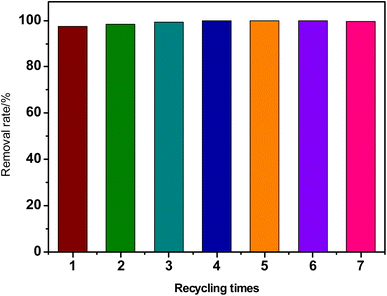
The RhB dye was used as a simulated pollutant to assay the photocatalytic activity of the synthesized catalysts under visible light. Briefly, a certain amount of aminated GQDs/CdS composites were mixed with 50 mL of RhB dye solution (initial concentration: 20–150 mg L−1), the solution was adjusted to required pH range and stirred in the dark for 1 h to achieve the adsorption/desorption equilibrium between dye and catalyst. Then, the catalyst/dye mixture was transferred onto a multi-position photochemical reaction system (Zhongjiao Jinyuan Technology Co., Ltd., Beijing, China) and irradiated by a xenon lamp. The sample mixtures were collected for an interval time and filtered with a 0.22 μm microporous membrane. Finally, the concentration of RhB in the liquid samples were measured by UV-vis spectrophotometer to calculate overall degradation of RhB dye. The reusability experiment was carried out under conditions of: catalyst dosage: 0.05 g, RhB concentration: 50 mg L−1, pH: 3.0 and reaction time: 150 min. When the catalytic reaction was completed, the suspension containing catalyst and residual dye was centrifuged for 15 min, the remaining solution was discarded. Then the catalyst was transferred into reaction tube with the help of stirring rod and RhB solution (rinse the catalyst). Then the next round of reaction was performed after adsorption equilibrium.The removal efficiency was calculated by using eqn (1).
| Removal efficiency (%) = (1 − C/Co) × 100 | (1) |
The reaction kinetics for RhB over CdS with different GQDs loading were fitted by pseudo first-order kinetics model, which was as the following eqn (2).
| −ln(C/Co) = k1t | (2) |
3. Results and discussion
3.1. Characterization
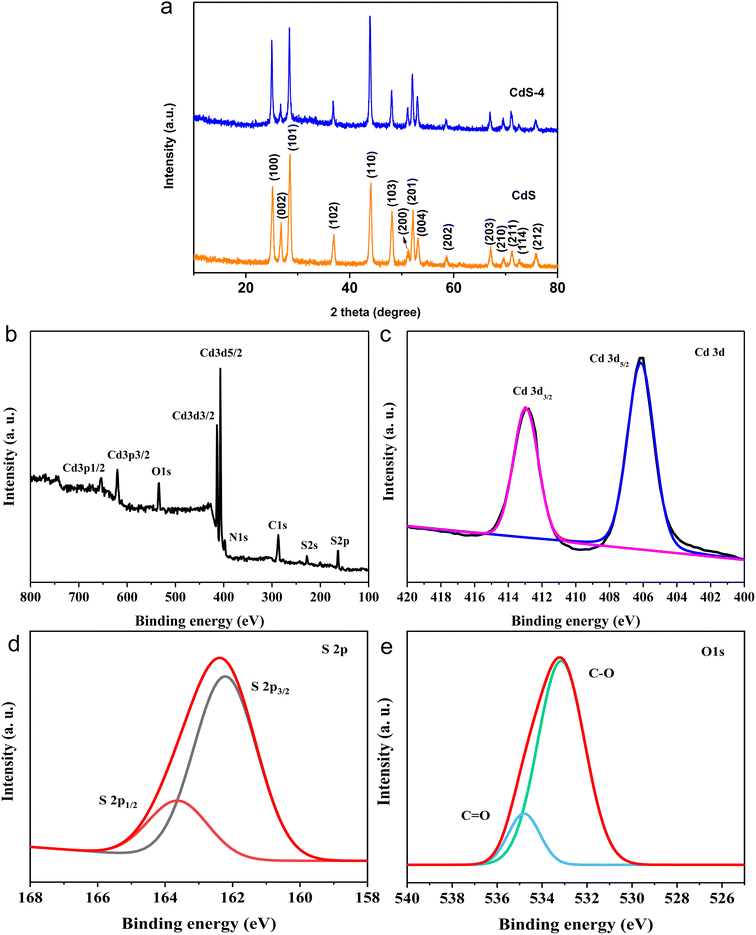 | ||
| Fig. 1 (a) XRD pattern of CdS and CdS-4. (b) XPS survey spectrum, (c) high-resolution XPS spectrum of Cd 3d, (d) high-resolution XPS spectra of S 2p, (e) high-resolution XPS spectra of O 1s of CdS-4. | ||
The XPS analysis was used to investigate the chemical composition and chemical interactions between GQDs and CdS. Fig. 1b shows the XPS survey spectrum of CdS-4, which reveals that strong signals characteristic of the Cd 3d, S 2p, C 1s, N 1s, and O 1s electrons that were detected from the surface of sample. The signals of Cd 3d and S 2p electrons come from CdS, whereas C 1s and O 1s signals originate from GQDs.24 The XPS of Cd 3d can be deconvoluted into two peaks at 406.14 eV and 412.96 eV, associated with the Cd 3d5/2 and Cd 3d3/2 configurations, respectively (Fig. 1c). Fig. 1d shows two peaks at 162.20 eV and 163.66 eV, assigned to the S 2p3/2 and S 2p1/2 electrons, respectively, which are in agreement with a typical value for metal sulfides.42,43 The C 1s spectra can be fitted by three characteristic peaks, which locate at 285.60, 288.0, and 289.60 eV, respectively. They are assigned to the C–C/C![[double bond, length as m-dash]](https://www.rsc.org/images/entities/char_e001.gif) C, C–N/C–O, and C
C, C–N/C–O, and C![[double bond, length as m-dash]](https://www.rsc.org/images/entities/char_e001.gif) O binding modes, respectively (Fig. S3†).44–46 In Fig. 1e, the high-resolution XPS spectra of O 1s can be separated into C–O47 and C
O binding modes, respectively (Fig. S3†).44–46 In Fig. 1e, the high-resolution XPS spectra of O 1s can be separated into C–O47 and C![[double bond, length as m-dash]](https://www.rsc.org/images/entities/char_e001.gif) O at 533.04 and 534.74 eV.
O at 533.04 and 534.74 eV.
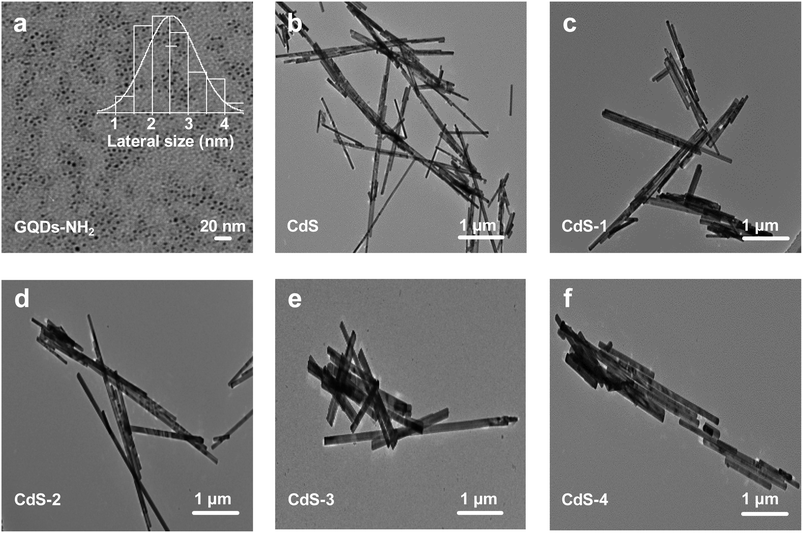
The TEM images of these samples are shown in Fig. 2. The as-synthesized amination-GQDs are uniform and monodispersed nanodots, their average lateral sizes are 2.53 nm (Fig. 2a). The TEM image of CdS exhibits nanobelt morphology with length in the range from 0.18 up to several microns (Fig. 2b). After loading by different amounts of GQDs, the diameter of these samples is larger than that of CdS, but their length becomes shorter (Fig. 2c–f).
 | ||
| Fig. 3 (a) N2 adsorption–desorption isotherm curves, (b) the corresponding pore diameter distribution curve, (c) UV-vis diffuse reflectance spectra of CdS and CdS-4. | ||
To investigate the optical properties of the as-prepared catalysts, UV-vis diffuse reflectance spectra (DRS) of the two samples were measured, and are presented in Fig. 3c. The absorption wavelengths of CdS and CdS-4 are both mainly concentrated in the 200–500 nm region. But there are differences in the absorption boundary, with edges at about 539 nm (CdS), 520 nm (CdS-4), respectively. This shift may be due to effects from GQDs doped into the CdS. Furthermore, the peak of CdS-4 is red shifted, and there is enhanced absorption in the 520–800 nm region relative to pure CdS, indicating that introduction of GQDs has improved the overall optical response, consistent with previous results.24
3.2. Photocatalytic activity
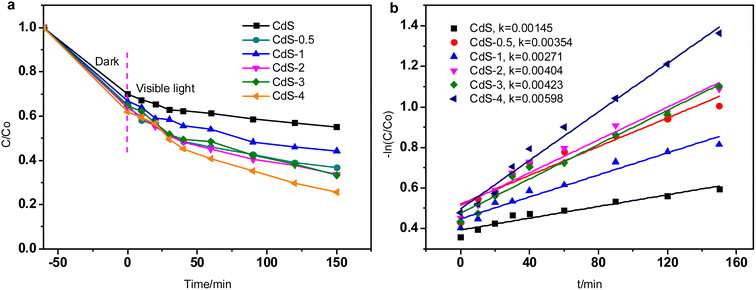 | ||
| Fig. 4 (a) Effect of GQDs loading over CdS on photocatalytic performance, (b) kinetic simulations (dosage: 0.03 g, pH 7.0, initial concentration: 50 mg L−1). | ||
The reaction kinetics for RhB over CdS with different GQDs loading were calculated. The fitting results (Fig. 4b) are consistent with pseudo first-order kinetics model. The kinetic rate of CdS-4 is the highest (0.00598 min−1), which proves that appropriate loading amounts of aminated GQDs can effectively enhance the utilization of visible light and further improve the photocatalytic performance of the catalyst.
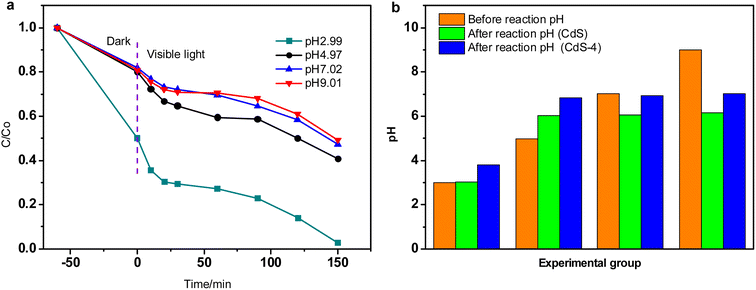 | ||
| Fig. 5 (a) Effect of pH value on RhB degradation, (b) comparison of pH value before and after reaction (dosage: 0.05 g, initial concentration: 50 mg L−1). | ||
The comparison of pH value before and after reaction is displayed in Fig. 5b. In the CdS system, it can be seen that the pH values are all about 6 after reaction when the initial pH varies from 4.97 to 9.01. However, when the initial pH value is 2.99, it is almost unchanged after reaction, which is 3.03. In the case of CdS-4 system, after reaction, the pH values of the remaining solution are 3.79, 6.84, 6.93 and 7.03, while their corresponding initial pH values are 2.99, 4.97, 7.02 and 9.01, respectively. These results suggest that the amino-GQDs plays an important role in increasing pH at strong acid condition, or helping to form a pH neutral environment when the initial pH varies in range of 5.0–9.0, but the causes for these phenomenons still need to be further explored.
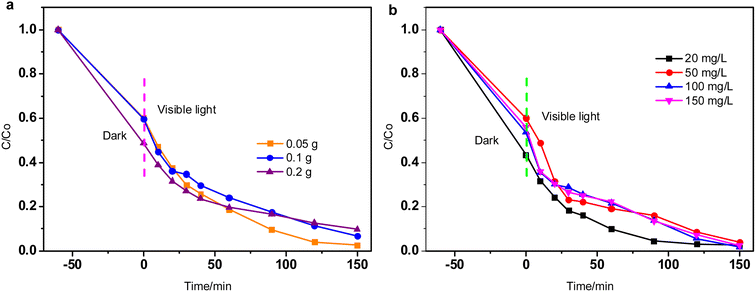 | ||
| Fig. 6 Effect of catalyst dosage (a) and initial concentration of RhB (b) on photocatalytic performance. | ||
The effect of initial RhB concentration (20–150 mg L−1) on the photocatalytic performance of CdS-4 was studied at a fixed solution pH of 3 and catalyst dose of 0.2 g, the result is displayed in Fig. 6b. It is observed that when the concentration of RhB is low (20 mg L−1), the highest degradation speed can be achieved within 120 min. The rate of degradation decreases with the increase of initial RhB concentration, which is due to the blanket effect, the active sites of the catalyst surface are covered by more dye molecules so as to reduce the main active species.55
In a word, the optimal photocatalytic conditions are as follows: catalyst: CdS-4, catalyst dosage: 0.05 g, RhB concentration: 50 mg L−1, pH: 3.0 and reaction time: 150 min.
3.3. Possible mechanism of photocatalytic degradation
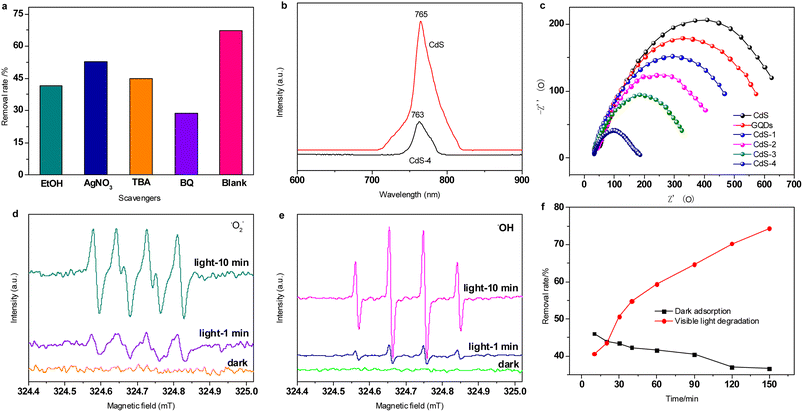
To further explore the photocatalytic process, the mechanism for photo-activated degradation of RhB was explored. To investigate the main reactive species generated in the visible light-generated photocatalytic degradation process, radical scavenging experiments were carried out using ethanol (EtOH), AgNO3, tert-butyl alcohol (TBA), p-benzoquinone (BQ) as the quencher of hole (h+), electron (e−), hydroxyl radical (˙OH) and superoxide radical anions (˙O2−), respectively. As shown in Fig. 8a, the removal rate of RhB significantly decreases from 67.09% (blank) to 41.53% (EtOH), 52.77% (AgNO3), 44.73% (TBA), 28.75% (BQ) with the addition of quencher. This result shows that the h+, e−, ˙OH and ˙O2− are the reactive oxidative species (ROS), the addition of quenchers hinder the photodegradation of RhB. Among them, BQ shows the highest inhibition effect for RhB, indicating that ˙O2− are the most important reactive species in photocatalytic reaction, and the h+ plays a secondary role.Fig. 8b displays the PL spectra (excitation at 390 nm) of the CdS and CdS-4 samples. The CdS sample shows a strong PL emission peak centered at about 765 nm, which is caused by the recombination of electron–hole pairs in the CdS. Once GQDs are added, the fluorescent intensity drops dramatically, and the main emission peak exhibits blue-shift to about 763 nm. The reduction of the fluorescent intensity can be attributed to lower charge recombination processes, indicating more efficient separation of the electron–hole pair in CdS due to GQDs. This phenomenon suggests that improved yield of the charge-separated state of the CdS active site will enhance overall photocatalytic activity and organic pollutant degradation rates.
The efficient separation of the electron–hole pair over CdS-4 sample was further analysed by EIS, and compared with other GQDs/CdS samples. As shown in the EIS Nyquist plots results (Fig. 8c), the arc radius of CdS-4 is the smallest among these catalysts, implying that the highest charge-transfer capacity is presented in the interface between CdS-4 and electrolyte solution so as to effectively prevent the recombination of photo-produced electron–hole pairs, that is vital for enhanced photocatalytic efficiency, which is also in agreement with the results of PL and dye degradation.
To further characterize the radical species, EPR spectroscopy was performed to detect formation of either hydroxyl radicals (˙OH) or superoxide radical anions (˙O2−) produced by CdS-4 under visible light, using DMPO as trapping agent (Fig. 8d and e). DMPO can react with either radical species to generate a unique EPR signal that is diagnostic of either ˙OH or ˙O2− formation. Under dark conditions, no signals were observed, indicating that no ROS were produced by the CdS-4 catalyst without light irradiation. However, both samples show increasing signals with increasing illumination time from 1 min to 10 min. After 10 min of visible light irradiation, four peaks with relative peak heights of approximately 1![[thin space (1/6-em)]](https://www.rsc.org/images/entities/char_2009.gif) :
:![[thin space (1/6-em)]](https://www.rsc.org/images/entities/char_2009.gif) 1
1![[thin space (1/6-em)]](https://www.rsc.org/images/entities/char_2009.gif) :
:![[thin space (1/6-em)]](https://www.rsc.org/images/entities/char_2009.gif) 1
1![[thin space (1/6-em)]](https://www.rsc.org/images/entities/char_2009.gif) :
:![[thin space (1/6-em)]](https://www.rsc.org/images/entities/char_2009.gif) 1 can be observed (Fig. 8d), which are assigned to the DMPO–˙O2− peak, while four peaks with an intensity ratios of 1
1 can be observed (Fig. 8d), which are assigned to the DMPO–˙O2− peak, while four peaks with an intensity ratios of 1![[thin space (1/6-em)]](https://www.rsc.org/images/entities/char_2009.gif) :
:![[thin space (1/6-em)]](https://www.rsc.org/images/entities/char_2009.gif) 2
2![[thin space (1/6-em)]](https://www.rsc.org/images/entities/char_2009.gif) :
:![[thin space (1/6-em)]](https://www.rsc.org/images/entities/char_2009.gif) 2
2![[thin space (1/6-em)]](https://www.rsc.org/images/entities/char_2009.gif) :
:![[thin space (1/6-em)]](https://www.rsc.org/images/entities/char_2009.gif) 1 are ascribed to the formation of ˙OH under illumination (Fig. 8e).54 The very intense DMPO–˙O2− and DMPO–˙OH signals indicate that ˙O2− and ˙OH may both be involved in the visible light catalytic degradation.
1 are ascribed to the formation of ˙OH under illumination (Fig. 8e).54 The very intense DMPO–˙O2− and DMPO–˙OH signals indicate that ˙O2− and ˙OH may both be involved in the visible light catalytic degradation.
The photo-adsorption effects of the catalyst was discussed. The photolysis and adsorption experiments were conducted in the same photocatalytic reaction instrument, the difference was that photocatalysis was carried out under visible light, while the adsorption process was in dark. The results show that RhB adsorption efficiency by CdS-4 reaches 46.5% after 10 min of dark adsorption, and the removal efficiency achieves 40.58% after 10 min of visible irradiation (Fig. 8f). The adsorption capacity in dark gradually decreases with the increase of adsorption time, which is due to desorption. While the degradation rate of dye is more than 74% under photocatalysis in 150 min. This catalyst exhibits good photocatalytic activity as well as adsorption capacity. Thus, RhB dye is removed not only by ROS, but also by synergistic adsorption-photocatalysis process.
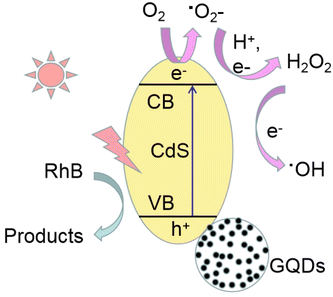
Based on these results, a possible mechanism for photocatalytic degradation by CdS-4 under visible light is proposed in Fig. 9. First, visible light initiates photoexcitation of the CdS-4 to generate electrons and holes, and the high energy react with O2 in solution to form ˙O2−. Next, ˙O2− reacts with H+ and e− to produce H2O2, H2O2 then captures electrons from step (3) to form ˙OH. These ROS then can effectively degrade the RhB dye. During this process, the GQDs can provide a rapid electron transfer pathway to reach efficient charge separation.24 GQDs mainly act as electron acceptor instead of a photosensitizer in improving photocatalytic performances of GQDs/CdS.24 The overall chemical reaction of the photocatalytic degradation of RhB can be inferred as follows:
| GQDs/CdS + hν → e− + h+ | (3) |
| O2 + e− → ˙O2− | (4) |
| ˙O2− + 2h+ + e− → H2O2 | (5) |
| H2O2 + e− → ˙OH + OH+ | (6) |
| ˙O2−/h+/e−/˙OH + RhB → degradation products | (7) |
4. Conclusion
In summary, a GQDs/CdS catalyst was prepared via solvothermal and hydrothermal deposition and applied to degrade RhB dye. The photocatalytic activity of CdS was significantly improved by coupling with GQDs. The UV-vis diffuse reflectance and PL spectrum of GQDs/CdS showed excellent visible-light absorption properties and high electron–hole separation efficiency. The best degradation rate was achieved with CdS-4, and 0.05 g catalyst at pH 3. Then, radical trap experiments found evidence for h+, e−, ˙OH and ˙O2− as the main reactive species, RhB dye was removed via reactive oxidative species and synergistic adsorption-photocatalysis process. Finally, we have taken these results to propose a mechanistic model for the photodegradation of RhB by CdS-4.Author contributions
X. L. and M. C. contributed equally to conceptualization, investigation, methodology, resources, formal analysis, writing-original draft, and writing, review and editing; funding acquisition conceptualization, review and supervision. Y. C., D. Z. and H. G. contributed investigation, methodology, writing – original draft, writing – review & editing. W. L. contributed investigation and methodology.Conflicts of interest
The authors declare no conflicts.Acknowledgements
This work was supported by National Natural Science Foundation of China (project no. 21166005), the Young and Middle-aged Basic Capability Promotion from College of Guangxi (grant number: 2021KY1269 and 2017KY077), Natural Science Foundation of Guangxi (grant number: 2017GXNSFBA198216), Guangxi Innovation Driven Developments Project (grant number: Guike AA20161002-1).References
- K. Tsuchid, H. Okumura, T. Ikarashi and Y. Takahashi, J. Photochem. Photobiol., A, 2022, 433, 114163 CrossRef.
- S. Keerthana, R. Yuvakkumar, G. Ravi, M. Manimegalai, M. Pannipara, A. G. Al-Sehemi, R. A. Gopal, M. M. Hanafiah and D. Velauthapillai, Environ. Res., 2021, 199, 111312 CrossRef CAS PubMed.
- M. Ahmad, M. T. Qureshi, W. Rehman, N. H. Alotaibi, A. Gul, R. S. A. Hameed, M. A. E. Elaimi, M. F. H. Abdel-kader, M. Nawaz and R. Ullah, J. Alloys Compd., 2022, 895, 162636 CrossRef CAS.
- M. Danish and M. Muneer, Ceram. Int., 2021, 47, 13043–13056 CrossRef CAS.
- A. Ghafoor, I. Bibi, S. Ata, F. Majid, S. Kamal, M. Iqbal, S. Iqbal, S. Noureen, B. Basha and N. Alwadai, J. Mol. Liq., 2021, 343, 117581 CrossRef CAS.
- G. E. Ezzatpour, W. Marc and W. I. Richard, Dalton Trans., 2023, 52, 11143–11157 RSC.
- E. N. Zare, S. Iftekhar, Y. Park, J. Joseph, V. Srivastava, M. A. Khan, P. Makvandi, M. Sillanpaa and R. S. Varma, Chemosphere, 2021, 280, 130907 CrossRef CAS PubMed.
- M. M. Gul and K. S. Ahmad, Rev. Inorg. Chem., 2021, 42(4), 337–354 CrossRef.
- A. G. Akerdi and S. H. Bahrami, J. Environ. Chem. Eng., 2019, 7, 103283 CrossRef CAS.
- J. Fu, J. Yu, C. Jiang and B. Cheng, Adv. Energy Mater., 2018, 3, 1701503 CrossRef.
- R. Guo, J. Wang, Z. Bi, X. Chen, X. Hu and W. Pan, Chemosphere, 2021, 295, 133834 CrossRef PubMed.
- X. Fan, S. Zhang, R. Guan, X. Shao, S. Jiang, Y. Hu, S. Wang and Q. Yu, J. Mol. Struct., 2022, 1252, 132163 CrossRef CAS.
- A. Khan, Z. Rehman, A. Khan, H. Ambareen, H. Ullah, S. M. Abbas, Y. Khan and R. Khan, Inorg. Chem. Commun., 2017, 79, 99–103 CrossRef CAS.
- S. Y. Janbandhu, C. T. Suhaila, S. R. Munishwar, J. R. Jayaramaiah and R. S. Gedam, Chemosphere, 2022, 286, 131672 CrossRef CAS.
- X. Xu, L. Hu, N. Gao, S. Liu, S. Wageh, A. A. Al-Ghamdi, A. Alshahrie and X. Fang, Adv. Funct. Mater., 2015, 25, 445–454 CrossRef CAS.
- T. Fan, Y. Li, J. Shen and M. Ye, Appl. Surf. Sci., 2016, 367, 518–527 CrossRef CAS.
- Y. Lin, D. Tsai, Z. Chang and F. Shieu, Appl. Surf. Sci., 2018, 440, 1227–1234 CrossRef CAS.
- F. Jiang, T. Yan, H. Chen, A. Sun, C. Xu and X. Wang, Appl. Surf. Sci., 2014, 295, 164–172 CrossRef CAS.
- N. Kumar and V. Dutta, Appl. Surf. Sci., 2014, 288, 172–179 CrossRef CAS.
- N. Bao, L. Shen, T. Takata and K. Domen, Chem. Mater., 2008, 20, 110–117 CrossRef CAS.
- J. Yu, Y. Yu and B. Cheng, RSC Adv., 2012, 2, 11829–11835 RSC.
- Y. Guo, J. Wang, Z. Tao, F. Dong, K. Wang, X. Ma, P. Yang, P. Hu, Y. Xu and L. Yang, CrystEngComm, 2012, 14, 1185–1188 RSC.
- A. C. Kuriakose, V. Nampoori and S. Thomas, Mater. Chem. Phys., 2021, 258, 123911 CrossRef CAS.
- Y. Lei, C. Yang, J. Hou, F. Wang, S. Min, X. Ma, Z. Jin, J. Xu, G. Lu and K. Huang, Appl. Catal., B, 2017, 216, 59–69 CrossRef CAS.
- F. Wang, Y. Liao, T. Li and L. Xi, Sep. Purif. Technol., 2022, 299, 121707 CrossRef CAS.
- H. Xia, X. Xu and D. Li, J. Alloys Compd., 2022, 914, 165393 CrossRef CAS.
- X. Li, A. Xu, H. Fan, X. Liu, J. Wang, J. Cao, L. Yang and M. Wei, J. Power Sources, 2022, 545, 231923 CrossRef CAS.
- H. Fu, H. Zhao, X. Yang, S. Xiong and X. An, Powder Technol., 2022, 406, 117596 CrossRef CAS.
- H. Qiu, X. Qu, X. Zhang, S. Chen and Y. Shen, Adv. Mater., 2023, 35, 2302326 CrossRef CAS PubMed.
- T. Zhang, W. Li, K. Huang, H. Guo, Z. Li, Y. Fang, R. M. Yadav, V. Shanov, P. M. Ajayan, L. Wang, C. Lian and J. Wu, Nat. Commun., 2021, 12, 5265 CrossRef CAS PubMed.
- I. Ibrahim, H. Lim, N. Huang, Z. Jiang and M. Altarawneh, J. Hazard. Mater., 2020, 391, 122248 CrossRef CAS PubMed.
- C. Wang, S. Li, M. Cai, R. Yan, K. Dong, J. Zhang and Y. Liu, J. Colloid Interface Sci., 2022, 619, 307–321 CrossRef CAS PubMed.
- L. Zhou, H. Guo, Z. Wang and L. Wang, Carbon, 2023, 213, 118249 CrossRef CAS.
- M. Fan, Z. Wang, K. Sun, A. Wang, Y. Zhao, Q. Yuan, R. Wang, J. Raj, J. Wu, J. Jiang and L. Wang, Adv. Mater., 2023, 35, 2209086 CrossRef CAS PubMed.
- C. Santos, L. Rodríguez-Perez, G. Gonçalves, S. Pinto, M. Melle-Franco, P. Marques, M. Faustino, M. Herranz, N. Martin, M. Neves, J. Martinho and E. Maçoas, Carbon, 2020, 166, 164–174 CrossRef CAS.
- H. Zhang, J. Gu, Y. Zhang, H. Guo, S. Zhang, J. Song, C. Liu, L. Wang, D. Li and B. Dai, ACS Nano, 2023, 17, 10129–10141 CrossRef CAS PubMed.
- R. Yadav, Z. Li, T. Zhang, O. Sahin, S. Roy, G. Gao, H. Guo, R. Vajtai, L. Wang, P. M. Ajayan and J. Wu, Adv. Mater., 2022, 34, 2105690 CrossRef CAS PubMed.
- Y. Huang, J. Zhang, K. Dai, C. Liang and G. Dawson, Ceram. Int., 2022, 148, 8423–8432 CrossRef.
- V. Kumar, N. Singh, S. Jana, S. K. Rout, R. K. Dey and G. P. Singh, Int. J. Hydrogen Energy, 2021, 46, 16373–16386 CrossRef CAS.
- Z. Zhang, M. Wang, H. Zhou and F. Wang, J. Am. Chem. Soc., 2021, 143, 6533–6541 CrossRef CAS PubMed.
- S. Min, J. Hou, Y. Lei, X. Ma and G. Lu, Appl. Surf. Sci., 2017, 396, 1375–1382 CrossRef CAS.
- Y. Sun, X. Yuan, Y. Wang, W. Zhang, Y. Li, Z. Zhang, J. Su, J. Zhang and S. Hu, Appl. Surf. Sci., 2022, 576, 151901 CrossRef CAS.
- F. Nekouei, S. Nekouei, M. Pouzesh and Y. Liu, Chem. Eng. J., 2020, 385, 123710 CrossRef CAS.
- F. Nekouei, S. Nekouei and H. Kargarzadeh, Chem. Eng. J., 2018, 335, 567–578 CrossRef CAS.
- X. Shen, Z. Wang, H. Guo, Z. Lei, Z. Liu and L. Wang, Small, 2023, 2303156 CrossRef CAS PubMed.
- H. Wu, J. Ding, D. Yang, J. Li, Y. Shi and Y. Zhou, Ceram. Int., 2020, 146, 17800–17808 CrossRef.
- Z. Wang, G. Li, W. Hou, H. Guo, L. Wang and M. Wu, ACS Nano, 2023, 17, 8671–8679 CrossRef CAS PubMed.
- H. Choi, W. Chen and P. Kamat, ACS Nano, 2012, 6(5), 4418–4427 CrossRef CAS PubMed.
- J. Chen, J. Wu, P. Wu and D. Tsai, J. Phys. Chem. C, 2011, 115(1), 210–216 CrossRef CAS.
- Y. Xue, Q. Chang, X. Hu, J. Cai and H. Yang, J. Environ. Manage., 2020, 274, 111184 CrossRef CAS PubMed.
- X. Wang, Y. Li and S. Yi, Acta Mater. Compositae Sin., 2022, 39(8), 3845–3851 Search PubMed.
- F. Chen, J. Zhao and H. Hidaka, Int. J. Photoenergy, 2003, 5, 209–217 CrossRef CAS.
- C. Zhao, Y. Chen, C. Li, Q. Zhang, P. Chen, K. Shi, Y. Wu and Y. He, J. Phys. Chem. Solids, 2020, 136, 109122 CrossRef CAS.
- Y. Wang, C. Yang, Y. Zhang, L. Guo, Y. Wang, G. Gao, F. Fu, B. Xu and D. Wang, Int. J. Hydrogen Energy, 2022, 47, 9566–9578 CrossRef CAS.
- N. Kumari, S. Chintakula, I. Anantha and S. Maddila, Results Chem., 2023, 5, 100759 CrossRef CAS.
Footnote |
| † Electronic supplementary information (ESI) available: Fig. S1: SEM image of CdS nanobelt. Fig. S2: SEM image of CdS-4. Fig. S3: high-resolution XPS spectra of C 1s of CdS-4 composite. See DOI: https://doi.org/10.1039/d3ra06454a |
| This journal is © The Royal Society of Chemistry 2024 |

