 Open Access Article
Green synthesis of ethyl cinnamates under microwave irradiation: photophysical properties, cytotoxicity, and cell bioimaging†
Miguel Angel Aztatzi-Mendoza a,
Edgar Leonel Porras-Núñeza,
Verónica M. Rivas-Galindob,
Pilar Carranza-Rosalesc,
Irma Edith Carranza-Torresc,
Catalina García-Vielmac,
Iran F. Hernández Ahuactzid,
Susana López-Cortina
 a,
Israel López
 *e and
Eugenio Hernández-Fernández
 *a
*a
aUniversidad Autónoma de Nuevo León, UANL, Facultad de Ciencias Químicas, Pedro de Alba s/n, Ciudad Universitaria, 66450 San Nicolás de los Garza, Nuevo León, Mexico. E-mail: eugenio.hernandezfr@uanl.edu.mx; Fax: +52-81-83294000; Tel: +52-81-83294000 ext. 6293
bUniversidad Autónoma de Nuevo León, UANL, Facultad de Medicina, Fco. I. Madero s/n, Mitras Centro, 64460 Monterrey, Nuevo León, Mexico
cCentro de Investigación Biomédica del Noreste, Instituto Mexicano del Seguro Social, Monterrey 64720, Nuevo León, Mexico
dCentro Universitario de Tonalá, Universidad de Guadalajara, Av. Nuevo Periférico 555, Ejido San José Tatepozco, Tonalá 45425, Jalisco, Mexico
eUniversidad Autónoma de Nuevo León (UANL), Facultad de Ciencias Químicas, Centro de Investigación en Biotecnología y Nanotecnología, Laboratorio de Nanociencias y Nanotecnología, Autopista al Aeropuerto Internacional Mariano Escobedo Km. 10, Parque de Investigación e Innovación Tecnológica, 66629 Apodaca, Nuevo León, Mexico. E-mail: israel.lopezhr@uanl.edu.mx; Fax: +52-81-83294000; Tel: +52-81-83294000 ext. 4202
First published on 11th January 2024
Abstract
A simple and green method for the synthesis of six ethyl cinnamates was performed via Horner–Wadsworth–Emmons reaction under microwave irradiation. The photoluminescent properties of all compounds in ethyl acetate solutions were evaluated demonstrating that all compounds exhibit fluorescence. Five compounds exhibited blue emissions in the 369–442 nm range, and another compound exhibited blue-green emission at 504 nm. This last compound showed the largest Stokes shift (134 nm), and the highest quantum yield (17.8%). Two compounds showed extinction coefficient values (ε) higher than 30![[thin space (1/6-em)]](https://www.rsc.org/images/entities/char_2009.gif) 000 M−1 cm−1, which are appropriate for cell bioimaging applications. In this sense, cytotoxicity assays were performed using Vero cells at different concentrations; the results showed that these compounds were not cytotoxic at the highest concentration tested (20 μg mL−1). Finally, the analysis by fluorescence microscopy for localization and cellular staining using Vero cells demonstrated that the compounds stained the cytoplasm and the nuclei in a selective way.
000 M−1 cm−1, which are appropriate for cell bioimaging applications. In this sense, cytotoxicity assays were performed using Vero cells at different concentrations; the results showed that these compounds were not cytotoxic at the highest concentration tested (20 μg mL−1). Finally, the analysis by fluorescence microscopy for localization and cellular staining using Vero cells demonstrated that the compounds stained the cytoplasm and the nuclei in a selective way.
1. Introduction
The luminescent organic compounds with a π-conjugated system between electron donor (D) and acceptor (A) groups have attracted interest because of their easy purification,1 high solubility in organic solvents,2 high quantum efficiency,3 high molecular and thermal stability,4 and availability of greener synthetic routes to obtain them. These properties allow their application in organic light-emitting diodes,5 medicinal chemistry,6 fluorescence imaging,7 organic field-effect transistors,8 organic solar cells,9 polymer science,10 forensic science,11 and chemical sensors.12The application of a fluorescent compound will depend on its properties such as solubility in organic solvents, lipophilicity, chemical reactivity, and photophysical properties namely absorption (λabs) and emission (λabs) wavelengths, extinction coefficient (ε), quantum yield (Φ), large achievable Stokes shift, remarkable resistance to photobleaching, lifetime of the excited state, and photostability. Therefore, when these properties reach adequate values in fluorescent organic compounds and proteins, the latter can be used in specific applications such as single molecule tracking, and multicolor bioimaging.13–21 Fluorescence bioimaging has been of great importance in biomedical, biological, and related sciences because of its essential contributions to understanding life sciences. It is a non-invasive technique that possesses high resolution and allows different intracellular processes to be observed in real time. In recent decades, fluorescent organic compounds have been designed and synthetized with diverse applications including molecular dyes,22 fluorescent proteins,23 and luminescent polymers,24,25 among others. Predominantly, long-term tracking of cells is a great tool in the investigation of biological processes, pathological pathways, and long-term drug therapeutic effects.26,27 Nowadays, the synthesis of high performance deep-blue fluorophores is of great interest.28 These blue emitters must exhibit a remarkable efficiency, color purity and stability.29 The extensive research on deep-blue compounds is currently focused on increasing the efficiency and lifetime of the devices, because these features are lower than those of red and green devices, reaffirming the interest in obtaining high performance deep-blue molecules.30 The electron donating and withdrawing groups in the emitter structure help to improve their performance.31 In some cases, the deep-blue fluorophores exhibit multifunctional properties,32 such as an efficient reduction of energy consumption,33 an increase in color gamut and the ability of being the host of other large-wavelength fluorophores.34
Previous reports have shown that the synthesis of α,β-unsaturated esters can be achieved through conventional synthesis including Wittig and Horner–Wadsworth–Emmons (HWE) reactions, however they involved prolonged reaction times.35–41 In this paper, we present the synthesis of α,β-unsaturated esters via the HWE reaction assisted by microwave irradiation, due to the advantages that this method present, using the appropriate aromatic aldehydes with triethyl phosphonoacetate. The photophysical properties of the fluorescent compounds were studied and the emitters that showed the best performance were tested in cell bioimaging.
2. Experimental section
2.1 Material and equipment
All chemicals and solvents were purchased from commercial sources, and they were used as received. An Electrothermal Mel-Temp apparatus was used to determine the melting points. Thin-layer chromatography was used to follow the progress of the reactions. Column chromatography was used to purify the products using silica gel as the stationary phase. The 1H and 13C NMR spectra were obtained using chloroform-d (CDCl3) with tetramethylsilane (TMS) as the solvent and the internal reference, respectively. The NMR spectra were acquired on a Bruker Avance III HD 400 MHz NMR spectrometer (ESI†). Chemical shifts (δ) are reported in ppm and the coupling constants (J) are reported in Hertz (Hz). Multiplicities are reported as: singlet (s), doublet (d), triplet (t), quartet (q), multiplet (m). Mass spectral data were obtained using ESI+ techniques (MStation). A Microwave Synthesis Reactor (Monowave 300-Anton Paar) was used to carry out the reactions under microwave irradiation in a closed system. Reagent-grade hexane, toluene, THF, ethyl acetate, dioxane, ACN, and DMSO were used as the solvent for the photophysical characterization. Absorption and emission spectra were measured using quartz cuvettes (1 cm path length) on Shimadzu 1800 and Horiba Fluoromax 4 spectrophotometers, respectively.2.2 Procedure for the synthesis of compounds 3a–f
In a 10 mL microwave vessel, the triethyl phosphonoacetate (1.0 equiv.), the corresponding aldehyde (0.7 equiv.), and potassium carbonate (1.0 equiv.) were dissolved in ethanol (3 mL). The reaction mixture was heated under microwave irradiation at 140 °C for 20 min. Next, the microwave-vessel was cooled at room temperature and the solvent was removed under vacuum. The crude product was purified by column chromatography using a mixture of EtOAc/Hex (4![[thin space (1/6-em)]](https://www.rsc.org/images/entities/char_2009.gif) :
:![[thin space (1/6-em)]](https://www.rsc.org/images/entities/char_2009.gif) 6) as eluents or by crystallization using EtOAc.
6) as eluents or by crystallization using EtOAc.
![[double bond, length as m-dash]](https://www.rsc.org/images/entities/char_e001.gif) O), 6.62 (d, J = 8.9 Hz, 2H, Harom), 7.39 (d, J = 8.9 Hz, 2H, Harom), 7.61 (d, J = 15.8 Hz, 1H,
O), 6.62 (d, J = 8.9 Hz, 2H, Harom), 7.39 (d, J = 8.9 Hz, 2H, Harom), 7.61 (d, J = 15.8 Hz, 1H, ![[double bond, length as m-dash]](https://www.rsc.org/images/entities/char_e001.gif) CHC6H4). 13C NMR (100 MHz, CDCl3): δ 12.6, 14.4, 44.4, 60.0, 111.2, 111.8, 121.4, 130.0, 145.2, 149.3, 168.1 (C
CHC6H4). 13C NMR (100 MHz, CDCl3): δ 12.6, 14.4, 44.4, 60.0, 111.2, 111.8, 121.4, 130.0, 145.2, 149.3, 168.1 (C![[double bond, length as m-dash]](https://www.rsc.org/images/entities/char_e001.gif) O). HRMS (ESI+) m/z calculated for C15H22NO2 [M + H]+ 248.16505, found 248.16563.38
O). HRMS (ESI+) m/z calculated for C15H22NO2 [M + H]+ 248.16505, found 248.16563.38![[double bond, length as m-dash]](https://www.rsc.org/images/entities/char_e001.gif) O), 6.98 (d, J = 8.7 Hz, 2H, Harom), 7.06–7.11 (m, 6H, Harom), 7.24–7.28 (m, 4H, Harom), 7.34 (d, J = 8.7 Hz, 2H, Harom), 7.62 (d, J = 15.9 Hz, 1H,
O), 6.98 (d, J = 8.7 Hz, 2H, Harom), 7.06–7.11 (m, 6H, Harom), 7.24–7.28 (m, 4H, Harom), 7.34 (d, J = 8.7 Hz, 2H, Harom), 7.62 (d, J = 15.9 Hz, 1H, ![[double bond, length as m-dash]](https://www.rsc.org/images/entities/char_e001.gif) CHC6H4). 13C NMR (100 MHz, CDCl3): δ 14.4, 60.3, 115.5, 121.8, 124.0, 125.4, 127.6, 129.2, 129.5, 144.2, 147.0, 149.8, 167.4 (C
CHC6H4). 13C NMR (100 MHz, CDCl3): δ 14.4, 60.3, 115.5, 121.8, 124.0, 125.4, 127.6, 129.2, 129.5, 144.2, 147.0, 149.8, 167.4 (C![[double bond, length as m-dash]](https://www.rsc.org/images/entities/char_e001.gif) O). HRMS (ESI+) m/z calculated for C23H22NO2 [M + H]+ 344.16505, found 344.16477.42
O). HRMS (ESI+) m/z calculated for C23H22NO2 [M + H]+ 344.16505, found 344.16477.42![[double bond, length as m-dash]](https://www.rsc.org/images/entities/char_e001.gif) O), 7.54 (s, 4H, Harom), 7.66 (d, J = 16.0 Hz, 2H,
O), 7.54 (s, 4H, Harom), 7.66 (d, J = 16.0 Hz, 2H, ![[double bond, length as m-dash]](https://www.rsc.org/images/entities/char_e001.gif) CHC6H4). 13C NMR (100 MHz, CDCl3): δ 14.3, 60.6, 119.3, 128.5, 136.1, 143.4, 166.7 (C
CHC6H4). 13C NMR (100 MHz, CDCl3): δ 14.3, 60.6, 119.3, 128.5, 136.1, 143.4, 166.7 (C![[double bond, length as m-dash]](https://www.rsc.org/images/entities/char_e001.gif) O). HRMS (ESI+) m/z calculated for C16H19O4 [M + H]+ 275.12833, found 275.12751.43
O). HRMS (ESI+) m/z calculated for C16H19O4 [M + H]+ 275.12833, found 275.12751.43![[double bond, length as m-dash]](https://www.rsc.org/images/entities/char_e001.gif) O), 6.86 (d, J = 8.8 Hz, 2H, Harom), 7.44 (d, J = 8.8 Hz, 2H, Harom), 7.62 (d, J = 15.9 Hz, 1H,
O), 6.86 (d, J = 8.8 Hz, 2H, Harom), 7.44 (d, J = 8.8 Hz, 2H, Harom), 7.62 (d, J = 15.9 Hz, 1H, ![[double bond, length as m-dash]](https://www.rsc.org/images/entities/char_e001.gif) CHC6H4). 13C NMR (100 MHz, CDCl3): δ 14.4, 48.2, 60.2, 66.7, 114.7, 125.5, 129.5, 132.2, 144.4, 152.5, 167.5 (C
CHC6H4). 13C NMR (100 MHz, CDCl3): δ 14.4, 48.2, 60.2, 66.7, 114.7, 125.5, 129.5, 132.2, 144.4, 152.5, 167.5 (C![[double bond, length as m-dash]](https://www.rsc.org/images/entities/char_e001.gif) O). HRMS (ESI+) m/z calculated for C15H20NO3 [M + H]+ 262.14432, found 262.14483.38
O). HRMS (ESI+) m/z calculated for C15H20NO3 [M + H]+ 262.14432, found 262.14483.38![[double bond, length as m-dash]](https://www.rsc.org/images/entities/char_e001.gif) O), 4.26 (q, J = 7.1 Hz, 2H, OCH2CH3), 6.35 (d, J = 16.0 Hz, 1H, CHC
O), 4.26 (q, J = 7.1 Hz, 2H, OCH2CH3), 6.35 (d, J = 16.0 Hz, 1H, CHC![[double bond, length as m-dash]](https://www.rsc.org/images/entities/char_e001.gif) O), 7.45 (d, J = 8.5 Hz, 2H, Harom), 7.58 (d, J = 8.5 Hz, 2H, Harom), 7.62 (d, J = 16.0 Hz, 1H, CHC6H4), 8.37 (s, 1H, NHC
O), 7.45 (d, J = 8.5 Hz, 2H, Harom), 7.58 (d, J = 8.5 Hz, 2H, Harom), 7.62 (d, J = 16.0 Hz, 1H, CHC6H4), 8.37 (s, 1H, NHC![[double bond, length as m-dash]](https://www.rsc.org/images/entities/char_e001.gif) O). 13C NMR (100 MHz, CDCl3): δ 14.3, 24.4, 60.6, 117.0, 119.9, 129.0, 130.0, 140.0, 144.1, 167.4 (C
O). 13C NMR (100 MHz, CDCl3): δ 14.3, 24.4, 60.6, 117.0, 119.9, 129.0, 130.0, 140.0, 144.1, 167.4 (C![[double bond, length as m-dash]](https://www.rsc.org/images/entities/char_e001.gif) O), 169.0 (C
O), 169.0 (C![[double bond, length as m-dash]](https://www.rsc.org/images/entities/char_e001.gif) O). HRMS (ESI+) m/z calculated for C13H16NO3 [M + H]+ 234.1130, found 234.1146.43
O). HRMS (ESI+) m/z calculated for C13H16NO3 [M + H]+ 234.1130, found 234.1146.43![[double bond, length as m-dash]](https://www.rsc.org/images/entities/char_e001.gif) O), 6.76 (s, 2H, Harom), 7.61 (d, J = 15.9 Hz, 1H, CHC6H2). 13C NMR (100 MHz, CDCl3): δ 14.4, 56.1, 60.4, 61.0, 105.1, 117.5, 130.0, 140.0, 144.6, 153.4, 167.0 (C
O), 6.76 (s, 2H, Harom), 7.61 (d, J = 15.9 Hz, 1H, CHC6H2). 13C NMR (100 MHz, CDCl3): δ 14.4, 56.1, 60.4, 61.0, 105.1, 117.5, 130.0, 140.0, 144.6, 153.4, 167.0 (C![[double bond, length as m-dash]](https://www.rsc.org/images/entities/char_e001.gif) O). HRMS (ESI+) m/z calculated for C14H19O5 [M + H]+ 267.12325, found 267.12294.44
O). HRMS (ESI+) m/z calculated for C14H19O5 [M + H]+ 267.12325, found 267.12294.442.3 Cell bioimaging and in vitro cytotoxicity
To study the effect over cell viability of the compounds 3a and 3b, and their cellular localization, the Vero cell line (ATCC® CCL-81) was used. Cells were cultured in DMEM medium supplemented with 4 mM L-glutamine, 10% FBS, penicillin (100 IU per mL), and streptomycin (100 mg mL−1) at 37 °C in a 5% CO2 atmosphere. From each compound, stock solutions of 1 mg mL−1 in DMSO were prepared. Working solutions diluted in culture medium were prepared from these stocks and sterilized by filtration (0.2 μm). The final concentration of DMSO was 0.5% or lower. Afterwards, Vero cells were seeded in 96-well tissue culture plates with 5 × 10³ cells per well in 100 μL of culture medium, after 24 h of incubation they were supplemented by triplicate with 100 μL of solution of each compound at final concentrations of 0.2, 2, 20 μg mL−1; followed by additional incubation for 24 h. Cell viability was evaluated by WST-1 assay along by light microscopy. To determine intracellular fluorescence of the compounds, Vero cells were seeded in 24-well plates at a density of 2 × 10⁴ cells per well in DMEM supplemented medium at 37 °C, 5% CO2. After 24 h, the medium was replaced with new medium containing compounds 3a and 3b at 25 μg mL−1 and incubated for 2 h. Cells were washed with PBS once and imaged using an inverted fluorescence microscopy. Untreated (with cell culture only) and treated cells with the solvent DMSO were used as controls. For statistical analysis, data were analyzed with Student's t-test using SPSS version 20.0 software. Additionally, to contrast the intracellular distribution of compounds 3a and 3b, a double fluorescent staining was performed using DAPI, a nuclear probe. Vero cells (25![[thin space (1/6-em)]](https://www.rsc.org/images/entities/char_2009.gif) 000) were seeded on sterile glass coverslips placed in 24-well microplates with 1 mL of DMEM supplemented medium and incubated for 24 h in a 5% CO2/95% O2 atmosphere. After the incubation time, the compounds were added independently at a concentration of 25 μg mL−1 and incubated for an additional 2 h. Subsequently, two washes with PBS were performed to remove excess medium, and the coverslips were mounted on glass coverslides, using VECTASHIELD® mounting medium containing DAPI. The slides were observed using an AxioScope A1 microscope (Zeiss, Göttingen, Germany) with a 100× objective and coupled to an Axiocam 502 mono camera coupled to Zen blue software (version 3.3.89.0000). Images were acquired with an Axiophot HXP 120 V fluorescence lamp with the corresponding Zeiss filters.
000) were seeded on sterile glass coverslips placed in 24-well microplates with 1 mL of DMEM supplemented medium and incubated for 24 h in a 5% CO2/95% O2 atmosphere. After the incubation time, the compounds were added independently at a concentration of 25 μg mL−1 and incubated for an additional 2 h. Subsequently, two washes with PBS were performed to remove excess medium, and the coverslips were mounted on glass coverslides, using VECTASHIELD® mounting medium containing DAPI. The slides were observed using an AxioScope A1 microscope (Zeiss, Göttingen, Germany) with a 100× objective and coupled to an Axiocam 502 mono camera coupled to Zen blue software (version 3.3.89.0000). Images were acquired with an Axiophot HXP 120 V fluorescence lamp with the corresponding Zeiss filters.
3. Results and discussion
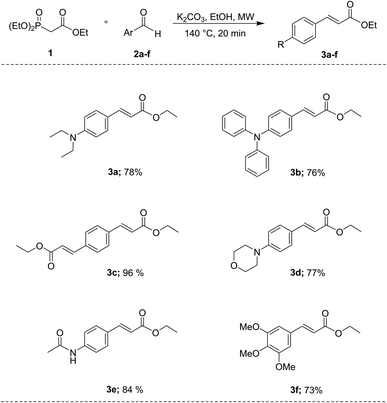
Cinnamates 3a–f were prepared in an easy way applying the widely known HWE reaction45–47 using triethyl phosphonoacetate 1 as the starting material, and commercially available aryl aldehydes 2a–f [4-(diethylamino)benzaldehyde, 4-(diphenylamino)benzaldehyde, terephthaldehyde, 4-(4-morpholinyl)benzaldehyde, 4-acetamidobenzaldehyde, and 3,4,5-trimethoxybenzaldehyde] using K2CO3 as base and ethanol as solvent, under microwave irradiation at 140 °C for 20 min. After purification either by chromatography column or crystallization, the compounds 3a–f were obtained predominantly as E isomers with 73% to 96% yields (Scheme 1). Under these conditions, it was possible to obtain the desired compounds in a one-step reaction, without catalysts, and with improved yields compared to the ones reported in the literature (for compounds 3a and 3d, Y. Mizuta,38 reported 46% and 49% yield respectively; for compound 3c, J. Lu,43 reported 89% yield, for compound 3b, X. Zeng,42 reported 97% yield, and for compound 3f, E. Nomura,44 reported 66% yield). Therefore, we are now reporting an eco-friendly experimental protocol for the synthesis of these compounds.3.1 Photophysical properties
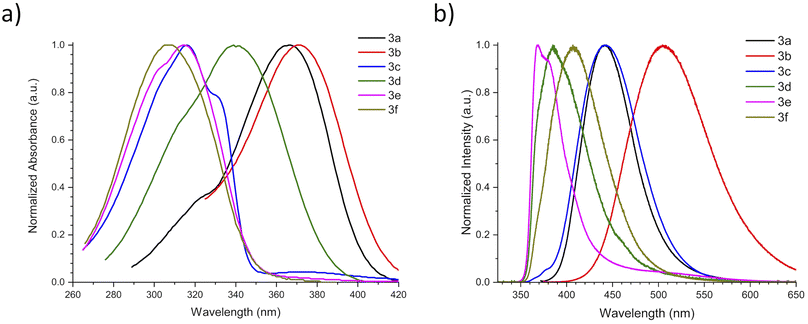
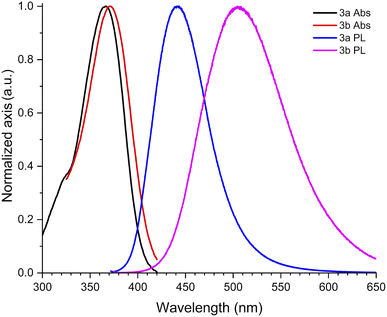
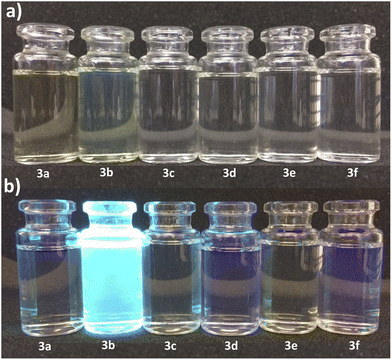
With ethyl cinnamates 3a–f synthesized and characterized, and in order to obtain information about their photophysical properties, UV-vis absorption and photoluminescent spectra of these compounds in ethyl acetate solutions were initially recorded (Fig. 1). Fig. 1a shows the absorption spectra of compounds 3a–f (absorbance data were normalized), which are in the range between 260–420 nm, and are attributed to n → π* transitions. The absorption spectra of compounds 3a–f shown wavelengths of maximum absorption (λabs) at 366, 370, 316, 339, 314, and 309 nm, respectively; where the absorption spectrum of 3a is similar to 3b, being these two compounds red-shifted. Fig. 1b shows the photoluminescent spectra for compounds 3a–f, where the compounds 3a and 3c–f exhibit blue emissions with maximum intensities in the range of 369–442 nm.It is noteworthy, that compound 3b exhibits blue-green emission at 504 nm, which had a bathochromic shift by about 62 nm with respect to 3a, which has a wavelength of maximum emission (λem) at 442 nm (Fig. 2). The latter can be attributed to a higher level of conjugation due to the presence of the diphenylamino group, see Table 1. The Stokes shifts (SS) were calculated from the absorption and emission maximum wavelengths for each compound, getting the following values: 76, 134, 126, 46, 55, and 97 nm, showing that compound 3b has the largest Stokes shift (134 nm).
| Compound | λabs (nm) | Eabs (eV) | ε (104 M−1 cm−1) | λem (nm) | Eem (eV) | SS | Φ (%) | CIE (x,y) | |
|---|---|---|---|---|---|---|---|---|---|
| (nm) | (eV) | ||||||||
| 3a | 366 | 3.39 | 3.06 | 442 | 2.81 | 76 | 0.58 | 1.4 | (0.15,0.07) |
| 3b | 370 | 3.35 | 3.36 | 504 | 2.46 | 134 | 0.89 | 17.8 | (0.23,0.43) |
| 3c | 316 | 3.92 | 2.4 | 442 | 2.81 | 126 | 1.12 | 1.2 | (0.14,0.07) |
| 3d | 339 | 3.66 | 1.79 | 385 | 3.22 | 46 | 0.44 | 0.77 | (0.16,0.06) |
| 3e | 314 | 3.95 | 1.75 | 369 | 3.36 | 55 | 0.59 | 0.8 | (0.18,0.15) |
| 3f | 309 | 4.01 | 1.53 | 406 | 3.05 | 97 | 0.96 | 1.1 | (0.15,0.04) |
Fluorescence quantum yields (Φ) of 3a–f in ethyl acetate were measured using quinine sulphate (ΦR = 0.55 in H2SO4, 0.05 M) as reference by a comparative method:48
 | (1) |
In spite of their similar λabs values, compounds 3a and 3b show significantly different λem and the Φ value of 3b is around 12 times larger than that of 3a. This behavior can be attributed to the biphenyl's chromophore present in 3b.
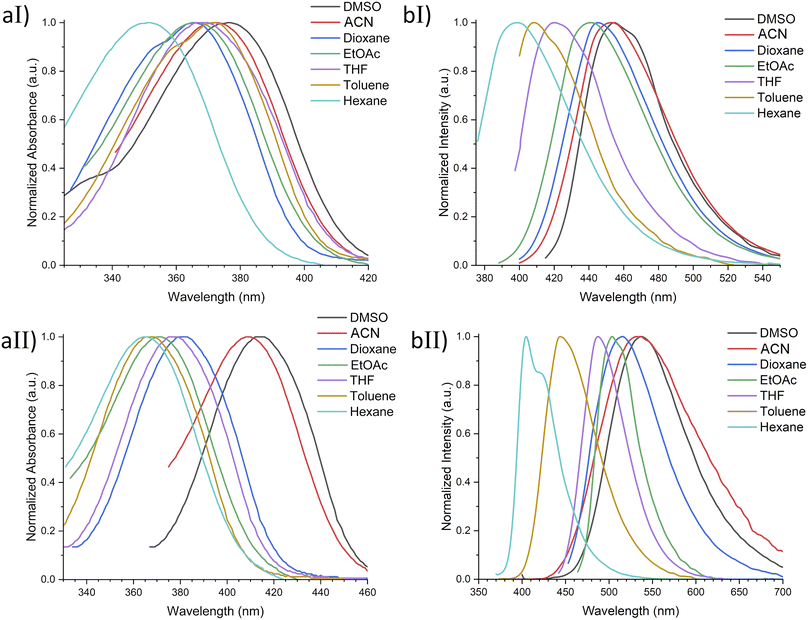
Based on the photophysical properties results using ethyl acetate as solvent, it was decided to perform a more detailed study of compounds 3a and 3b, which presented the best photophysical properties, using a series of solvents of ranging polarity (hexane, toluene, THF, EtOAc, dioxane, ACN, DMSO), see Fig. SI20.† Results showed maximum absorption values between 350–377 nm for 3a and 363–415 nm for 3b. In addition, a bathochromic shift was observed when increasing the solvent polarity, which is more noticeable for compound 3b. On the other hand, the highest molar extinction coefficients were achieved using DMSO as solvent, 37![[thin space (1/6-em)]](https://www.rsc.org/images/entities/char_2009.gif) 600 and 40
600 and 40![[thin space (1/6-em)]](https://www.rsc.org/images/entities/char_2009.gif) 100 M−1 cm−1 for 3a and 3b, respectively. Whereas both compounds 3a and 3b exhibited the lowest values in hexane, 15
100 M−1 cm−1 for 3a and 3b, respectively. Whereas both compounds 3a and 3b exhibited the lowest values in hexane, 15![[thin space (1/6-em)]](https://www.rsc.org/images/entities/char_2009.gif) 900 and 13
900 and 13![[thin space (1/6-em)]](https://www.rsc.org/images/entities/char_2009.gif) 500 M−1 cm−1, respectively (Table 2 and Fig. 4). This behavior may be attributed to possible compound–solvent interactions.49
500 M−1 cm−1, respectively (Table 2 and Fig. 4). This behavior may be attributed to possible compound–solvent interactions.49
| Solvent | λabs (nm) | Eabs (eV) | ε (104 M−1 cm−1) | λem (nm) | Eem (eV) | SS (nm) | Φ (%) |
|---|---|---|---|---|---|---|---|
| a Data for compound 3b. | |||||||
| DMSO | 377 | 3.29 | 3.76 | 454 | 2.73 | 82 | 2.1 |
| 415a | 2.99a | 4.01a | 537a | 2.31a | 122a | 19.01a | |
| ACN | 369 | 3.36 | 3.35 | 452 | 2.74 | 81 | 1.8 |
| 409a | 3.03a | 3.89a | 531a | 2.33a | 122a | 19.3a | |
| Dioxane | 366 | 3.39 | 3.22 | 445 | 2.79 | 80 | 1.9 |
| 380a | 3.26a | 3.41a | 515a | 2.40a | 135a | 18.6a | |
| EtOAc | 366 | 3.39 | 3.06 | 442 | 2.81 | 76 | 1.4 |
| 370a | 3.35a | 3.36a | 504a | 2.46a | 134a | 17.8a | |
| THF | 367 | 3.37 | 3.01 | 420 | 2.95 | 57 | 1.1 |
| 375a | 3.30a | 3.39a | 487a | 2.55a | 112a | 15.7a | |
| Toluene | 371 | 3.34 | 2.68 | 408 | 3.04 | 37 | 0.87 |
| 368a | 3.37a | 2.75a | 443a | 2.80a | 75a | 3.9a | |
| Hexane | 350 | 3.54 | 1.59 | 398 | 3.11 | 45 | 0.44 |
| 363a | 3.41a | 1.35a | 404a | 3.07a | 41a | 2.4a | |
Furthermore, the emission spectra show a noteworthy red solvatochromic shift as the polarity of the solvent increases. This could be attributed to the intramolecular charge transfer.50,51 Additionally, the quantum yield analysis in solution exhibited higher values using DMSO (Φ = 2.1%) and ACN (Φ = 19.3%) for 3a and 3b, respectively, noting a quite linear decline in fluorescence intensity, as the solvent polarity decreases. The decreasing trend in quantum yield in non-polar solvents may be attributed to the slight difference between their ground and excited states.52–54 Moreover, SS values above 100 nm were found for compound 3b in THF, EtOAc, dioxane, ACN, and DMSO (Table 2 and Fig. 4).
In addition to quantum yield and Stokes shifts, to evaluate the eligibility of a compound for fluorescent cell imaging, the extinction coefficient (ε) is also a determining parameter. In this respect, 3a and 3b showed ε values > 30![[thin space (1/6-em)]](https://www.rsc.org/images/entities/char_2009.gif) 000 M−1 cm−1 in all tested solvents except hexane and toluene, making them appropriate for medical and biological applications.14 Based on these results, we selected the derivatives 3a and 3b to be evaluated as fluorescent cell dyes due to the combination of their noticeable chemical yield, quantum yield, Stokes shift, and extinction coefficient values.
000 M−1 cm−1 in all tested solvents except hexane and toluene, making them appropriate for medical and biological applications.14 Based on these results, we selected the derivatives 3a and 3b to be evaluated as fluorescent cell dyes due to the combination of their noticeable chemical yield, quantum yield, Stokes shift, and extinction coefficient values.
3.2 Theoretical calculations
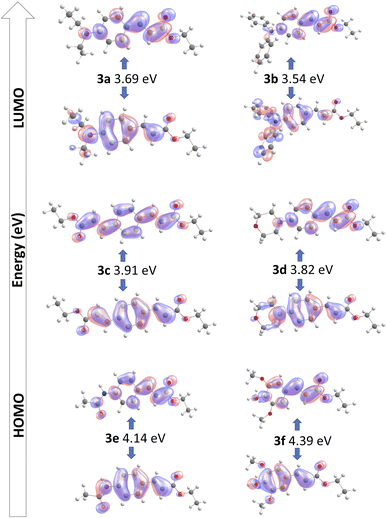
Geometry optimizations and TDDFT calculations were performed to determine the ground state structure for all synthesized compounds, and to obtain the electronic spectra to study the S0–S1 transition. The calculated wavelength absorption maxima are all in good agreement with the experimental measurements in ethyl acetate.55The HOMO–LUMO frontier molecular orbitals of the compounds 3a–3f in ethyl acetate as solvent are summarized in Table 3. For 3a and 3b, there are similar donating portions where the amine is donating electron density to the pi-bridging phenyl ring. While in 3a the diethyl portion hyperconjugates to enhance donation from the amine, in 3b the two additional aromatic rings provide what could be assigned as the highest donated electron density, which would be discernible as the most red-shifted absorption, as corroborated experimentally.
| Compound | State | E (eV) | λmax (nm) | f | Assignment | Exp.a (nm) |
|---|---|---|---|---|---|---|
| a Results obtained in ethyl acetate as solvent. | ||||||
| 3a | S1 | 3.69 | 335.6 | 1.1350 | HOMO–LUMO (95%) | 366 |
| 3b | S1 | 3.54 | 349.8 | 1.0310 | HOMO–LUMO (90%) | 370 |
| 3c | S1 | 3.91 | 317.1 | 1.5055 | HOMO–LUMO (96%) | 316 |
| 3d | S1 | 3.82 | 324.1 | 1.1273 | HOMO–LUMO (94%) | 339 |
| 3e | S1 | 4.14 | 299.2 | 1.1085 | HOMO–LUMO (96%) | 314 |
| 3f | S1 | 4.39 | 281.9 | 0.9083 | HOMO–LUMO (95%) | 309 |
Compound 3d has a somewhat similar behavior where the cyclic amine donates electron density but having the oxygen atom incorporated in the morpholine cycle reduces the available delocalization, compared to what is observed for 3a and 3b.
The ethyl acrylate group in 3c and the double-bond character of the amide group in 3e can be rationalized as having similar electronic properties and provide very similar delocalization of electron density towards the π-bridge portion.
Compound 3f only shows donation towards the phenyl ring, stemming from the methoxy portions, whose group electronegativity do not allow a strong donating effect. This is reflected in the lowest maximum wavelength of the series.
Finally, we can observe a quinoid delocalization from the phenyl to the acrylate portion which is shared in the whole series producing the “pull” effect on the studied molecules.
The electronic nature of the transition in the whole series has as consequence that their S0–S1 transition present a HOMO–LUMO character in more than 90% (Fig. 5).
3.3 Cell bioimaging and in vitro cytotoxicity
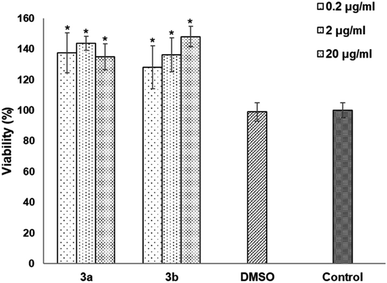
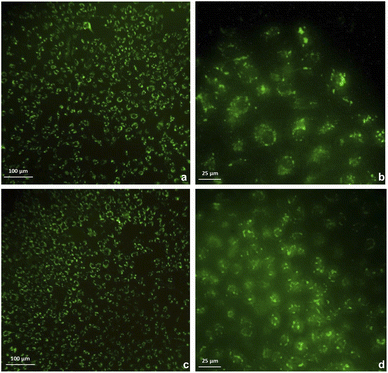
The cytotoxicity was assessed by the WST-1 assay in Vero cells following a 24 h treatment with the compounds 3a, 3b and DMSO as solvent. The results did not show a cytotoxicity effect of compounds 3a and 3b even at concentrations of 20 μg mL−1. On the contrary, it is striking that an increase of 20–40% in cell proliferation occurs at these doses compared to the viability of the controls (Fig. 6). This behavior could be related to hormesis since, according to a systematic review of 9000 hormetic responses, it was found that the stimulatory effect varies from 30–60% in comparison to the control groups.56 Hormesis is a biological phenomenon that occurs in a wide variety of species and is induced by different chemical compounds, either natural or synthetic; it is generally accepted that favors adaptation to overcome unfavorable or stressful conditions in the normal environment of different organisms.57 Regardless of the model, the evaluation criteria, and the inducing agent, the hormetic effect is characterized by stimulation at low doses, while it is inhibitory at high doses.58 At cellular level, activation of signaling cascades occurs in which transcription and growth factors, kinase and deacetylase enzymes, and antioxidant enzymes have been involved.59 The latter is particularly important because a wide variety of xenobiotics induce oxidative stress and the hormetic effect has been directly related to the production of reactive oxygen species.60,61 It has also been reported that exposure to chemical agents induces oxidative stress, which mediated activation of signaling pathways involved in cell proliferation and apoptosis.62 According to our results, it is possible to suggest that Vero cells were under oxidative stress and possibly increased cell proliferation as an adaptation or physiological alert response in the presence of the studied compounds.The compounds 3a and 3b were also tested as dyes for fluorescence microscopy, using Vero cells as model for studying cellular staining, uptake, and localization. Fig. 7 shows panoramic (a and c) and zoom-in (b and d) images of Vero cell monolayers incubated with compounds 3a (a and b) and 3b (c and d) in which intracellular fluorescence is observed.
This kind of dyes have shown to be largely internalized by cells via endocytosis. The microscopic approach allows us to observe that the fluorescent staining is selective, and that compound 3a stains the cytoplasm of the cells, while compound 3b stains the nucleoli, which are seen as solid spots of intense fluorescence, while the cytoplasm is observed as a fined shadow around the nuclei.
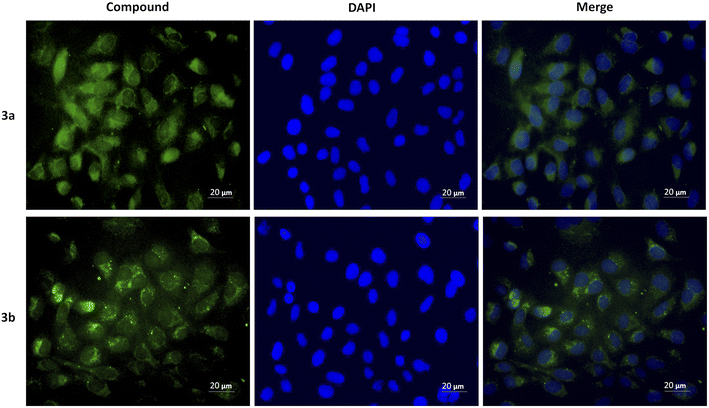
To demonstrate the intracellular localization of compounds 3a and 3b, a double fluorescent staining was performed using these compounds and DAPI, which stains blue the cell nuclei and allows to appreciate that compound 3a produces diffuse cytoplasmic staining, while compound 3b accumulates around the nuclei (Fig. 8).
4. Conclusions
In summary, a simple and eco-friendly microwave-assisted organic synthesis, for the preparation of ethyl cinnamates, has been successfully performed with good chemical yields, via Horner–Wadsworth–Emmons reaction. The photophysical properties demonstrated that compounds 3a and 3c–f presented low fluorescence quantum yields from 0.77% to 1.4%, while compound 3b presented the highest value (17.8%) using EtOAc as solvent. Likewise, compound 3b showed the largest Stokes shift (135 nm) using dioxane as solvent. Compounds 3a and 3b showed ε values > 30![[thin space (1/6-em)]](https://www.rsc.org/images/entities/char_2009.gif) 000 M−1 cm−1 in all tested solvents except hexane and toluene. Based on these last properties, compounds 3a and 3b were selected to assess their cytotoxicity, at different concentrations, using Vero cells. The results evidenced that the compounds 3a and 3b were not cytotoxic and they were internalized by cells; showing that compound 3a stains the cytoplasm, and compound 3b stains the nuclei in a selective way. Besides, these studies demonstrated that compounds 3a and 3b could be used as fluorescent dyes for biological and medical applications.
000 M−1 cm−1 in all tested solvents except hexane and toluene. Based on these last properties, compounds 3a and 3b were selected to assess their cytotoxicity, at different concentrations, using Vero cells. The results evidenced that the compounds 3a and 3b were not cytotoxic and they were internalized by cells; showing that compound 3a stains the cytoplasm, and compound 3b stains the nuclei in a selective way. Besides, these studies demonstrated that compounds 3a and 3b could be used as fluorescent dyes for biological and medical applications.
Conflicts of interest
The authors declare that there are no conflicts of interest in this work.Acknowledgements
The authors thank CONAHCYT of Mexico for the financial support, with grant number CB-2015/256359. MAAM and ELPN also thank CONACYT for the scholarships 596332 and 888781.References
- D. N. Kanekar, S. Chacko and R. M. Kamble, Quinoxaline Based Amines as Blue-Orange Emitters: Effect of Modulating Donor System on Optoelectrochemical and Theoretical Properties, Dyes Pigm., 2019, 167, 36–50, DOI:10.1016/J.DYEPIG.2019.04.005.
- V. V. Utochnikova, N. N. Solodukhin, A. N. Aslandukov, L. Marciniak, I. S. Bushmarinov, A. A. Vashchenko and N. P. Kuzmina, Lanthanide Tetrafluorobenzoates as Emitters for OLEDs: New Approach for Host Selection, Org. Electron., 2017, 44, 85–93, DOI:10.1016/j.orgel.2017.01.026.
- S.-H. Jeong, K. H. Lee and J. Y. Lee, Dual Role of a Pyrene Derivative as a Hole Transport Material and an Emitter in Blue Fluorescent Organic Light-Emitting Diodes, Dyes Pigm., 2019, 171, 107759, DOI:10.1016/J.DYEPIG.2019.107759.
- L. Yan, R. Li, W. Shen and Z. Qi, Multiple-Color AIE Coumarin-Based Schiff Bases and Potential Application in Yellow OLEDs, J. Lumin., 2018, 194, 151–155, DOI:10.1016/j.jlumin.2017.10.032.
- K. S. Daskalakis, F. Freire-Fernández, A. J. Moilanen, S. Van Dijken and P. Törmä, Converting an Organic Light-Emitting Diode from Blue to White with Bragg Modes, ACS Photonics, 2019, 6, 2655–2662, DOI:10.1021/acsphotonics.9b01206.
- J. Huang, L. Liu, Y. Peng, Y. Fu, Z. Song, C. Zhong, J. Yang, J. Zhou, Y. Zhang and Y. Luo, et al., Design of a Quinazolinone-Based Environment-Sensitive Fluorescent Dye: Solvatochromic Fluorescence and Application for One-Photon and Two-Photon Bioimaging, Dyes Pigm., 2019, 165, 58–64, DOI:10.1016/j.dyepig.2019.01.051.
- X. Wu and W. Zhu, Stability Enhancement of Fluorophores for Lighting up Practical Application in Bioimaging, Chem. Soc. Rev., 2015, 44, 4179–4184, 10.1039/c4cs00152d.
- S. Reimann, M. Sharif, K. Wittler, L. R. Knöpke, A. E. Surkus, C. Roth, R. Ludwig and P. Langer, 3-Pyrenylacrylates: Synthetic, Photophysical, Theoretical and Electrochemical Investigations, Z. Naturforsch., C: J. Biosci., 2013, 68, 367–377, DOI:10.5560/znb.2013-3004.
- G. Sathiyan, E. K. T. Sivakumar, R. Ganesamoorthy, R. Thangamuthu and P. Sakthivel, Review of Carbazole Based Conjugated Molecules for Highly Efficient Organic Solar Cell Application, Tetrahedron Lett., 2016, 57, 243–252, DOI:10.1016/j.tetlet.2015.12.057.
- U. M. V. Basavanag, A. Islas-Jácome, A. Rentería-Gómez, A. S. Conejo, M. Kurva, J. O. C. Jiménez-Halla, J. Velusamy, G. Ramos-Ortíz and R. Gámez-Montaño, Synthesis of 2-Julolidin-Imidazo[1,2-a] Pyridines via Groebke-Blackburn-Bienaymé Reaction and Studies of Optical Properties, New J. Chem., 2017, 41, 3450–3459, 10.1039/c6nj04044f.
- M. Srinivas, G. R. Vijayakumar, K. M. Mahadevan, H. Nagabhushana and H. S. Bhojya Naik, Synthesis, Photoluminescence and Forensic Applications of Blue Light Emitting Azomethine-Zinc(II) Complexes of Bis(Salicylidene)Cyclohexyl-1,2-Diamino Based Organic Ligands, J. Sci.: Adv. Mater. Devices, 2017, 2, 156–164, DOI:10.1016/j.jsamd.2017.02.008.
- G. Attia, S. Rahali, S. Teka, N. Fourati, C. Zerrouki, M. Seydou, S. Chehimi, S. Hayouni, J. P. Mbakidi and S. Bouquillon, et al., Anthracene Based Surface Acoustic Wave Sensors for Picomolar Detection of Lead Ions. Correlation between Experimental Results and DFT Calculations, Sens. Actuators, B, 2018, 276, 349–355, DOI:10.1016/j.snb.2018.08.033.
- J. Sun, P. Cai, X. Zhang, A. Liang, L. Zhang and J. Chen, Synthesis, Characterization and Device Application of a Novel Blue-Emitting Copolymer Incorporating Fluorene and Benzothiazole Backbone Units, Opt. Mater., 2019, 98, 109443, DOI:10.1016/J.OPTMAT.2019.109443.
- W. Wang, H. Mattoussi, A. Kapur, G. Palui, S. H. Medina, X. Ji and J. P. Schneider, Enhanced Uptake of Luminescent Quantum Dots by Live Cells Mediated by a Membrane-Active Peptide, ACS Omega, 2018, 3, 17164–17172, DOI:10.1021/acsomega.8b02918.
- X. Y. Shen, W. Z. Yuan, Y. Liu, Q. Zhao, P. Lu, Y. Ma, I. D. Williams, A. Qin, J. Z. Sun and B. Z. Tang, Fumaronitrile-Based Fluorogen: Red to near-Infrared Fluorescence, Aggregation-Induced Emission, Solvatochromism, and Twisted Intramolecular Charge Transfer, J. Phys. Chem. C, 2012, 116, 10541–10547, DOI:10.1021/jp303100a.
- J. Yao, M. Yang and Y. Duan, Chemistry, Biology, and Medicine of Fluorescent Nanomaterials and Related Systems: New Insights into Biosensing, Bioimaging, Genomics, Diagnostics, and Therapy, Chem. Rev., 2014, 114, 6130–6178, DOI:10.1021/cr200359p.
- A. S. Ortega-Villarreal, E. Hernández-Fernández, C. Jensen, G. A. Valdivia-Berroeta, S. Garrard, I. López, S. J. Smith, K. A. Christensen, M. A. Reyes-González and D. J. Michaelis, Synthesis and Characterization of Ethyl Benzotriazolyl Acrylate-Based D-π-A Fluorophores for Live Cell-Based Imaging Applications, RSC Adv., 2019, 9, 8759–8767, 10.1039/c9ra00108e.
- P. Khanna and P. C. Basak, An OER Architecture Framework: Needs and Design, Int. Rev. Res. Open Distance Learn., 2013, 14, 65–83, DOI:10.1016/j.rser.2012.02.021.
- S. W. Yun, N. Y. Kang, S. J. Park, H. H. Ha, Y. K. Kim, J. S. Lee and Y. T. Chang, Diversity Oriented Fluorescence Library Approach (DOFLA) for Live Cell Imaging Probe Development, Acc. Chem. Res., 2014, 47, 1277–1286, DOI:10.1021/ar400285f.
- L. Zhao, S. Wang, J. Ding and L. Wang, Solution-Processible Blue Fluorescent Dendrimers with Carbazole/Diphenylamine Hybrid Dendrons for Power-Efficient Organic Light-Emitting Diodes, ACS Omega, 2019, 4, 15923–15928, DOI:10.1021/acsomega.9b01979.
- V. I. Martynov, A. A. Pakhomov, N. V. Popova, I. E. Deyev and A. G. Petrenko, Synthetic Fluorophores for Visualizing Biomolecules in Living Systems, Acta Nat., 2016, 8, 33–46, DOI:10.32607/20758251-2016-8-4-33-46.
- Z. Wang, S. Chen, J. W. Y. Lam, W. Qin, R. T. K. Kwok, N. Xie, Q. Hu and B. Z. Tang, Long-Term Fluorescent Cellular Tracing by the Aggregates of AIE Bioconjugates, J. Am. Chem. Soc., 2013, 135, 8238–8245, DOI:10.1021/ja312581r.
- J. Zhang, R. Chen, Z. Zhu, C. Adachi, X. Zhang and C. S. Lee, Highly Stable Near-Infrared Fluorescent Organic Nanoparticles with a Large Stokes Shift for Noninvasive Long-Term Cellular Imaging, ACS Appl. Mater. Interfaces, 2015, 7, 26266–26274, DOI:10.1021/acsami.5b08539.
- Y. Yang, Q. Zhao, W. Feng and F. Li, Luminescent Chemodosimeters for Bioimaging, Chem. Rev., 2013, 113, 192–270, DOI:10.1021/cr2004103.
- J. Goedhart, D. Von Stetten, M. Noirclerc-Savoye, M. Lelimousin, L. Joosen, M. A. Hink, L. Van Weeren, T. W. J. Gadella and A. Royant, Structure-Guided Evolution of Cyan Fluorescent Proteins towards a Quantum Yield of 93%, Nat. Commun., 2012, 3, 751, DOI:10.1038/ncomms1738.
- S. W. Thomas, G. D. Joly and T. M. Swager, Chemical Sensors Based on Amplifying Fluorescent Conjugated Polymers, Chem. Rev., 2007, 107, 1339–1386, DOI:10.1021/cr0501339.
- C. C. Cheng, Z. S. Liao, J. J. Huang, D. J. Lee and J. K. Chen, Supramolecular Polymer Micelles as Universal Tools for Constructing High-Performance Fluorescent Nanoparticles, Dyes Pigm., 2017, 137, 284–292, DOI:10.1016/j.dyepig.2016.10.028.
- K. H. Lee and J. Y. Lee, Paradigm Change of Blue Emitters: Thermally Activated Fluorescence Emitters as Long-Living Fluorescence Emitters by Triplet Exciton Quenching, Org. Electron., 2019, 75, 105377, DOI:10.1016/J.ORGEL.2019.105377.
- M. Zhu and C. Yang, Blue Fluorescent Emitters: Design Tactics and Applications in Organic Light-Emitting Diodes, Chem. Soc. Rev., 2013, 42, 4963–4976, 10.1039/c3cs35440g.
- M. Lepeltier, X. Sallenave, D. Tondelier, G. Sini, F. Goubard, D. Gigmes, B. Geffroy and F. Dumur, Triphenylamine/Oxadiazole Hybrids Differing by the Substitution Pattern: Influence on the Electroluminescence Properties of Yellow and Green Emitting Diodes, Synth. Met., 2018, 240, 21–29, DOI:10.1016/j.synthmet.2018.03.008.
- M. Aydemir, G. Haykir, A. Battal, V. Jankus, S. K. Sugunan, F. B. Dias, H. Al-Attar, F. Türksoy, M. Tavasli and A. P. Monkman, High Efficiency OLEDs Based on Anthracene Derivatives: The Impact of Electron Donating and Withdrawing Group on the Performance of OLED, Org. Electron., 2016, 30, 149–157, DOI:10.1016/j.orgel.2015.11.026.
- J. Jayabharathi, R. Sathishkumar, V. Thanikachalam and K. Jayamoorthy, High Efficiency, Blue Emitting Materials Based on Phenanthro[9,10-d] Imidazole Derivatives, J. Lumin., 2014, 153, 343–349, DOI:10.1016/j.jlumin.2014.03.060.
- M. Thelakkat and H. W. Schmidt, Low Molecular Weight and Polymeric Heterocyclics as Electron Transport/Hole-Blocking Materials in Organic Light-Emitting Diodes, Polym. Adv. Technol., 1998, 9, 429–442, DOI:10.1002/(SICI)1099-1581(199807)9:7<429::AID-PAT798>3.0.CO;2-E.
- Y. Jia, S. Wu, Y. Zhang, S. Fan, X. Zhao, H. Liu, X. Dong, S. Wang and X. Li, Achieving Non-Doped Deep-Blue OLEDs by Applying Bipolar Imidazole Derivatives, Org. Electron., 2019, 69, 289–296, DOI:10.1016/j.orgel.2019.03.044.
- K. Selvakumar, A. Zapf, A. Spannenberg and M. Beller, Synthesis of Monocarbenepalladium(0) Complexes and Their Catalytic Behavior in Cross-Coupling Reactions of Aryldiazonium Salts, Chem.–Eur. J., 2002, 8, 3901–3906, DOI:10.1002/1521-3765(20020902)8:17<3901::AID-CHEM3901>3.0.CO;2-E.
- C. H. Lo and H. M. Lee, Synthesis and Characterization of C, C-Type Palladacycles and Their Catalytic Application in Mizoroki-Heck Coupling Reaction, Organometallics, 2018, 37, 1150–1159, DOI:10.1021/acs.organomet.8b00054.
- M. Moreno-Mañas, M. Pérez and R. Pleixats, Stereospecific Preparation of Ethyl (E) and (Z)-3-Aryl-3-Phenylpropenoates by Heck Reaction, Tetrahedron Lett., 1996, 37, 7449–7452, DOI:10.1016/0040-4039(96)01608-5.
- Y. Mizuta, Y. Obora, Y. Shimizu and Y. Ishii, Para-Selective Aerobic Oxidative C-H Olefination of Aminobenzenes Catalyzed by Palladium/Molybdovanadophosphoric Acid/2,4,6-Trimethylbenzoic Acid System, ChemCatChem, 2012, 4, 187–191, DOI:10.1002/cctc.201100375.
- H. Lebel and M. Davi, Diazo Reagents in Copper(I)-Catalyzed Olefination of Aldehydes, Adv. Synth. Catal., 2008, 350, 2352–2358, DOI:10.1002/adsc.200800381.
- B. List, A. Doehring, M. T. Hechavarria Fonseca, A. Job and R. Rios Torres, A Practical, Efficient, and Atom Economic Alternative to the Wittig and Horner-Wadsworth-Emmons Reactions for the Synthesis of (E)-α,β-Unsaturated Esters from Aldehydes, Tetrahedron, 2006, 62, 476–482, DOI:10.1016/j.tet.2005.09.081.
- S. Kumar, U. Mabalirajan, R. Rehman, B. K. Singh, V. S. Parmar, A. K. Prasad, S. Biswal and B. Ghosh, A Novel Cinnamate Derivative Attenuates Asthma Features and Reduces Bronchial Epithelial Injury in Mouse Model, Int. Immunopharmacol., 2013, 15, 150–159, DOI:10.1016/j.intimp.2012.10.024.
- X. Zeng, Z. Chen, L. Tang, H. Yang, N. Liu, H. Zhou, Y. Li, J. Wu, Z. Deng and Y. Yu, et al., A Novel Near-Infrared Fluorescent Light-up Probe for Tumor Imaging and Drug-Induced Liver Injury Detection, Chem. Commun., 2019, 55, 2541–2544, 10.1039/C8CC10286D.
- J. Lu and P. H. Toy, Organocatalytic Decarboxylative Doebner-Knoevenagel Reactions between Arylaldehydes and Monoethyl Malonate Mediated by a Bifunctional Polymeric Catalyst, Synlett, 2011, 1723–1726, DOI:10.1055/s-0030-1260808.
- E. Nomura, T. Noda, D. Gomi and H. Mori, Substituent Effect on the Formation of Arylindanes by Dimerization of Ferulic Acid and Its Related Compounds, ACS Omega, 2018, 3, 12746–12753, DOI:10.1021/acsomega.8b01953.
- B. E. Maryanoff and A. B. Reitz, The Wittig Olefination Reaction and Modifications Involving Phosphoryl-Stabilized Carbanions. Stereochemistry, Mechanism, and Selected Synthetic Aspects, Chem. Rev., 1989, 89(4), 863–927, DOI:10.1021/cr00094a007.
- E. Hernández-Fernández, M. Fernández-Zertuche, O. García-Barradas, O. Muñoz-Muñiz and M. Ordóñez, Practical and Efficient Synthesis of (E)-α,β-Unsaturated Amides Bearing (S)-α-Methylbenzylamine from 2-Phosphonamides via Horner-Wadsworth-Emmons Reaction, Synlett, 2006, 47, 440–444, DOI:10.1055/s-2006-926265.
- M. Ordóñez, E. Hernández-Fernández, M. Montiel-Pérez, R. Bautista, P. Bustos, H. Rojas-Cabrera, M. Fernández-Zertuche and O. García-Barradas, A Convenient Method for the Preparation of Chiral Phosphonoacetamides and Their Horner-Wadsworth-Emmons Reaction, Tetrahedron: Asymmetry, 2007, 18, 2427–2436, DOI:10.1016/j.tetasy.2007.09.033.
- H. Ishida, J.-C. Bünzli and A. Beeby, Guidelines for Measurement of Luminescence Spectra and Quantum Yields of Inorganic and Organometallic Compounds in Solution and Solid State (IUPAC Technical Report), Pure Appl. Chem., 2016, 88, 701–711, DOI:10.1515/pac-2014-0706.
- V. Pilla, A. C. Gonçalves, A. A. Dos Santos and C. Lodeiro, Lifetime and Fluorescence Quantum Yield of Two Fluorescein-Amino Acid-Based Compounds in Different Organic Solvents and Gold Colloidal Suspensions, Chemosensors, 2018, 6, 26, DOI:10.3390/CHEMOSENSORS6030026.
- L. Xu, S. Zhang, X. Liang, S. Zhong, B. Wang, Z. Li and X. Cui, Novel Biocompatible AIEgen from Natural Resources: Palmatine and Its Bioimaging Application, Dyes Pigm., 2021, 184, 108860, DOI:10.1016/J.DYEPIG.2020.108860.
- X. Zeng, Z. Chen, L. Tang, H. Yang, N. Liu, H. Zhou, Y. Li, J. Wu, Z. Deng and Y. Yu, et al., A Novel Near-Infrared Fluorescent Light-up Probe for Tumor Imaging and Drug-Induced Liver Injury Detection, Chem. Commun., 2019, 55, 2541–2544, 10.1039/C8CC10286D.
- R. Ahmed and A. K. Manna, Understanding High Fluorescence Quantum Yield and Simultaneous Large Stokes Shift in Phenyl Bridged Donor-π-Acceptor Dyads with Varied Bridge Lengths in Polar Solvents, J. Phys. Chem. A, 2022, 126, 4221–4229, DOI:10.1021/ACS.JPCA.2C02950/SUPPL_FILE/JP2C02950_SI_001.PDF.
- T. Zhang, Y. Li, J. Yan, Y. Liang, B. Xu, K. Zheng and N. Zhang, Syntheses and Spectroscopic Properties of Substituted Diazaborepins with Large Stokes Shift, Tetrahedron, 2018, 74, 2807–2811, DOI:10.1016/J.TET.2018.04.063.
- H. A. Z. Sabek, A. M. M. Alazaly, D. Salah, H. S. Abdel-Samad, M. A. Ismail and A. A. Abdel-Shafi, Photophysical Properties and Fluorosolvatochromism of D–π–A Thiophene Based Derivatives, RSC Adv., 2020, 10, 43459–43471, 10.1039/D0RA08433F.
- M. J. Frisch, G. W. Trucks, H. B. Schlegel, G. E. Scuseria, M. A. Robb, J. R. Cheeseman, G. Scalmani, V. Barone, G. A. Petersson, H. Nakatsuji, X. Li, M. Caricato, A. Marenich, J. Bloino, B. G. Janesko, R. Gomperts, B. Mennucci, H. P. Hratchian, J. V. Ortiz, A. F. Izmaylov, J. L. Sonnenberg, D. Williams-Young, F. Ding, F. Lipparini, F. Egidi, J. Goings, B. Peng, A. Petrone, T. Henderson, D. Ranasinghe, V. G. Zakrzewski, J. Gao, N. Rega, G. Zheng, W. Liang, M. Hada, M. Ehara, K. Toyota, R. Fukuda, J. Hasegawa, M. Ishida, T. Nakajima, Y. Honda, O. Kitao, H. Nakai, T. Vreven, K. Throssell, J. A. Montgomery Jr, J. E. Peralta, F. Ogliaro, M. Bearpark, J. J. Heyd, E. Brothers, K. N. Kudin, V. N. Staroverov, T. Keith, R. Kobayashi, J. Normand, K. Raghavachari, A. Rendell, J. C. Burant, S. S. Iyengar, J. Tomasi, M. Cossi, J. M. Millam, M. Klene, C. Adamo, R. Cammi, J. W. Ochterski, R. L. Martin, K. Morokuma, O. Farkas, J. B. Foresman and D. J. Fox, Gaussian 09, Revision A.02, Gaussian, Inc., Wallingford CT, 2016 Search PubMed.
- E. J. Calabrese and R. B. Blain, The Hormesis Database: The Occurrence of Hormetic Dose Responses in the Toxicological Literature, Regul. Toxicol. Pharmacol., 2011, 61, 73–81, DOI:10.1016/j.yrtph.2011.06.003.
- W. H. Van Der Schalie and J. H. Gentile, Ecological Risk Assessment: Implications of Hormesis, J. Appl. Toxicol., 2000, 20, 131–139, DOI:10.1002/(sici)1099-1263(200003/04)20:2<131::aid-jat644>3.0.co;2-4.
- E. J. Calabrese, The Emergence of the Dose-Response Concept in Biology and Medicine, Int. J. Mol. Sci., 2016, 17, 2034, DOI:10.3390/ijms17122034.
- M. P. Mattson, Hormesis Defined, Ageing Res. Rev., 2008, 7, 1–7, DOI:10.1016/j.arr.2007.08.007.
- P. Yang, X. Q. He, L. Peng, A. P. Li, X. R. Wang, J. W. Zhou and Q. Z. Liu, The Role of Oxidative Stress in Hormesis Induced by Sodium Arsenite in Human Embryo Lung Fibroblast (HELF) Cellular Proliferation Model, J. Toxicol. Environ. Health, Part A, 2007, 70, 976–983, DOI:10.1080/15287390701290832.
- R. Franco, G. Navarro and E. Martínez-Pinilla, Hormetic and Mitochondria-Related Mechanisms of Antioxidant Action of Phytochemicals, Antioxidants, 2019, 8, 1–12, DOI:10.3390/antiox8090373.
- Y. Liu, K. Z. Guyton, M. Gorospe, Q. Xu, J. C. Lee and N. J. Holbrook, Differential Activation of ERK, JNK/SAPK and P38/CSBP/RK Map Kinase Family Members during the Cellular Response to Arsenite, Free Radical Biol. Med., 1996, 21, 771–781, DOI:10.1016/0891-5849(96)00176-1.
Footnote |
| † Electronic supplementary information (ESI) available. See DOI: https://doi.org/10.1039/d3ra06443c |
| This journal is © The Royal Society of Chemistry 2024 |

