
 Open Access Article
 This Open Access Article is licensed under a Creative Commons Attribution-Non Commercial 3.0 Unported Licence
High-throughput light sheet imaging of adult and larval C. elegans Parkinson's disease model using a low-cost optofluidic device and a fluorescent microscope
Faraz Rahimpouresfahani ,
Nima Tabatabaei* and
Pouya Rezai*
,
Nima Tabatabaei* and
Pouya Rezai*
Department of Mechanical Engineering, York University, 4700 Keele St, Toronto, M3J 1P3, Ontario, Canada. E-mail: prezai@yorku.ca; nimatab@yorku.ca; Tel: +1-416-7362100
First published on 2nd January 2024
Abstract
Recent advancements at the interface of microfluidics technology and light sheet fluorescence microscopy have opened the door for high-throughput and high-content investigation of C. elegans disease models. In this paper, we report on the development of a simple, miniaturized, and low-cost optofluidic platform that can be added to a conventional inverted fluorescent microscope for continuous light sheet imaging of transgenic worm populations with high lateral and axial resolutions of 1.1 µm and 2.4 µm, respectively. The optofluidic device is made entirely of PDMS with integrated optics for light sheet generation. Laser excitation is delivered to the device via a low-cost free space laser, and cross-sections of worm populations are imaged as they pass continuously through a channel. Results show the platform can image NW1229 whole worms with pan-neural fluorescent expression at a throughput of >20 worms per minute at L3 and young adult (YA) stages. As a benchmark test, we show that the low-cost device can quantify the reduced neuronal expressions of L3 and YA NW1229 worms when exposed to 500 µM 6-OHDA neurodegenerative agent. Following the benchmark validation, we utilized the platform in a novel application for imaging human alpha-synuclein reporter in populations of Parkinson's transgenic model (ERS100). Results show the ability of the low-cost platform to reliably detect and quantify the anomalous neural phenotypic changes in ERS100 populations at L3 and YA stages with high spatial resolution. The findings of this study show the potential of our low-cost optofluidic add-on platform to equip conventional fluorescent microscopes with light sheet capability for quantitative phenotypic studies of transgenic C. elegans at high resolution and throughput.
Introduction
Parkinson's disease (PD) is the second-most prevalent aging-related neurodegenerative disorder.1 Monogenic parkinsonism is linked to more than 20 genes, including the autosomal dominant SNCA gene. Alpha-synuclein (α-Syn) is a protein encoded by the SNCA gene and abnormal accumulation and aggregation of α-Syn is frequently associated with dysfunctionality and degeneration of neurons in PD.2 Given the role of the α-Syn in the pathology of PD, animal models focusing on dopaminergic (DA) neuronal loss and aggregation of α-Syn in the brain are deemed invaluable tools for understanding PD's molecular and cellular mechanisms and validating new therapies.3Among animal models, non-mammalian model organisms (e.g., C. elegans, D. melanogaster, and D. rerio) are specifically interesting because they serve as a simple, rapidly growing, and low-cost model in between cell and animal assays.4 C. elegans models are great candidates for PD studies because their neural network has been mapped entirely,5 allowing each neuron to be traced to its origin. Furthermore, the short life span of C. elegans allows for the convenient performance of longitudinal studies from the early to adult stages, essential for understanding cellular and molecular processes, genetics,6 and diseases.7 Ability to study C. elegans at all developmental stages is also crucial for drug discovery in neurodegenerative diseases like PD, where ageing is a known risk factor for alpha-synucleinopathies.8
Multiple transgenic worm strains have so far been reported for PD and α-Syn studies. For instance, the A53T α-Syn mutation exhibits non-progressive neurodegeneration, abnormalities in locomotion, and DA neurodegeneration.9 It also expresses α-Syn both pan-neurally and exclusively in DA neurons. Nevertheless, this model does not show increased DA neurodegeneration or difficulties in locomotion with age.10 The NL5901 model exhibits observable inclusions of α-Syn that grow with age, facilitating biochemical investigations and fluorescent protein interaction studies, including α-Syn misfolding in body-wall muscle cells. Although reported modulators of α-Syn misfolding in the NL5901 model have shown to be discordant with Drosophila and mammalian models of PD, it has been suggested that the usage of α-Syn fusion protein with a yellow fluorescent protein (YFP) does not accurately mimic native structural dynamics.11 Recently, a new transgenic C. elegans PD model, ERS100, which expresses green fluorescent protein (GFP) reporter of human α-Syn in DA, was reported.3 ERS100 exhibits a progressive degeneration of DA neurons that worsens with age. The study demonstrated the model's efficacy in monitoring human α-Syn expression in DA neurons during ageing, which is significant to PD drug discovery research.
A key element for the success of the above investigations on C. elegans PD models is the ability to image and quantify fluorescent expressions of populations of C. elegans at high speed, with high resolution, with minimal photodamage to the animals, and preferably at low cost. Confocal fluorescence microscopy offers unprecedented image resolution but is relatively slow, high-cost, and prone to photo-damaging.12,13 High-speed confocal imaging of C. elegans structures has also been reported via spectrally-encoded confocal microscopy, yet such systems are complex and expensive from an instrumentation point of view.14 Conventional light sheet microscopy, on the other hand, offers high image resolution with minimal photodamage but requires complex and costly instrumentation, which makes it less accessible to researchers.15,16
Table 1 compares the performance metrics of leading C. elegans light sheet imaging platforms. The first platform (i.e., the first row) is based on Inverted Selective Plane Illumination Microscopy (iSPIM), offering an exploration of dynamic neurodevelopmental processes in C. elegans with minimal phototoxicity.17 This platform, however, is complex and expensive while requiring sample mounting, immobilization, and scanning, significantly lowering its effective throughput (see the last column). The use of novel imaging methods is vital to overcome the impediments associated with high-resolution confocal and light-sheet microscopy.
| C. elegans light-sheet imaging | Resolution (µm) | C. elegans strain | Age | Performance | |
|---|---|---|---|---|---|
| Lateral | Axial | ||||
| Identification of neurons expressing transcription factor and visualization of neurodevelopmental dynamics17 | 0.52 | 1.7 | BV24, BV17 | Embryo | Throughput |
| ●○○ | |||||
| Affordability | |||||
| ●●○ | |||||
| Imaging PVD sensory neurons and nuclei in the intestinal19 | 1.1 | 6.2 | NC1686 | Adult | Throughput |
| ●●○ | |||||
| Affordability | |||||
| ●●○ | |||||
| Phenotypic screening of polyglutamine aggregation in Huntington's disease model20 | 3.5 | 3.5 | CZ10175, CZ1200, PolyQ24, PolyQ40 | L4 | Throughput |
| ●●● | |||||
| Affordability | |||||
| ●○○ | |||||
| Imaging DNs using a low-cost light sheet add-on device21 | 1.1 | 2.4 | NW1229; BZ555 | Adult | Throughput |
| ●○○ | |||||
| Affordability | |||||
| ●●● | |||||
To overcome the mounting and immobilization limitations, microfluidic-based solutions have been proposed for the automated and rapid loading of C. elegans in confocal and light sheet imaging platforms.18 These platforms enable faster and more convenient sample loading while simultaneously allowing for continuous imaging of C. elegans without interfering with other functions. Another appealing feature of microfluidic solutions is their ability to regulate the flow of C. elegans through the imaging plane of microscopy systems to minimize non-uniform motion artifacts. That is, given the specimen's characteristics (e.g., shape, size, mass, and fluorophore's emission properties) and sensor per camera's specifications (e.g., quantum efficiency, sensitivity, and frame rate), flow speed can be controlled to achieve continuous high-resolution imaging of C. elegans. For instance, McGorty et al. developed the open-top SPIM and utilized it for imaging several disease models, including the C. elegans with PVD sensory neurons and nuclei in the intestinal cells and Drosophila embryos.19 Although the C. elegans images were acquired via the conventional sample mounting, they demonstrated their platform compatibility with a high throughput workflow via a microfluidic chip. The motorized stage scanned through 32 Drosophila embryos trapped in a straight microchannel for as short as 2.3 minutes, with a 100 µm s−1 scanning speed and a 100 frame per second rate. Despite the facilitation of sample loading through the microfluidics chip, the platform's throughput is constrained (see the second row), and its simplicity and affordability are compromised by the presence of a motorized scanning stage.
Ben-Yakar's group shifted their high-throughput and high-content imaging methodology from robotic scanning of microfluidic chips in 96-well format to a stationary scanning approach, employing a light sheet generated within the microchannel to capture samples as they pass through. The newly developed technique, known as line excitation array detection (LEAD) fluorescence microscopy, exhibits a 50-fold increase in throughput compared to the conventional robotic scanning approach.20,22,23 LEAD was a complex SPIM, for 3D high-speed flow cytometry of C. elegans. It could acquire 800k frames per second of a worm moving at 1 m s−1 speed through a microfluidic channel. A comprehensive image of polyglutamine aggregation model C. elegans in ∼1 ms per animal demonstrated the system's high-speed functionality. It is an intricate optical system containing an illumination arm for generating a virtual 3 µm light sheet, a detection arm with a photomultiplier array (PMT), and a speed detection arm to measure the speed as worms pass through the light sheet. Their imaging speed significantly surpasses that of other existing systems. However, the key drawback of any sophisticated platform is its initial cost preventing its widespread adoption by end users. To address this issue, other studies have focused on making the light sheet platforms more affordable and compact.24–26
In a recent study of our group, we reported on developing a low-cost light sheet add-on that can be operated with conventional microscopes to solve the technical complexity and cost of conventional light sheet systems while making the imaging system accessible to researchers.21 We used an optofluidic chip with a low-cost PDMS-integrated lens for light sheet formation with lateral and axial resolutions of 1.1 µm and 2.4 µm full-width at half-maximum (FWHM), respectively. While in this preliminary work, we showed the ability to image an entire worm; the system suffered from key limitations such as the inability to continuously image worms' populations, lack of adaptability to image worms at different developmental stages, and lack of imaging consistency to enable quantitative fluorescent expression studies.
This paper reports on optimizing our preliminary technology to overcome its limitations. The main objective is to increase the throughput of Behrouzi's study21 while keeping the cost of fabrication similar. We utilize a similar cost-effective method for the fabrication of our light-sheet optofluidic system. The optimized system incorporates an optofluidic chip that features an embedded lens and a channel size designed for light sheet generation and the partial immobilization of nematodes. This system is tailored for continuous imaging of C. elegans and is complemented by a high frame rate sCMOS camera, as well as a pressure-based flow delivery sub-system. The performance of the optimized system is validated via continuous flow-based imaging of NW1229 populations. The reliability of the system is demonstrated through the analysis of 6-OHDA-treated NW1229. Further, two different microfluidic designs with different channel sizes were fabricated and used for imaging different C. elegans strains in different stages of development (i.e., ERS100 and NW1229 at both L3 and YA). The proposed system facilitated the in-depth analysis of protein aggregation of nematodes in different development stages, showing the adaptability of the proposed high-throughput system for imaging nematodes with different sizes. Qualitative and quantitative analysis of results demonstrates the effectiveness and versatility of the optimized, low-cost imaging platform in capturing the developmental dynamics and detecting protein expressions of PD model C. elegans with high temporal resolution.
Methods and materials
Experimental setup
Fig. 1A illustrates the experimental configuration of the cost-effective yet high-throughput light sheet imaging platform. This system consists of three primary sub-systems: a flow delivery system, an image acquisition system, and an optofluidic chip. The first two components are described below, and the optofluidic device is discussed in the next section. | ||
| Fig. 1 Experimental setup. (A) The front view of the experimental setup contains the image acquisition add-on, flow delivery package and the optofluidic chip. (B) Side view of the experimental setup, including a free-space and low-cost laser source and an iris that was used to generate the input excitation beam of the optofluidic device. The optofluidic add-on device is placed on the inverted widefield fluorescent microscope. The generated light sheet replaced the epi-illumination of the host microscope. The emitted fluorescent was collected by the native objective lens of the microscope and recorded using an sCMOS camera. | ||
Even with age synchronization, the inherent variability in the worms' size and unpredictable movement patterns can lead to pressure fluctuations within the system. As the syringe pump operates at a preset flow rate, the pressure buildup resulting from differences in size can disrupt the steady flow. This lack of control can impede the accurate manipulation and positioning of the worms, impacting experimental reproducibility and data quality. To accommodate both unpredictable movements and size fluctuations, the flow delivery system includes a pressure-driven pump (Flow EZ, Fluigent, France) and a microfluidic flow sensor (FLOW UNIT, Fluigent, France). The pressure pump's encapsulated inlet reservoir facilitates the uninterrupted injection of worms without clogging, irrespective of their relative size. The flow sensor enables the platform to adapt to slight variations in worm size by controlling the pressure and flow rate within the optofluidic chip.
The image acquisition system starts with a low-cost, free-space laser diode source (λ: 488 nm, 3 mW, OXlasers A-B60F, China). While our platform allows for excitation of samples at a broad spectrum of wavelengths, 488 nm excitation wavelength was selected to accommodate excitation of a wide range of fluorophores such as the GFP targeted in studies of this work. To obtain optimal imaging performance the light sheet thickness must be tuned to closely match the diameter of C. elegans neurons. To achieve this, we employed OpticStudio Zemax simulations to define the optical specifications of our chip. An iris is utilized to ensure the illumination beam size complies with the input laser size determined by Zemax simulation. The laser and the iris are mounted in a customized 3D-printed fixture, and the entire assembly is fixed to an optical post attached to a set of linear translation stages, as shown in Fig. 1B. The 3 degrees of freedom offered by the translation stages are used to align the collimated laser beam with the integrated cylindrical lens to generate a uniform cross-sectional light sheet in the device channel. The emitted light sheet illuminates the neurons of the animals, and this illumination is captured by a high frame rate 5.5-Mpixel sCMOS camera (Edge 5.5, PCO, Germany). This sCMOS camera can accommodate a frame rate of ∼900 frames per second (FPS) within the region of interest. Furthermore, it maintains a high detection sensitivity, enabling the acquisition of weak fluorescent expressions from the sample.
Optofluidic add-on device
The optofluidic chip has a U-shape design (Fig. 2A) and is comprised of three main components: (1) inlet and outlet reservoirs (Fig. 2B) for introducing the worms suspended in M9 buffer into the device and their removal after imaging; (2) a microchannel with a 90-degree bend to facilitate cross-sectional light sheet excitation and collection of the fluorescence emissions of the worms via the microscope's native objective lens (Plan Fluor 10×/0.3 NA; TE300 Inverted Fluorescence Microscope, Nikon, Japan) with minimal light interactions with the device (Fig. 2C); and (3) an integrated PDMS microlens specifically designed and optimized (via OpticStudio Zemax software) to focus the collimated excitation laser beam into a ∼2 µm thick light sheet at the center of the microchannel and just above the channel bend, as illustrated in Fig. 2B. A gradual reduction of the microchannel width allows the train of worms to be slowed while limiting their lateral motion as they continuously pass through the light sheet. Given that ERS100 PD model worms display phenotypes after the L2 stage, two similar device designs are employed, one with a 50 µm wide microchannel at the light sheet to image YA worms and another with a 30 µm necking region to image L3 C. elegans (Fig. 2C). | ||
| Fig. 2 Schematics of the mechanical and optical design of the optofluidic chip. (A) Schematic of excitation (blue) and emission (green) beams with respect to host microscope objective lens, high frame rate camera and the optofluidic chip. The front view of the actual light sheet at the bend in the darkfield is displayed within the inset of (A) (created with https://www.biorender.com/). (B) Schematic of the front view of the chip's design displaying the inlet and outlet with respect to the PDMS-integrated micro lens. (C) Zoom view of the bend illustrating dimensions of microchannels for L3 and YA stages and radius of the micro lens in addition to the light sheet thickness and beam diameter. | ||
Silicon (Si) wafers with 4 inches diameter and a 500–550 µm thickness were purchased from Wafer World Inc., USA, to create the devices. Although the designs are identical, there are differences in the channel dimensions for imaging L3 and YA worms, which require using different SU-8 photoresists (MicroChem Corporation, USA) and recipes. First, the SU-8 photoresist layer is spin-coated onto the Si substrate. In the case of the device for imaging L3 worms, a layer of ∼30 µm thick SU-8 2035 is applied via spin coating. Conversely, a layer of SU-8 2075 with a thickness of ∼50 µm for YA worm imaging is spin-coated. This layer is then baked to remove any residual solvents and to improve adhesion to the substrate. Next, a photomask containing our pattern is aligned to the substrate and the photoresist layer is exposed to UV light through the mask. The exposed photoresist is then baked again before the development step. The development process selectively removes the unexposed regions and reveals the underlying substrate. Finally, the substrate goes through the hard bake one last time to ensure that the SU-8 properties do not change.
To replicate PDMS devices, PDMS elastomer base and curing agents (Dow Corning, USA) are mixed at a 10![[thin space (1/6-em)]](https://www.rsc.org/images/entities/char_2009.gif) :1 ratio, degasified, and poured onto Si-SU8 master moulds. After curing for 2 hours at 80 °C, the cured PDMS layer is de-moulded, and through-holes are punched using a 0.5 mm diameter biopsy punch for inlet and outlet holes (WellTech). Next, the devices are cut and bonded to flat PDMS layers using oxygen plasma (PDC-001-HP Harrick Plasma, USA) at 870 mTorr pressure and 30 W for 40 seconds. The bonded layers are then heated for 15 minutes at 70 °C to enhance bonding.
:1 ratio, degasified, and poured onto Si-SU8 master moulds. After curing for 2 hours at 80 °C, the cured PDMS layer is de-moulded, and through-holes are punched using a 0.5 mm diameter biopsy punch for inlet and outlet holes (WellTech). Next, the devices are cut and bonded to flat PDMS layers using oxygen plasma (PDC-001-HP Harrick Plasma, USA) at 870 mTorr pressure and 30 W for 40 seconds. The bonded layers are then heated for 15 minutes at 70 °C to enhance bonding.
To enable light sheet imaging on an inverted microscope, the devices are cut close to the light sheet plane, leaving a 450 µm thick PDMS wall between the light sheet plane and the edge of the device, as seen in Fig. 2C. However, the air-PDMS contact becomes rough after the devices are cut, which can deteriorate the quality of recorded images. To avoid this systematic issue, the devices are stamped sidewise onto thin PDMS prepolymer layers to optically smoothen the cut surfaces.
The light sheet thickness design of 2.3 µm effectively enables the imaging of GFP biomarkers within the size range of ∼5–10 µm27 in both L3 and YA worms. Achieving a 50 µm wide light sheet with a 488 nm excitation wavelength necessitates a light sheet thickness of approximately 2.3 µm (FWHM), as determined by the Gaussian beam optics of the YA (50 µm) device. OpticStudio Zemax simulations determined that a 200 µm radius of curvature of the PDMS cylindrical microlens can satisfy the required light sheet specifications from a Gaussian input beam with a diameter of about 90 µm. The sole distinction within the 30 µm configuration is the gap between the micro lens and the microchannel, which is once more optimized via the Zemax simulation. After the alignment, worms' cross-sectional light sheet images were continuously acquired via a monochrome high frame rate sCMOS camera.
Worm preparation
All bacteria and worm maintenance procedures were performed under biosafety number 02–19 issued by York University's Biosafety Committee to PR. C. elegans strains that are used in this study are NW1229 [expressing green fluorescent protein (GFP) pan-neuronally; F25B3.3::GFP+dpy-20(+)] and ERS100 [a transgenic strain expressing green fluorescent protein (GFP) based reporter of human α-Syn in DA neurons; dat-1p::mCherry;dat-1p::hSNCA::GFP(Venus)].3 These strains were acquired from the Caenorhabditis Genetics Center (USA, Saint Paul) and Eurac Research (Italy, Bolzano).All chemicals were purchased from Sigma-Aldrich, USA. The conventional procedures listed in the Wormbook28 were followed in preparing nematode growth medium (NGM) agar plates. All experiments were conducted on freshly produced NGM plates containing bacterial lawns and kept at room temperature (approximately 22 °C) in a biological safety cabinet. The cabinet was pre-sterilized with UV light and cleaned with a 70% ethanol in water solution to avoid contamination.
A “lawn” of Escherichia coli (E. coli) strain OP50 was seeded onto the NGM plates at room temperature. To prepare the bacteria, a single E. coli OP50 colony from a source streak plate was added to LB-Broth media, and it was then cultivated overnight at 37 °C in a shaker incubator to produce the OP50 supply. Twenty-five grams of LB-Broth were combined with 1 litre of distilled water and autoclaved to create the LB-Broth medium. After centrifuging the inoculated enriched media to concentrate the bacterial culture, 200 µl of the E. coli OP50 source was added to the plates, which were then allowed to dry overnight. All experiments are conducted using YA and L3 worms that are well-fed and age-synchronized (48 and 24 hours). The standard alkaline hypochlorite treatment procedure was used to obtain synchronized worms.4 The gravid worms were removed from the NGM plate using M9 buffer (3 g KH2PO4, 6 g Na2HPO4, 5 g NaCl, and 1 ml 1 M MgSO4 in 1 L distilled water) in a 15 ml Eppendorf tube. Then they were treated for 10 minutes with a solution of 3.875 ml double-distilled water, 125 µl 1 M NaOH, and 1 ml of sodium hypochlorite ∼6%. The worm cuticle was removed during this procedure, while the worm eggs were unaffected. After the procedure, samples were centrifuged for a minute at 1500 rpm to sink eggs at the bottom for collection. The eggs were incubated overnight with M9 buffer and RotoFlexTM tube rotator (RK-04397-40, Cole-Parmer, Canada), producing L1 larvae. To conduct the test, hatched larvae are placed onto newly prepared NGM plates and allowed to grow until they reach the L3 and YA stages.
We made a 10 mM solution of 6-OHDA (636-00-0, Sigma-Aldrich) to study neurodegeneration. 6-OHDA solution was prepared in a dark room and stored at −20 °C. We diluted 50 µL of our 10 mM 6-OHDA solution with 950 µL M9 to have 500 µM solution. We exposed the synchronized L1 larvae to this mixture in a dark room for 1 hour.
Imaging procedure
We introduce Rhodamine (Rhodamine 110 chloride, Sigma-Aldrich) into every fabricated chip and capture side-view images to confirm the fabricated lens's capability to achieve the intended light sheet thickness and width. Following this validation, we proceed to capture images using the chip in its regular orientation to verify the precise alignment required for light sheet imaging. To do so, translation stages of the excitation sub-system are tuned to optimize the alignment of the collimated laser excitation beam with respect to the integrated PDMS lens while monitoring the uniformity and intensity of the light sheet fluorescent images recorded by the camera and inverted microscope.Based on the Nyquist–Shannon sampling theorem, the image's spatial sampling rate should be at least twice as fine as the smallest detail that needs to be resolved. This criterion implies that to capture the details of the ∼2 µm neurons in the direction of flow accurately and continuously, the axial sampling resolution of the imaging system should be at least 1 micron (i.e., half the size of the neuron). This means the flow rate needs to be adjusted for comprehensive imaging of entire worms such that at least ∼750 and ∼1000 frames are recorded from L3 and YA worms, respectively.
To further enhance the throughput, under-sampling in the flow direction can be exercised. In our experience, the trade-off between axial sampling rate and throughput can be carefully optimized to ensure that under-sampling does not compromise the fidelity of the reconstructed images beyond an acceptable level. For worms studied in this work and for the size of the region of interest in our system (100 × 100 pixel2, with each pixel having a physical dimension of 0.65 µm) we found that the worms can be reliably imaged in <0.5 s while running the camera at 865 FPS and flowing the YA and L3 worms at rates of 5 and 1.5 µl min−1, respectively.
For each experiment, all the age-synchronized worms are injected through one device under similar conditions to minimize the chances of systematic errors caused by day-to-day variations in light intensity of the laser, which can jeopardize the validity of quantitative studies of neuronal expressions. A total of six experiments are performed to assess the throughput at various developmental stages. Specifically, three experiments are conducted for the L3 stage, and an additional three experiments are carried out for the YA stage, utilizing the aforementioned flow rates. These experiments evaluated the platform's throughput and determined the standard deviation at each respective stage.
Post-processing
Initially, a region of interest (ROI) of 104 pixels corresponding to an area of approximately 65 µm × 65 µm is cropped from the original image per slice sequence. The background is then subtracted by applying the built-in rolling-ball algorithm present in ImageJ.29Due to the continuous nature of worm imaging, an abundant amount of data is generated, which must be further processed to collect the relevant information. To extract the fluorescent-bearing frames, a thresholding algorithm was developed in MATLAB which could eliminate blank frames from the 3D image datasets with a speed of 503.41 ± 95.92 FPS.
Due to its biological significance, the nerve ring is a key point of interest among the frames containing signals in both transgenic worms. Six out of the eight DA neurons (anterior deirids and cephalic sensilla) are situated within the worms' head, while a single pair is found in the posterior lateral position (PDE).5,30 The anterior deirids (ADE) and cephalic sensilla (CEP) pairs exhibit lateral and dorsal entry routes to the nerve ring, respectively, thereby establishing it as a prominent site for conducting neurodegenerative studies.31
To facilitate unbiased and accelerated identification of nerve ring images in datasets, an automatic labelling algorithm was developed. The algorithm first reduced the dimensionality of the 3D image datasets by representing each image slice with a single value corresponding to slice/frame mean fluorescent intensity (MFI). By doing so, the 3D stack of slices was reduced to a 2D signal. As the nerve ring exhibits the highest fluorescence expression throughout the worm's entire nervous system, MATLAB's signal processing toolbox was utilized to identify the signal peak associated with a worm nerve ring. The start and end frames corresponding to the nerve ring region were estimated using the signal peak's Full Width at Half Maximum (FWHM). Finally, the mean intensity of the nerve ring (MINR) was defined and calculated as the average of MFI values corresponding to worms' nerve ring regions. The calculated MINR values were later used for statistical comparisons among the studied population groups.
Statistical analysis
All results are presented as mean ± standard deviation (SD), while the differences between the populations are compared using a two-tailed Welch's t-test due to unequal variances. The groups are considered significantly different at a P-value less than 0.05. Welch's t-test is performed using GraphPad Prism version 9.4.0 and graphically presented via estimation plots. We utilized the ROUT method with a 2% threshold for outlier removal. Additionally, we employed max scaling for normalization, which involved dividing the datasets by the maximum value of the control dataset.Results and discussion
Light sheet microscopy is a powerful tool for visualizing and quantifying protein or neuron expressions in specific neurons or neuronal populations. However, there has been limitted reports of a low-cost light sheet technology for screening the larval stages of C. elegans. In addition, existing low-cost light-sheet platforms suffer from low throughput and low imaging sampling rate which hinder their use in most biological studies. The low throughput of existing low-cost platforms is predominantly due to their requirement for sample immobilization and mechanical scanning of the samples. The developed low-cost and compact add-on module reported in this study, on the other hand, is used together with a conventional fluorescent microscope and can offer continuous light sheet imaging of L3 and YA C. elegans populations. Apart from the standard components (inverted microscope, camera, and pump) available in most laboratories, the only parts required for the setup are the low-cost laser diode sub-system and the optofluidic device, which cost less than a hundred USD.Continuous pan-neural light sheet imaging of C. elegans at different developmental stages
We use the setup and optofluidic device reported in Fig. 1 and 2 to continuously image populations of NW1229 expressing GFP pan-neuronally at L3 and YA stages. The NW1229 strain presents a favorable candidate for the examination of neural tissues using light sheet microscopy, owing to its extensive fluorescent expression throughout neural cells. Owing to the flow-based cross-sectional imaging ability of the developed system, comprehensive microscopic imaging can be done on worm populations, and any region of the nervous system can later be studied for further analysis. For example, Fig. 3A depicts the light sheet images of DA neurons, which are of great interest in neurodegenerative disorders such as PD, for two populations of NW1229 at the L3 and YA stages. Each population involves ∼100 worms that are imaged within ∼4.9 and ∼5.8 min for the L3 and the YA worms, respectively. The nerve ring forms an O-shaped or U-shaped structure at both stages, depending on the distance between neurons. If neurons are in close proximity, they fit within a single image slice, creating an O shape pattern. In contrast, if they are sufficiently separated when the worm passes through the light sheet, neurons cannot be captured within the same image slice. In such cases, one part is clearly captured in a frame while the other pair appears in the background, resulting in a U shape pattern. Owing to such inevitable variations, for the purpose of quantitative analyses, we partition and compare the entire DA region frames rather than comparing a single representative frame of the nerve ring. The system continuously and consistently captures similar high-resolution light sheet images of other anatomical locations of the worm. Such images can be stitched together to offer comprehensive and volumetric fluorescent expression maps of worm populations, such as the representative volumetric image depicted in Fig. 3C for an L3 worm composed of ∼1000 frames. Here, the figure insets show high-resolution light sheet images of neuronal expressions along the worm's body from head to tail at six different anatomical locations. The results depicted in Fig. 3 qualitatively demonstrate the ability of the developed low-cost platform in continuous light sheet fluorescent imaging of C. elegans populations for studying their neuronal expressions at different developmental stages, at high speed and with high resolution.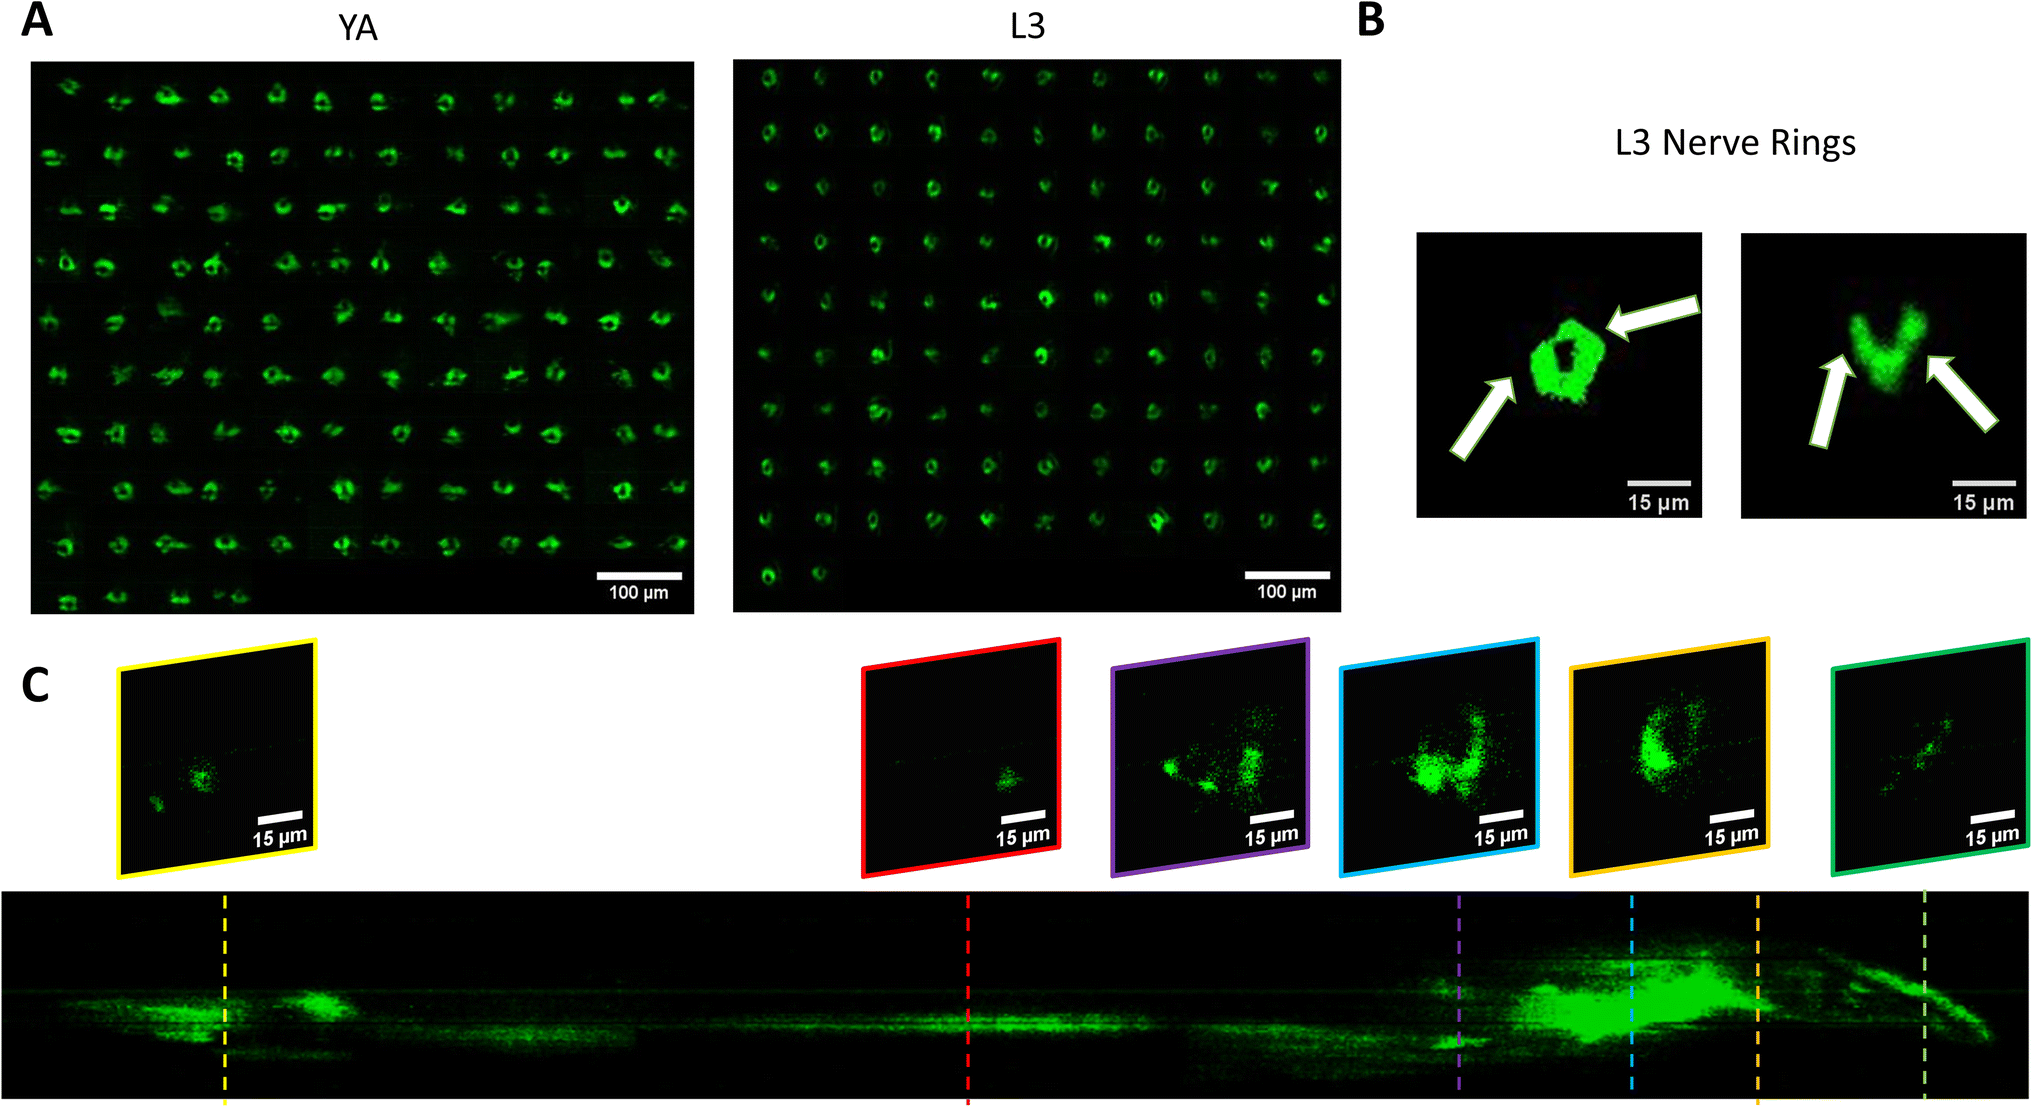 | ||
| Fig. 3 Qualitative analysis of the fluorescent expression of NW1229 worms at two developmental stages. (A) Montage of cross-sectional images of fluorescence expression of the nerve ring of worms at YA (Left) for n = 112 worms and L3 (Right) stages for n = 101 worms. (B) Representative cross-sectional images of fluorescence expression of nerve rings in L3 worms in O and U shapes indicated by white arrows. (C) Comprehensive stack of images with ∼1000 acquired frames of NW1229 strain with representative slices showing the nervous system in detail. | ||
Quantitative image analysis can provide insights into the molecular and cellular mechanisms underlying the development of the C. elegans nervous system. GFP expression histograms can be advantageous in evaluating the overall size and expression strength of neurons and proteins. The DA region of ∼100 different NW1229 worms for each age were separated, and the entire stack's histogram was evaluated. As shown in Fig. 4A, this comparative histogram displays the number of pixels corresponding to each intensity value for the L3 and YA worm populations. The x-axis represents the fluorescence intensity, while the y-axis accounts for the number of pixels, which shows the area of the expression region. To enhance the visualization of the graph, the first two intensity values were removed from the histogram, as they were deemed to be equivalent to the background. Both histograms exhibit identical shapes, featuring a peak in the lower intensities and a gradual decrease towards the higher intensity values. This observation indicates that the fluorescence expressions predominantly consist of weak signals, far from reaching saturation levels. An additional variable of interest for analysis is the distribution of the histogram, which offers insight into the prevalence of particular intensity values and provides an overview of the fluorescence expression strength of the neurons. The histogram of the YA population exhibits a greater number of pixels compared to the larval L3 stage, indicating a larger area of fluorescence expression. Similarly, this pattern is replicated in the intensity values of the pixels, with YA pixels corresponding to higher intensity values, indicative of more robust fluorescence expression. We postulate that the growth of the worm's nervous system is the underlying factor contributing to the observed augmentation in both the area and intensity of fluorescence expressions. To explore the growth in a more quantitative manner, we conducted calculations and compared the MINRs for a sample size of ∼100 worms, as depicted in Fig. 4B. Statistical analysis of quantified parameters reveals a significant difference between the YA and L3 MINRs. The MINR in the L3 group is 6.83 (SD = 1.81), whereas the mean in the YA group is 13.05 (SD = 3.18). A Welch's t-test showed that the difference was statistically significant, t(180.5) = 17.63, p < 0.0001; where t(180.5) is a shorthand notation for a Welch t-statistic that has 180.5 degrees of freedom.
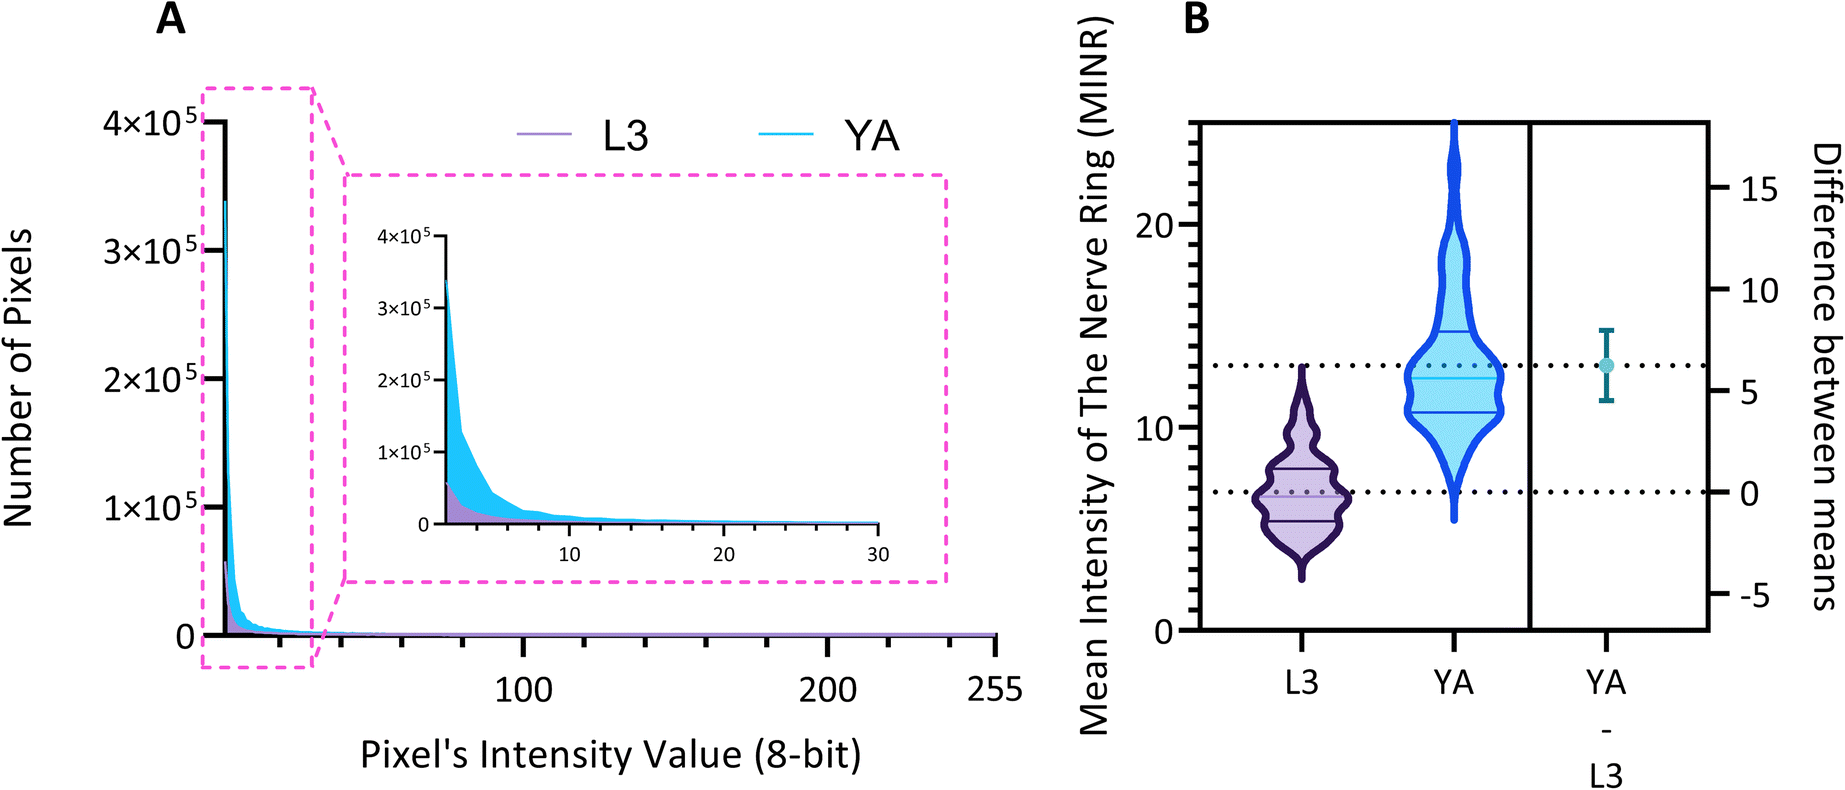 | ||
| Fig. 4 Quantitative analysis of the mean fluorescence intensity in the pan neuronal NW1229 nerve rings. (A) Histograms illustrate the increase in both the spatial extent and intensity of expression due to aging. The number of pixels, serving as a representative measure of the area, consistently demonstrates an upward trend. Simultaneously, the maximum intensity value exhibits a corresponding rise, reflecting the heightened magnitude of expression. The Inset view displays the zoom view of the first 30-pixel intensity values. (B) Violin plots depicting the distribution of data for L3 (left) and YA (middle) groups. The dashed lines at the top and bottom of each violin represent the first and last quarters of the data, respectively, while the middle line denotes the median. The dashed lines that cross the right y-axis correspond to the mean value for each group. The mean value of L3 is set as the origin (0), and the difference in means between L3 and YA is illustrated by a 95% confidence interval (CI) bar extending to the mean of YA. | ||
Results of Fig. 3 and 4 show capability of the low-cost and compact platform in providing high content light sheet images of worm populations at different developmental stages and its ability to quantify the neuronal expressions. Adaptability of the platform to various developmental stages is particularly advantageous in capturing the increased fluorescence expression observed in aging worms, attributed to the growth of their neurons, which can be accurately detected and statistically quantified. We anticipate that the same platform can be adapted for carrying out studies on other model organisms across various developmental stages or for cell studies.
Continuous light sheet imaging of fluorescent suppression in neurotoxin-exposed C. elegans at different developmental stages
Having demonstrated the capability of our platform in qualitative and quantitative light sheet imaging of neuronal expressions of NW1229, this section aims to demonstrate the application of our cost-effective, high-throughput platform within the domain of neurotoxin screening. Specifically, we administered 6-hydroxydopamine (6-OHDA), a well-established neurotoxin, to worms as a model for emulating neurodegenerations. Use of 6-OHDA as a control experiment for validating efficacy of systems for imaging neurodegeneration has also been reported by others.32,33 Specifically, we employed the NW1229 strain to examine the nerve ring and assess fluorescent suppression following exposure to 500 µM 6-OHDA.Fig. 5 depicts the light sheet images of nerve rings of populations of NW1229 worms at the L3 and YA stages with and without exposure to 500 µM 6-OHDA. A qualitative comparison of images suggests pronounced expressions of GFP in untreated control worms at both developmental stages. Expressions of treated worms, however, appear to be decreased due to degeneration of neurons or GFP-reporters upon exposure to the 6-OHDA neurotoxin.
 | ||
| Fig. 5 Cross-sectional light-sheet images illustrating the fluorescence expressions within the nerve ring of NW1229 worms before and after exposure to 500 µM 6-OHDA. YA images on the top depict fluorescence expressions in control (n = 63, left) and exposed (n = 85, right) worms. Similar fluorescent expressions are shown for L3 control (n = 72, left) and exposed (n = 95, right) worms on the bottom row. All scale bars indicate 50 µm. | ||
Fig. 6 reports the measured MINR values of worm populations in both control and 6-OHDA treated groups at the L3 and YA stages. The MINR metric serves as a quantitative measure for assessing the fluorescent expression of neurons. Results show a statistically significant (p < 0.0001) reduction of fluorescent expression after 6-OHDA treatment at both developmental stages.
 | ||
| Fig. 6 Quantitative assessment of the normalized mean intensity within the nerve ring of NW1229 worms before and after exposure to 500 µM 6-OHDA at (A) L3 and (B) YA stages. Scatter dot plots are employed to visually represent the data distribution. The dashed lines intersecting the right y-axis correspond to the respective mean values for each group. The mean value of the control group serves as the reference point (origin 0) while the distinction in means between the control and exposed groups is graphically depicted by a 95% confidence interval (CI) bar. | ||
Results of the 6-OHDA study demonstrate the ability of the low-cost and high throughput platform in accelerated light sheet imaging and quantitative measurement of fluorescent suppression, which is instrumental in the effective uncovering of critical insights into the mechanisms of neurodegeneration and potential avenues for interventions.
Continuous light sheet protein aggregation imaging of C. elegans PD models at different developmental stages
As mentioned in the introduction section, α-Syn is a protein that plays a role in neurodegenerative diseases like PD, and its accumulation in the brain can lead to neuronal damage.34 The ERS100 transgenic PD model is a valuable worm strain for understanding PD's pathogenesis and evaluating potential therapies. The ERS100 expresses GFP fluorescence based on α-Syn accumulation in its DA. It is a great candidate for PD drug studies as the α-Syn development can be monitored and measured during its life span. According to the strain's description, fluorescent aggregation phenotypes begin from the L3 stage and continue until adulthood. In this study, we conducted quantitative light sheet imaging to examine if our technology can be used for α-Syn accumulation studies in the ERS100 strain.Fig. 7A illustrates the head DA regions of L3 and YA ERS100 worms (n = 148 for L3 and n = 62 for YA) with α-Syn aggregation in their DA neurons. In Fig. 7B, the presence of fluorescence clusters in DA neurons are visible. The volumetric stack of images acquired with the low-cost light sheet from the transgenic strain shows the protein expression at the L3 stage, as illustrated in Fig. 7C. This fluorescence intensity is not comparable quantitatively to those of the pan-neural strain in Fig. 4 since the NW1229 and ERS100 strains demonstrate different reporter expressions representing neurons and protein aggregation, respectively.
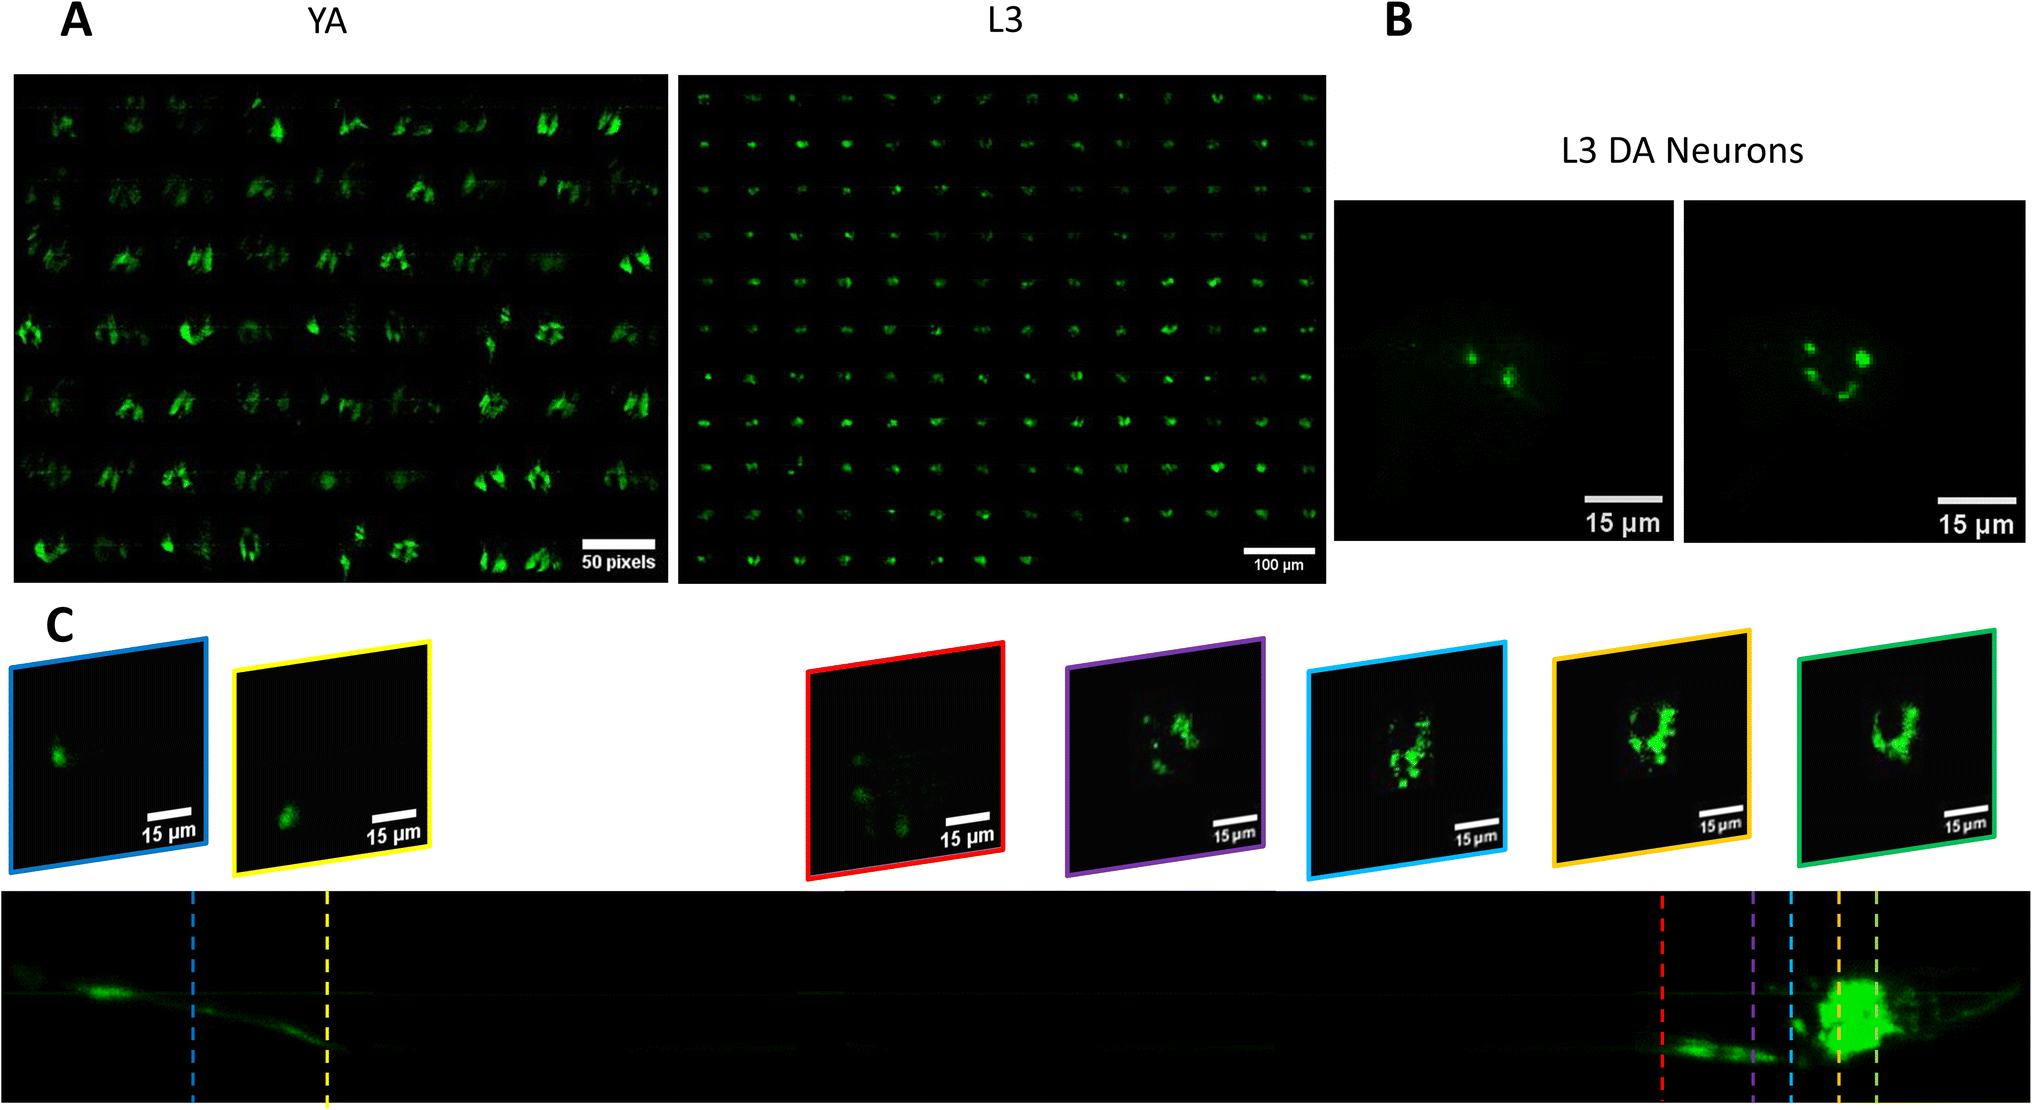 | ||
| Fig. 7 Qualitative analysis of the fluorescent expression of ERS100 worms at two developmental stages. (A) Cross-sectional images of fluorescence expression of the DA neurons of worms at YA (Left) for n = 62 worms and L3 (Right) for n = 148 worms. (B) Representative cross-sectional images of fluorescence expression of DA neurons in L3 worms. (C) Comprehensive stack of images with ∼1000 acquired frames of ERS100 with representative slices showing the neuronal expressions in detail. | ||
The relationship between aging and the development of α-Syn is complex and involves multiple pathways and mechanisms. However, evidence indicates that aging is a significant risk factor for developing alpha-synucleinopathies.8 Hence, by observing the changes that occur at different stages of development or in response to different treatments, researchers can gain insights into the biological processes that underlie diseases and identify potential targets for intervention. Here we monitor and quantify the penetrance of α-Syn in the DA neurons of ERS100 worms at L3 and YA stages. The Mean Fluorescence Intensity (MFI) measures the level of α-Syn accumulation in the specific phenotype location, providing a quantified assessment of its abundance. As shown in Fig. 8A, the MFI and aging are positively correlated. Furthermore, Fig. 8B indicates that the difference between MFI at L3 and YA was statistically significant (A Welch's t-test, t(78.17) = 9.38, p < 0.0001).
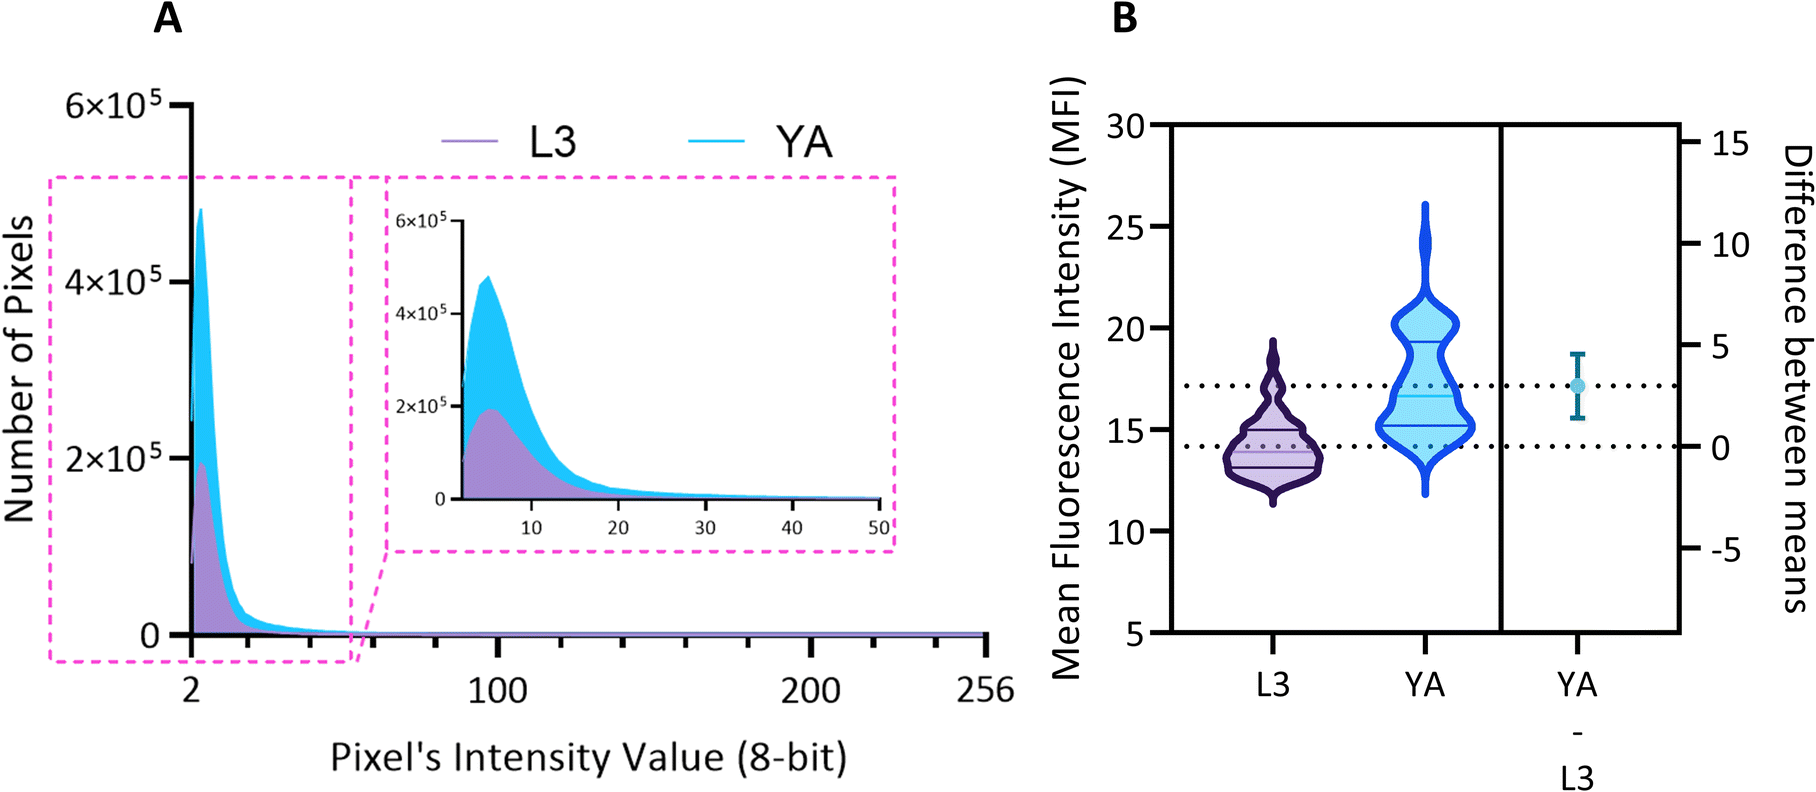 | ||
| Fig. 8 Quantitative analysis of the mean fluorescence intensity in the PD model ERS100 DA neurons. (A) Histograms illustrate the increase in both the spatial extent and intensity of expression due to aging. The number of pixels, serving as a representative measure of the area, consistently demonstrates an upward trend. Simultaneously, the maximum intensity value exhibits a corresponding rise, reflecting the heightened magnitude of expression. The inset view displays the zoom view of the first 50 pixel's intensity value. (B) Violin plots depicting the distribution of data for L3 (left) and YA (middle) groups. The dashed lines at the top and bottom of each violin represent the first and last quarters of the data, respectively, while the middle line denotes the median. The dashed lines that cross the right y-axis correspond to the mean value for each group. The mean value of L3 is set as the origin (0), and the difference in means between L3 and YA is illustrated by a 95% confidence interval (CI) bar extending to the mean of YA. | ||
The comprehensive results of Fig. 7 and 8 clearly show progressive aggregation of α-Syn in the head DA neurons as the worms age both qualitatively and quantitatively. The obtained results from developed low-cost and compact platform are in complete agreement with previous reports/findings.11,35
Throughput of the optofluidic light sheet add-on device
Our results demonstrate the feasibility of using the proposed light sheet microscopy method to rapidly image larval and YA C. elegans using a conventional fluorescent microscope. The imaging process involves acquiring approximately 400 frames from each worm in about half a second. As shown in Table 2, the throughput for imaging worms at the L3 stage was 24.64 ± 2.05 worms per minute, while the throughput for imaging worms at the YA stage was 20.67 ± 2.49 worms per minute.| Age | Acquired frames per worm | Frame rate (FPS) | Practical throughput (worms per min) | Ideal throughput (worms per min) |
|---|---|---|---|---|
| L3 | ∼400 | 865 | 24.64 ± 2.05 | ∼130 |
| YA | 20.67 ± 2.49 |
In practice, the worm population movement in microchannels is random, and increasing the specimen concentration solely will not lead to higher throughput, as overcrowding in the chip will cause channel clogging and experimental failure. In a series of preliminary experiments, we landed on ∼75 worms per mL to avoid clogging the device while providing enough flow of worms for imaging 20+ worms per minute. The maximum ideal throughput reported in Table 2 will reach over a hundred if worms pass back-to-back without blank frames between them. Such throughput optimization for reaching the ideal limit can be achieved by various means. For example, the addition of a specific concentration of ethanol can immobilize the worms and act as a surfactant within the microchannels, thereby facilitating smoother worm passage.36
The camera's frame rate also limits the device throughput as the worm transportation velocity must comply with the frame rate to avoid significant under-sampling. Another key consideration related to frame rate and, thus, throughput is the strength of fluorescence expression in the worm model. Reliable imaging of weak neuron fluorescence expressions requires increasing camera integration per exposure time, which lowers the frame rate and throughput. Choosing the smallest possible ROI will maximize the frame rate using the windowing setting of cameras to enhance the frame rate. For instance, in our system, an ROI just large enough to cover the channel cross section (65 × 65 µm2) yields the maximum frame rate of 865 FPS while this value at full frame (16.64 × 14.04 mm2) can be as small as 100 FPS.
Despite these considerations, our high-throughput light sheet imaging platform holds significant promise in the field of drug screening assays, where worm populations typically range ∼30 to 300 worms.37–41 Although our throughput was moderate compared to more complex and costly setups,20 our low-cost platform excels by enabling high-resolution imaging of the desired worm population in a matter of minutes.
Conclusion
While widefield fluorescence microscopes are commonplace in research labs, they do not offer the image resolution needed for the rigorous study of disease models. Light sheet fluorescence microscopes, on the other hand, offer excellent imaging performance, but are very costly and scarce. Previously reported high-content imaging platforms for C. elegans demand either dedicated/costly light sheet instrumentation or sample immobilization in gel-based media which significantly limits the imaging throughput. The low-cost platform optofluidic device reported in this manuscript, on the other hand, enables commonplace widefield fluorescence microscopes to acquire high-content light sheet fluorescence images at high throughput.Our results demonstrate the ability of the low-cost platform to quantify the expression of worm populations at different stages at high throughput and with high content. Experimental results from NW1229 and ERS100 strains of C. elegans validated the platform's ability to produce high-resolution images of the entire neuronal system on a large scale. Another key differentiator of the developed low-cost platform is its ability to reliably quantify neuronal expressions with a throughput of 20+ worms per min.
In this work, we also showed that the developed low-cost platform can be easily adapted for studies involving model organisms at different stages of growth. We specifically showed that the developed platform not only can produce high content light sheet images of α-Syn accumulation in nerve ring's DA neurons, but can also quantify the age-related changes of neuronal expressions at L3 and YA stages.
This work has great potential to significantly contribute to drug discovery projects owing to its affordability, high throughput, and high resolution. For example, the reported results on quantitative light sheet imaging of 6-OHDA-treated worm populations demonstrate the ability of the low-cost platform to track the impact of neurotoxins on the nervous system of the worms. This enables researchers to study the dynamics of protein expression in populations of worms at different developmental stages and under various experimental conditions. This high throughput imaging system can potentially be also utilized within established neural assays to confirm the efficacy of prospective neuroprotective compounds in promoting the recovery of worms exposed to neurotoxicants such as 6-OHDA. Furthermore, the ability of this imaging system to accurately measure α-Syn accumulation in C. elegans makes it a promising tool for studying the effect of different drugs in suppressing α-Syn accumulation. This could lead to the identification of potential therapeutic agents for PD and related disorders that involve α-Syn accumulation. By exposing the transgenic worms to neuroprotective compounds, their effects on the phenotypes can be studied for drug discovery purposes.
To obtain good imaging performance, the light sheet parameters at a given excitation wavelength must be designed in light of the sample and the targeted fluorophore size per dimension. In our studies, a single 488 nm laser was exclusively employed for exciting GFP biomarkers (α-Syn aggregation within DA neurons, pan-neural nervous system). The size of these GFP biomarkers at both L3 and YA worms are in the range of ∼5–10 µm27 and as such can be effectively imaged via our ∼2 µm thick light sheet. In future works, we aim to optimize the integrated lens to allow for the addition of more laser excitation wavelengths to allow for gaining comprehensive insights into the aggregation patterns of proteins in worm neurons. Such a multi-channel high throughput light sheet imaging system will enable quantitative studies on samples with various fluorescent protein tags. We also envision, utilizing the methodology of this work for designing low-cost imaging flow cytometry solutions for imaging cells. Achieving such a goal, however, will require a redesign of the integrated lens in accordance with the size of targeted cells and their fluorophores as well as changes in channel design and flow delivery system.
Conflicts of interest
There are no conflicts to declare.Acknowledgements
We thank the Caenorhabditis Genetics Center and Eurac research for C. elegans strains. The authors would also appreciate Mehran Behrouzi, Dr Youssef and Daphne-Eleni Archonta's help. Also, the authors are thankful to CMC Microsystems for granting access to Zemax OpticStudio software. This research was funded by National Sciences and Engineering Research Council (NSERC) support to NT (RGPIN-2022-04605), NSERC support to PR (RGPIN-2020-06140) and Ontario Ministry of Colleges and Universities support to PR (Early Researcher Award 2019-0086).References
- T. R. Mhyre, J. T. Boyd, R. W. Hamill and K. A. Maguire-Zeiss, J. Parkinson's Dis., 2012, 389–455 CAS.
- M. Gómez-Benito, N. Granado, P. García-Sanz, A. Michel, M. Dumoulin and R. Moratalla, Modeling Parkinson’s Disease With the Alpha-Synuclein Protein, Front. Pharmacol, 2020, 11, 356 CrossRef PubMed.
- R. Vozdek, P. P. Pramstaller and A. A. Hicks, Functional Screening of Parkinson’s Disease Susceptibility Genes to Identify Novel Modulators of α-Synuclein Neurotoxicity in Caenorhabditis elegans, Front. Aging Neurosci., 2022, 14, 806000 CrossRef CAS.
- M. Porta-de-la-Riva, L. Fontrodona, A. Villanueva and J. Cerón, Basic Caenorhabditis elegans Methods: Synchronization and Observation, J. Visualized Exp., 2012,(64), 4019 Search PubMed.
- J. G. White, E. Southgate, J. N. Thomson and S. Brenner, The structure of the nervous system of the nematode Caenorhabditis elegans, Philos. Trans. R. Soc., B, 1986, 314(1165), 1–340 CAS.
- T. K. Blackwell, M. J. Steinbaugh, J. M. Hourihan, C. Y. Ewald and M. Isik, SKN-1/Nrf, stress responses, and aging in Caenorhabditis elegans, Free Radical Biol. Med., 2015, 88, 290–301 CrossRef CAS PubMed.
- J. Nagai, X. Yu, T. Papouin, E. Cheong, M. R. Freeman and K. R. Monk, et al., Behaviorally consequential astrocytic regulation of neural circuits, Neuron, 2021, 109(4), 576–596 CrossRef CAS PubMed.
- N. van den Berge, N. Ferreira, T. W. Mikkelsen, A. K. O. Alstrup, G. Tamgüney and P. Karlsson, et al., Ageing promotes pathological alpha-synuclein propagation and autonomic dysfunction in wild-type rats, Brain, 2021, 144(6), 1853–1868 CrossRef PubMed.
- M. Lakso, S. Vartiainen, A. M. Moilanen, J. Sirviö, J. H. Thomas and R. Nass, et al., Dopaminergic neuronal loss and motor deficits in Caenorhabditis elegans overexpressing human α-synuclein, J. Neurochem., 2004, 86(1), 165–172 CrossRef PubMed.
- A. Gaeta, K. Caldwell and G. Caldwell, Found in Translation: The Utility of C. elegans Alpha-Synuclein Models of Parkinson's Disease, Brain Sci., 2019, 9(4), 73 CrossRef CAS PubMed.
- T. J. van Ham, K. L. Thijssen, R. Breitling, R. M. W. Hofstra, R. H. A. Plasterk and E. A. A. Nollen, C. elegans Model Identifies Genetic Modifiers of α-Synuclein Inclusion Formation During Aging, PLoS Genet., 2008, 4(3), e1000027 CrossRef.
- L. Breimann, F. Preusser and S. Preibisch, Light-microscopy methods in C. elegans research, Curr. Opin. Syst. Biol., 2019, 13, 82–92 CrossRef.
- R. M. Power and J. Huisken, A guide to light-sheet fluorescence microscopy for multiscale imaging, Nat. Methods, 2017, 14(4), 360–373 CrossRef CAS PubMed.
- S. Rashtchian, K. Youssef, P. Rezai and N. Tabatabaei, High-speed label-free confocal microscopy of Caenorhabditis elegans with near infrared spectrally encoded confocal microscopy, Biomed. Opt. Express, 2021, 12(6), 3607 CrossRef.
- P. J. Keller, A. D. Schmidt, J. Wittbrodt and E. H. K. Stelzer, Reconstruction of Zebrafish Early Embryonic Development by Scanned Light Sheet Microscopy, Science, 2008, 322(5904), 1065–1069 CrossRef CAS PubMed.
- J. Huisken and D. Y. R. Stainier, Even fluorescence excitation by multidirectional selective plane illumination microscopy (mSPIM), Opt. Lett., 2007, 32(17), 2608 CrossRef PubMed.
- Y. Wu, A. Ghitani, R. Christensen, A. Santella, Z. Du and G. Rondeau, et al., Inverted selective plane illumination microscopy ( i SPIM) enables coupled cell identity lineaging and neurodevelopmental imaging in Caenorhabditis elegans, Proc. Natl. Acad. Sci. U. S. A., 2011, 108(43), 17708–17713 CrossRef CAS PubMed.
- G. Aubry and H. Lu, A perspective on optical developments in microfluidic platforms for Caenorhabditis elegans research, Biomicrofluidics, 2014, 8(1), 011301 CrossRef PubMed.
- R. McGorty, H. Liu, D. Kamiyama, Z. Dong, S. Guo and B. Huang, Open-top selective plane illumination microscope for conventionally mounted specimens, Opt. Express, 2015, 23(12), 16142 CrossRef CAS.
- C. Martin, T. Li, E. Hegarty, P. Zhao, S. Mondal and A. Ben-Yakar, Line excitation array detection fluorescence microscopy at 0.8 million frames per second, Nat. Commun., 2018, 9(1), 4499 CrossRef PubMed.
- M. Behrouzi, K. Youssef, P. Rezai and N. Tabatabaei, Low-cost optofluidic add-on enables rapid selective plane illumination microscopy of C. elegans with a conventional wide-field microscope, J. Biomed. Opt., 2021, 26(12), 126501 Search PubMed.
- S. Mondal, E. Hegarty, J. J. Sahn, L. L. Scott, S. K. Gökçe and C. Martin, et al., High-Content Microfluidic Screening Platform Used To Identify σ2R/Tmem97 Binding Ligands that Reduce Age-Dependent Neurodegeneration in C. elegans SC_APP Model, ACS Chem. Neurosci., 2018, 9(5), 1014–1026 CrossRef CAS PubMed.
- S. Mondal, E. Hegarty, C. Martin, S. K. Gökçe, N. Ghorashian and A. Ben-Yakar, Large-scale microfluidics providing high-resolution and high-throughput screening of Caenorhabditis elegans poly-glutamine aggregation model, Nat. Commun., 2016, 7(1), 13023 CrossRef CAS PubMed.
- Z. Guan, J. Lee, H. Jiang, S. Dong, N. Jen and T. Hsiai, et al., Compact plane illumination plugin device to enable light sheet fluorescence imaging of multi-cellular organisms on an inverted wide-field microscope, Biomed. Opt. Express, 2016, 7(1), 194 CrossRef CAS PubMed.
- T. Y. Hsieh, S. Vyas, J. C. Wu and Y. Luo, Volume holographic optical element for light sheet fluorescence microscopy, Opt. Lett., 2020, 45(23), 6478 CrossRef PubMed.
- F. Zhao, Y. Yang, Y. Li, H. Jiang, X. Xie and T. Yu, et al., Efficient and cost‐effective 3D cellular imaging by sub‐voxel‐resolving light‐sheet add‐on microscopy, J. Biophotonics, 2020, 13(6), 0243 Search PubMed.
- C. H. Chen, Y. C. Chen, H. C. Jiang, C. K. Chen and C. L. Pan, Neuronal aging: learning from C. elegans, J. Mol. Signaling, 2013, 8, 14 CrossRef PubMed.
- T. Stiernagle, Maintenance of C. elegans, WormBook, 2006, 1–11 Search PubMed.
- J. Schindelin, I. Arganda-Carreras, E. Frise, V. Kaynig, M. Longair and T. Pietzsch, et al., Fiji: an open-source platform for biological-image analysis, Nat. Methods, 2012, 9(7), 676–682 CrossRef CAS PubMed.
- J. Sulston, M. Dew and S. Brenner, Dopaminergic neurons in the nematodeCaenorhabditis elegans, J. Comp. Neurol., 1975, 163(2), 215–226 CrossRef CAS PubMed.
- Z. Altun, Nervous System in the Embryo – Nerve Ring Development, WormAtlas, 2017, DOI:10.3908/wormatlas.4.2.
- R. Nass, D. H. Hall, D. M. Miller and R. D. Blakely, Neurotoxin-induced degeneration of dopamine neurons in Caenorhabditis elegans, Proc. Natl. Acad. Sci. U. S. A., 2002, 99(5), 3264–3269 CrossRef CAS PubMed.
- S. L. Offenburger, X. Y. Ho, T. Tachie-Menson, S. Coakley, M. A. Hilliard and A. Gartner, 6-OHDA-induced dopaminergic neurodegeneration in Caenorhabditis elegans is promoted by the engulfment pathway and inhibited by the transthyretin-related protein TTR-33, PLoS Genet., 2018, 14(1), e1007125 CrossRef.
- L. Stefanis, -Synuclein in Parkinson’s Disease, Cold Spring Harbor Perspect. Med., 2012, 2(2), a009399 Search PubMed.
- T. Tyson, M. Senchuk, J. F. Cooper, S. George, J. M. van Raamsdonk and P. Brundin, Novel animal model defines genetic contributions for neuron-to-neuron transfer of α-synuclein, Sci. Rep., 2017, 7(1), 7506 CrossRef PubMed.
- P. H. Mitchell, K. Bull, S. Glautier, N. A. Hopper, L. Holden-Dye and V. O'Connor, The concentration-dependent effects of ethanol on Caenorhabditis elegans behaviour, Pharmacogenomics J., 2007, 7(6), 411–417 CrossRef CAS PubMed.
- O. Margie, C. Palmer and I. Chin-Sang, C. elegans Chemotaxis Assay, J. Visualized Exp., 2013,(74), 50069 Search PubMed.
- M. Di Rocco, S. Galosi, E. Lanza, F. Tosato, D. Caprini and V. Folli, et al., Caenorhabditis elegans provides an efficient drug screening platform for GNAO1 -related disorders and highlights the potential role of caffeine in controlling dyskinesia, Hum. Mol. Genet., 2022, 31(6), 929–941 CrossRef PubMed.
- C. K. Leung, Y. Wang, S. Malany, A. Deonarine, K. Nguyen and S. Vasile, et al., An Ultra High-Throughput, Whole-Animal Screen for Small Molecule Modulators of a Specific Genetic Pathway in Caenorhabditis elegans, PLoS One, 2013, 8(4), e62166 CrossRef CAS PubMed.
- X. Ye, J. M. Linton, N. J. Schork, L. B. Buck and M. Petrascheck, A pharmacological network for lifespan extension in C aenorhabditis elegans, Aging Cell, 2014, 13(2), 206–215 CrossRef CAS PubMed.
- S. J. Gosai, J. H. Kwak, C. J. Luke, O. S. Long, D. E. King and K. J. Kovatch, et al., Automated High-Content Live Animal Drug Screening Using C. elegans Expressing the Aggregation Prone Serpin α1-antitrypsin Z, PLoS One, 2010, 5(11), e15460 CrossRef PubMed.
| This journal is © The Royal Society of Chemistry 2024 |