 Open Access Article
Acceleration or retardation by a magnetic field of the anodic processes of iron in molybdate-bearing chloride solutions
Haiying Dongab,
Hongjuan Liab,
Yiqi Taoab,
Hetian Chend,
Xin Liab,
Juan Wangab,
Zhanpeng Lu *abc,
Tongming Cuiab,
Junjie Chenab,
Xinghe Xuab and
Deng Panab
aInstitute of Materials, School of Materials Science and Engineering, Shanghai University, Shanghai 200072, China. E-mail: zplu@t.shu.edu.cn
bState Key Laboratory for Advanced Special Steels, Shanghai 200072, China
cJiangsu Yihai New Energy Materials Co. Ltd, Jiangsu 214231, China
dSchool of Materials Science and Engineering, University of New South Wales (UNSW Sydney), Sydney 2052, Australia
First published on 3rd January 2024
Abstract
The modulation by a horizontal magnetic field of the anodic processes of iron in molybdate-bearing chloride solutions is determined. The magnetic field can accelerate or retard the anodic reaction depending on the rate-controlling steps at specified electrode potentials. The anodic current density arising from uniform dissolution from open or semi-open pits is increased by the magnetic field. The current density originating from occluded pits can be decreased by the magnetic field, where autocatalysis has a dominant effect on the pitting rate. The effect of the magnetic field on the pitting corrosion is a combination of the influence on electrochemical reactions at the interfaces of the pits and the disturbance of the autocatalysis process inside the pit enclave through the magnetohydrodynamic (MHD) effect. Micro-MHD effects for specific locations and macro-MHD effects for pitting systems are recommended to illustrate the magnetic effect on localized corrosion phenomena at various combinations of potentials and solution compositions.
1. Introduction
The electrochemical reaction rates of metallic materials in corrosive solutions can be affected by magnetic fields (MF), which is due to the extra force introduced by the application of the MF. The effects of an MF on electrochemistry have been comprehensively reviewed in previous studies.1–6 The magnetohydrodynamic (MHD) effect7–13 and magnetic field gradient force (MFGF) effect14 have been used to explain the MF effect on the anodic electrochemical behaviors of iron in corrosive solutions, mainly for uniform dissolution or passivation, even though macroscopically uneven dissolution regions on the electrodes have been observed.8,10–14The change in localized corrosion upon application of an MF has been studied. Shinohara and Aogaki15 have reported that the localized corrosion rate of Cu in an HNO3 solution increases after applying an MF. The contribution of an MF to the pitting corrosion behavior of titanium in a solution containing chloride ions has been reported by Fattahi et al.,16 showing a significant correlation with the relative direction of the MF to the working electrode surface. The pitting corrosion susceptibility of pure Mg in an alkaline chloride solution increases after applying MF due to the acceleration of the pitting initiation process.17 Linhardt et al.18 have found that the repassivation potential of stainless-steel containing 17–19 wt% Cr and 8–10.5 wt% Ni moves in the negative direction if the direction of the MF is perpendicular to the working electrode surface, and the MF changed the density and shape of the pits. Ruccinskiene et al.19 showed that the repassivation potential of AISI 303 stainless steel shifts in the positive direction, and the number of pits and mass reduction in ferric chloride solution decreased after applying an MF with a direction perpendicular to the working electrode AISI 303 stainless steel surface. Espina-Hernández et al.20 have found that an additional MF reduced the pit depth of X52 pipeline steel in a solution simulating a typical pipeline pitting corrosion environment. Tang and Davenport et al.21 have shown that the pitting corrosion behavior of iron, cobalt and nickel artificial pit electrodes changed after an MF was applied. The mechanism for interpreting the inhibition of the pitting dissolution after applying the MF is that the corrosion products adsorbed to the metal surface to form a protective layer under a gradient magnetic field or strong magnetic attraction. Eber et al.22 have studied the effect of an MF on the threshold of a sequence of transitions in the electroconvection of a homeotropic nematic liquid crystal and determined the effect on the normal roll–abnormal roll transition.
Localized corrosion systems, like crevice or pitting corrosion systems, are more complicated than general corrosion systems. The pitting corrosion of metals or alloys has been investigated widely and has been reviewed, for example by Kolotyrkin,23 Szklarska-Smialowska,24 Laycock and Newman,25 Frankel and Sridhar,26 Newman,27 Soltis,28 and Scully,29 after pioneering observations by Hoar.30 The common features of pitting corrosion as a typical example of localized corrosion, such as the concentration gradient of the solution chemicals and the electrode potential gradient, the limited mass transport and the coupling between the bulk surface or pit mouth to the pit bottom have been discussed.31–37 It has been reported that autocatalysis processes are critical in the propagation of localized corrosion, such as crevice and pitting corrosion. Pitting corrosion of iron or carbon steel is often associated with both film forming species and aggressive ions in the solution.23–29,35 The mechanism for the influence of chlorides on the passivation film formed on an iron surface has been studied. Bockris et al.38–40 studied the destruction and penetration of chloride ions on a passivation film of iron by using XPS and SIMS, and found that chloride ions led to the formation of soluble compounds when interacting with the metal. Aramaki and Uehara,41 and Gui and Devine,42 found that the corrosion products inside the pit did not exist as a single species, but as a variety of iron oxides distributed unevenly inside the pit. Molybdate with low toxicity has been used as a corrosion inhibitor.43–46 The effect of a molybdate inhibitor on the pitting corrosion behavior of carbon steel in a chloride-containing solution has been reported.47–50 It has been reported that molybdate can retard pit initiation and the growth of mild steel in chloride-containing weakly alkaline solutions.47 Based on the available investigation of the pitting mechanisms of iron, pitting systems with iron in molybdate-bearing chloride solutions were chosen for investigating the effects of a magnetic field on the autocatalysis processes involved in localized corrosion, with molybdate as a film-forming species and chloride as a film-attacking species, for producing pitting at appropriate potentials. The concentrations of molybdates in sodium chloride solution as well as the applied potential are adjusted to produce various types of pitting conditions to aid the mechanistic understanding of magnetic field effects. It is expected that a magnetic field would have different effects for the pits with different shapes as a result of the solution composition, applied potential, and polarization time for iron.
2. Experimental methods
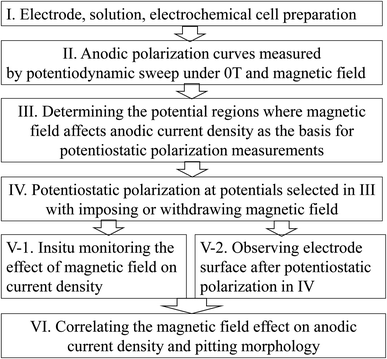
This work is accomplished by electrochemical experiments and surface observation, as shown in Fig. 1. Iron in 0.20 mol L−1 NaCl solution with 0.20 or 0.05 mol L−1 Na2MoO4 is selected as a typical pitting system. The presence of molybdate as a film-forming chemical and chloride as a film-attacking chemical will lead to pits with various shapes by anodic polarization on iron at selected potentials, which facilitates the understanding of the magnetic field effect on pitting corrosion. The anodic polarization curves for potentiodynamic sweeping and the potentiostatic polarization responses were measured using a Gamry 1000 electrochemical workstation controlled with a computer. The experimental material was industrial iron, and the purity was 99.5%. The preparation of the working electrode, saturated calomel electrode (SCE), platinum plates and experimental setup are consistent with previous papers.11,12 The pure iron working electrode was polished with emery paper in sequence to a 1500 grit final finish and then rinsed in ethanol and acetone in turn before the electrochemical measurements. The horizontal MF of 4000 Gs (0.4 tesla, T) was generated by an EM-3 model electromagnet and supplied by a DC galvanostatic technique. The electromagnet is located on both sides of the electrolytic cell and the working electrode is situated in the center of the two iron cores. The iron working electrode is placed vertically, and the iron working electrode surface and MF were parallel to each other. The test solutions were naturally exposed sodium chloride solutions containing sodium molybdate, prepared with high purity water and chemicals of analytically pure grade. Sodium molybdate was used as a surface film-forming inhibitor while chloride was used as a pitting promoter. The co-existence of both a film-forming chemical such as molybdate and a film-attacking chemical such as chloride would produce various shapes of pits under appropriate potentials. Anodic polarization curves were obtained by potentiodynamic sweeping at various rates, and potentiostatic polarization measurements were performed at potentials selected preliminarily based on the measured polarization curves. All electrochemical experiments are conducted at a constant temperature, about 25 °C. The surfaces of the electrodes after the anodic polarization tests were gently wiped with soft rubber and then cleaned with ethanol for the morphology observations with an optical microscope and SEM. Only in one case was the electrode surface observed without the process of wiping with rubber. The reported data can be reproduced well.3. Results
3.1. Potentiodynamic anodic polarisation curves
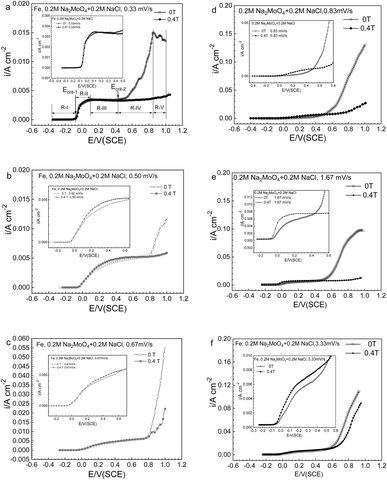
Fig. 2a–f exhibits the potentiodynamic curves with potential sweep rates of 0.33, 0.50, 0.67, 0.83, 1.66 and 3.33 mV s−1 for Fe in a 0.20 mol L−1 sodium chloride solution containing 0.20 mol L−1 Na2MoO4 under the application of an MF at 0 T and 0.4 T. The polarization curve at 0.33 mV s−1 at 0 T was treated as five typical potential regions, regions R-I, R-II, R-III, R-IV and R-V. The results of the polarization curve at 0.33 mV s−1 and its corresponding regions are summarized in Fig. 2a. Upon increasing the potential, the current density remained low in region R-I, increased rapidly in region R-II, was relatively constant in region R-III, increased rapidly again in region R-IV, and dropped in region R-V. The shape of the anodic polarization curves and current density will also be profoundly affected by the potential sweep rate.The change of anodic polarization behavior induced by the MF relies on the potential range as well as the potential sweep rate. In regions R-II and R-III, with the application of the MF, the anodic current density (ACD) has not changed much at a potential sweep rate of no more than 0.67 mV s−1, however there is a significant increase at a potential sweep rate of ≥0.83V s−1. At all sweep rates, with the application of MF, the ACD decreases in potential regions higher than Ecrit-2, as represented by region IV as well as region V.
Fig. 3 shows that after applying an MF of 0.4 T, the ACD increased at high potentials for iron in a 0.20 mol L−1 sodium chloride solution, which is distinct from the result of iron in a 0.20 mol L−1 sodium chloride solution containing Na2MoO4.
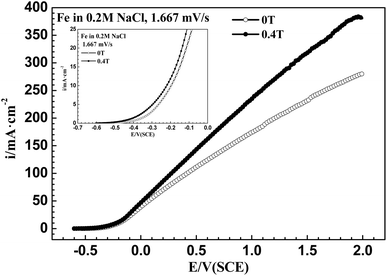 | ||
| Fig. 3 Anodic polarization curves from open circuit potential to 2.0 V (SCE) at 1.67 mV s−1 for iron in a 0.20 mol L−1 NaCl solution under 0 T and 0.4 T magnetic fields. | ||
3.2. Potentiostatic polarization data
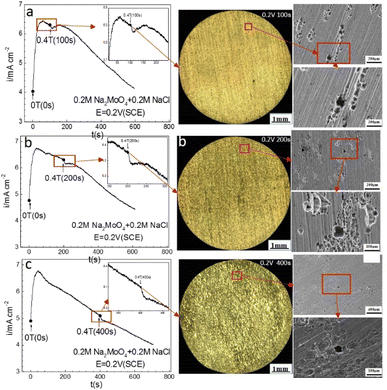
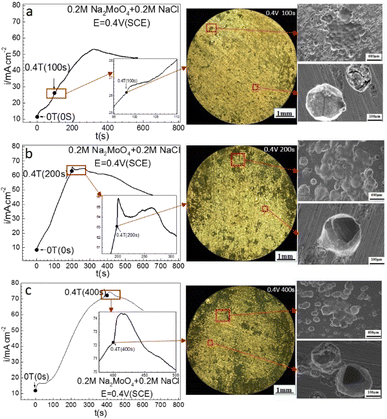
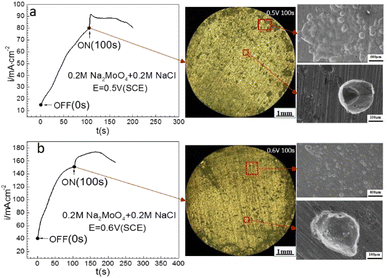
Potentiostatic polarization measurements were used to judge the anodic behavior of the iron at specified potentials in the 0 T and 0.4 T MF and the contribution of the MF to the ACD. Anode potentiostatic polarization curves (i–t) for the iron in 0.20 mol L−1 sodium chloride containing 0.20 mol L−1 Na2MoO4 at multiple potentials and the corresponding electrode surface morphologies are summarized in Fig. 4–7.Fig. 4 shows that the current density decayed with increasing polarization time at 0.20 V (SCE) under a 0 T MF. After polarization at 0 T for 100 s, applying a 0.4 T MF caused a transient period after which the current density decayed again with increasing polarization time, showing a higher current density than that under 0 T. Applying an MF on the iron electrode after prior-polarization for 200 s or 400 s at 0 T caused a short transient period, but did not result in a significant effect after the transient period. There were some pits on the electrode surface after the polarization under a 0 T MF, showing mainly shallow morphologies. Some pits were coalesced.
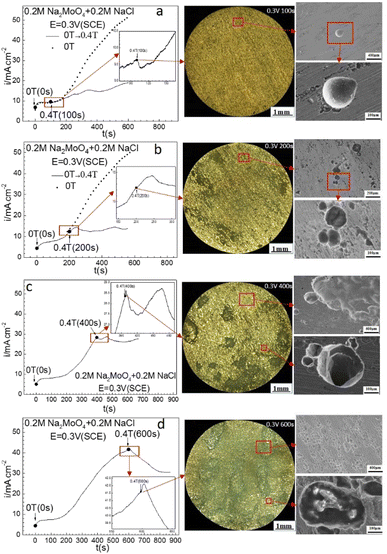
Fig. 4 shows that at 0.30 V (SCE), applying an MF at 0.4 T slowed down the increasing rate of the ACD after prior-polarization under a 0 T MF for 100 s, maintained the current density at an almost constant level after prior-polarization under a 0 T MF for 200 s or 400 s, and decreased the current density after prior-polarization under a 0 T MF for 600 s. Pitting became more severe with increasing polarization time under a 0 T MF. Some pits propagated in both the depth and diameter direction with the prolonging of the prior-polarization time at 0 T. Some pits coalesced.
Fig. 6 shows that at 0.40 V (SCE), applying a 0.4 T MF did not cause an immediate change of the ACD after prior-polarization under a 0 T MF for 100 s, caused a quasi-current plateau and then a current density decay period after prior-polarization under a 0 T MF for 200 s, and caused a current density jump pulse and then a current density decay period after prior-polarization under a 0 T MF for 400 s. Pitting became more severe with increasing prior-polarization time under a 0 T MF. Pits tended to be deeper after 200 or 400 s prior-polarization than after 100 s prior-polarization at 0 T.
Fig. 7 shows that at 0.50 V (SCE) and 0.60 V (SCE), applying an MF at 0.4 T after prior-polarization under a 0 T MF for 100 s resulted in a jump of the ACD, following a quasi-current density plateau, and then a decay period. Lots of pits were observed after the prior-polarization under a 0 T MF and the pits were mainly open-shaped.
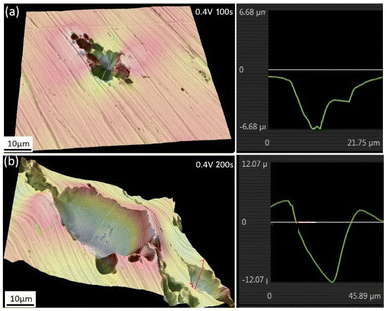
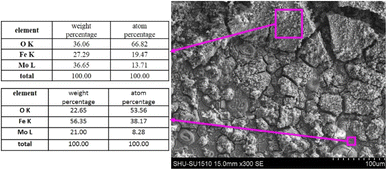
Fig. 8 shows the 3-dimensional depth profile of the pits formed on the surfaces of the iron working electrode after prior-polarization at 0.40 V (SCE) under a 0 T MF for 100 s and 200 s, showing a tendency of the pits formed after 200 s prior-polarization to be wider than those after 100 s prior-polarization under a 0 T MF. Fig. 9 shows that after potentiostatic polarization at 0.40 V (SCE) for 200 s, the surface film contained a Mo-bearing compound formed on the working surface.
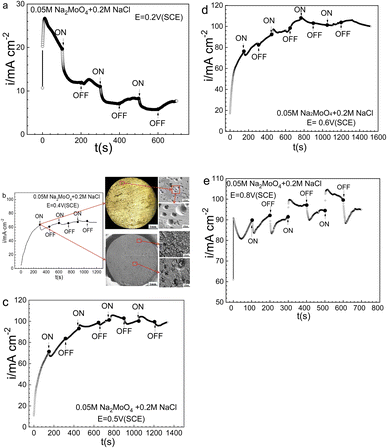
The potential and time for the prior-polarization at 0 T had significant effects on the electrode morphologies and the resultant response after applying the MF. To reinforce the above observations, potentiostatic measurements at various potentials were made in 0.20 mol L−1 sodium chloride solution with 0.05 mol L−1 Na2MoO4, and the results are summarized in Fig. 10. Fig. 10a shows that at 0.20 V (SCE), the ACD after prior-polarization under a 0 T MF for 100 s immediately drops with the application of a 0.4 T MF, and similar drops of the ACD with decreased magnitudes were also observed in the following several rounds of MF application. Fig. 10b shows that at 0.40 V (SCE), the application of a 0.4 T MF caused an immediate drop of the ACD after prior-polarization under a 0 T MF for 300 s, while there is no large effect in the following several rounds of applying a 0.4 T MF. Fig. 10b also shows the relatively open-mouthed pits after prior-polarization under a 0 T MF for 300 s, and the electrode covered with the surface film. Fig. 10c and d show that, at 0.40 V (SCE) or 0.50 V (SCE), the application of a 0.4 T MF caused an immediate drop of the ACD after prior-polarization under a 0 T MF for about 150 s, and the following several rounds of applying an MF of 0.4 T also resulted in a large effect on the ACD. Fig. 10e shows that at 0.80 V (SCE), the various effects on the anodic current after applying an MF relied on the polarization sequence: applying a 0.4 T MF caused an immediate drop of the ACD after 100 s prior-polarization under a 0 T MF, while causing an immediate jump of the anodic current for the following round of MF application at 0.4 T.
4. Discussion
According to the literature, pitting corrosion is affected by the concentrations of metal cations, hydrogen ions and aggressive anions, and the electrode potential.25–37 The concentration of metal cations increases with the dissolution of metals inside the pits. A metal salt is deposited at the bottom of the pit when the metal cation saturation concentration Csat is reached. Then the pitting pits begin to grow under the salt film, and their growth rate is dependent on the dissolution of this metal salt film and the local concentration gradient. A schematic for the pits is shown in Fig. 11. The hydrolysis of metallic anions inside the pits would result in localized acidification through an autocatalysis effect,25–34 i.e., the concentration of H+ and Cl− increase inside the pit.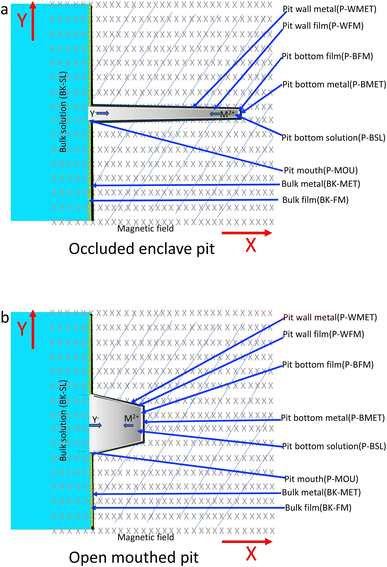 | ||
| Fig. 11 Schematic of the corrosion pit system under a magnetic field: (a) occluded enclave pit, (b) open mouthed pit. | ||
For a metal in contact with a corrosive solution, at a polarization potential E, the overall (or total) current, Iove(E), can be written as eqn (1):
| Iove(E) = Ia(E) + Ic(E) | (1) |
Assuming that the applied E is very positive, then Ia(E) is much higher than Ic(E), that is
| Ia(E) ≫ Ic(E) | (2) |
| Iove(E) = Ia(E) | (3) |
For a passivating system without pitting at potential E,
| Ia(E) = ipassive·Spassive | (4) |
For an electrode experiencing pitting corrosion under potential E,
| Ia(E) = Ipassive + Ipits | (5) |
 | (6) |
To simplify the discussion, the geometry of the pits is assumed to be identical,
| Iove(E) = ipassive·Spassive + n·ipit·Spit | (7) |
Assuming that Ipassive is much lower than Ipits, then
| Iove(E) = n·ipit·Spit | (8) |
| iove(E) = n·ipit·Spit/Selectrode | (9) |
Considering the morphologies of the pits at various combinations of test solutions, applied potential and duration of the polarization, the pits are categorized into two types, i.e., open-mouthed pits (OMP) and occluded-enclave pits (OEP). Eqn (8) and (9) then become,
| Iove(E) = Ipit-OMP + Ipit-OEP | (10) |
| iove(E) = (nOMP·ipit-OMP·Spit-OPM + nOEP·ipit-OEP·Spit-OEM)/Selectrode | (11) |
| iove(E) = (nOMP·ipit-OMP·Spit-OPM + nOEP·ipit-OEM,P-WMET·Spit-OEM,P-WMET + nOEP·ipit-OEM,P-BMET·Spit-OEM,P-BMET)/Selectrode | (12) |
It is not easy to completely isolate the pit wall and pit bottom in the modeling. To facilitate the discussion, some assumptions are taken for the first approximation. For the open-mouthed pits, mass transport would be easier than for the occluded enclave pits, and it is thought that the pit wall condition would be more similar to the pit bottom condition for the open-mouthed pits than for the occluded enclave pits, as shown in Fig. 11. Therefore, it is not intended to distinguish between the pit wall and the pit bottom for the open-mouthed pits in the discussion, i.e., a general area for the pit is used in the modeling, as shown in Fig. 11b. For the occluded enclave pits, the current density at the pit bottom would be much higher than that at the pit wall due to the significant autocatalysis effect, therefore the current for the pit can be thought to be mainly coming from the pit bottom, as shown by eqn (13) and (14). Based on these approximations, only the pit bottom and related parameters are considered in the modeling for the enclave–enclave pits, as shown in Fig. 11b.
| ipit-OEM·Spit-OEM = ipit-OEM,P-BMET·Spit-OEM,P-BMET | (13) |
| iove(E) = (nOMP·ipit-OMP·Spit-OPM + nOEP·ipit-OEM,P-BMET·Spit-OEM,P-BMET)/Selectrode | (14) |
According to previous studies, the initiation of pitting needs the absorption and attack of aggressive ions on the film in a passive state, and then the hydrolysis of metal ions inside the pits will result in localized acidification. The chemical composition of the local solution for pit propagation is characterized by the reduced pH and potential as well as the accumulated chloride ions within the pit enclave.
| CH+,P-BSL > CH+,BK-SL | (15) |
| CCl−(P-BSL) > CCl−(BK-SL) | (16) |
Considering that the occluded cell effect or the autocatalytic effect would be generally more pronounced for the OEP than the OMP for the present test system,
 | (17) |
 | (18) |
 | (19) |
The change in the electrochemical reaction induced by the additional magnetic field has been formulated in a previous paper on the basis of the Lorentz force and Kelvin force.2,4 The Lorentz force, FMHD, generated as a result of the interaction between the magnetic flux and moving charged particles, can be expressed as in eqn (20).
 | (20) |
The Lorentz force will work when the direction of the applied MF is consistent with the pit surface. In this case, the velocity of charged particles in the diffusion layer of the metal/solution interface needs to be superimposed on the velocity generated by the MF, that is the MHD velocity (Vmag).1,2,4–7 Thus, for the charged particle, the following vector sum can be used to express the overall velocity (Vo) after applying the MF.
 | (21) |
For pit corrosion systems, the micro-MHD effect and macro-MHD effect can be applied to interpret the mechanism of the effect of the external MF on the anodic dissolution. For a specific location on the pit, the mass transport rate on the metal/solution interface increases under the MF via external force induced convective flow, leading to the ACD increase with the application of the MF, which is defined as the micro-MHD effect. The macro-MHD effect here is defined specifically for the change in the mass transport rate induced by the MF between the pit mouth solution and the pit bottom solution, which would change the chemical composition of the solution and the resultant anodic dissolution rate of the metal in the pit bottom.
For open-mouthed pits, the concentration gradient of reactive species between the mouth and bottom of the pit would be less than that for the occluded-enclave pits.25–29,31,32 Thus, the change of ACD induced by the application of the MF would arise more from the micro-MHD effect, which often enhances the anodic dissolution rate, as indicated by the responses of the ACD under the 0.4 T MF, as shown in Fig. 5b, 6a and b, which correspond to the observed surface morphologies as shown in these figures. The active dissolution for iron in molybdate-free NaCl solution mainly shows the micro-MHD effect, where anodic dissolution in the high potential region is enhanced under an MF, as shown in Fig. 2.
For occluded-enclave pits, the micro-MHD effect and macro-MHD effect would operate at the same time, resulting in various kinds of responses of the ACD to the applied MF during potentiostatic polarization. If the macro-MHD effect dominates for highly occluded-enclave pits, the reduced aggressive species such as chlorides and hydrogen ions at the pit bottom would lead to a decrease of the ACD due to the decreased pit propagation rate. These results indicate that the pits formed in high potential regions during potentiodynamic polarization measurements would be occluded-enclave in nature, since the ACD in such potential regions decreased under the MF. Results from potentiostatic polarization shown in Fig. 4c and d, 7a–c also indicate the occluded nature that in general corresponds well with the observed pit morphologies in these figures. The local environments related to the pitting of iron and the effect of charged hydrogen have been discussed by Ejaz et al.50 The effect of an MF on occluded cell conditions for pitting has been reported and interpreted by Tang et al. by using artificial pits.21
Based on these analyses and the literature, the constant or transient responses of the ACD to an applied MF are closely dependent on the pit morphologies resulting from various combinations of potential, time, and solution composition. These results in relation to the magnetic field effect on specific corrosion pit systems would be informative for the determination of the pitting processes and rate-controlling steps. The inhibiting effect of a magnetic field on pitting corrosion under specific electrochemical conditions provides a new route to control localized corrosion by applying a magnetic field. It has been reported that electrochemical measurements can be used for the determination of magnetic flux density.51 The magneto-electrochemistry effect can be used for determining the corrosion mechanism, for mitigating corrosion and for physical measurements.
5. Conclusions
The magnetic field effect on the anodic electrochemical behavior of an iron electrode in molybdate-bearing chloride solutions is related to the pit geometries resulting from various combinations of polarization methods and conditions such as the solution composition, applied potential and polarization duration. A magnetic field placed horizontally in parallel to the iron working electrode enhances the development of open-mouthed pits, while hindering the growth of occluded-enclave pits. The micro-magnetohydrodynamic effect on the specific metal-solution interface and macro-magnetohydrodynamic effect on the pitting system are proposed to further understand the effect of the magnetic field on the pitting corrosion mechanism.Abbrevations
Conflicts of interest
No conflict of interest exits in the submission of this manuscript.Acknowledgements
This work has been supported by Natural Science Foundation of China (NSFC) No. 52271060 and 51571138.References
- G. Hinds, J. M. D. Coey and M. E. G. Lyons, Electrochem. Commun., 2001, 3, 215–218 CrossRef CAS.
- L. M. A. Monzon and J. M. D. Coey, Electrochem. Commun., 2014, 42, 38–41 CrossRef CAS.
- T. Z. Fahidy, J. Appl. Electrochem., 1983, 13, 553–563 CrossRef CAS.
- L. M. A. Monzon and J. M. D. Coey, Electrochem. Commun., 2014, 42, 42–45 CrossRef CAS.
- S. R. Ragsdale, K. M. Grant and H. S. White, J. Am. Chem. Soc., 1998, 120, 13461–13468 CrossRef CAS.
- J. M. D. Coey, F. M. F. Rhen, P. Dunne and S. McMurry, J. Solid State Electrochem., 2007, 11, 711–717 CrossRef CAS.
- C. Wang, S. H. Chen and X. L. Yu, J. Electrochem. Soc., 1996, 143, L283–L285 CrossRef CAS.
- Z. P. Lu, D. L. Huang, W. Yang and J. Congleton, Corros. Sci., 2003, 45, 2233–2249 CrossRef CAS.
- Z. P. Lu, C. B. Huang, D. L. Huang and W. Yang, Corros. Sci., 2006, 48, 3049–3077 CrossRef CAS.
- Z. P. Lu and W. Yang, Corros. Sci., 2010, 52, 2680–2686 CrossRef CAS.
- H. J. Li, Q. Xiong, Z. P. Lu, J. J. Chen, Q. Xiao, X. K. Ru, S. C. Lin, J. R. Ma and Z. Chen, Corros. Sci., 2017, 129, 179–191 CrossRef CAS.
- H. J. Li, F. Ning, H. Y. Dong, K. Zhang, Z. P. Lu, Y. J. Tang, S. W. Cai, T. M. Cui, J. R. Ma, X. H. Xu and S. C. Ling, Corrosion, 2020, 76, 528–538 CrossRef CAS.
- H. Y. Dong, X. H. Xu, S. W. Cai, Y. J. Tang, Z. P. Lu, F. Ning, K. Zhang, J. R. Ma, T. M. Cui and Y. T. Zhang, Corrosion, 2021, 77, 413–426 CrossRef.
- R. Sueptitz, J. Koza, M. Uhlemann, A. Gebert and L. Schultz, Electrochim. Acta, 2009, 54, 2229–2233 CrossRef CAS.
- K. Shinohara and R. Aogaki, J. Electrochem., 1999, 67, 126–131 CAS.
- M. H. S. H. Fattahi, J. Mater. Sci. Eng., 2008, 5, 8–14 Search PubMed.
- J. Li, T. Zhang, Y. Shao, G. Meng and F. Wang, Mater. Corros., 2010, 61, 306–312 CrossRef CAS.
- P. Linhardt, G. Ball and E. Schlemmer, Corros. Sci., 2005, 47, 1599–1603 CrossRef CAS.
- A. Rucinskiene, G. Bikulcius, L. Gudaviciute and E. Juzeliunas, Electrochem. Commun., 2002, 4, 86–91 CrossRef CAS.
- J. H. Espina-Hernández, F. Caleyo, V. Venegas and J. M. Hallen, Corros. Sci., 2011, 53, 3100–3107 CrossRef.
- Y. C. Tang and A. J. Davenport, J. Electrochem. Soc., 2007, 154, C362–C370 CrossRef CAS.
- N. Eber, S. Nemeth, A. G. Rossberg, L. Kramer and A. Buka, Phys. Rev. E, 2002, 66, 036213–036220 CrossRef.
- Y. M. Kolotyrkin, Corrosion, 1963, 19, 261–268 CrossRef.
- Z. Szklarska-Smialowska, Corrosion, 1971, 27, 223–233 CrossRef CAS.
- N. J. Laycock and R. C. Newman, Corros. Sci., 1997, 39, 1771–1790 CrossRef CAS.
- G. S. Frankel and N. Sridhar, Mater. Today, 2008, 11, 38–44 CrossRef CAS.
- R. Newman, Pitting Corrosion of Metals, The Electrochemical Soc. Interface Spring, 2010, pp. 33–38 Search PubMed.
- J. Soltis, Corros. Sci., 2015, 90, 5–22 CrossRef CAS.
- J. R. Scully, Corrosion, 2019, 75, 123–125 CrossRef CAS.
- T. P. Hoar, Trans. Faraday Soc., 1937, 33, 1152–1167 RSC.
- J. R. Galvele, Corros. Sci., 1981, 21, 551–579 CrossRef CAS.
- H. W. Pickering, Corros. Sci., 1989, 29, 325–341 CrossRef CAS.
- P. C. Pistorius and G. T. Burstein, Philos. Trans. R. Soc., A, 1992, 341, 531–559 CrossRef CAS.
- J. Soltis, D. Krouse and N. Laycock, Corros. Sci., 2011, 53, 2152–2160 CrossRef CAS.
- H. H. Strehblow and P. Marcus, Mechanisms of Pitting Corrosion, Chapter 7, in Corrosion Mechanism Corrosion Mechanisms in Theory and Practice, ed. P. Marcus, CRC Press, Boca Raton, 3rd edn, 2012. pp. 349–394 Search PubMed.
- J. N. Defrancq, Corros. Sci., 1974, 14, 461–465 CrossRef CAS.
- H. H. Strehblow and B. Titze, Corros. Sci., 1977, 17, 461–472 CrossRef CAS.
- O. J. Murphy, J. O. M. Bockris and T. E. Pou, J. Electrochem. Soc., 1983, 130, 1792 CrossRef CAS.
- T. E. Pou and O. J. Murphy, J. Electrochem. Soc., 1984, 131, 1243 CrossRef CAS.
- J. A. Bardwell, B. Macpougall and G. I. Sproule, J. Electrochem. Soc., 1989, 136, 1331 CrossRef CAS.
- K. Aramaki and J. Uehara, J. Electrochem. Soc., 1990, 137, 185 CrossRef CAS.
- J. Gui and T. M. Devine, J. Electrochem. Soc., 1991, 138, 1376 CrossRef CAS.
- M. S. Vukasovich and J. P. G. Farr, Polyhedron, 1986, 5, 551–559 CrossRef CAS.
- A. M. Shams and L. Wang, Desalination, 1996, 107, 29–43 CrossRef.
- V. A. Kumari, K. Sreevalsan and S. M. A. Shibli, Corros. Prev. Control, 2001, 48, 83–96 CAS.
- S. Virtanen, B. Surber and P. Nylund, Corros. Sci., 2001, 43, 1165–1117 CrossRef CAS.
- J. M. Zhao and Y. Zuo, Corros. Sci., 2002, 44, 2119–2130 CrossRef CAS.
- Y. Zhou and Y. Zuo, Appl. Surf. Sci., 2015, 353, 924–932 CrossRef CAS.
- Y. Zhou, Y. Zuo and B. Lin, Mater. Chem. Phys., 2017, 192, 86–93 CrossRef CAS.
- A. Ejaz, H. Y. Dong, X. H. Xu, T. M. Cui, Z. P. Lu, J. J. Chen, J. R. Ma and T. Shoji, Corrosion, 2022, 78, 908–926 CrossRef PubMed.
- H. Y. Dong, X. Li, X. H Xu and Z. P. Lu, RSC Adv., 2023, 13, 8794–8802 RSC.
| This journal is © The Royal Society of Chemistry 2024 |

