 Open Access Article
An improved prediction model for COD measurements using UV-Vis spectroscopy
Li Guan *a,
Yijun Zhoub and
Sen Yanga
aIndustrial Perception and Intelligent Manufacturing Equipment Engineering Research Center of Jiangsu Province, Nanjing Vocational University of Industry Technology, Nanjing 210023, China. E-mail: li.guan.nangong@foxmail.com
bDepartment of Data Analysis, Nanjing Weiwo Software Technology Co., Ltd, Nanjing, 210012, P. R. China
First published on 2nd January 2024
Abstract
In the 21st century, although water quality has been improved in the last two decades, water pollution by organic contaminants has remained a non-negligible issue in China, so Chemical-Oxygen Demand (abbreviated as COD, unit: mg L−1) is often used as the main index to measure the degree of surface water pollution. UV-Vis spectroscopy, as a sensitive and rapid analytical technique, is a green detection technology suitable for automatic online COD detection equipment. However, due to the complex composition of surface water, the interference degree of the UV-Vis spectrum caused by turbidity is strongly correlated with the size, type and color of particulate matter in the solution, which results in noise sensitivity and poor generalization of the current detection model. Therefore, the main purpose of this research is to improve the traditional detection model performance by using deep learning and a spectrum preprocessing algorithm. Firstly, we used an improved noise filter based on discrete wavelet transforms to solve the noise sensitivity. Secondly, we proposed a novel COD detection network to address poor generalization. Thirdly, we collected a total of 2259 water samples' UV-Vis absorption spectra and corresponding COD as a dataset. Then, we pipelined the improved noise removal algorithm and proposed COD detection network, as a complete COD prediction model. Finally, the experiment on the dataset shows that the COD prediction model has a good performance in terms of both noise tolerance and accuracy.
1. Introduction
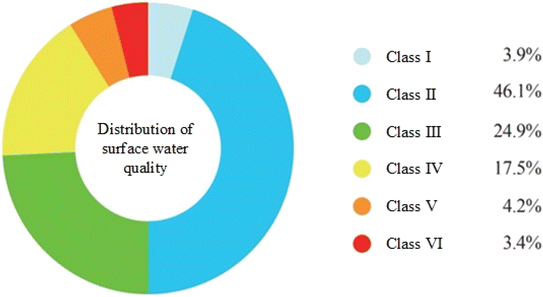
According to the “Communique on the State of China's Environment 2022”,1 as shown in Fig. 1, among 1731 water quality monitors in 2022, the proportion of class “I” (drinkable) to class “III” (mild contamination) is 74.9%, 3.9 percent higher than in 2021. Class “VI” (inferior) accounted for 3.4%, 3.3 percent lower than in 2021.In the 21st century, despite China's rapid economic development, environmental problems are still serious, especially surface water pollution. Although water quality has been improved in the last two decades, water pollution by organic contaminants has remained a non-negligible issue, so Chemical-Oxygen Demand (abbreviated as COD, unit: mg L−1) is often used as the main index to measure the degree of surface water pollution.2,3
For COD detection, the relatively mature methods in the academic field are the traditional chemical method, electrochemical method and molecular spectroscopy.
Among these methods, the traditional method based on wet chemistry, which is the national standard COD measurement method, has the disadvantage of adding toxic chemicals (e.g. mercurate, dichromate, etc.) and is time consuming (requiring 2–4 h). Therefore, it is urgent to seek a rapid, high-precision and pollution-free technology for COD measurement to realize online surface water quality detection. On the other hand, molecular spectroscopy4,5 is an analytical method based on the Ultraviolet-Visible spectrum (abbreviated as UV-Vis). As a sensitive and rapid analytical technique, it has been widely recognized in the field of physical evidence analysis for decades. On the other hand, UV-Vis spectroscopy is also a green detection technology suitable for automatic online COD detection equipment. Compared with other COD measurement methods, UV-Vis spectroscopy has the characteristics of no pollution, low cost and short cycle and low detection accuracy, which makes this method attract wide attention in the field of COD detection of surface water.6,7
Agustsson et al.8 used the UV-Vis full band absorption spectrum to detect COD in surface water and modeled it based on Least Squares Vector Machine (abbreviated as LS-SVM). Experiments showed that this method has higher model generalization ability than Partial Least Squares (abbreviated as PLS). Wang et al.9 described the use of deep learning technologies in the prediction of COD for urban sewage. Additionally, the use of convolutional neural networks (CNNs) to process the one-dimensional spectrum was encouraged. Deep learning-based models were also described by Jiang et al.10 for the multi-source data fusion to dynamically predict the water quality of an urban sewer.
However, due to the complex composition of surface water, the interference degree of the UV-Vis spectrum caused by turbidity is strongly correlated with the size, type and color of particulate matter in the solution, which results in poor consistency between the COD detection model in the laboratory environment and the real scenario.11,12 Therefore, a large number of revisions are always needed after spectrum acquisition, which makes the spectrum preprocessing of the model very complicated and tedious.13
In this paper, the research status of COD detection is reviewed. The main purpose of this research is to improve the traditional detection model performance by using deep learning and a spectrum preprocessing algorithm. The focus is on the utilization of deep learning combined with spectral preprocessing algorithms as a general method for COD detection.
The limitations of the current detection model, such as noise sensitivity and poor generalization, are addressed by proposing the use of an improved discrete wavelet transforms (DWT) based noise filter and well pretrained detection network. The main contributions of this work are:
1. Based on DWT, an adaptive soft threshold filter is proposed for the spectrum characteristics of real water samples, which can better remove noise and preserve features.
2. Through a large amount of water samples collection, a total of 2259 water samples' UV-Vis absorption spectra and corresponding COD have been collected, which is now open access and continuously updating.
3. Inspired by computer vision model, a COD detection network based on one-dimensional convolutional module and convolutional block attention module (CBAM) is proposed. The experiment shows that if the network is trained from the pertained weights, the relative error of 90.36% prediction results is within 5%, and that of 99.54% COD prediction results is within 10%.
4. Pipelined the improved noise removal algorithm and proposed COD detection network, and as a complete COD prediction model, they have a good performance on both noise tolerance and accuracy. The experiment shows that the Pearson correlation coefficient between the ground truth and the prediction has a value of 0.97.
The paper has been organized as follows: Section 2 describes the detailed technique of proposed detection methods, Section 3 shows the training process and generalization of the model, Section 4 discusses the model performance comparison of multiple algorithms and Section 5 draws the conclusion in this work.
2. Materials and methods
2.1 Water samples collection
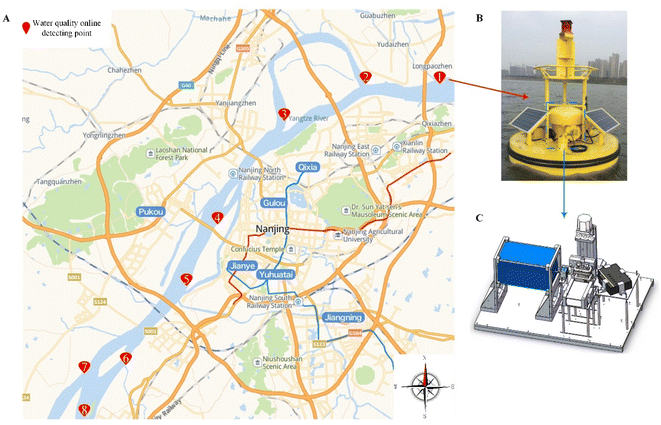
Considering the transportation environment of water samples and the time required for chemical digestion, most collection points are set as surrounding surface waters, including Qian Lake, QinHuai River, XuanWu Lake, SanQ Wetland, LiShui River, Yang-Shan Lake, XuPu River and MengJiaG River. A total of 2970 groups of water samples were collected. UV-Vis absorption spectrum were collected by spectrometers in laboratory environment, background and reference absorption spectrum were deducted.However, due to the proximity of individual collection points, the absorption spectrum of some water samples completely overlaps, and these samples cannot provide in-formation gain for subsequent modeling. Therefore, after removing highly overlapping samples, the remaining number of effective samples is 2259 groups. The collection points and distribution of COD values is shown in Table 1.
| Location | Mean (mg L−1) | SD | Min (mg L−1) | Q1 (mg L−1) | Median (mg L−1) | Q3 (mg L−1) | Max (mg L−1) | Data size |
|---|---|---|---|---|---|---|---|---|
| Qian Lake | 5.9 | 1.21 | 3.68 | 5.46 | 6.08 | 6.7 | 7.21 | 228 |
| QinHuai River | 3.9 | 2.26 | 0.95 | 2.22 | 3.71 | 5.8 | 6.64 | 349 |
| XuanWu Lake | 3.99 | 2.39 | 0.8 | 2.4 | 4.43 | 5.69 | 6.65 | 241 |
| SanQ Wetland | 3.34 | 1.81 | 0.85 | 2.04 | 3.56 | 4.8 | 5.35 | 273 |
| LiShui River | 3.72 | 1.58 | 1.35 | 2.66 | 4.18 | 4.89 | 5.31 | 286 |
| YangShan Lake | 3.84 | 1.5 | 1.74 | 2.95 | 4.16 | 5.01 | 5.35 | 238 |
| XuPu River | 3.52 | 1.57 | 0.92 | 2.29 | 3.73 | 4.81 | 5.31 | 364 |
| MengJiaG River | 3.82 | 2.33 | 0.57 | 1.36 | 4.43 | 5.69 | 6.83 | 280 |
2.2 Standard COD determination
The true value of COD in water samples is obtained by rapid digestion spectrophotometric method (HJ/T399-2007), which can be regarded as ground-truth.2.3 UV-Vis absorption spectrum acquisition
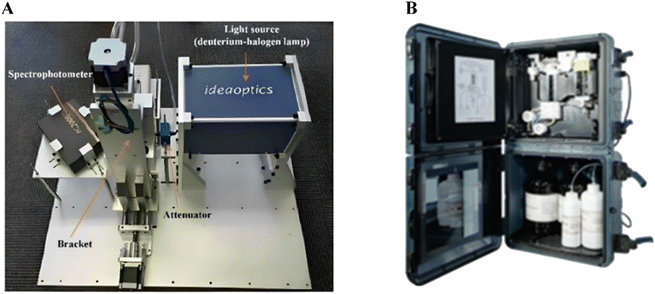
The light intensity map of water sample under the current light source was obtained by means of spectrograph, and the light intensity diagram of blank liquid (generally using distilled water) is compared to calculate the corresponding absorbance of each wavelength, Finally, the absorption spectrum of UV-Vis can be obtained by taking wavelength as abscissa and absorbance as ordinate. The collection method and equipment are shown in Fig. 2(A). | ||
| Fig. 2 UV-Vis absorption spectrum acquisition method. (A) Equipment layout diagram. (B) UV-Vis absorption spectrum of a water sample. | ||
2.4 The characteristic of samples spectrum
UV-Vis absorption spectrogram of a water sample randomly selected from the dataset are shown in Fig. 2(B). As can be seen from the figure, there is high-frequency noise (in the form of jitter and spikes) uniformly distributed in the whole band (194–699 nm). The noise form is random and instantaneous value follows Gaussian distribution, which requires the subsequent COD prediction network to have high robustness.2.5 Noise removal
Accurate prediction of COD requires the input UV-Vis absorption spectrum with high signal-to-noise ratio. To achieve this, this work applies a discrete wavelet transform (DWT) based filter to remove high-frequency noise from the spectrum.As a mathematical method to decompose signals into different frequency groups, DWT provides an effective method for analyzing non-stationary signals and has been widely studied. The DWT of signal x(t) can be defined as formula (1):14,15
 | (1) |
Implement of DWT filter in this work is based on three steps:
Step 1: DWT decomposition of the UV-Vis absorption spectrum by using formula (2):
 | (2) |
Step 2: Process DWT coefficients of high frequency part by threshold function:
There two well-known threshold function, which is hard threshold function (shown as formula (3)) and soft threshold function (shown as formula (4)).
 | (3) |
 ), σn represents the variance of noise, N represents the spectrum length, wj,k represents DWT coefficients. The characteristic of the hard threshold method is that the spectrum details such as signal edge can be preserved well.
 | (4) |
Therefore, this work improves the soft threshold function by adaptive to make it have the characteristics of high order smoothing, the improved threshold function is shown as formula (5).
 | (5) |
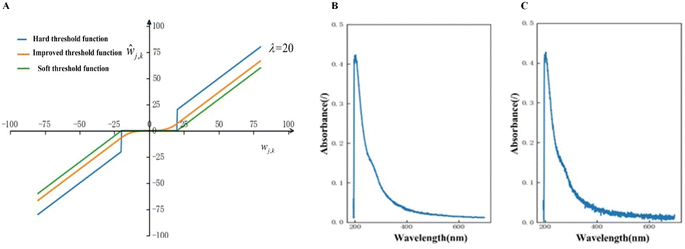
Taking λ = 20 and η = 2 as examples, the hard threshold function, improved threshold function and soft threshold function are drawn respectively, as shown in Fig. 3(A). It can be seen that the improved soft threshold function is smoother in the transition region than the traditional soft threshold function, and is more consistent with the continuous characteristics of UV-Vis absorption spectrum.
Step 3: UV-Vis absorption spectrum reconstruction based on DWT coefficients.
As mentioned above, the DWT is a two-dimensional timescale processing method for non-stationary signals with adequate scale values and shifting in time. The wavelet transform is capable of representing signals in different resolutions by dilating and compressing its basis functions.
On the other hand, the UV-Vis spectrum of measured water is often disturbed by low-frequency baseline and high-frequency noise. The low-frequency baseline part is caused by the scattering of particles in the measured water, and can be corrected through multivariate scattering. The high-frequency noise part is mainly caused by the light source, optical path and spectrum detection instrument, and mainly appears as a non-stationary signal that continuously jumps during online measurement. For the high-frequency noise part, we need to use the translation and scaling of wavelet in DWT to calculate the high-frequency coefficients, then filter the high frequency signal through the improved threshold function, and finally reconstruct the spectrum to achieve the removal of high frequency noise while preserving the spectral characteristics.
A raw UV-Vis absorption spectrum selected from the dataset are shown as Fig. 3(C). The de-noising spectrum are shown as Fig. 3(B). As shown in Fig. 3, the proposed adaptive soft threshold function can better remove the jitter and spikes in raw UV-Vis absorption spectrum.
2.6 Data set division
From 2259 groups of water samples, 1900 groups of samples were selected as the training dataset by uniform distribution. In the remaining 359 groups of samples, 200 groups of samples were selected as the validation dataset by uniform distribution. Finally, take remaining 159 groups of water samples as testing dataset.2.7 Data normalization
At the initial input layer of the network, we normalize the data with Min-Max-Scaler to avoid over-reliance on certain features, while speeding up learning by limiting all variables to a range between 0 and 1. Between convolutional operation and nonlinear activation within the network, we use the BN layer to mitigate gradient explosion and gradient disappearance, and accelerate the convergence of the network.2.8 Network design
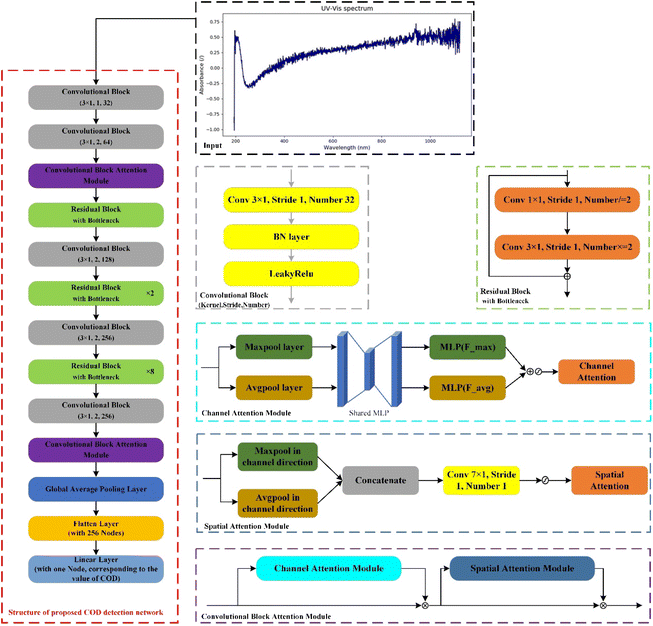
From the microscopic point of view, the essence of light absorption of a substance is the absorption of light energy by electrons. The main reason for the different position of the absorption peak wavelength is that electrons absorb light of different wavelengths according to the different energy levels required by the transition.This model is implemented as a convolutional neural network. The network architecture is inspired by the YOLO model for object detection.16–18 To further reduce the complexity of the model. We replace most of fully connected layer with 1 × 1 convolution kernel. Our network has 17 convolutional layers and 2 attention blocks followed by an adaptive pooling layer and 2 linear layers.
The input of our network is the full band UV-Vis absorption spectrum, and the final output of our network is the 1 × 1 tensor of COD predictions.
The network structure used in this work is shown in Fig. 4, which mainly includes: convolutional module,19,20 residual module21 and Convolutional Block Attention Module (CBAM).22,23
For convolutional module, the calculate operation of feature map is shown in formula (6):
| Mconv(F) = LeakyRelu(BN(Conv(F))) | (6) |
For residual module, the calculate operation of feature map is shown in formula (7):
| Mres(F) = Conv3×1(Conv1×1(F)) + F | (7) |
For CBAM, the calculate operation of feature map is shown in formula (8)–(10):
| MCBAM(F) = Mspatial(F) × Mchannel(F) × F | (8) |
| Mspatial(F) = σ(Conv7×1([Avgpool(F); Maxpool(F)])) | (9) |
| Mchan(F) = σ(MLP(Maxpool(F)) + MLP(Avgpool(F))) | (10) |
The role of CBAM is adaptive refinement of spectral features. Since different water quality parameters in water samples have sensitive bands in the UV-Vis spectrum, for example: the sensitive band for turbidity is 380–740 nm, the sensitive band for chroma is 390–440 nm, and the sensitive band for TOC (Total Organic Carbon) is 250–390 nm. Our goal is to increase representation power by using attention mechanism: focusing on important features that affect COD and suppressing unnecessary ones. Therefore, we applied CBAM, so that neural network can know “where” (spatial attention modules) wavelength features has an impact on output, and “what” (channel attention modules) channel has the greatest impact on output.
In addition, in this network, the last three layers are:
1. Global average pooling layer: select the average value in each feature map as the output of this channel.
2. Flattening layer: flatten the feature map into a 256-dimensional vector.
3. Linear layer: there is only one output node, corresponding to the COD square root value.
2.9 Early-stopping and model-checkpoint
Early-stopping is used to monitor validation loss and halts the training when validation accuracy does not improve after a certain number of epochs (in this work, a patience epoch = 5). This strategy prevents overfitting because it stops training when the performance of the validation set starts to decline. Moreover, the weights of the model at its peak performance are restored by model-checkpoint. This ensures that the best model is retained at the end of the training rather than the final model.24,252.10 Workflow of COD detection
In order to apply the proposed method to COD detection in real water, we designed an automated detection module, as shown in Fig. 5(C).The automated detection module is placed in the water quality dynamic detecting equipment and mainly includes the following components:
1. Detection room. Container for storing water samples to be tested.
2. Spectrometer. Deuterium halogen lamps are selected as light sources to produce stable intensity light.
3. Optical attenuator. Used to minimize signal distortion and improve equipment reliability.
4. Water pump. Used to draw water samples into the detection room and discharge the water samples in the detection room.
5. Locating mechanism. Used to fix the position and posture of the above components.
The workflow diagram of the automatic detection module is shown in Fig. 6. Among them, the control circuit is used to implement the mechanical operation and control logic of the module, such as pumping water samples, draining water samples, power on the industrial computer, etc. Industrial computer is mainly used to collect UV-Vis spectrum, such as setting operating parameters, calculating absorbance, transmitting spectral data to the server, etc. The server is used to accept the raw UV-Vis spectrum uploaded by the automatic detection module in each sampling point, use the deployed neural network to detect COD, then combine the sampling point location and the corresponding COD value for visualization, and finally send the data to the terminal for rendering.
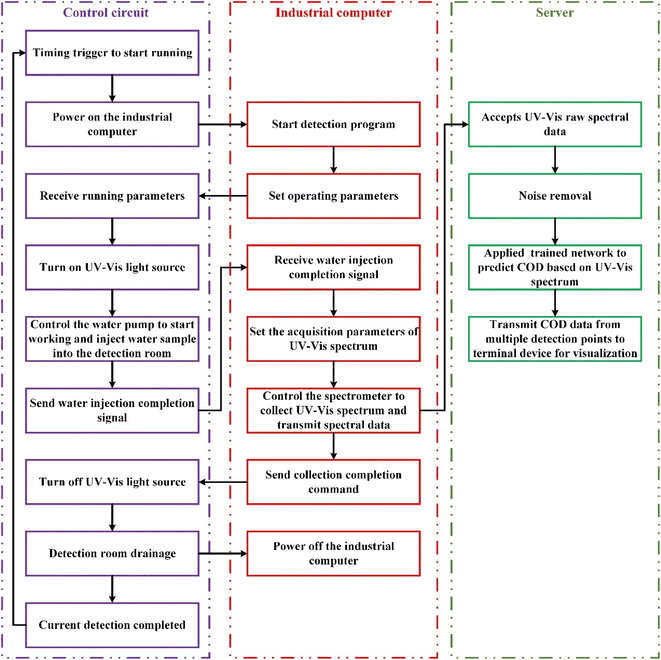 | ||
| Fig. 6 Work flow chart of the automated detection module in water quality dynamic detecting equipment. | ||
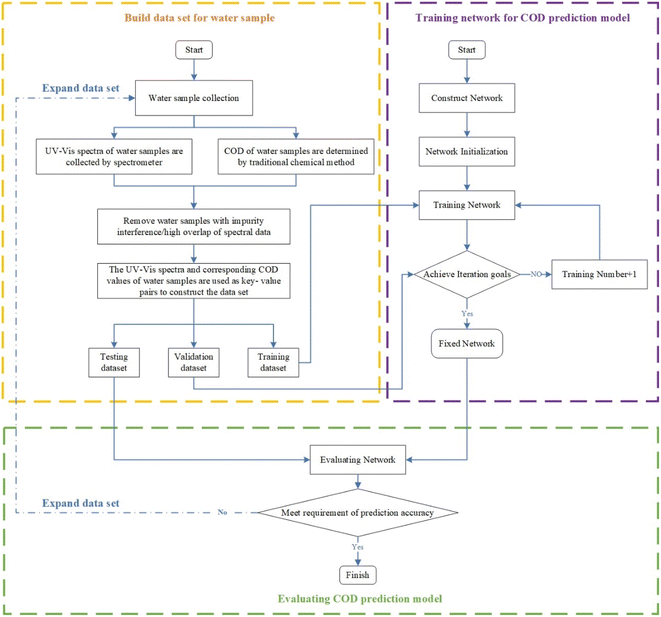
UV-Vis spectroscopy for COD prediction of surface water is a detection method that uses absorption characteristics of organic matter or part of inorganic matter in water to calculate COD value of water sample from absorption spectrum. The specific steps of data set construction, model training and testing are shown in Fig. 7.
2.11 Algorithm running environment
The computer configuration parameters used for neural network model training and testing are shown in Table 2.| OS | CPU | GPU | Pytorch-gpu | Python | Anaconda |
|---|---|---|---|---|---|
| Windows 11 | i7-13700KF | RTX4080 | 2.0.1+cu118 | 3.10.11 | 23.3.1 |
3. Results
3.1 Training
The convolutional layers were pretrained on LAMOST Spectra 4-class classification dataset.26 For pretraining we use the first 17 convolutional layers from Fig. 4 followed by a Flatten layer and a SoftMax layer. This network was pretrained for approximately 2 hours on RTX4080 and achieve a top-1 accuracy of 96% on the validation set.A leaky rectified linear activation is used after each convolutional layer, which is shown in formula (11).
 | (11) |
Then the model is converted to perform COD detection. We fixed the weights for the first 17 convolutional layers and only trained the weights for last two linear layers.
The mean squared error27 is used to optimize our model. But mean squared error doesn't exactly match our training goals. It gives equal weight to large COD and small COD errors. Our error measure should reflect that small deviations from large COD are more important than small deviations from small COD. To partially solve this problem, we predict the square root of COD instead of predicting COD directly.
To sum up, our loss function is shown as formula (12).
 | (12) |
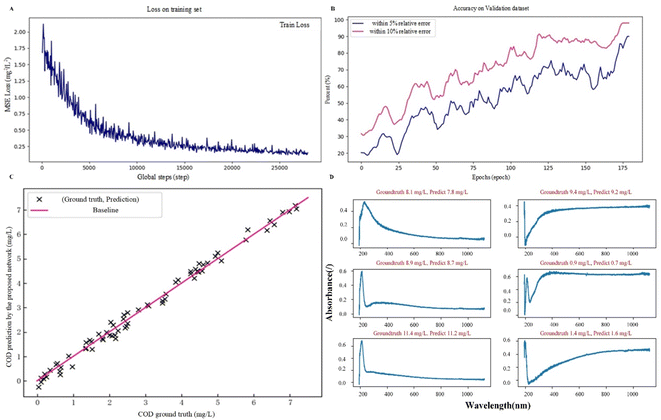
We train the network for 155 epochs on the training dataset and evaluate on validation dataset. To optimize the training process, the initial learning rate is set as 10−3, and we decay the learning rate of each parameter group by 0.8 times every 5 epochs. Throughout training, we use optimizer of ‘Adam’, a batch size of 32, epochs of 160. The network convergence process is shown as Fig. 8(A).
In order to investigate the generalization ability of the network, the network prediction evaluation on the validation dataset is set every epoch, results are shown in Fig. 8(B). As can be seen that the network has strong generalization ability, in the validation dataset, the relative error of 99.54% COD prediction results is within 10%, and that of 90.36% COD prediction results is within 5%.
3.2 Inference
Generalization refers to the ability of a model to digest new data and make accurate predictions after training on the training set.To verify the generalization ability of the proposed model, we introduce Pearson correlation coefficient28 to measure the linear correlation between the predicted COD value and the true COD value. The Pearson correlation coefficient formula is shown in formula (13).
 | (13) |
![[t with combining macron]](https://www.rsc.org/images/entities/i_char_0074_0304.gif) ’ represents the mean value of COD prediction.
’ represents the mean value of COD prediction.
As shown in formula (13), the closer the Pearson correlation coefficient of proposed model is to 1, the closer the predicted value is to the ground truth, and the stronger the generalization ability of the model. We fixed the network weights and using 67 groups new data to verify the generalization ability. The results are shown as Fig. 8(C), and the Pearson correlation coefficient has a value of 0.97.
We pipelined the noise removal algorithm in section 2.5 and prediction network in section 2.7 to form a complete COD detection model in this paper.
We randomly selected 6 samples' raw UV-Vis absorption spectrum from the 67 groups new data, and input them into proposed COD detection model. The predicted value and corresponding ground truth are shown in Fig. 8(D).
As shown in Fig. 8, the proposed COD detection model has a good performance on both noise tolerance and accuracy.
4. Discussion
4.1 The role of noise removal
At present, the research on COD detection mainly focuses on improving accuracy.5,7,10,11,28 And many scholars directly transmit raw spectrum with noise to the neural network for end-to-end training. In our previous work, we also trained the end-to-end network under specific detection scenarios. Experiments show that under ideal circumstances, the end-to-end network has better generalization ability and can obtain better fitting results. However, in this paper, we still choose the two-stage strategy for the following reasons:However, few research9,13 carry out the universal detection framework of COD based on the real water sample spectrum with low Signal to Noise Ratio (SNR).
To discuss the role of noise removal in this work, the performance of multiple algorithms was tested simultaneously on a new water sample dataset. The results are shown in Table 3.
| Noise removal algorithm | COD prediction method | End to end | Spectra region | R |
|---|---|---|---|---|
| None | PLS | Yes | 220 nm, 253 nm | 0.68 |
| None | SVR | Yes | 220 nm, 253 nm | 0.70 |
| None | ANN | Yes | 200–762 nm | 0.64 |
| None | CNN | Yes | 200–762 nm | 0.66 |
| None | VGG | Yes | 200–762 nm | 0.66 |
| None | ResNet18 | Yes | 200–762 nm | 0.70 |
| None | Proposed network | Yes | 200–762 nm | 0.75 |
| Hard threshold noise filter | PLS | No | 220 nm, 253 nm | 0.75 |
| Hard threshold noise filter | SVR | No | 220 nm, 253 nm | 0.76 |
| Hard threshold noise filter | ANN | No | 200–762 nm | 0.71 |
| Hard threshold noise filter | CNN | No | 200–762 nm | 0.69 |
| Hard threshold noise filter | VGG | No | 200–762 nm | 0.72 |
| Hard threshold noise filter | ResNet18 | No | 200–762 nm | 0.79 |
| Hard threshold noise filter | Proposed network | No | 200–762 nm | 0.84 |
| Soft threshold noise filter | PLS | No | 220 nm, 253 nm | 0.76 |
| Soft threshold noise filter | SVR | No | 220 nm, 253 nm | 0.76 |
| Soft threshold noise filter | ANN | No | 200–762 nm | 0.70 |
| Soft threshold noise filter | CNN | No | 200–762 nm | 0.71 |
| Soft threshold noise filter | VGG | No | 200–762 nm | 0.73 |
| Soft threshold noise filter | ResNet18 | No | 200–762 nm | 0.80 |
| Soft threshold noise filter | Proposed network | No | 200–762 nm | 0.83 |
| Proposed threshold filter | PLS | No | 220 nm, 253 nm | 0.88 |
| Proposed threshold filter | SVR | No | 220 nm, 253 nm | 0.85 |
| Proposed threshold filter | ANN | No | 200–762 nm | 0.86 |
| Proposed threshold filter | CNN | No | 200–762 nm | 0.85 |
| Proposed threshold filter | VGG | No | 200–762 nm | 0.87 |
| Proposed threshold filter | ResNet18 | No | 200–762 nm | 0.93 |
| Proposed threshold filter | Proposed network | No | 200–762 nm | 0.97 |
| Denoising autoencoder | PLS | No | 220 nm, 253 nm | 0.73 |
| Denoising autoencoder | SVR | No | 220 nm, 253 nm | 0.74 |
| Denoising autoencoder | ANN | Yes | 200–762 nm | 0.70 |
| Denoising autoencoder | CNN | Yes | 200–762 nm | 0.68 |
| Denoising autoencoder | VGG | Yes | 200–762 nm | 0.71 |
| Denoising autoencoder | ResNet18 | Yes | 200–762 nm | 0.76 |
| Denoising autoencoder | Proposed network | Yes | 200–762 nm | 0.81 |
As shown in Table 3, the spectrum preprocessing can effectively improve the accuracy of the model. However, the denoising autoencoder is difficult to effectively remove noise, possibly due to the high redundancy of the UV-Vis spectrum and the insufficient amount of training data. We believe the theoretical reasons that may be related to the network model are as follows:
It is difficult for a purely data-driven neural network to learn the distribution pattern of noise under the current scale of the data set. Fluctuations in the output power of the light source, doping of the optical fiber material, particles in the CCD module and environmental vibration are the main causes of spectral noise, which is represented by the burr of high frequency jumping up and down. For the spectrum of the i-th sample, it is generally assumed that the noise satisfies the Gaussian distribution of fixed mean (μi) and fixed variance (σi). However, because the spectrum dataset was collected through cooperation between multiple parties, that is, there are different in the types of light sources and spectrometers used by each party, this causes the prior probabilities of μ and σ show a long-tailed distribution for the entire dataset. It is difficult for neural networks based on purely data-driven learning to learn the distribution of μ and σ in the current scale of data sets, resulting in poor prediction results.
4.2 Comparative study
Table 3 also shows the performance of other detection algorithms based on UV-visible spectroscopy.Among them, PLS and SVR models are commonly used detection methods for COD prediction of water samples in the last century. They are typically characterized by absorbance values at 220 nm and 253 nm as inputs to the model. However, due to the complex composition of real water, the size, type and color of the particles in the water sample will cause varying degrees of interference with the UV-Vis spectrum. This results in a modeling method that uses only a few characteristic bands as input, making it difficult to accurately predict the COD value in actual water samples.
On the other hand, data-driven detection methods such as ANN, CNN and VGG often use the full-band spectrum as the input of the model for modeling. Although this type of deep learning model has strong generalization capabilities, when the amount of data in the training set is insufficient and the linear redundancy of the spectrum is high, it can easily lead to overfitting, thus reducing the accuracy of prediction.
However, the ResNet18 alleviates the problems of degradation and overfitting by shortcut connection and dropout layer. As shown in Table 3, on the basis of ResNet18, the prediction model proposed in this work introduces the attention mechanism, which ensures the model nonlinear fitting ability, further alleviates the overfitting problem of deep learning, and thereby improves detection accuracy.
In addition to UV-Vis spectrum, the fluorescence spectrum (also known as excitation–emission matrix) can obtain the complete spectral information of fluorophores in humus, and other organic matter such as lignin, plankton, proteins, and some aliphatic groups can also emit fluorescence. Therefore, fluorescence spectroscopy can also be used for online COD detection.
The diaphragm electrode method, on the other hand, uses electrodes to detect the amount of oxygen as it passes through a highly oxygen permeable diaphragm and is widely used to measure dissolved oxygen levels. Moreover, there is a negative correlation between dissolved oxygen and COD. Therefore, after fitting the relationship between dissolved oxygen and COD through polynomial, COD can also be measured indirectly through the diaphragm electrode method.
In order to further demonstrate the superiority of the proposed method over previous methods, we conducted a comparative study, as shown in Table 4.
| Measurement method | Noise removal method | Modeling method | Initial parametersa | Measurement accuracy | |
|---|---|---|---|---|---|
| MSE (mg2 L−2) | R | ||||
| a n represents the highest power of the polynomial, c represents the punishment coefficient, σ represents the kernel function parameter, γ represents the regularization parameter. | |||||
| Fluorescence spectroscopic | Smoothness | Polynomial fitting | n = 3 | 0.49 | 0.91 |
| Smoothness | SVM | c = 1.4, σ = 0.37 | 0.35 | 0.94 | |
| Smoothness | LS-SVM | γ = 13, σ = 0.68 | 0.41 | 0.92 | |
| DWT | Polynomial fitting | n = 3 | 0.55 | 0.90 | |
| DWT | SVM | c = 1.4, σ = 0.37 | 0.34 | 0.94 | |
| DWT | LS-SVM | γ = 13, σ = 0.68 | 0.38 | 0.93 | |
| Diaphragm electrode | None | Polynomial fitting | n = 3 | 0.22 | 0.96 |
| Proposed method | Proposed threshold filter | Proposed network | Fixup initialization | 0.18 | 0.97 |
Table 4 also provides detailed data processing associated with these methods, such as data preprocessing, modeling, initial parameter settings and final measurement accuracy.
From the perspective of automated design and product maintenance, we believe that compared with diaphragm electrode method, the detection mechanisms of fluorescence spectroscopy and UV-Vis spectroscopy are more suitable for online COD detection in real water. Therefore, the main comparative work was placed on fluorescence spectroscopy. In addition, as shown in Table 4, the proposed method has better performance compared with other previously reported methods.
4.3 Performance experiments of detection method
In addition to using the Pearson correlation coefficient to measure the accuracy of the proposed method, we also conducted the following performance tests on the proposed method in accordance with the relevant definitions of the International Union of Pure and Applied Chemistry on chemical detection methods:
xL = ![[x with combining macron]](https://www.rsc.org/images/entities/i_char_0078_0304.gif) b1 + ksb1 b1 + ksb1
| (14) |
In the formula (14), xL represents the detection limit of the equipment, ![[x with combining macron]](https://www.rsc.org/images/entities/i_char_0078_0304.gif) b1 represents the blank mean value, k is the domain confidence-related constant, and the usual value is 3. sb1 is the standard deviation of the blank value. The standard deviation calculation formula is as formula (15).
b1 represents the blank mean value, k is the domain confidence-related constant, and the usual value is 3. sb1 is the standard deviation of the blank value. The standard deviation calculation formula is as formula (15).
 | (15) |
In the formula (15), n represents the number of measurements, and the usual value is 20, ![[x with combining macron]](https://www.rsc.org/images/entities/i_char_0078_0304.gif) is the average measurement value of the equipment corresponding to the blank value, xi represents the i-th measurement value.
is the average measurement value of the equipment corresponding to the blank value, xi represents the i-th measurement value.
The redistilled water was used as the index blank solution and measured 20 times continuously. Through experiments, the detection limit of this method is 0.07 mg L−1.
 | (16) |
In the formula (16), max(xi) represents the maximum value measured within 24 hours, x0 represents the measured value at the initial detection time point, lnw represents the range of the device. Through experiments, the zero drift of this method is 0.94%.
 | (17) |
In the formula (17), xi represents the i-th measurement value, ![[x with combining macron]](https://www.rsc.org/images/entities/i_char_0078_0304.gif) represents the average measurement value, n represents the total number of measurements, and n ≥ 6 is often required. Through experiments, the highest RSD value of this method is 1.89%.
represents the average measurement value, n represents the total number of measurements, and n ≥ 6 is often required. Through experiments, the highest RSD value of this method is 1.89%.
5. Conclusion
In summary, we have proposed and developed an improved online COD prediction measurement. The main work contents include: design the structure and workflow of online automatic detection module, propose an improved noise removal method for UV-Vis spectrum, and propose a COD detection network based on deep learning. The main findings of the paper are as follow:1. The DWT denoising algorithm based on the improved threshold function (the denoising method proposed in this paper) preprocesses the UV-Vis spectrum of water samples, which can effectively improve the accuracy of subsequent detection models. Through a large number of comparative experiments, it was found that the Pearson correlation coefficient (R) of the proposed denoising method can be increased by 21.4% to 29.3% compared to not using the denoising algorithm. In addition, compared with the denoising autoencoder, the proposed denoising method can increase the R by 15.2% to 19.8%. Indicates that the proposed denoising method is more suitable for UV-Vis spectrum.
2. The COD detection network (proposed in this paper) composed of the residual module and the CBAM module can improve the detection accuracy, and the R in the test set is 0.97. Compared with the SVM model, it has improved by 12%, and compared with ResNet, it has improved by 4%.
3. For the trained COD prediction network, 90.36% of the prediction results have a relative error within 5%, and 99.54% of the COD prediction results have a relative error within 10%. In addition, the MSE (mean squared error) of the network on testing set is 0.18, while the fluorescence spectroscopic method is 0.35–0.55, and the diaphragm electrode method is 0.22. It shows the proposed method has better performance compared with other previously reported methods.
4. Through the performance experiments of the detection method, it can be seen that the detection limit of the proposed method is 0.07 mg L−1, the measuring range is 0.70–15.00 mg L−1, the zero drift is 0.94%, and the repeatability is 1.89%
Conflicts of interest
There are no conflicts of interest to declare in this work.Acknowledgements
This work was supported by “Start-up Fund for New Talented Researchers of Nanjing Vocational University of Industry Technology (Grant No. YK22-01-04)” and supported partially by “Open Foundation of Industrial Perception and Intelligent Manufacturing Equipment Engineering Research Center of Jiangsu Province (Grant No. ZK22-05-08)”.References
- Z. Zhang, F. Xia, D. Yang and Y. Chen, Discussion of an environmental depletion assessment method-A case study in Xinjiang, China, PLoS One, 2022, 17(1), e0262092 CrossRef CAS PubMed.
- L. Wu, X.-W. Qiu, T. Wang, K. Tao, L.-J. Bao and E. Y. Zeng, Water Quality and Organic Pollution with Health Risk Assessment in China: A Short Review, ACS ES&T Water, 2022, 2(8), 1279–1288 Search PubMed.
- M. Zhong, T. Wang, W. Zhao, J. Huang, B. Wang and L. Blaney, et al., Emerging Organic Contaminants in Chinese Surface Water: Identification of Priority Pollutants, Engineering, 2022, 11(4), 111–125 CrossRef CAS.
- M. Lepot, A. Torres, T. Hofer, N. Caradot, G. Gruber and J.-B. Aubin, et al., Calibration of UV/Vis spectrophotometers: A review and comparison of different methods to estimate TSS and total and dissolved COD concentrations in sewers, WWTPs and rivers, Water Res., 2016, 101, 519–534 CrossRef CAS PubMed.
- J. L. McHale, Molecular Spectroscopy, CRC Press, 2nd edn, 2017 Search PubMed.
- M. Xia, R. Yang, G.-f. Yin, X. Chen, J. Chen and N. Zhao, A method based on a one-dimensional convolutional neural network for UV-vis spectrometric quantification of nitrate and COD in water under random turbidity disturbance scenario, RSC Adv., 2022, 13(1), 516–526 RSC.
- Y. Zhao, H. Wang, Z. Liu, Y. Li and S. Fan, Novel method for on-line water COD determination using UV spectrum technology, Chin. J. Sci. Instrum., 2010, 31(9), 1927–1932 Search PubMed.
- J. Agustsson, O. Akermann, D. A. Barry and L. Rossi, Non-contact assessment of COD and turbidity concentrations in water using diffuse reflectance UV-Vis spectroscopy, Environ. Sci.: Processes Impacts, 2014, 16(8), 1897–1902 RSC.
- Z. Wang, Y. Man, Y. Hu, J. Li, M. Hong and P. Cui, A deep learning based dynamic COD prediction model for urban sewage, Environ. Sci.: Water Res. Technol., 2019, 5(3), 124–131 CrossRef PubMed.
- Y. Jiang, C. Li, L. Sun, D. Guo, Y. Zhang and W. Wang, A deep learning algorithm for multi-source data fusion to predict water quality of urban sewer networks, J. Cleaner Prod., 2021, 3(8), 128–133 Search PubMed.
- J. Li, Y. Tong, L. Guan, S. Wu and D. Li, A turbidity compensation method for COD measurements by UV–vis spectroscopy, Optik, 2019, 186, 129–136 CrossRef CAS.
- A. A. Babaei and F. Ghanbari, COD removal from petrochemical wastewater by UV/hydrogen peroxide, UV/persulfate and UV/percarbonate: biodegradability improvement and cost evaluation, J. Water Reuse Desalin., 2016, 6(4), 484–494 CrossRef CAS.
- S. Zhao, G. Huang, G. Cheng, Y. Wang and H. Fu, Hardness, COD and turbidity removals from produced water by electrocoagulation pretreatment prior to Reverse Osmosis membranes, Desalination, 2014, 344, 454–462 CrossRef CAS.
- S. M. Ahmed, A. Al-Shrouf and M. Abo-Zahhad, ECG data compression using optimal non-orthogonal wavelet transform, Med. Eng. Phys., 2000, 22(1), 39–46 CrossRef CAS PubMed.
- J. Li, Y. Tong, L. Guan, S. Wu and D. Li, A UV-visible absorption spectrum denoising method based on EEMD and an improved universal threshold filter, RSC Adv., 2018, 8(16), 8558–8568 RSC.
- You Only Look Once: Unified, Real-Time Object Detection, Redmon J., Divvala S., Girshick R. and Farhadi A., Computer Vision & Pattern Recognition, 2016 Search PubMed.
- P. Jiang, D. Ergu, F. Liu, Y. Cai and B. Ma, A Review of Yolo Algorithm Developments, Procedia Comput. Sci., 2022, 199, 7 Search PubMed.
- Image Super-Resolution via Deep Recursive Residual Network, Tai Y., Yang J. and Liu X., IEEE Conference on Computer Vision & Pattern Recognition, 2017 Search PubMed.
- Z. Liu, J. Du, M. Wang and S. S. Ge, ADCM: Attention Dropout Convolutional Module, Neurocomputing, 2020, 394, 95–104 CrossRef.
- Rotate to Attend: Convolutional Triplet Attention Module, Misra D., Nalamada T., Arasanipalai A. U. and Hou Q., IEEE/CVF winter conference on applications of computer vision, 2020 Search PubMed.
- A. Veit, M. Wilber and S. Belongie, Residual Networks Behave Like Ensembles of Relatively Shallow Networks, Adv. Neural Inf. Process. Syst., 2016, 29, 55–61 Search PubMed.
- S. H. Wang, Q. Zhou, M. Yang and Y. D. Zhang, ADVIAN: Alzheimer's Disease VGG-Inspired Attention Network Based on Convolutional Block Attention Module and Multiple Way Data Augmentation, Front. Aging Neurosci., 2021, 13, 687–696 Search PubMed.
- CBAM: Convolutional Block Attention Module, Woo S., Park J. and Lee J. Y., European conference on computer vision, 2018 Search PubMed.
- N. Nehra, P. Sangwan and D. Kumar, Artificial Neural Networks: A Comprehensive Review, Handbook of Machine Learning for Computational Optimization, 2021 Search PubMed.
- Mechanism of Overfitting Avoidance Techniques for Training Deep Neural Networks, Sabiri B., Asri B. E. and Rhanoui M., International Conference on Enterprise Information Systems, 2022 Search PubMed.
- F. Yang, L. Deng, C. Liu, J. L. Carlin, H. J. Newberg and K. Carrell, et al., Hydrogen lines in LAMOST low-resolution spectra of RR Lyrae stars, New Astron., 2014, 26, 72–76 CrossRef CAS.
- Z. Wang and A. C. Bovik, Mean squared error: Love it or leave it? A new look at Signal Fidelity Measures, IEEE Signal Process. Mag., 2009, 26(1), 98–117 Search PubMed.
- J. L. Rodgers, W. A. Nicewander and D. C. Blouin, Thirteen ways to look at the correlation coefficient, Am. Stat., 1988, 42(1), 59–66 CrossRef.
| This journal is © The Royal Society of Chemistry 2024 |

