 Open Access Article
Removal of bromophenol blue from polluted water using a novel azo-functionalized magnetic nano-adsorbent†
Hadeel Saadab,
F. A. Nour El-Dien a,
Nadia E. A. El-Gamela and
Ahmed S. Abo Dena
 *cd
*cd
aChemistry Department, Faculty of Science, Cairo University, Giza, 12613, Egypt
bGeneral Organization for Export and Import Control, Ramses Street, Cairo, Egypt
cPharmaceutical Chemistry Department, National Organization for Drug Control and Research (NODCAR), Giza, Egypt. E-mail: ahmed_said5899@yahoo.com
dFaculty of Oral and Dental Medicine, Future University in Egypt (FUE), New Cairo, Egypt
First published on 3rd January 2024
Abstract
Water pollution from organic dyes poses a serious danger to the environment. In the present work, we report a novel adsorbent (ADFS) based on azo-dye-functionalized superparamagnetic iron oxide nanoparticles (SPIONs) for the removal of the anionic dye bromophenol blue (BPB) from contaminated water. The fabricated SPIONs, azo dye, and ADFS adsorbent were characterized with FTIR and UV-vis absorption spectroscopy, 1HNMR spectroscopy, mass spectrometry, SEM imaging, dynamic light scattering (DLS), zeta potential measurements, vibrating sample magnetometry, thermogravimetric analysis, differential thermal analysis, and X-ray diffraction analysis. DLS measurements showed a particle size of 46.1 and 176.5 nm for the SPIONs and the ADFS, respectively. The adsorbent exhibited an adsorption capacity of 7.43 mg g−1 and followed the pseudo-second-order kinetics model (r2 = 0.9981). The ADFS could efficiently remove BPB from water after stirring for 120 minutes at room temperature and pH 2. The adsorption process was proved to occur via physisorption, as revealed by the Freundlich isotherm (n = 1.82 and KF = 11.5). Thermodynamic studies implied that the adsorption is spontaneous (−8.03 ≤ ΔG ≤ −0.58 kJ mol−1) and enthalpy-driven might take place via van der Waals interactions and/or hydrogen bonding (ΔH = −82.19 kJ mol−1 and ΔS = −0.24 kJ mol−1 K−1).
Introduction
Recently, the pollution of water resources has been grabbing the attention of researchers because it not only causes serious damage to the environment but also causes a serious economic loss that cannot be overlooked. Synthetic dyes belong to the most important water contaminants, and almost all of them are soluble in water, so their removal is very difficult. These dyes can be present in industrial effluents such as those from the food, paper, cosmetic, paint, textile, and leather industries. Accordingly, novel, efficient remediation and separation technologies are urgently needed for the removal of organic dyes from water so as to protect the water environment and human health.1The common techniques reported in the literature for the removal of organic dyes from water include photocatalysis, oxidative degradation, coagulation, and other additional water-treatment approaches.2 Unlike these approaches, adsorption-based water treatment methods exhibit some advantages, such as rapid removal, cost effectiveness, and easy manipulation. Bromophenol blue (BPB) is a well-known organic dye belonging to the triphenylmethane family. The IUPAC name of BPB is 2,6-dibromo-4-[3-(3,5-dibromo-4-hydroxyphenyl)-1,1-dioxo-2,1λ6-benzoxathiol-3-yl]phenol. It has been used as a pH indicator for a long time, and it is still being used in the textile, paint, leather, and paper industries. Other applications of BPB include using it as a tracking dye in electrophoresis and as a biological stain. The inhalation or contact of BPB may cause eye, skin and respiratory tract irritation. It may also cause foetal and reproductive effects. Liver, kidney and heart damage were reported in the case of prolonged inhalation to BPB.3 In addition, the exposure to BPB can cause allergic reactions such as dermatitis, and respiratory problems. Moreover, oral administration of BPB can cause irritation of the GIT, nausea, vomiting, and diarrhoea. Accordingly, the direct discharge of dye-concentrated wastewater into the environment may cause a serious harm to the aquatic environment because they may increase the level of the total dissolved solids (TDS), chemical oxygen demand (COD), biochemical oxygen demand (BOD), and water turbidity.4 That is why BPB may represent a serious danger to the environment due to the possibility of its leakage into the water from various sources. In this context, researchers have been interested in finding new adsorbents for removing BPB from water in an efficient way.
In the last decade, many adsorptive approaches have been developed for the removal of BPB from contaminated water. For instance, biosorbents have been successfully applied for the removal of BPB, and they include black-soldier fly larvae,5 haemoglobin,6 and biopolymers.7 In addition, magnetic hydrogels,8 surfactant-coated selenium nanoparticles,9 and matrix-dispersed polyethyleneimine-coated magnetic nanoparticles10 were used as adsorbents for the removal of BPB from polluted water. Despite the effectiveness of the above adsorbents, most of them suffer from toxicity, high cost, unavailability, or complexity of the synthesis procedure.
The novelty of the present work is that it provides an approach to develop a new class of magnetic adsorbent materials that depend on superparamagnetic iron oxide nanoparticles (SPIONs) functionalized with a high-molecular-weight azo dye (AD). The proposed azo-dye-functionalized SPION (ADFS) adsorbent has the advantages of cost effectiveness, biocompatibility (since it uses biocompatible azo dye precursors), facile synthesis, and easy collection via the application of an external magnetic field. Moreover, the suggested ADFS adsorbent can be successfully applied for the removal of high concentrations of BPB from water at ambient temperature. The proposed ADFS adsorbent was fully characterized, and adsorption experiments were carried out so as to study adsorption isotherms, adsorption kinetics, and adsorption thermodynamics.
Materials and methods
Materials
Bromophenol blue was obtained from Carlo Erba Reagents (Barcelona, Spain). For the synthesis of the AD, tert-butyl-[2-(3,5-dihydroxyphenyl)-2-hydroxyethyl]azanium sulphate (TBDA sulphate, molar mass 548.65 g mol−1, Borg Pharmaceutical Industries, Borg El-Arab, Alexandria, Egypt), aniline (Al-Alamia for Chemical Industries, Egypt), sodium carbonate (ADWIC, Egypt) and sodium nitrite (SDFCL, India) were used. Ferric chloride hexahydrate, FeCl3·6H2O (Daejung Chemicals and Metals, South Korea), anhydrous sodium acetate (ADWIC, Egypt) and ethylene glycol (Honeywell International Inc., USA) were used to synthesize the SPIONs. Hydrochloric acid was purchased from Alpha Chemika (India) and ethyl alcohol was obtained from the International Company for Medical Industries (Egypt). All chemical reagents were of analytical grade and were used as received without any further purification. A BPB stock solution (1000 mg L−1) was prepared by dissolving 50 mg of BPB in 50 mL of double distilled water. Working BPB solutions (10–100 mg L−1) were prepared by diluting a stock BPB solution (1000 mg L−1) with distilled water shortly before each experiment.Instruments
All absorbance measurements and spectral scans were carried out with the aid of a SPECORD 250 PLUS Analytikjena Spectrophotometer (Germany) with a 1 cm quartz cell. Field-emission scanning electron microscopy (FE-SEM; VEGA3 TESCAN, Czech Republic) and high-resolution transmission electron microscopy (HRTEM; JEOL JEM-2100, Japan) were used to study particle size, shape, and surface morphology. Fourier transform infrared spectra (FTIR) were recorded on a Nicolet 6700 ATR-FTIR spectrometer (Thermo Scientific, Germany). Particle size and zeta potential (ZP) of plain/uncoated SPIONs and the ADFS were determined by a Malvern Panalytical instrument (UK). A vibrating sample magnetometer (VSM, Lakeshore, Model 7410) was used to measure the magnetic properties of the synthesized nanomaterials. X-ray diffraction (XRD) spectra (Discover-D8, Bruker, USA) were used to unravel the crystal structure of the synthesized nanoparticles. 1H NMR spectra were recorded with a Varian 300 MHz NMR spectrometer (Germany) with deuterated DMSO as a solvent. The pH measurements were carried out using a JENCO 6173 pH meter. The mass spectrum of the AD was recorded using a Q 1000 EX LC-MS Shimadzu (Japan).Preparation of SPIONs
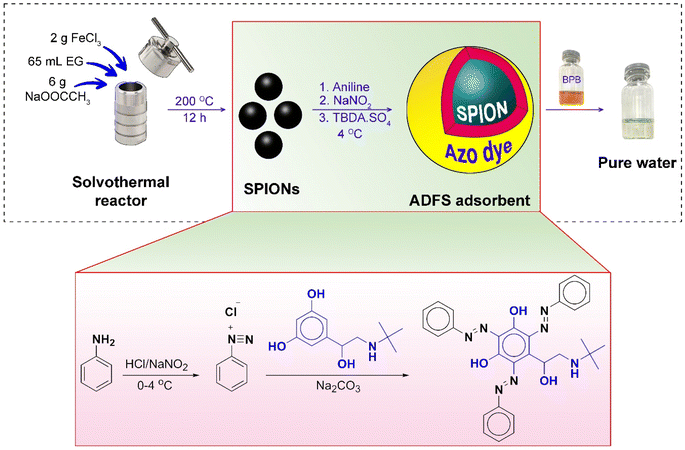
The SPIONs were prepared via a solvothermal method, described elsewhere, using ethylene glycol as a solvent.11,12 In a typical synthesis, FeCl3·6H2O (2 g) and anhydrous sodium acetate (6 g) were dissolved in ethylene glycol (65 mL) under stirring. A homogeneous yellow solution was obtained. It was then transferred to a Teflon-lined stainless-steel solvothermal reactor and incubated at 200 °C in the oven (Heraeus, Thermo Electron Corporation, Germany) for 12 h. Thereafter, the solvothermal reactor was allowed to cool down to room temperature. The black magnetite nanoparticles were washed several times with distilled water and ethanol to remove the unreacted reagents, and then dried in a vacuum oven at 30 °C overnight.Preparation of ADFS
The ADFS was synthesized via a diazo coupling reaction according to the procedure described elsewhere with minor modifications (Fig. 1).13 First, 2.0 mL of aniline (22 mmol), 15 mL of double distilled water, and 5.0 mL of concentrated HCl were added to 1.0 g of SPIONs at 4 °C. After stirring for 20 min, a solution of sodium nitrite (2.0 g, 29 mmol) was dropped onto the above mixture at 4 °C with constant stirring. Then the resulting acidic solution was treated with 0.5 M sodium carbonate solution (50 mL) to neutralize the acidity of the mixture, followed by the dropwise addition of a solution of TBDA sulphate (1.0 g, 3.0 mmol) in 5.0 mL of double-distilled water with constant stirring. Finally, the mixture was stirred for 12 h at ambient temperature. The obtained reddish-brown precipitate (ADFS) was collected from the solution by using a powerful permanent magnet, washed several times with distilled water, and then air dried overnight at room temperature.Adsorption experiments
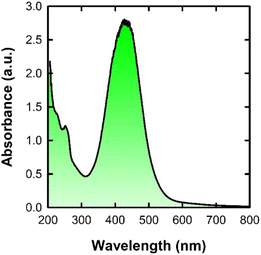
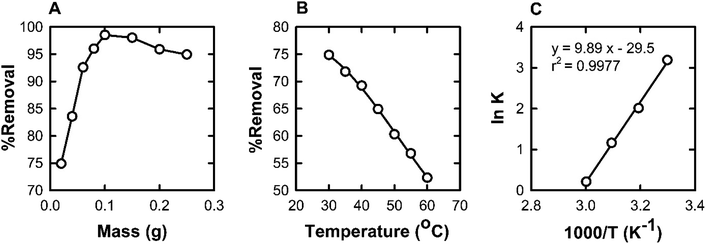
Batch adsorption experiments are usually used to treat small volumes of the adsorbate in the laboratory. During batch experiments, different parameters such as pH, contact time, initial BPB concentration, adsorbent dose, and temperature were investigated.14 All experiments were conducted by mixing 20 mg of ADFS and 10 mL of BPB solution in tightly sealed 50 mL Erlenmeyer flasks at 400 rpm in a temperature-controlled shaker (Clifton, UK). The solution pH (pH 2–9) was adjusted using buffer solutions. After reaching equilibrium, the adsorbent was separated with a strong magnet. The remaining supernatant was filtered, and the uptake of BPB was assessed at 436 nm.The effect of contact time on the adsorption of BPB on ADFS was investigated over time intervals from 10 min to 240 min at pH 2.0, an initial BPB concentration of 20 mg L−1, an adsorbent dose of 20 mg, and room temperature (303 K). Moreover, the influence of the initial BPB concentration on the adsorption capacities of ADFS was studied using a BPB concentration range of 10–100 mg L−1, pH 2.0, an incubation period of 120 min at room temperature (303 K), and 20 mg of ADFS. Furthermore, to determine the effect of the adsorbent dose on the adsorption of BPB from aqueous solutions, adsorption experiments were carried out by varying the amount of ADFS from 20 to 250 mg while keeping the remaining parameters unchanged. Finally, the effect of temperature on the removal efficiency of ADFS was studied over the temperature range of 303–333 K, using an adsorbent dose of 20 mg, a pH of 2.0, and a contact time of 120 min.
The percent removal (%R) and equilibrium adsorption capacity (qe) of BPB were calculated using eqn (1) and (2):
 | (1) |
 | (2) |
Adsorption kinetics
Pseudo-first-order (PFO, eqn (3)), pseudo-second-order (PSO, eqn (4)), and intra-particle diffusion (IPD, eqn (5)) kinetic models were used to study the adsorbate–adsorbent interactions.15–17
log(qe − qt) = log![[thin space (1/6-em)]](https://www.rsc.org/images/entities/char_2009.gif) qe − (k1/2.303)t qe − (k1/2.303)t
| (3) |
 | (4) |
| qt = kidt1/2 + I | (5) |
Adsorption isotherms
 | (6) |
| qe = KFC1/n | (7) |
 | (8) |
 | (9) |
 is a constant related to the heat of adsorption and indicates the adsorption potential of the adsorbent (J mol−1); bT is the Temkin isotherm constant; and AT (L g−1) is the Temkin equilibrium binding constant.20,21
Hill's equation (eqn (11)) describes the binding of various species onto a homogeneous adsorbent. This model assumes that adsorption is a cooperative process in which adsorbates at one site of the adsorbent influence the other binding sites.25,26
 | (10) |
 | (11) |
Adsorption thermodynamics
The equilibrium constant (K) was determined from eqn (8) in thermodynamic experiments. The thermodynamic parameters (entropy (ΔS) and enthalpy (ΔH) changes) were calculated from the slope and the intercept of the plot of ln![[thin space (1/6-em)]](https://www.rsc.org/images/entities/char_2009.gif) K versus 1/T using the van't Hoff equation (eqn (12)), and Gibb's free energy change (ΔG) was calculated from eqn (13) at different temperatures.27,28
K versus 1/T using the van't Hoff equation (eqn (12)), and Gibb's free energy change (ΔG) was calculated from eqn (13) at different temperatures.27,28
 | (12) |
| ΔG = ΔH − TΔS | (13) |
Results and discussion
Characterization of ADFS
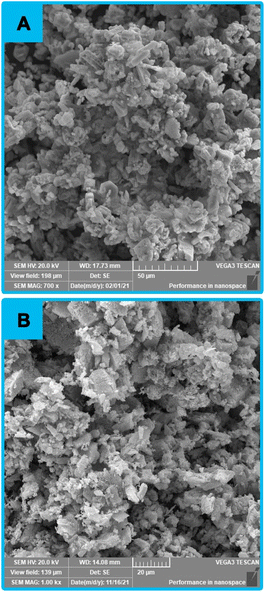
The synthesized ADFS was characterized by Fourier transform infrared spectroscopy (FTIR), vibrating sample magnetometry (VSM), dynamic light scattering (DLS), X-ray diffractometry (XRD), scanning electron microscopy (SEM), 1H-NMR spectroscopy, thermal analysis, and mass spectrometry.The FTIR spectrum of the synthesized AD is shown in Fig. 2A. The absorption bands observed at 3207 and 3065 cm−1 are assigned to the stretching vibrations of the N–H or O–H bonds. The absorption bands detected at 2980 and 2800 cm−1 correspond to the C–H stretching vibrations.29,30 The bending of N–H was detected at 1593 cm−1. Moreover, the absorption bands at 1477 and 1456 cm−1 are attributed to the bending of –C–H– bond. The absorption band at 1408 cm−1 is assigned to the stretching vibrations of N![[double bond, length as m-dash]](https://www.rsc.org/images/entities/char_e001.gif) N [169], [170]. In addition, the absorption bands appearing at 1297, 1207, 1122, and 1075 cm−1 stand for the C–N the stretching vibrations. Finally, the bands found in the region 650–1000 cm−1 correspond to –C
N [169], [170]. In addition, the absorption bands appearing at 1297, 1207, 1122, and 1075 cm−1 stand for the C–N the stretching vibrations. Finally, the bands found in the region 650–1000 cm−1 correspond to –C![[double bond, length as m-dash]](https://www.rsc.org/images/entities/char_e001.gif) C– bending.33–35
C– bending.33–35
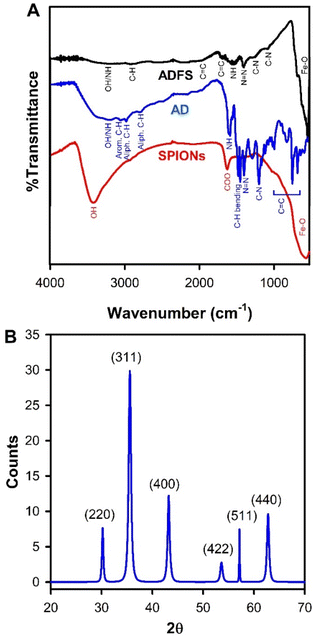 | ||
| Fig. 2 (A) FTIR spectra of SPIONs, AD, and ADFS over the spectral range 4000–400 cm−1. (B) XRD diffractogram of SPIONs depicting the X-ray diffraction planes. | ||
The FTIR spectrum of the synthesized ADFS (Fig. 2A) demonstrates a wide absorption band at 3155 cm−1 corresponding to the stretching vibrations of N–H and/or O–H, implying the existence of amino and hydroxyl groups that are able to form hydrogen bonds with the dissolved BPB ions. The band at 2908 cm−1 can be assigned to the C–H stretching vibration. Moreover, the absorption bands observed at 1965 and 1703 cm−1 may correspond to the stretching vibration of C![[double bond, length as m-dash]](https://www.rsc.org/images/entities/char_e001.gif) C. In addition, the absorption bands appearing at 1567 and 1408 cm−1 stand for N–H bond bending and the asymmetric vibration of –N
C. In addition, the absorption bands appearing at 1567 and 1408 cm−1 stand for N–H bond bending and the asymmetric vibration of –N![[double bond, length as m-dash]](https://www.rsc.org/images/entities/char_e001.gif) N–, respectively, thus confirming the formation of ADFS via the diazo coupling reaction. Furthermore, the stretching vibration of C–N was detected at 1274 and 1084 cm−1. The sharp band at 560 cm−1 is attributed to the Fe–O stretching.13,29–32,36
N–, respectively, thus confirming the formation of ADFS via the diazo coupling reaction. Furthermore, the stretching vibration of C–N was detected at 1274 and 1084 cm−1. The sharp band at 560 cm−1 is attributed to the Fe–O stretching.13,29–32,36
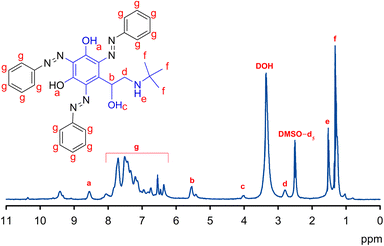 | ||
| Fig. 3 1H-NMR spectrum of the synthesized AD using deuterated DMSO as a solvent and tetramethylsilane as an internal standard. The original NMR chart is depicted in Fig. S1 in the ESI.† | ||
| Proton symbol (number) | Assignment | δ/ppm |
|---|---|---|
| a (2H) | Phenolic OH | 8.5 (s) |
| b (1H) | CH | 5.5 (t) |
| c (1H) | Aliphatic OH | 4.0 (d) |
| d (2H) | CH2 | 2.8 (d) |
| e (1H) | NH | 1.5 (t) |
| f (9H) | CH3 | 1.2 (s) |
| g (15H) | Aromatic CH | 6.3–8.0 (m) |
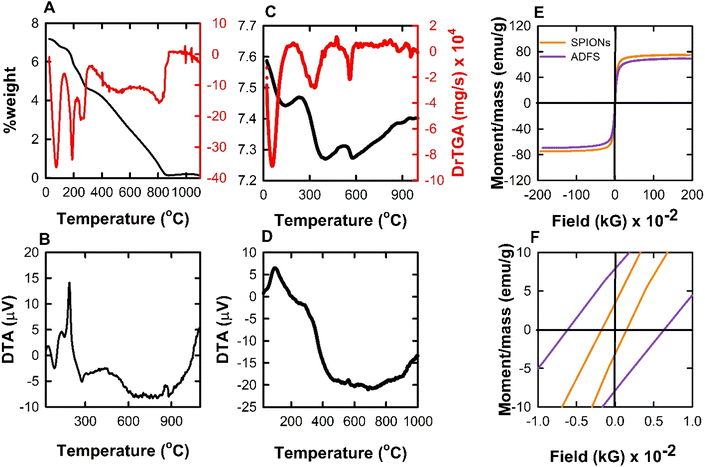 | ||
| Fig. 5 (A and B) TGA and DTA thermograms of AD. (C and D) TGA and DTA thermograms of ADFS. (E and F) VSM plots of SPIONs and ADFS. | ||
The DTA curve of the AD (Fig. 5B) demonstrates endothermic and exothermic peaks during the thermal decomposition. The first endothermic peak can be observed at 84.74 °C and may be attributed to the loss of water molecules. The second exothermic peak was found at 188.60 °C and might be assigned to the oxidative decomposition of the AD. On the other hand, the DTA thermogram of the ADFS (Fig. 5D) shows one exothermic peak at 561 °C and one endothermic peak at 685.96 °C during the ADFS thermal decomposition. Thermal decomposition of TBDA may produce toxic gases such as carbon monoxide, carbon dioxide, and nitrogen oxides. The reaction that forms carbon monoxide or carbon dioxide is exothermic, which may account for the presence of the exothermic peak at 561 °C. However, the endothermic peak at 685.96 °C may be attributed to bond cleavage during the thermal decomposition of the organic residues.46
Zeta potential measurements can be used as a measure of the stability of nanoparticles. The obtained negative ZP of the SPIONs (−23.4 mV) can be attributed to the presence of ionisable hydroxyl groups and carboxylate groups (mentioned above in the FTIR results). Upon coating the SPIONs with the AD, the negative ZP moved towards a more positive value (−14.2 mV) due to the cationic nature of the AD. These results confirm the successful formation of the magnetic ADFS adsorbent.50,51
It is obvious that coating SPIONs with AD resulted in a 4-folds increase in the average particle size in DLS measurement. This observation can be explained as follows. Coating of the SPIONs with an organic molecule may have led to a decrease in their inherent negative charge due to the presence of multiple organic functional groups as indicated by the more positive zeta potential values. Accordingly, the repulsion forces between the magnetite nanoparticles was decreased leading to easier agglomeration of the particles, thus giving a larger particle size in DLS measurements.
Adsorption of BPB by ADFS
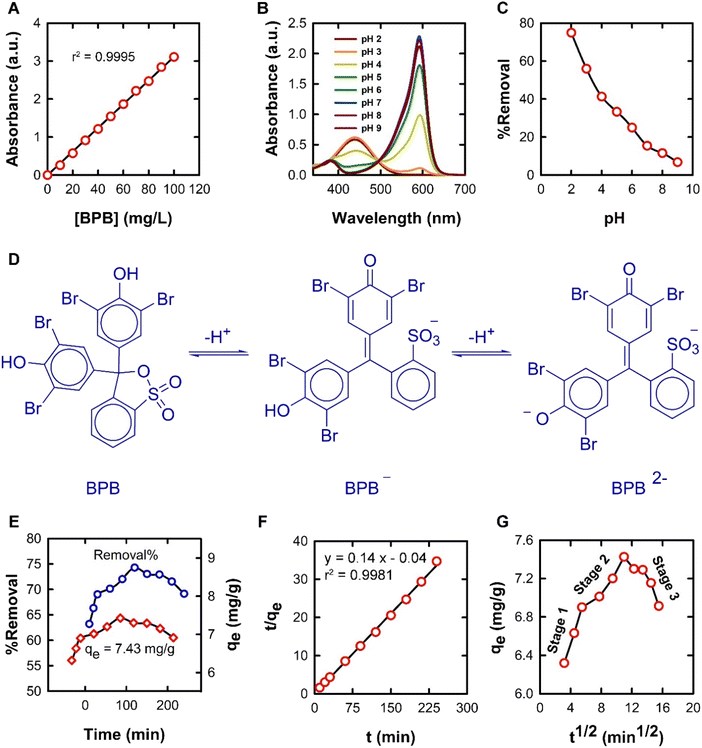 | ||
| Fig. 7 (A) Standard plot for the spectrophotometric determination of BPB concentrations from 10 to 100 mg L−1 at 436 nm; (B) UV-vis absorption spectra of aqueous BPB solutions of different pH values showing the isosbestic point; (C) effect of changes in pH on the removal of BPB by the proposed ADFS adsorbent; (D) equilibrium protonation/deprotonation reactions of BPB in aqueous media; (E) effect of changing contact time on the removal of BPB; (F) PSO kinetic model; and (G) the IPD model for the adsorption of BPB onto the ADFS. The raw data of the IPD model is summarised in Table S1 in the ESI.† | ||
It was observed that the maximum adsorption efficiency of BPB was found to be 74.91% at a pH of 2. The adsorption capacity and the removal percentage gradually decreased with increasing the pH of the solution, and the lowest BPB adsorption (6.76%) was recorded at pH 9. Therefore, the adsorption of BPB by the ADFS was favoured by lowering the pH; this can be attributed to the strong ionization of BPB (pKa = 4.3).55 At a solution pH < pKa, neutral BPB molecules are present because of the protonation of the hydroxyl groups, leading to a corresponding increase in the electrostatic attraction between oxygen lone pairs of BPB and the positively charged ADFS surface due to the presence of protonated amino groups. In these conditions, the adsorption of BPB by ADFS is governed by non-covalent interactions such as hydrogen bonding and van der Waals forces. These findings coincide with the results of FTIR spectroscopy and the thermodynamic studies below. The adsorption efficiency was reduced at pH > pKa due to the ionization of the BPB molecules, which hinders the adsorption process through electrostatic repulsion between the anionic form of BPB and the neutral surface of the ADFS (i.e., due to the deprotonation of the ADFS amino groups). Consequently, the subsequent adsorption experiments were carried out at pH 2. Similar results were reported in the literature.56
The PFO kinetic model assumes that the rate of adsorbate uptake by the adsorbent is directly proportional to the difference in adsorbate concentration and the equilibrium saturation concentration of the adsorbate on the adsorbent.58 The values of the equilibrium adsorption capacity, qe, and the PFO constant, k1, were determined from the slope and the intercept of a linear relation between log(qe − qt) and t. It was found that the adsorption of BPB onto the ADFS does not follow PFO kinetics because the calculated qe value (0.08 mg g−1) does not match the experimental value (7.43 mg g−1) and due to the low correlation coefficient value (r2 = 0.3356).
The PSO kinetic model has become the most popular model used to describe adsorption kinetics. The PSO model is based on the assumption that the adsorption rate depends on the number of available active sites on the ADFS surface and that chemisorption may be the rate-determining step. The second-order rate constant, k2, and the equilibrium adsorption capacity, qe, values could be calculated from the slope and the intercept of a plot between t/qe against t, respectively (Fig. 7F). The high correlation coefficient (r2 = 0.9981) and the close agreement between the calculated (7.12 mg g−1) and experimental (7.43 mg g−1) qe values suggest that the adsorption of BPB onto the ADFS obeys the PSO kinetic model.59,60
The IPD kinetic model demonstrated three stages (Fig. 7G). The first stage (stage I) is due to exterior-surface adsorption or instantaneous adsorption, where the adsorption capacity increases rapidly due to the availability of more vacant active sites on the ADFS surface. The second stage (stage II) is attributed to gradual adsorption onto the interior surface of the ADFS. However, in the third stage (stage III), the adsorption reached equilibrium and then decreased due to the saturation of the binding active sites of the ADFS by the BPB molecules. Plotting qe versus t½ gives a linear relationship from which the IPD rate constant (kid) and the constant I can be calculated from the slope and the intercept, respectively. The IPD rate constants (kid) for stages I, II, and III are 0.25, 0.09, and −0.1 mg g−1 min−1/2, respectively. It can be noticed that the adsorption rate constants are in the following order: stage I (kid,1) > stage II (kid,2) > stage III (kid,3), thus confirming the above interpretation of the three stages of the IPD kinetic model. The deviation of the plot from the origin shows that IPD is not the only rate-limiting step. The I values are 5.52, 6.34, and 8.58 mg g−1 for stages I, II, and III, respectively, therefore indicating a large boundary layer effect.61,62
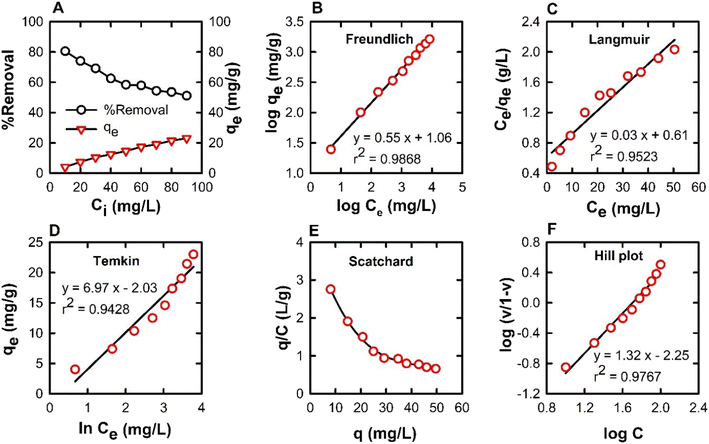
The adsorption isotherms were used to describe the relationship between the adsorption capacity of BPB (qe) and the remaining concentration of BPB at equilibrium (Ce). The adsorption data obtained from the variation of BPB concentration was analysed using the Langmuir, Freundlich, and Temkin isotherms in order to investigate the adsorption behaviour of BPB onto the ADFS surface.65 In the present study, the r2 values were 0.9968, 0.9524, and 0.9428 for the Freundlich, Langmuir, and Temkin isotherms, respectively. Therefore, the adsorption of BPB molecules onto the ADFS follows the Freundlich isotherm model, which demonstrated the highest r2 value (Fig. 8B). This result implies that the adsorption of BPB by the ADFS is a heterogeneous multilayer adsorption.
The Freundlich constant (n) can help in investigating the mechanism of the adsorption process and indicate whether it is a difficult/unfavourable chemisorption process (where n < 1), a linear process (where n = 1) or a favourable physisorption process (where n > 1). The Freundlich constants n and KF values were found to be 1.82 and 11.50, respectively, indicating that the adsorption of BPB by the ADFS surface is favourable and occurs through a physisorption mechanism. Basically, physisorption processes take place due to weak intermolecular forces such as van der Waals forces between the adsorbate molecules (i.e., BPB) and the adsorbent (i.e., ADFS) surface.11,66,67
From the Langmuir plot (Fig. 8C), the calculated values of qmax and b were found to be 32.57 mg g−1 and 0.05, respectively. The essential characteristics of the Langmuir isotherm model can be expressed in terms of the separation factor (RL), which can be explained by eqn (14). The value of RL describes the mechanism of the adsorption process, which might be unfavourable (RL > 1), linear (RL = 1), favourable (0 < RL < 1), or irreversible (RL = 0). Herein, the obtained RL value is 0.05, thus confirming that the adsorption of BPB onto the ADFS surface is favourable.68
 | (14) |
The Temkin isotherm model is based on the assumption that the heat of adsorption of all molecules in the layer decreases linearly with the increase in the adsorbent surface coverage. The Temkin constants, bT and AT, are derived from the slope and the intercept of a graph of ln![[thin space (1/6-em)]](https://www.rsc.org/images/entities/char_2009.gif) Ce against qe, respectively (Fig. 8D). The value of bT can be used for the prediction of the type of adsorption; bT values < 8 × 10⁴ are usually ascribed to physisorption processes. The values of B = RT/bT and bT are 6.07 (lower than 8 kJ mol−1) and 408.27, respectively, meaning that the adsorption of BPB onto the ADFS is governed by a physisorption process where a weak interaction occurs between the adsorbate molecules and the adsorbent surface.69,70
Ce against qe, respectively (Fig. 8D). The value of bT can be used for the prediction of the type of adsorption; bT values < 8 × 10⁴ are usually ascribed to physisorption processes. The values of B = RT/bT and bT are 6.07 (lower than 8 kJ mol−1) and 408.27, respectively, meaning that the adsorption of BPB onto the ADFS is governed by a physisorption process where a weak interaction occurs between the adsorbate molecules and the adsorbent surface.69,70
The specific binding data was analysed using the Scatchard and Hill plots to estimate the binding parameters such as the affinity/association constant (K), the maximum number of binding sites (Bmax), the cooperativity index (h), and to understand the interaction of the adsorbent with the adsorbate.
According to calculations carried out in Scatchard analysis, the Bmax and K values are 58.62 and 0.04 g L−1, respectively. In the Scatchard plot analysis (Fig. 8E), the concave upward curve is indicative of the presence of multiple binding sites or nonspecific binding sites on the ADFS surface.71,72 Moreover, the non-linear Scatchard plot can be approximately divided into two linear segments corresponding to low and high concentration intervals of BPB. The large value of K in the low concentration interval can be attributed to the presence of a large number of vacant BPB-binding sites on the ADFS surface, which leads to a high adsorption efficiency. However, at high concentrations of BPB, the adsorption efficiency decreases with increasing the concentration, which may be attributed to the saturation of the adsorption sites with the BPB molecules, as indicated by the low K value. According to the calculations of Scatchard plot, in the low concentration interval of Scatchard plots (10–50 mg L−1), the Bmax and K values were found to be 38.77 and 0.08 g L−1, respectively. However, in the high concentration interval (60–100 mg L−1), the Bmax and K values were found to be 90.94 and 0.01 g L−1, respectively.
The calculated Hill coefficient (a.k.a. the cooperativity index) (h) from the plot in Fig. 8F is 1.32 (i.e., greater than 1) indicating the presence of at least two different types of binding sites on the ADFS with positive cooperativity. The findings mentioned above about Scatchard analysis, which demonstrated a concave-upward curve, agree with the results obtained from the Hill plot, and both of them indicate the presence of multiple classes of binding sites.73,74
| ΔH (kJ mol−1) | ΔS (kJ mol−1 K−1) | ΔG (kJ mol−1) | |||
|---|---|---|---|---|---|
| 303 K | 313 K | 323 K | 333 K | ||
| −82.19 | −0.24 | −8.03 | −5.24 | −3.12 | −0.58 |
Generally, ΔG values for chemisorption processes range from −400 to −80 kJ mol−1, while those of physisorption processes are between −20 and 0 kJ mol−1. The calculated ΔG was found to be between −0.59 and −8.03 kJ mol−1, which indicates that the adsorption of BPB is a spontaneous physisorption process. These results coincide with the results discussed in Section 3.2.3.79,80
The most common four types of noncovalent interactions are van der Waals forces, electrostatic interactions, hydrogen bonding, and hydrophobic effects. The hydrophobic interaction can be either an entropy-driven process (ΔS > 0, ΔH > 0 and |ΔH| < |TΔS|) or an enthalpy-driven process such as van der Waals interactions and hydrogen bonding (ΔS < 0, ΔH < 0 and |ΔH| > |TΔS|). However, electrostatic interactions are characterized by a positive ΔS value and a minor value of ΔH (ΔS > 0, ΔH ∼ 0 or ΔH > 0).81,82 The negative values of ΔH and ΔS (Table 2) imply that the adsorption of BPB on the proposed ADFS adsorbent is an exothermic process and takes place via van der Waals interactions and/or hydrogen bonding between the adsorbent and the adsorbate molecules.83 Table 3 summarises the obtained adsorption parameters in the present study along with some of the parameters reported in the literature.
| Adsorbent | qmax (mg g−1) | Kinetics | Isotherms | References |
|---|---|---|---|---|
| ADFS | 7.43 | PSO | Freundlich | This work |
| Polyacrylonitrile (PAN) nanofiber | 0.89 | PSO | Freundlich | 84 |
| ZnO NPs | 3.10 | PSO | Freundlich | 85 |
| Musa acuminata peel | 6.04 | PFO | Freundlich | 86 |
| Labeo bata fish scale | 7.39 | PSO/IPD | Freundlich | 87 |
| AgNP impregnation of pristine Solanum tuberosum peel | 9.60 | PFO/IPD | Freundlich | 88 |
| Polymer-clay composite | 10.7 | PFO | Freundlich | 89 |
| Polyethyleneimine-coated SPIONs | 11.3 | PSO | Freundlich | 90 |
| CuO NPs | 20.2 | PFO | Langmuir | 91 |
| α-Chitin nanoparticles | 22.7 | PSO | Langmuir | 7 |
| Graphene oxide nanoparticles | 28.6 | — | Langmuir | 92 |
| Fe3O4–CuO-AC composite | 88.6 | PSO | — | 93 |
| Co, Mn, and Fe-modified graphene oxide | 94.3 | PSO | Langmuir | 94 |
Conclusions
In the current study, a novel magnetic adsorbent with an azo dye functionalization has been prepared to remove the anionic dye bromophenol blue from contaminated water. The proposed adsorbent is synthesized from biocompatible superparamagnetic iron oxide nanoparticles, which are the end product of a diazo-coupling reaction between aniline and a common substance used in pharmaceutical industries (TBDA). The proposed adsorbent may be easily separated from water by applying a strong external magnetic field. Hence, BPB and other anionic contaminants might be removed successfully from water using the proposed adsorbent nanomaterial. The recommended ADFS's synthesis protocol is simple, repeatable, scalable, and quick. A continuation of this work is required to investigate other new azo dyes so as to come up with novel magnetic adsorbents with better adsorption capacities and broader applications.Author contributions
Hadeel Saad: methodology, investigation, formal analysis, visualization, data curation, resources, writing – original draft. F. A. Nour El-Dien: supervision, project administration, resources, writing – review and editing. Nadia E. A. El-Gamel: supervision, writing – review and editing. Ahmed S. Abo Dena: conceptualization, methodology, investigation, resources, formal analysis, data curation, visualization, writing – review and editing, supervision, project administration.Conflicts of interest
There are no conflicts to declare.Notes and references
- Y. Zhang, X. Hong, X.-M. Cao, X.-Q. Huang, B. Hu, S.-Y. Ding and H. Lin, ACS Appl. Mater. Interfaces, 2021, 13, 6359–6366 CrossRef CAS PubMed.
- A. E. Segneanu, C. Orbeci, C. Lazau, P. Sfirloaga, P. Vlazan, C. Bandas and I. Grozescu, in Water Treatment, ed. W. Elshorbagy and R. K. Chowdhury, IntechOpen, Rijeka, 2013, ch. 4, pp. 53–80 Search PubMed.
- T. Shah, T. Gul and K. Saeed, Appl. Water Sci., 2019, 9, 105 CrossRef.
- A. Azanaw, B. Birlie, B. Teshome and M. Jemberie, Case Stud. Chem. Environ. Eng., 2022, 6, 100230 CrossRef CAS.
- P. R. de Souza, T. M. do Carmo Ribeiro, A. P. Lôbo, M. S. Tokumoto, R. M. de Jesus and I. P. Lôbo, Environ. Monit. Assess., 2020, 192, 197 CrossRef PubMed.
- M. Essandoh and R. A. Garcia, Chemosphere, 2018, 206, 502–512 CrossRef CAS PubMed.
- S. Dhananasekaran, R. Palanivel and S. Pappu, J. Adv. Res., 2016, 7, 113–124 CrossRef CAS PubMed.
- Z. Chen, X. Song, W. W. M. Soh, Y. Wen, J. Zhu, M. Zhang and J. Li, Gels, 2021, 7(4), 1–13 Search PubMed.
- P. Chauhan, K. K. Bhasin and S. Chaudhary, Environ. Sci. Pollut. Res. Int., 2021, 28, 61344–61359 CrossRef CAS PubMed.
- A. S. Shair, A. S. Abo Dena and I. M. El-Sherbiny, Spectrochim. Acta, Part A, 2021, 249, 119301 CrossRef CAS PubMed.
- H. Saad, F. A. Nour El-Dien, N. E. A. El-Gamel and A. S. Abo Dena, RSC Adv., 2021, 11, 39768–39780 RSC.
- S. S. Laha, N. D. Thorat, G. Singh, C. I. Sathish, J. Yi, A. Dixit and A. Vinu, Small, 2021, 2104855 Search PubMed.
- Y. Shen, W.-X. Ni and B. Li, ACS Omega, 2021, 6, 3202–3208 CrossRef CAS PubMed.
- S. Moosavi, C. W. Lai, S. Gan, G. Zamiri, O. Akbarzadeh Pivehzhani and M. R. Johan, ACS Omega, 2020, 5, 20684–20697 CrossRef CAS PubMed.
- A. Muthu Kumara Pandian, M. Rajasimman, N. Rajamohan, S. Varjani and C. Karthikeyan, J. Hazard. Mater., 2021, 416, 125717 CrossRef CAS PubMed.
- G. Shah, M. Imran, U. Aiman, M. Iqbal, M. Akram, H. M. R. Javeed, A. Waqar and F. Rabbani, PeerJ Phys. Chem., 2022, 4, e21 CrossRef.
- M. Pourshaban, E. Moniri, R. Safaeijavan and H. A. Panahi, Korean Chem. Eng. Res., 2021, 59, 493–502 CAS.
- R. Prasad, D. Sharma, K. Yadav and H. Ibrahim, Can. J. Chem. Eng., 2021, 100, 439–450 CrossRef.
- S. A. Al-Trawneh, A. G. Jiries, S. F. Alshahateet and S. Sagadevan, Chem. Phys. Lett., 2021, 781, 138959 CrossRef CAS.
- N. Ayawei, A. N. Ebelegi and D. Wankasi, J. Chem., 2017, 2017, 3039817 Search PubMed.
- M. Erhayem, F. Al-Tohami, R. Gaith and K. Ahmida, Am. J. Anal. Chem., 2015, 06, 1–10 CrossRef CAS.
- R. Brion-Roby, J. Gagnon, J.-S. Deschênes and B. Chabot, Pure Appl. Chem., 2018, 90, 63–77 CrossRef CAS.
- Y. Cui, L. Jiang, H. Li, D. Meng, Y. Chen, L. Ding and Y. Xu, J. Ind. Eng. Chem., 2021, 96, 382–389 CrossRef CAS.
- M. Mabrouk, S. F. Hammad, A. A. Abdella and F. R. Mansour, Int. J. Biol. Macromol., 2022, 200, 327–334 CrossRef CAS PubMed.
- H. Ramezanipour Penchah, P. Najafi, A. Ghaemi and H. Ghanadzadeh Gilani, Environ. Prog. Sustainable Energy, 2021, 40, e13586 CrossRef CAS.
- C. Rodwihok, M. Suwannakeaw, K. Charoensri, D. Wongratanaphisan, S. Woon Woo and H. S. Kim, Bioresour. Technol., 2021, 331, 125060 CrossRef CAS PubMed.
- K. Kayalvizhi, N. M. I. Alhaji, D. Saravanakkumar, S. B. Mohamed, K. Kaviyarasu, A. Ayeshamariam, A. M. Al-Mohaimeed, M. R. AbdelGawwad and M. S. Elshikh, Environ. Res., 2022, 203, 111814 CrossRef CAS PubMed.
- I. Raya, G. Widjaja, Z. H. Mahmood, A. J. Kadhim, K. O. Vladimirovich, Y. F. Mustafa, M. M. Kadhim, T. Mahmudiono, I. Husein and L. Kafi-Ahmadi, Appl. Phys. A, 2022, 128, 167 CrossRef CAS.
- Y. Wang, Z. Xie, X. Wang, X. Peng and J. Zheng, J. Nanobiotechnol., 2021, 19, 260 CrossRef CAS PubMed.
- Q. A. Alsulami, H. S. Alorfi and S. M. A. S. Keshk, Polym.-Plast. Technol. Mater., 2022, 1–9 Search PubMed.
- W. Wen-Qiong, Z. Jie-Long, Y. Qian, Z. Ji-Yang, L. Mao-Lin, G. Rui-Xia and H. Yujun, RSC Adv., 2021, 11, 26291–26302 RSC.
- D. Liu, J. Yuan, J. Li and G. Zhang, ACS Omega, 2019, 4, 12680–12686 CrossRef CAS PubMed.
- S. M. El-Megharbel, R. Z. Hamza, A. A. Gobouri and M. S. Refat, Appl. Organomet. Chem., 2019, 33, e4892 CrossRef.
- R. Samantha and D. Almalik, Bull. Chem. Soc. Ethiop., 2021, 35, 601–614 Search PubMed.
- R. Roy and S. Prasad, IOP Conf. Ser.: Mater. Sci. Eng., 2021, 1120, 012028 CAS.
- S. M. El-Megharbel, R. Z. Hamza, A. A. Gobouri and M. S. Refat, Appl. Organomet. Chem., 2019, 33, 1–15 CrossRef.
- Y. Pu, Y. Niu, Y. Wang, S. Liu and B. Zhang, Particuology, 2022, 61, 11–17 CrossRef CAS.
- M. Khalkhali, K. Rostamizadeh, S. S. Sadighian, F. Khoeini, M. Naghibi and M. Hamidi, Daru J. Pharm. Sci., 2015, 23(45), 1–12 Search PubMed.
- S. Mandal and V. Gonela, Dalton Trans., 2016, 45, 7421–7426 RSC.
- R. K. Harris, P. Hodgkinson, V. Zorin, J.-N. Dumez, B. Elena-Herrmann, L. Emsley, E. Salager and R. S. Stein, Magn. Reson. Chem., 2010, 48, S103–S112 CrossRef CAS PubMed.
- E. Varga, G. Benkovics, A. Darcsi, B. Várnai, T. Sohajda, M. Malanga and S. Béni, Electrophoresis, 2019, 40, 2789–2798 CrossRef CAS PubMed.
- M. S. Refat and M. El-Megharbel Samy, Spectrosc. Spectral Anal., 2021, 41, 3316–3320 Search PubMed.
- A. S. Abo Dena and S. A. Abdel Gaber, Spectrochim. Acta, Part A, 2017, 181, 239–248 CrossRef CAS PubMed.
- R. K. Karthick, J. Kavitha and K. S. Lakshmi, Res. J. Pharm. Technol., 2020, 13, 767–773 CrossRef.
- S. Gul, A. U. H. A. Shah and S. Bilal, J. Phys.: Conf. Ser., 2013, 439, 1–10 CrossRef.
- R. García-Muelas, Q. Li and N. López, ACS Catal., 2015, 5, 1027–1036 CrossRef.
- A. V. Samrot, H. H. Ali, J. A. Selvarani, E. Faradjeva, P. Raji, P. Prakash and S. S. Kumar, Curr. Res. Green Sustainable Chem., 2021, 4, 100066 CrossRef CAS.
- A. Farhana, A. Jenifer Selvarani, A. V Samrot, A. Alsrhani, P. Raji, C. S. Sahithya, P. J. Jane Cypriyana, P. Senthilkumar, M. P. Ling and S. Yishak, J. Nanomater., 2022, 2022, 4326939 Search PubMed.
- J. Shah, M. Ranjan, P. Thareja and P. Estellé, J. Therm. Anal. Calorim., 2022, 147, 10319–10328 CrossRef CAS.
- W. M. Ng and J. K. Lim, Colloid Interface Sci. Commun., 2022, 46, 100582 CrossRef CAS.
- S. Mohapatra, M. Asfer, M. Anwar, K. Sharma, M. Akhter, F. J. Ahmad and A. A. Siddiqui, Heliyon, 2019, 5, e01955 CrossRef PubMed.
- S. Banerjee and M. C. Chattopadhyaya, Arabian J. Chem., 2017, 10, S1629–S1638 CrossRef CAS.
- L. Anah and N. Astrini, IOP Conf. Ser.: Earth Environ. Sci., 2017, 60, 12010 Search PubMed.
- D. Goncalves, Open Chem., 2016, 14, 404–411 Search PubMed.
- A. Shokrollahi and E. Zare, J. Mol. Liq., 2016, 219, 1165–1171 CrossRef CAS.
- E. Rápó, R. Szép, Á. Keresztesi, M. Suciu and S. Tonk, Acta Chim. Slov., 2018, 65, 709–717 CrossRef.
- D. Kurniawati, B. Bahrizal, T. K. Sari, F. Adella and S. Sy, J. Phys.: Conf. Ser., 2021, 1788, 012008 CrossRef CAS.
- E. Nyankson, J. Adjasoo, J. K. Efavi, A. Yaya, G. Manu, A. Kingsford and R. Y. Abrokwah, Sci. Afr., 2020, 7, e00257 Search PubMed.
- G. William Kajjumba, S. Emik, A. Öngen, H. Kurtulus Özcan and S. Aydın, Adv. Sorption Process Appl., 2019, 1–19 Search PubMed.
- S. Ebrahimpoor, V. Kiarostami, M. Khosravi, M. Davallo and A. Ghaedi, Fibers Polym., 2021, 22, 159–170 CrossRef CAS.
- C. Xiong, S. Wang, L. Zhang, Y. Li, Y. Zhou and J. Peng, Polymers, 2018, 10(2), 159–174 CrossRef PubMed.
- S. D. Mekkey, Curr. Sci. Int., 2017, 6, 58–74 Search PubMed.
- S. Shamim, in Biosorption, ed. J. Derco and B. Vrana, IntechOpen, Rijeka, 2018 Search PubMed.
- R. Beksissa, B. Tekola, T. Ayala and B. Dame, Environ. Challenges, 2021, 4, 100091 CrossRef CAS.
- I.-H. T. Kuete, D. R. T. Tchuifon, G. N. Ndifor-Angwafor, A. T. Kamdem and S. G. Anagho, J. Encapsulation Adsorpt. Sci., 2020, 10, 1–27 CrossRef CAS.
- A. Bouzidi, M. Djedid, C. Ad, M. Benalia, B. Hafez and H. Elmsellem, Moroccan J. Chem., 2021, 9, 156–167 CAS.
- T. Tatarchuk, A. Shyichuk, Z. Sojka, J. Gryboś, M. Naushad, V. Kotsyubynsky, M. Kowalska, S. Kwiatkowska-Marks and N. Danyliuk, J. Mol. Liq., 2021, 15, 115375 CrossRef.
- H. S. Y. Akrawi, M. A. Al-Obaidi and C. H. Abdulrahman, IOP Conf. Ser.: Earth Environ. Sci., 2021, 761, 012017 Search PubMed.
- R. Ragadhita and A. B. D. Nandiyanto, J. Eng. Sci. Technol., 2022, 17, 1078–1089 Search PubMed.
- T. Z. E. Lee, J. Zhang, Y. Feng, X. Lin and J. Zhou, IOP Conf. Ser.: Earth Environ. Sci., 2021, 657, 12026 Search PubMed.
- V. Casadó-Anguera and V. Casadó, Expert Opin. Drug Discovery, 2022, 1–27 Search PubMed.
- N. T. Abdel, H. Abdulla, M. S. Rizk and A. S. Abo, Sens. Actuators, B, 2019, 283, 6–17 CrossRef.
- J. L. Alesio, A. Slitt and G. D. Bothun, Chemosphere, 2022, 287, 131979 CrossRef CAS PubMed.
- T.-T. T. Nguyen, S. Ramachandran, M. J. Hill and R. A. Cerione, J. Biol. Chem., 2022, 298(2), 101564 CrossRef CAS PubMed.
- E. Vunain, D. Kenneth and T. Biswick, Appl. Water Sci., 2017, 7, 4301–4319 CrossRef CAS.
- J. Meng, X. Lin, H. Li, Y. Zhang, J. Zhou, Y. Chen, R. Shang and X. Luo, RSC Adv., 2019, 9, 8091–8103 RSC.
- N. Turki, N. Boujelben, Z. Bakari and J. Bouzid, Am. J. Environ. Sci., 2021, 17, 92–100 CrossRef CAS.
- H. M. El Refay, A. M. Raslan and A. M. E. Atia, Egypt. J. Chem., 2022, 65, 977–991 Search PubMed.
- A. K. Sakr, M. F. Cheira, M. A. Hassanin, H. I. Mira, S. A. Mohamed, M. U. Khandaker, H. Osman, E. M. Eed, M. I. Sayyed and M. Y. Hanfi, Appl. Sci., 2021, 11, 10320 CrossRef CAS.
- A. Swelam, A. Salem, A. Aanym and A. Farghly, Al-Azhar Bull. Sci., 2018, 29(1), 45–58 Search PubMed.
- T. A. Wani, A. H. Bakheit, M. A. Abounassif and S. Zargar, Front. Chem., 2018, 6(47), 1–9 Search PubMed.
- C. Wu, X. Lou, X. Xu, A. Huang, M. Zhang and L. Ma, ACS Omega, 2020, 5, 4191–4199 CrossRef CAS PubMed.
- A. N. Ebelegi, N. Ayawei and D. Wankasi, Open J. Phys. Chem., 2020, 10, 166–182 CrossRef CAS.
- M. B. Chabalala, M. Z. Al-Abri, B. B. Mamba and E. N. Nxumalo, Chem. Eng. Res. Des., 2021, 169, 19–32 CrossRef CAS.
- K. G. Akpomie, S. Ghosh, M. Gryzenhout and J. Conradie, Sci. Rep., 2021, 11, 8305 CrossRef CAS PubMed.
- K. G. Akpomie and J. Conradie, Arabian J. Chem., 2020, 13, 7115–7131 CrossRef CAS.
- A. Ghosh, H. S. Biswas, S. Debnath, P. Sasikumar, K. Biswas and U. C. Ghosh, Indian J. Chem. Technol., 2019, 26, 321–329 CAS.
- K. G. Akpomie and J. Conradie, Sci. Rep., 2020, 10, 17094 CrossRef CAS PubMed.
- A. A. El-Zahhar, N. S. Awwad and E. E. El-Katori, J. Mol. Liq., 2014, 199, 454–461 CrossRef CAS.
- A. S. Shair, A. S. A. Dena and I. M. El-Sherbiny, Spectrochim. Acta, Part A, 2021, 249, 119301 CrossRef CAS PubMed.
- M. Rashad and H. A. Al-Aoh, Desalin. Water Treat., 2019, 139, 360–368 CrossRef CAS.
- S. Zahran, S. Makharza, M. Atawneh, F. Takrori, I. Bsileh, S. Hampel and B. Büchner, Adv. Mater. Process. Technol., 2022, 8, 4280–4296 Search PubMed.
- A. Q. Alorabi, M. Shamshi Hassan and M. Azizi, Arabian J. Chem., 2020, 13, 8080–8091 CrossRef CAS.
- H. Örtün and N. Karapınar, Russ. J. Phys. Chem. A, 2021, 95, S179–S188 CrossRef.
Footnote |
| † Electronic supplementary information (ESI) available. See DOI: https://doi.org/10.1039/d3ra04222g |
| This journal is © The Royal Society of Chemistry 2024 |

