
 Open Access Article
 This Open Access Article is licensed under a
 Creative Commons Attribution 3.0 Unported Licence
Antisense DNA loaded 2D nanosheets for combined photodynamic and antisense cancer therapy†
Gowtham
Raj
a,
Vasudev
D. S
a,
Justin
Prasad
a,
Erai
Anbu
b,
Soumakanya
Ram
a,
Geoffrey Bellson
Daniel
a,
Nikhil Dev
Narendradev
 b,
Srinivasa Murty
Srinivasula
b and
Reji
Varghese
*a
b,
Srinivasa Murty
Srinivasula
b and
Reji
Varghese
*a
aSchool of Chemistry, Indian Institute of Science Education and Research (IISER), Thiruvananthapuram, Trivandrum-695551, Kerala, India. E-mail: reji@iisertvm.ac.in
bSchool of Biology, Indian Institute of Science Education and Research (IISER), Thiruvananthapuram, Trivandrum-695551, Kerala, India
First published on 17th November 2023
Abstract
Recent years have witnessed the rapid growth of combination therapy as a promising strategy for the cancer treatment. Among the various possibilities, combination of PDT and antisense DNA therapy is considered as the most promising strategy. Herein, a new supramolecular strategy for the creation of a multifunctional therapeutic nanosystem that consists of PDT active 2D nanosheets loaded with antisense DNA for the combination of PDT and antisense therapy for the cancer treatment is reported. The therapeutic efficacy of antisense DNA loaded PDT active nanosheets is studied using HeLa cells as the representative cell line. The nanosystem is found to undergo lysosomal escape due to the positively charged surface of the sheets, which is highly beneficial as the lysosomal degradation of the therapeutically active DNA can be significantly reduced. Efficient singlet oxygen generation inside the cancer cells upon NIR light irradiation of the sheets is shown. In addition, downregulation of the anti-apoptotic protein Bcl-2 by the action of antisense DNA is also demonstrated. Excellent therapeutic efficacy is observed for the antisense DNA loaded nanosheets under NIR light irradiation when compared to the individual therapeutic agents. The enhanced therapeutic efficacy of the nanohybrid system is attributed to the synergetic combination of the PDT action of the nanosheets and the antisense action of the DNA. Our design strategy demonstrates the self-delivery of functional nucleic acids along with PDT active nanomaterials for synergistic and cooperative cancer therapy.
Introduction
Cancer is undoubtedly one of the major causes of death for mankind and hence designing new strategies to improve the efficiency of existing therapies is always demanding.1–9 Recent years have witnessed the rapid growth of combination therapy as a promising therapeutic approach for the cancer treatment.10–13Combination therapy combines two or more therapies together and works in a synergistic fashion, and hence only a lower dosage of each individual drug is required. Combinations of (i) chemotherapy and photodynamic therapy (PDT),14–17(ii) PDT and photothermal therapy (PTT)18–21 and (iii) chemotherapy and antisense DNA therapy22,23 have been developed by different research groups and excellent therapeutic efficacies have been achieved. Among them, combination of antisense DNA therapy and PDT has received particular attention.24–31 This is because PDT is one of the most efficient non-invasive therapeutic approaches for the cancer treatment. Moreover, the photosensitizers used in PDT applications are typically non-toxic under darkness, and hence PDT allows selective killing of photoexposed cancer cells, leaving the unexposed healthy cells intact.32 On the other hand, antisense DNA therapy is an emerging tool for several diseases including cancer.33–35 This approach explores an antisense oligonucleotide as the therapeutic agent, which typically hybridizes with the complementary mRNA via Watson–Crick base pairing. This causes the downregulation of disease-causing proteins by silencing the mRNA responsible for the protein synthesis. The most remarkable feature of antisense DNA therapy, unlike other therapeutic approaches, is the unprecedented precision of antisense DNA for target binding and hence it offers a more effective and safe therapeutic option. Hence, combination of PDT and antisense DNA therapy is considered as one of the most promising combinations for the treatment of cancer.Although unique in many ways, one of the important challenges associated with antisense DNA therapy is the extremely poor cell permeability of the antisense oligonucleotide due to its negatively charged phosphate backbone.36,37 Generally, delivery of antisense DNA into the cells was achieved by using a suitable nanocarrier, which delivers antisense DNA via the endocytosis mechanism.38,39 However, nanocarriers enter into the cells via an endocytic pathway, eventually reach the lysosomes and get degraded at the lysosomes. This significantly reduces the efficacy of antisense therapy.40 Furthermore, the nanocarriers used for antisense DNA delivery typically have no therapeutic relevance. Hence, a therapeutically relevant nanocarrier that has lysosomal escaping ability would be an ideal candidate for antisense DNA delivery.
We have recently reported the self-assembly of a biotin-tethered iodo-BODIPY amphiphile into biotin-decorated 2D nanosheets for PDT applications.41 The nanosheets exhibited a high extinction coefficient in the NIR region, excellent singlet oxygen (1O2) generation efficiency and no toxicity in the dark. The most notable structural feature of the nanosheets is the dense decoration of biotins on the surface of the sheets, which permitted the targeted delivery of the nanosheets into biotin receptor positive cancer cell lines such as HeLa and A549. Interestingly, biotin is also known to form a stable host–guest inclusion complex with β-cyclodextrin (β-CD).42 This suggests that biotin decorated nanosheets would be an ideal 2D platform for the integration of β-CD onto the surface of the sheets. Motivated by these observations, we envisioned that the functionalization of β-CD with a positively charged group and the subsequent assembly with biotin-decorated 2D sheets permits the decoration of cationic β-CD on the surface of the nanosheets. These positively charged 2D nanosheets would then act as a template (host) for the loading of negatively charged antisense DNA (guest) via electrostatic interactions, and therefore combination of PDT and antisense DNA therapy can be achieved in a single step supramolecular fashion.43
Herein, we report a non-covalent strategy for the creation of a multifunctional therapeutic nanosystem that consists of PDT active 2D nanosheets loaded with antisense DNA for the combination of PDT and antisense DNA therapy for the cancer treatment in vitro. A biotin modified iodo-BODIPY amphiphile (1) is known to form biotin decorated 2D nanosheets.40 The host–guest interaction between 1 nanosheets and cationic β-cyclodextrin (β-CD+) in aqueous medium results in the formation of 1/β-CD+ nanosheets with positively charged β-CD+ exposed to the surface of the sheets. Subsequently, the cationic surface of the nanosheets is explored for the decoration of antisense DNA (A-DNA) via electrostatic interactions to form 1/β-CD+/A-DNA sheets and the therapeutic efficacy of 1/β-CD+/A-DNA sheets is studied using HeLa as a representative cell line. Interestingly, 1/β-CD+/A-DNA nanosheets exhibit lysosomal escape, which prevents their degradation at the lysosome. This is highly beneficial for the effective therapeutic action of the sheets. The detachment of A-DNA from the surface of 1/β-CD+/A-DNA sheets leads to the delivery of A-DNA, which causes the suppression of Bcl-2 protein synthesis and leads to cell apoptosis. In addition, A-DNA causes significant reduction in the resistance of the cells towards PDT, which in turn improves the PDT action of the sheets.24 Singlet oxygen generation upon NIR light illumination of 1/β-CD+/A-DNA sheets and their PDT action are also shown. The most remarkable feature of the present nanosystem is the cooperativity in its therapeutic action, wherein PDT active nanosheets act as a carrier for the delivery of antisense DNA into the cancer cells and at the same time antisense DNA enhances the PDT activity of the nanosheets by suppressing PDT resistance-inducing proteins (Scheme 1).
 | ||
| Scheme 1 The host–guest interaction between 1 and β-CD+ to form 1/β-CD+ followed by its amphiphilicity-driven self-assembly into β-CD+/1 nanosheets. Antisense DNA (A-DNA) loading onto the surface of 1/β-CD+ nanosheets to form 1/β-CD+/A-DNA sheets and their cellular internalization for cooperative cancer therapy are also shown. | ||
Results and discussion
β-CD+ and 1 were synthesized following our own previously reported and modified protocols.41,44–46 The synthesis of 1/β-CD+/A-DNA sheets was achieved by annealing β-CD+ (10 μM in water) and 1 (10 μM in DMSO) at 90 °C for 5 minutes followed by slow cooling to room temperature with the addition of A-DNA (5′-TCTCCCAGCGTGCGCCAT-3′, 1 μM) when the temperature of the solution reached 50 °C. The excess unassociated molecules present in the solution were removed by repeated centrifugation (3 times at 3000 rpm for 5 minutes), and the supernatant obtained was used for the experiments. Initially, host–guest complexation between 1 sheets and β-CD+ and the spontaneous self-assembly of the resultant supramolecular amphiphile (1/β-CD+) were studied. Amphiphile 1 (10 μM) exists as monomeric species in DMSO and a strong absorption band with its maximum centered at 664 nm was observed in DMSO (Fig. 1a). On the other hand, 1 exhibited a broad absorption spectrum in water (10 μM), clearly indicating the aggregation of 1 in water due to its very poor water solubility. As expected, β-CD+ is freely soluble in water and showed its characteristic absorption spectral features. Interestingly, the absorption spectrum of 1 (10 μM) in water in the presence of β-CD+ (10 μM) showed a broad absorption band, but with distinct vibronic features of 1. This indicates that the host–guest interaction between 1 and β-CD+ results in the formation of the 1/β-CD+ inclusion complex. At the same time, broadness of the spectrum also suggests that the possible aggregation of 1/β-CD+ through π-stacking and hydrophobic interactions of BODIPY. Fluorescence analysis of 1 in DMSO (10 μM) showed intense emission of BODIPY at 700 nm (λexc = 635 nm) (Fig. 1b). In contrast, significant quenching of fluorescence was observed for both 1 (10 μM) and 1/β-CD+ (10 μM) in water. These observations are in support of aggregation of the 1/β-CD+ complex in water.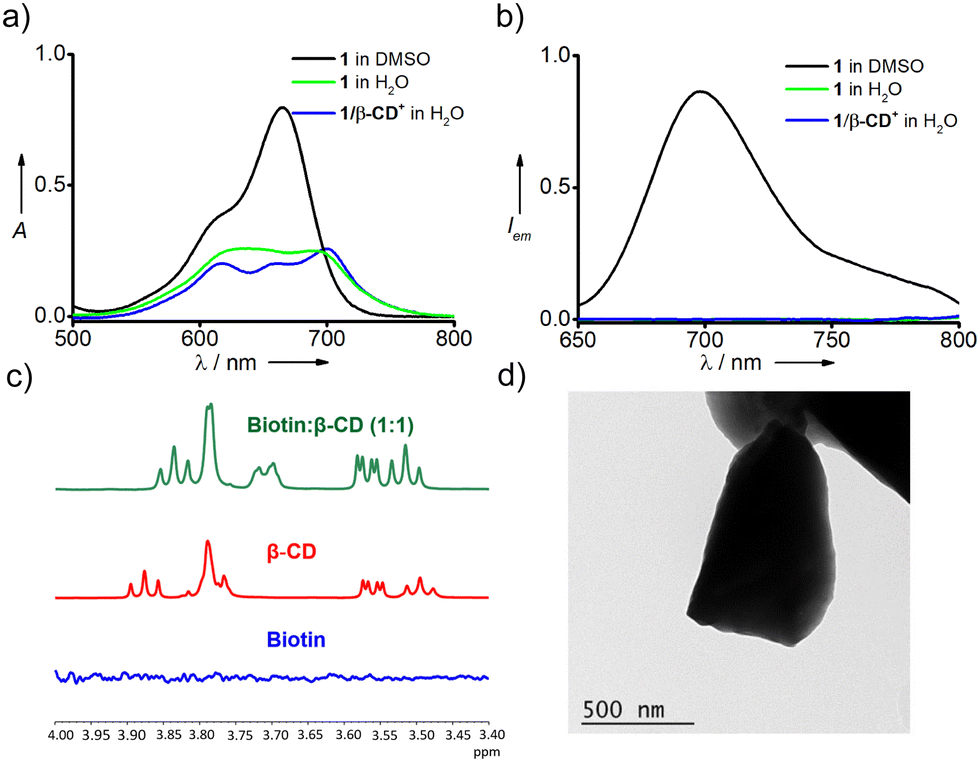 | ||
Fig. 1 (a) UV-Vis absorption and (b) emission spectra of 1 (10 μM), β-CD+ (10 μM) and 1/β-CD+ aggregates (10 μM). (c) 1H NMR spectra of biotin (blue trace, 40 mM), β-CD (red trace, 40 mM) and a 1![[thin space (1/6-em)]](https://www.rsc.org/images/entities/char_2009.gif) :1 mixture of biotin and β-CD (green trace, 40 mM each) in D2O. (d) Representative TEM image of 1/β-CD+ aggregates in water. :1 mixture of biotin and β-CD (green trace, 40 mM each) in D2O. (d) Representative TEM image of 1/β-CD+ aggregates in water. | ||
In order to further support the host–guest interaction, 1H-NMR experiments were carried out using biotin and β-CD (Fig. 1c). No 1H-NMR signals were observed for biotin in water due to its very poor water solubility (blue trace). On the other hand, β-CD showed its characteristic 1H NMR signals (red trace). Interestingly, characteristic NMR peaks of biotin (40 mM) emerged in the presence of β-CD (40 mM), indicating the increased solubility of biotin in water. Moreover, significant downfield shifts were observed for the hydrogen atoms of β-CD that were residing in the inner cavity of β-CD. This can be attributed to the presence of biotin inside the hydrophobic cavity, which causes the downfield shift for the inner hydrogen atoms of β-CD. These observations confirm the formation of a host–guest complex between biotin and β-CD as reported in similar systems.41 NMR titration studies using β-CD and biotin were then carried out to determine the stoichiometry of the inclusion complex between 1 and β-CD by using Job's plot analysis. The chemical shift value at 3.865 of the –OH group residing inside the hydrophobic cavity of β-CD was monitored to construct Job's plot. The resulting Job's plot has a maximum at 0.5 indicating the 1:1 stoichiometry for the inclusion complex between 1 and β-CD (Fig. S1, ESI†). It is also to be noted that no significant changes were seen in the absorption and emission spectra of 1/β-CD+ in water with the rise in temperature from 20 °C to 90 °C, revealing the high thermal stability of the 1/β-CD+ inclusion complex and its self-assembled species (Fig. S2, ESI†). Dynamic light scattering (DLS) analysis of 1/β-CD+ in water revealed the formation of aggregated species in solution with size distribution in the range of 120–810 nm and with a polydispersity index (PDI) of 0.3 (Fig. S4, ESI†). Transmission electron microscopy (TEM) analysis of 1/β-CD+ in water revealed sheet morphology for 1/β-CD+ aggregates (Fig. 1d and Fig. S3, ESI†). The lateral dimensions of the sheets are in the range of several hundreds of nm to μm.
After confirming the sheet morphology for 1/β-CD+ aggregates, we studied the electrostatic loading of A-DNA onto the surface of 1/β-CD+ sheets to form 1/β-CD+/A-DNA using zeta potential analysis (Fig. 2a). Since the association between A-DNA and 1/β-CD+ sheets is purely electrostatic in nature, in principle, any molar ratio between A-DNA and 1/β-CD+ sheets can facilitate the loading of A-DNA onto the sheet surface. In our study, we have taken a 1:10 molar ratio of A-DNA (1 μM) and 1/β-CD+ (10 μM). This low molar ratio of A-DNA compared to 1/β-CD+ was selected to make sure the complete loading of A-DNA onto the surface of the sheets. Zeta potential analysis of A-DNA and 1/β-CD+ showed values of −7.48 and +15.67 mV, respectively, whereas 1/β-CD+/A-DNA exhibited a zeta potential value of +7.93 mV. This significant decrease in the zeta potential value for 1/β-CD+/A-DNA (+7.93 mV) when compared to 1/β-CD+ sheets (+15.67 mV) can be attributed to the loading of negatively charged A-DNA onto the surface of 1/β-CD+ sheets via strong electrostatic interactions to form 1/β-CD+/A-DNA. It is also to be noted that no significant change in the zeta potential value of +7.93 mV was observed over a time period of 6 h (Fig. S5, ESI†). This suggests the structural stability of electrostatic interaction between the negatively charged A-DNA and positively charged 1/β-CD+ nanosheets with respect to time, at least for 6 h. Interestingly, the sheet morphology of 1/β-CD+ remains intact even after the loading of A-DNA as is evident from TEM (Fig. 2b) and AFM (Fig. 2c) analyses of 1/β-CD+/A-DNA aggregates. In order to further confirm the full loading of A-DNA at a 1:10 molar ratio, we have performed native PAGE (20%) analysis (Fig. S6, ESI†). As expected, no gel electrophoretic mobility was observed for 1/β-CD+/A-DNA. It is also important to note that the band corresponding to A-DNA was not seen in the gel, revealing the strong electrostatic association between A-DNA and 1/β-CD+ sheets. These results are in full accordance with the zeta potential measurements showing that a 1:10 molar ratio of A-DNA and 1/β-CD+ sheets permits the efficient loading of A-DNA onto the sheet surface and this nanoformulation exhibits excellent structural stability.
 | ||
| Fig. 2 (a) Comparison of zeta potential values of A-DNA, 1/β-CD+ and 1/β-CD+/A-DNA. (b) TEM and (c) AFM images of 1/β-CD+/A-DNA. (d) Time dependent UV-Vis absorption spectra of a solution of 1/β-CD+ sheets and DPBF upon NIR light illumination (635 nm laser at 0.75 W cm−2) for 4 min. | ||
Furthermore, the 1O2 generation ability of 1/β-CD+ nanosheets upon NIR light irradiation was studied using 1,3-diphenylisobenzofuran (DPBF) as an indicator for 1O2 detection. For this purpose, 1/β-CD+ nanosheets (40 μM) in water containing DPBF (200 μM) were irradiated with 635 nm laser at 0.75 W cm−2 for 4 min and then the absorption changes of DPBF at 420 nm with respect to time were monitored (Fig. 2d). Time-dependent studies showed a noticeable decrease in the characteristic absorption band of DPBF at 420 nm with respect to time, clearly revealing the degradation of the dye. This can be attributed to the reaction of DPBF with 1O2 generated from 1/β-CD+ nanosheets to form an unstable peroxide that spontaneously decomposes into colorless 1,2-dibenzoyl benzene.40 This shows the efficient generation of 1O2 by 1/β-CD+ nanosheets in aqueous solution upon NIR light illumination. We have also evaluated the photostability of 1/β-CD+ nanosheets during the course of the reaction by monitoring the characteristic absorption changes of 1/β-CD+ nanosheets (40 μM). A slight decrease in the absorbance of 1/β-CD+ nanosheets at 675 nm was observed with respect to time, indicating a minor degradation of the sheets during photoirradiation. Furthermore, no photothermal effect was observed for 1/β-CD+ nanosheets upon NIR light illumination (635 nm laser at 0.75 W/cm2) even for 12 minutes of irradiation (Fig. S7, ESI†).
We then focused on the therapeutic efficiency of 1/β-CD+/A-DNA nanosheets for cooperative cancer therapy using HeLa cells as the representative cell line. Initially, the cellular internalization studies of 1/β-CD+/A-DNA sheets were performed. For this purpose, A-DNA was covalently modified at the 5′-end with 6-carboxyfluorescein (FAM) and FAM-modified A-DNA (DNA-FAM) was used for all the experiments. For the cellular internalization, HeLa cells were incubated with DNA-FAM (5 μM) and 1/β-CD+/DNA-FAM (5 μM with respect to DNA-FAM) for 12 h, and the green fluorescence of FAM was monitored using a confocal laser scanning microscope (CLSM). As expected, strong green fluorescence of FAM was observed for HeLa cells treated with 1/β-CD+/DNA-FAM, whereas nearly no green fluorescence was associated with DNA-FAM treated HeLa cells (Fig. 3a). These results suggest that 1/β-CD+/DNA-FAM sheets exhibit excellent cell permeability, whereas the impermeability of DNA-FAM can be attributed to the negatively charged backbone of single stranded DNA, which is typically cell impermeable. Moreover, no cellular internalization was observed for DNA-FAM even for a longer incubation time of 16 h (Fig. S8, ESI†). The CLSM observations were then quantified by using fluorescence-activated cell sorting (FACS) analysis. As shown in Fig. 3b, a high mean fluorescence intensity (MFI) shift was associated with 1/β-CD+/DNA-FAM treated HeLa cells (MFI = 411) when compared to the MFI shift of DNA-FAM (MFI = 76) treated cells.
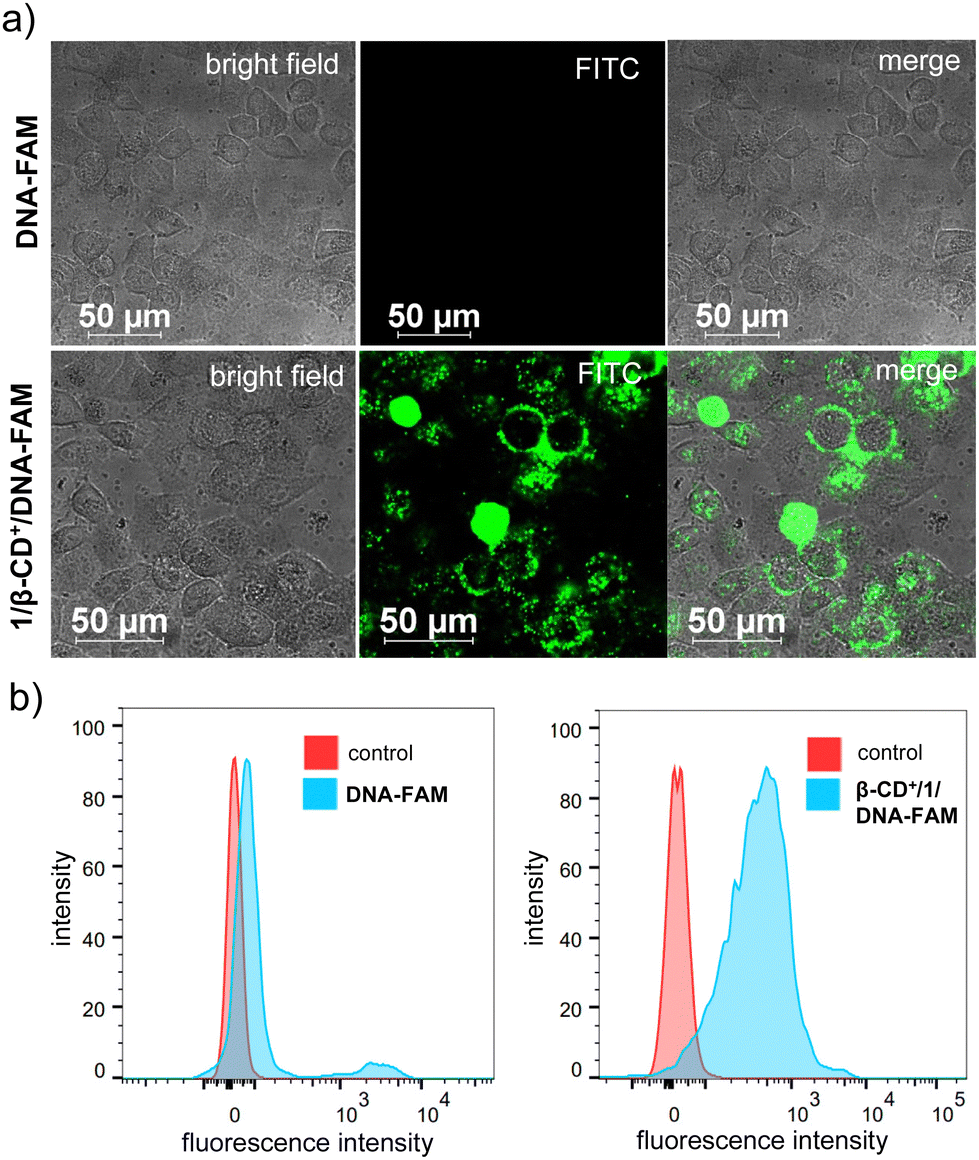 | ||
| Fig. 3 (a) CLSM images of HeLa cells showing the cellular internalization of DNA-FAM and 1/β-CD+/DNA-FAM nanosheets and (b) the corresponding FACS analysis. | ||
Subsequent to the cellular internalization studies, we investigated the subcellular localization of 1/β-CD+/DNA-FAM sheets (5 μM with respect to DNA-FAM) inside HeLa cells. In general, nanocarriers used for the transport of antisense DNA get entrapped at the lysosomes and get degraded at the lysosome. In order to monitor the lysosomal localization of 1/β-CD+/DNA-FAM nanosheets, cells were treated with 1/β-CD+/DNA-FAM and costained with Lysotracker deep red (red fluorescence). Interestingly, no colocalization of the green fluorescence of 1/β-CD+/DNA-FAM nanosheets and the red fluorescence of Lysotracker was observed. This confirms the efficient lysosomal escape of 1/β-CD+/DNA-FAM nanosheets, which is highly beneficial for its therapeutic action (Fig. 4a). This was further supported by the line analysis, which showed a relatively low Pearson coefficient value of 0.035 (Fig. S9, ESI†). These experimental observations are in good accordance with our design strategy that the cationic β-CD+ present on the surface of 1/β-CD+/DNA-FAM sheets permits the antisense DNA loaded nanosheets to escape from the lysosome by the lysosomal membrane destabilization induced by the positive charges, as reported in similar systems.42
 | ||
| Fig. 4 (a) CLSM images of HeLa cells demonstrating the lysosomal escaping ability of 1/β-CD+/DNA-FAM nanosheets. The lysosomes are stained with Lysotracker deep red (red fluorescence) and the green fluorescence of DNA-FAM was monitored for the colocalization studies. (b) CLSM images of HeLa cells treated with 1/β-CD+/A-DNA and DCFHDA under NIR light illumination to evaluate the singlet oxygen (1O2) generation capability of the sheets. | ||
The singlet oxygen generation ability of 1/β-CD+/A-DNA inside HeLa cells under NIR light illumination was then studied. Towards this, 1/β-CD+/A-DNA sheet (10 μM with respect to 1/β-CD+ and 10 μM with respect to A-DNA)-treated HeLa cells were irradiated with 635 nm laser (0.75 W cm−2) for 10 minutes. After NIR light irradiation, HeLa cells were stained with 2′,7′-dichlorodihydrofluorescein diacetate (DCFHDA), a fluorescent probe that could detect the in situ generated reactive oxygen species (ROS) and impart green fluorescence to the cells. Interestingly, intense green fluorescence was associated with HeLa cells treated with 1/β-CD+/A-DNA when compared to the corresponding untreated HeLa cells (Fig. 4b). This was further quantified using FACS analysis, which showed a high MFI shift value for 1/β-CD+/A-DNA nanosheet treated-HeLa cells (609) when compared to the corresponding untreated cells (169) (Fig. S10, ESI†). These results conclude the efficient generation of 1O2 by 1/β-CD+/A-DNA sheets inside the cancer cells upon NIR light illumination.
Since 1O2 is known to potentially damage the membranes of lysosomes and mitochondria, the fate of the organelles after 1O2 generation was examined. The lysosomal damage was monitored by costaining HeLa cells with acridine orange (AO) after their treatment with 1/β-CD+/A-DNA sheets (10 μM with respect to 1/β-CD+ and 10 μM with respect to A-DNA) for 2 h followed by NIR light illumination for 10 minutes. Acridine orange gives bright red fluorescence upon entrapment in the healthy lysosomes, indicative of healthy lysosomes. If the lysosome is damaged due to the membrane rupture, a significant reduction in the red fluorescence intensity is expected. In addition, AO is known to bind to the nucleus of the cell and produce green fluorescence. The CLSM analysis of 1/β-CD+/A-DNA treated HeLa cells under NIR light illumination for 10 minutes followed by 12 h of incubation showed no decrease in the red fluorescence of AO with respect to the control, indicating that the lysosomes are not getting damaged by 1O2 generated from 1/β-CD+/A-DNA nanosheets (Fig. 5a). This was further quantified using FACS analysis, which showed similar MFI shift values for 1/β-CD+/A-DNA treated (465) and untreated (497) HeLa cells (Fig. S11, ESI†).
 | ||
| Fig. 5 (a) CLSM images of AO stained HeLa cells treated with 1/β-CD+/DNA nanosheets after NIR light illumination to evaluate the lysosomal degradation by the in situ generated 1O2. (b) CLSM images of TMRM stained HeLa cells treated with 1/β-CD+/DNA nanosheets after NIR light illumination to evaluate the mitochondrial damage by the in situ generated 1O2 and (c) the corresponding FACS analysis. | ||
The mitochondrial damage caused by 1O2 was evaluated using tetramethylrhodamine methyl ester perchlorate (TMRM) assay. For this, HeLa cells were treated with 1/β-CD+/A-DNA (10 μM with respect to 1/β-CD+ and 10 μM with respect to A-DNA) for 2 h and then kept under NIR light illumination for 10 minutes followed by 12 h incubation. Cells were then costained with TMRM and changes in the green fluorescence intensity of TMRM were probed using CLSM analysis. In this case as well, CLSM analysis of 1/β-CD+/A-DNA-treated HeLa cells showed no decrease in the fluorescence intensity when compared to the corresponding control cells, indicating the healthy nature of mitochondria (Fig. 5b). This was further quantified by FACS analysis (Fig. 5c), which revealed similar MFI shift values for 1/β-CD+/A-DNA treated (35653) and untreated control cells (35723).
The cytotoxicity of 1/β-CD+/A-DNA towards HeLa cells was evaluated using MTT assay. Initially, the stability of 1/β-CD+/A-DNA under serum conditions was studied using native PAGE analysis (20%). The complex 1/β-CD+/A-DNA was treated with 10% heat-inactivated serum for different periods of time. The corresponding PAGE analysis clearly showed that even after 6 h of incubation, no degradation of 1/β-CD+/A-DNA and release of A-DNA was observed. The band corresponding to 1/β-CD+/A-DNA was clearly visible in the well of the gel (Fig. S12, ESI†). This implies the structural stability of the nanoformulation under serum conditions. Subsequently, the cytotoxicity of A-DNA, β-CD+ and 1/β-CD+ nanosheets under dark was investigated independently. Towards this, HeLa cells were incubated with A-DNA, β-CD+ and 1/β-CD+ nanosheets of varying concentrations (50–1000 nM) for 24 h. Even at a higher concentration of 1000 nM, A-DNA did not cause significant cell death, and the cell viability remains close to that of untreated control cells (Fig. 6a). The failure of A-DNA to induce cell death must be due to the cell impermeable nature of A-DNA as demonstrated earlier. Similarly, no dark toxicity was observed for β-CD+ and 1/β-CD+ sheets toward HeLa cells (Fig. S13 and S14, ESI†). After confirming the dark nontoxicity of the system, we studied the combined cytotoxicity due to (i) the PDT action of the sheets and (ii) the antisense action of DNA. For this, HeLa cells were incubated with 1/β-CD+/A-DNA sheets (10 μM with respect to 1/β-CD+ and 1 μM with respect to A-DNA) for 2 h followed by illumination with NIR light for 10 minutes and then cultured for 24 h. Toxicity associated with 1/β-CD+/A-DNA sheets in the dark can be attributed to the effect of antisense DNA, which leads to a cell death of 25% (Fig. 6b). On the other hand, a toxicity of 46% observed for 1/β-CD+ sheets after NIR light irradiation must be due to the PDT action of the sheets. Very interestingly, significant enhancement in the cell death to 61% was observed for the cells treated with 1/β-CD+/A-DNA sheets after NIR light illumination for 10 minutes (Fig. 6b). The corresponding western blot analysis revealed down-regulation of expression of the anti-apoptotic Bcl2 protein (Fig. 6c, raw data are provided in Fig. S15, ESI†). These results clearly conclude that the enhanced cytotoxicity of 1/β-CD+/A-DNA sheets under NIR light irradiation is due to the synergistic combination of (i) the antisense action of A-DNA and (ii) the PDT action of the sheet.
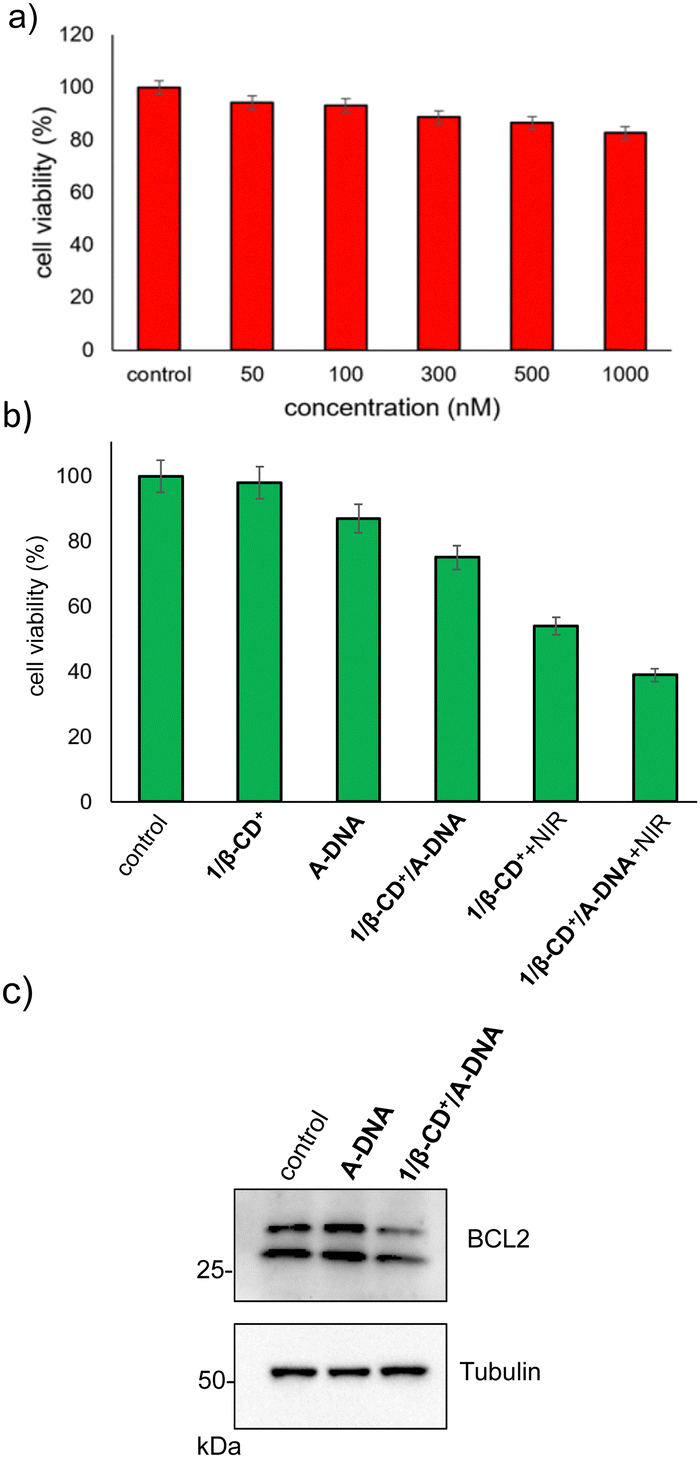 | ||
| Fig. 6 (a) Cell viability (MTT assay) of HeLa cells with varying concentrations of A-DNA. (b) Comparison of cell viability of HeLa cells treated with 1/β-CD+, A-DNA, 1/β-CD+/A-DNA, 1/β-CD+ + NIR and 1/β-CD+/A-DNA + NIR. (c) The western blot analysis of HeLa cells treated with 1/β-CD+/A-DNA sheets. | ||
Finally, the cytotoxicity effect of 1/β-CD+/A-DNA under NIR light illumination (635 nm, 0.75 W cm−2) was analysed using calcein-AM/PI staining assay. Calcein-AM interacts with the esterase present inside the live cancer cells and gives green fluorescence due to the cleavage of the acetoxymethyl (AM) ester protecting group of calcein-AM. However, no ester cleavage occurs inside the dead cell and hence no green fluorescence is expected for the dead cells as the concentration of esterase present in the dead cell is minimal. Similarly, propidium iodide (PI) cannot pass through the cell membrane of live cells, whereas it stains the dead cell to give red fluorescence. As shown in Fig. 7a, untreated HeLa cells showed only the green fluorescence of calcein-AM staining and no red fluorescence of PI, indicating that the cells are alive, as expected. On the other hand, intense red florescence of PI was observed for the cells treated with 1/β-CD+/A-DNA sheets after NIR light illumination. These results are in good agreement with the MTT assay. We have also carried out live/dead cell assay using calcein-AM/PI double staining to understand the synergism between antisense therapy (A-DNA) and PDT (1/β-CD+). A drastic decrease in the green fluorescence from calcein-AM and an increase in red fluorescence from PI were observed for the cells treated with 1/β-CD+/A-DNA sheets after NIR light illumination when compared to 1/β-CD+/A-DNA treated cells in the dark and 1/β-CD+ sheets after NIR light irradiation. The enhanced cell death observed for 1/β-CD+/A-DNA sheets supports the MTT data and proves the synergetic effect of PDT and antisense therapy (Fig. S16, ESI†).
 | ||
| Fig. 7 (a) Calcein-AM/PI live/dead cell assay of 1/β-CD+/A-DNA treated HeLa cells. (b) Annexin V-FITC/PI assay of 1/β-CD+/A-DNA treated HeLa cells. | ||
Furthermore, the annexin V-FITC(AV)/PI staining assay experiment was carried out on 1/β-CD+/A-DNA treated HeLa cells to get better insight into the mechanism of the cell death. As shown in Fig. S17 (ESI†), 1/β-CD+/A-DNA treated cells after NIR light illumination exhibited strong green fluorescence from annexin V-FITC at the cell membrane and strong red fluorescence of PI from the nuclei, revealing that the cell death occurs primarily via a late stage apoptotic pathway. This is further confirmed through the FACS analysis. For this purpose, HeLa cells were treated with 1/β-CD+/A-DNA sheets under NIR light illumination and analyzed by flow cytometry after staining with annexin V-FITC (AV)/PI. Interestingly, the cell population mainly shifted to the quadrant corresponds to the apoptotic pathway (Fig. 7b). These results collectively conclude that 1/β-CD+/A-DNA sheets under NIR light illumination induce cell death due to the apoptotic pathway and not due to the necrotic mechanism.
Conclusions
In summary, we have reported a supramolecular strategy for the design of a multifunctional therapeutic nanosystem that consists of PDT active 2D nanosheets loaded with antisense DNA for the synergetic combination of PDT and antisense DNA therapy for the cancer treatment in vitro. Excellent therapeutic efficiency was observed for the nanosystem due to the combined effect of the PDT action of the sheets and the antisense action of DNA. The most remarkable feature of the present nanosystem is cooperativity in its therapeutic action, wherein PDT active nanosheets act as a carrier for the delivery of antisense DNA into the cancer cells and at the same time antisense DNA enhances the PDT activity of the nanosheets by suppressing PDT resistance-inducing proteins. Our design strategy demonstrates the self-delivery of functional nucleic acids along with PDT active nanomaterials for synergistic and cooperative cancer therapy. We believe that the less laborious yet efficient supramolecular approach demonstrated in this work may encourage other researchers to design new supramolecular nanosystems for combination cancer therapy. Our work also shows that self-deliverable nanosystems are promising delivery vehicles for cancer treatment.Author contributions
The manuscript was written through contributions of all authors. All authors have given approval to the final version of the manuscript.Conflicts of interest
There are no conflicts to declare.Acknowledgements
Financial support from SERB (CRG/2022/002612) is gratefully acknowledged. The help of Sarika Mohan S. is acknowledged for the FACS analysis.References
- X. Cheng, H.-D. Xu, H.-H. Ran, G. Liang and F.-G. Wu, Glutathione-Depleting Nanomedicines for Synergistic Cancer Therapy, ACS Nano, 2021, 15, 8039–8068 CrossRef CAS PubMed.
- S. Bajpai, S. K. Tiwary, M. Sonker, A. Joshi, V. Gupta, Y. Kumar, N. Shreyash and S. Biswas, Recent Advances in Nanoparticle-Based Cancer Treatment, ACS Appl. Nano Mater., 2021, 4, 6441–6470 CrossRef CAS.
- W. Fan, B. Yung, P. Huang and X. Chen, Nanotechnology for Multimodal Synergistic Cancer Therapy, Chem. Rev., 2017, 117, 13566–13638 CrossRef CAS PubMed.
- W. Yang, H. Veroniaina, X. Qi, P. Chen, F. Li and P. C. Ke, Soft and Condensed Nanoparticles and Nanoformulations for Cancer Drug Delivery and Repurpose, Adv. Ther., 2020, 3, 1900102 CrossRef PubMed.
- K. Kansara, A. Mansuri, A. Rajwar, P. Vaswani, R. Singh, A. Kumar and D. Bhatia, Spatiotemporal Dynamics of DNA Nanocage Uptake in Zebrafish Embryos for Targeted Tissue Bioimaging Applications, Nanoscale Adv., 2023, 5, 2558–2564 RSC.
- Q. Zhang, Q. Jiang, N. Li, L. Dai, Q. Liu, L. Song, J. Wang, Y. Li, J. Tian, B. Ding and Y. Du, DNA Origami as an In Vivo Drug Delivery Vehicle for Cancer Therapy, ACS Nano, 2014, 8, 6633–6643 CrossRef CAS PubMed.
- S. Wang, S. Tavakoli, R. P. Parvathaneni, G. N. Nawale, O. P. Oommen, J. Hilborn and O. P. Varghese, Dynamic Covalent Crosslinked Hyaluronic Acid Hydrogels and Nanomaterials for Biomedical Applications, Biomater. Sci., 2022, 10, 6399–6412 RSC.
- W. E. M. Noteborn, S. K. Vittala, M. B. Torredemer, C. Maity, F. Versluis, R. Eelkema and R. E. Kieltyka, Switching the Mode of Drug Release from a Reaction-Coupled Low-Molecular-Weight Gelator System by Altering Its Reaction Pathway, Biomacromolecules, 2023, 24, 377–386 CrossRef CAS PubMed.
- A. Saminathan, M. Zajac, P. Anees and Y. Krishnan, Organelle-Level Precision with next-Generation Targeting Technologies, Nat. Rev. Mater., 2022, 7, 355–371 CrossRef.
- P. Liang, B. Ballou, X. Lv, W. Si, M. P. Bruchez, W. Huang and X. Dong, Monotherapy and Combination Therapy Using Anti-Angiogenic Nanoagents to Fight Cancer, Adv. Mater., 2021, 33, 2005155 CrossRef CAS PubMed.
- S. Shen, M. Liu, T. Li, S. Lin and R. Mo, Nanomedicine-Based Combination Cancer Therapy Using a Site-Specific Co-Delivery Strategy, Biomater. Sci., 2017, 5, 1367–1381 RSC.
- K. Li, Y. Zhang, A. Hussain, Y. Weng and Y. Huang, Progress of Photodynamic and RNAi Combination Therapy in Cancer Treatment, ACS Biomater. Sci. Eng., 2021, 7, 4420–4429 CrossRef CAS PubMed.
- R. N. Woodring, E. G. Gurysh, E. M. Bachelder and K. M. Ainslie, Drug Delivery Systems for Localized Cancer Combination Therapy, ACS Appl. Bio Mater., 2023, 6, 934–950 CrossRef CAS PubMed.
- Y. Chen, Y. Gao, Y. Li, K. Wang and J. Zhu, Synergistic Chemo-Photodynamic Therapy Mediated by Light-Activated ROS-Degradable Nanocarriers, J. Mater. Chem. B, 2019, 7, 460–468 RSC.
- Z. Wang, R. Ma, L. Yan, X. Chen and G. Zhu, Combined Chemotherapy and Photodynamic Therapy Using a Nanohybrid Based on Layered Double Hydroxides to Conquer Cisplatin Resistance, Chem. Commun., 2015, 51, 11587–11590 RSC.
- C. He, X. Duan, N. Guo, C. Chan, C. Poon, R. R. Weichselbaum and W. Lin, Core-Shell Nanoscale Coordination Polymers Combine Chemotherapy and Photodynamic Therapy to Potentiate Checkpoint Blockade Cancer Immunotherapy, Nat. Commun., 2016, 7, 12499 CrossRef CAS PubMed.
- A. Dag, E. Cakilkaya, P. S. Omurtag Ozgen, S. Atasoy, G. Yigit Erdem, B. Cetin, A. Çavuş Kokuroǧlu and A. G. Gürek, Phthalocyanine-Conjugated Glyconanoparticles for Chemo-Photodynamic Combination Therapy, Biomacromolecules, 2021, 22, 1555–1567 CrossRef CAS PubMed.
- X. Cai, M. Wang, P. Mu, T. Jian, D. Liu, S. Ding, Y. Luo, D. Du, Y. Song, C.-L. Chen and Y. Lin, Sequence-Defined Nanotubes Assembled from IR780-Conjugated Peptoids for Chemophototherapy of Malignant Glioma, Research, 2023, 21 Search PubMed.
- X. Liu, N. Xu, X. Pu, J. Wang, X. Liao, Z. Huang and G. Yin, Combined Photothermal–Photodynamic Therapy by Indocyanine Green Loaded Polydopamine Nanoparticles Enhances Anti-Mammary Gland Tumor Efficacy, J. Mater. Chem. B, 2022, 10, 4605–4614 RSC.
- D. Zhang, M. Wu, Y. Zeng, L. Wu, Q. Wang, X. Han, X. Liu and J. Liu, Chlorin E6 Conjugated Poly(Dopamine) Nanospheres as PDT/PTT Dual-Modal Therapeutic Agents for Enhanced Cancer Therapy, ACS Appl. Mater. Interfaces, 2015, 7, 8176–8187 CrossRef CAS PubMed.
- L. Feng, C. Li, L. Liu, Z. Wang, Z. Chen, J. Yu, W. Ji, G. Jiang, P. Zhang, J. Wang and B. Z. Tang, Acceptor Planarization and Donor Rotation: A Facile Strategy for Realizing Synergistic Cancer Phototherapy via Type I PDT and PTT, ACS Nano, 2022, 16, 4162–4174 CrossRef CAS PubMed.
- D. Perumal, J. Kalathil, J. Krishna, G. Raj, K. S. Harikrishnan, M. L. Uthpala, R. Gupta and R. Varghese, Supramolecular Grafting of Stimuli-Responsive, Carrier-Free, Self-Deliverable Nanoparticles of Camptothecin and Antisense DNA for Combination Cancer Therapy, New J. Chem., 2022, 46, 16813–16820 RSC.
- R. Yue, M. Chen and N. Ma, Dual MicroRNA-Triggered Drug Release System for Combined Chemotherapy and Gene Therapy with Logic Operation, ACS Appl. Mater. Interfaces, 2020, 12, 32493–32502 CrossRef CAS PubMed.
- Y. Wu, L. Ding, C. Zheng, H. Li, M. Wu, Y. Sun, X. Liu, X. Zhang and Y. Zeng, Targeted Co-Delivery of a Photosensitizer and an Antisense Oligonucleotide Based on an Activatable Hyaluronic Acid Nanosystem with Endogenous Oxygen Generation for Enhanced Photodynamic Therapy of Hypoxic Tumors, Acta Biomater., 2022, 153, 419–430 CrossRef CAS PubMed.
- M. Pan, Q. Jiang, J. Sun, Z. Xu, Y. Zhou, L. Zhang and X. Liu, Programming DNA Nanoassembly for Enhanced Photodynamic Therapy, Angew. Chem., Int. Ed., 2020, 59, 1897–1905 CrossRef CAS PubMed.
- K. Jibin, M. Victor, G. Saranya, H. Santhakumar, V. Murali, K. K. Maiti and R. S. Jayasree, Nanohybrids of Magnetically Intercalated Optical Metamaterials for Magnetic Resonance/Raman Imaging and In Situ Chemodynamic/Photothermal Therapy, ACS Appl. Bio Mater., 2021, 4, 5742–5752 CrossRef CAS PubMed.
- P. T. Sujai, S. Shamjith, M. M. Joseph and K. K. Maiti, Elucidating Gold–MnO2 Core–Shell Nanoenvelope for Real Time SERS-Guided Photothermal Therapy on Pancreatic Cancer Cells, ACS Appl. Bio Mater., 2021, 4, 4962–4972 CrossRef CAS PubMed.
- T. Gayathri, A. Vijayalakshmi, S. Mangalath, J. Joseph, N. M. Rao and S. P. Singh, Study on Liposomal Encapsulation of New Bodipy Sensitizers for Photodynamic Therapy, ACS Med. Chem. Lett., 2018, 9, 323–327 CrossRef CAS PubMed.
- T. Sakurai, S. Sakaguchi, Y. Takeshita, K. Kayama, A. Horio, M. Sugimoto, T. Yamaki, A. Chiba, Y. Saitoh, L. B. V. S. Garimella, D. K. Avasthi and S. Seki, Porphyrin Nanowire Bundles for Efficient Photoconductivity, Photoemission, and Generation of Singlet Oxygens toward Photodynamic Therapy, ACS Appl. Nano Mater., 2020, 3, 6043–6053 CrossRef CAS.
- T. C. Pham, V.-N. Nguyen, Y. Choi, S. Lee and J. Yoon, Recent Strategies to Develop Innovative Photosensitizers for Enhanced Photodynamic Therapy, Chem. Rev., 2021, 121, 13454–13619 CrossRef CAS PubMed.
- S. Mangalath, P. S. Saneesh Babu, R. R. Nair, P. M. Manu, S. Krishna, S. A. Nair and J. Joseph, Graphene Quantum Dots Decorated with Boron Dipyrromethene Dye Derivatives for Photodynamic Therapy, ACS Appl. Nano Mater., 2021, 4, 4162–4171 CrossRef CAS.
- Q. Yang, X. Chang, J. Y. Lee, T. R. Olivera, M. Saji, H. Wisniewski, S. Kim and F. Zhang, Recent Advances in Self-Assembled DNA Nanostructures for Bioimaging, ACS Appl. Bio Mater., 2022, 5, 4652–4667 CrossRef CAS PubMed.
- W. Shen, R. Wang, Q. Fan, Y. Li and Y. Cheng, Gene Ther., Natural Polyphenol Assisted Delivery of Single-Strand Oligonucleotides by Cationic, Polymers, 2020, 27, 383–391 CAS.
- H. Hiraoka, Z. Shu, B. Tri Le, K. Masuda, K. Nakamoto, L. Fangjie, N. Abe, F. Hashiya, Y. Kimura, Y. Shimizu, R. N. Veedu and H. Abe, Antisense Oligonucleotide Modified with Disulfide Units Induces Efficient Exon Skipping in Mdx Myotubes through Enhanced Membrane Permeability and Nucleus Internalization, ChemBioChem, 2021, 22, 3437–3442 CrossRef CAS PubMed.
- L. Chen, G. Li, X. Wang, J. Li and Y. Zhang, Spherical Nucleic Acids for Near-Infrared Light-Responsive Self-Delivery of Small-Interfering RNA and Antisense Oligonucleotide, ACS Nano, 2021, 15, 11929–11939 CrossRef CAS PubMed.
- M. Nikan, M. Tanowitz, C. A. Dwyer, M. Jackson, H. J. Gaus, E. E. Swayze, F. Rigo, P. P. Seth and T. P. Prakash, Targeted Delivery of Antisense Oligonucleotides Using Neurotensin Peptides, J. Med. Chem., 2020, 63, 8471–8484 CrossRef CAS PubMed.
- Q. Pan, C. Nie, Y. Hu, J. Yi, C. Liu, J. Zhang, M. He, M. He, T. Chen and X. Chu, Aptamer-Functionalized DNA Origami for Targeted Codelivery of Antisense Oligonucleotides and Doxorubicin to Enhance Therapy in Drug-Resistant Cancer Cells, ACS Appl. Mater. Interfaces, 2020, 12, 400–409 CrossRef CAS PubMed.
- B. Smolková, T. MacCulloch, T. F. Rockwood, M. Liu, S. J. W. Henry, A. Frtús, M. Uzhytchak, M. Lunova, M. Hof, P. Jurkiewicz, A. Dejneka, N. Stephanopoulos and O. Lunov, Protein Corona Inhibits Endosomal Escape of Functionalized DNA Nanostructures in Living Cells, ACS Appl. Mater. Interfaces, 2021, 13, 46375–46390 CrossRef PubMed.
- J. Xu, T. Chen, T. Sun, C. Yu, D. Yan and L. Zhu, Erythrocyte Membrane Camouflaged SiRNA/Chemodrug Nanoassemblies for Cancer Combination Therapy, Biomater. Sci., 2022, 10, 6601–6613 RSC.
- L. Shi, W. Wu, Y. Duan, L. Xu, Y. Xu, L. Hou, X. Meng, X. Zhu and B. Liu, Light-Induced Self-Escape of Spherical Nucleic Acid from Endo/Lysosome for Efficient Non-Cationic Gene Delivery, Angew. Chem., Int. Ed., 2020, 59, 19168–19174 CrossRef CAS PubMed.
- D. Perumal, M. Golla, K. S. Pillai, G. Raj, A. Krishna and R. Varghese, Biotin-Decorated NIR-Absorbing Nanosheets for Targeted Photodynamic Cancer Therapy, Org. Biomol. Chem., 2021, 19, 2804–2810 RSC.
- M. Holzinger, M. Singh and S. Cosnier, A New Host–Guest System for the Immobilization of Biomolecules, Langmuir, 2012, 28, 12569–12574 CrossRef CAS PubMed.
- H. Zhang, B. Zhang, M. Zhu, S. M. Grayson, R. Schmehl and J. Jayawickramarajah, Water-Soluble Porphyrin Nanospheres: Enhanced Photo-Physical Properties Achieved via Cyclodextrin Driven Double Self-Inclusion, Chem. Commun., 2014, 50, 4853–4855 RSC.
- A. Tamura, K. Nishida, S. Zhang, T. W. Kang, A. Tonegawa and N. Yui, Cografting of Zwitterionic Sulfobetaines and Cationic Amines on β-Cyclodextrin-Threaded Polyrotaxanes Facilitates Cellular Association and Tissue Accumulation with High Biocompatibility, ACS Biomater. Sci. Eng., 2022, 8, 2463–2476 CrossRef CAS PubMed.
- S. K. Albert, H. V. P. Thelu, M. Golla, N. Krishnan and R. Varghese, Modular synthesis of supramolecular DNA amphiphiles through host–guest interactions and their self-assembly into DNA-decorated nanovesicles, Nanoscale, 2017, 9, 5425–5432 RSC.
- W. Tang and S.-C. Ng, Facile synthesis of mono-6-amino-6-deoxy-alpha-, beta-, gamma-cyclodextrin hydrochlorides for molecular recognition, chiral separation and drug delivery, Nat. Protoc., 2008, 3, 691–697 CrossRef CAS PubMed.
Footnote |
| † Electronic supplementary information (ESI) available. See DOI: https://doi.org/10.1039/d3qm00809f |
| This journal is © the Partner Organisations 2024 |