
 Open Access Article
 This Open Access Article is licensed under a Creative Commons Attribution-Non Commercial 3.0 Unported Licence
Modulation on terahertz absorption properties in LnIII–[AgI(CN)2] networks†
Guanping
Li
 ac,
Olaf
Stefanczyk
*a,
Kunal
Kumar
a,
Yuuki
Mineo
a,
Lidong
Wang
a,
Koji
Nakabayashi
a,
Marie
Yoshikiyo
a,
Nicholas F.
Chilton
cd and
Shin-ichi
Ohkoshi
*ab
ac,
Olaf
Stefanczyk
*a,
Kunal
Kumar
a,
Yuuki
Mineo
a,
Lidong
Wang
a,
Koji
Nakabayashi
a,
Marie
Yoshikiyo
a,
Nicholas F.
Chilton
cd and
Shin-ichi
Ohkoshi
*ab
aDepartment of Chemistry, School of Science, The University of Tokyo, 7-3-1 Hongo, Bunkyo-ku, Tokyo 113-0033, Japan. E-mail: olaf@chem.s.u-tokyo.ac.jp; ohkoshi@chem.s.u-tokyo.ac.jp
bDYNACOM (Dynamical Control of Materials) – IRL2015, CNRS, The University of Tokyo, 7-3-1 Hongo, Bunkyo-ku, Tokyo 113-0033, Japan
cDepartment of Chemistry, The University of Manchester, Manchester, M13 9PL, UK
dResearch School of Chemistry, The Australian National University, Canberra, ACT 2601, Australia
First published on 20th May 2024
Abstract
Molecular materials are playing a pivotal role in the advancement of prospective THz technologies. Herein, we have prepared nine isostructural coordination complexes of general formula [LnIII(H2O)3][AgI(CN)2]3 (LnAg, Ln = La, Ce, Pr, Nd, Sm, Eu, Gd, Tb, and Dy). Vibrational spectroscopy has unveiled gradual changes in the ν(C![[triple bond, length as m-dash]](https://www.rsc.org/images/entities/char_e002.gif) N) stretching frequencies within both infrared (IR) and Raman spectra from LaAg to DyAg, stemming from incremental alterations in crystallographic unit cell parameters and volumes. Similarly, the THz spectra manifest pronounced absorption signals between 1.0 to 1.2 THz, which can be judiciously tuned by varying lanthanide(III) ion and measurement temperature. Ab initio density-functional theory (DFT) calculations of THz spectra elucidate the primary contribution from opposite translational vibrations of Ag atoms and O atoms from H2O around Ln(III) atoms. Furthermore, thin films of LnAg can achieve a large return loss in a broad bandwidth in impedance-matching simulations.
N) stretching frequencies within both infrared (IR) and Raman spectra from LaAg to DyAg, stemming from incremental alterations in crystallographic unit cell parameters and volumes. Similarly, the THz spectra manifest pronounced absorption signals between 1.0 to 1.2 THz, which can be judiciously tuned by varying lanthanide(III) ion and measurement temperature. Ab initio density-functional theory (DFT) calculations of THz spectra elucidate the primary contribution from opposite translational vibrations of Ag atoms and O atoms from H2O around Ln(III) atoms. Furthermore, thin films of LnAg can achieve a large return loss in a broad bandwidth in impedance-matching simulations.
Introduction
Research on terahertz (THz) radiation, spanning from 100 gigahertz (GHz) to 30 THz between microwaves and infrared lights and is essentially terra incognita, has recently garnered increasing attention from scientists all over the world.1–3 Technological innovations in laser technology, nanotechnology, and photonics are now making the previously unexploited THz frequency band accessible in many fields.4–8 In particular, THz time-domain spectroscopy (THz-TDS) is emerging as a cutting-edge method to analyze a wide variety of materials with valuable insights into the fingerprint of the molecular structures, building block arrangements, and inter/intramolecular interactions.9–13 Combining THz spectroscopy with a magnetic field enables the precise characterization of zero-field splitting, providing detailed insights into the electronic structure and magnetic properties of paramagnetic systems.14–16 THz light exhibits versatility in diverse applications, including non-invasive medical imaging and cancer diagnosis, material characterization, monitoring of toxic chemical compounds, sensing events due to natural and human-related disasters, and catalysis.4,17–20 Moreover, the THz band offers unprecedented channel capacities and is poised to contribute to the establishment of high bandwidth wireless sixth-generation (6G) networking systems with anticipated data rates reaching Tbit per s in the near future.21–24As society enters the Internet of Things (IoT) era, the pervasive expansion of wireless technology has introduced novel challenges, concerning excessive electromagnetic (EM) radiation pollution, EM interference, and EM compatibility issues.25–27 Additionally, the manipulation of THz radiation tailored for diverse communication systems is still in its infancy and is a subject of active research.22,23 Hence, there is a compelling imperative to develop new materials capable of achieving efficient THz absorbers while affording THz tunability to modulate different frequency bands on demand. Particularly, molecular complexes are emerging as an appealing category of materials owing to their simple and adjustable structures and predisposition to merge various functionalities, such as magnetism, luminescence, non-linear optics, and low-frequency absorbing capability.28–36 Moreover, the desired THz absorbing capability can be introduced by meticulously choosing building blocks and arranging them in solid-state structures. This strategic approach harnesses the inherent flexibility of molecular complexes, facilitating the deliberate engineering of materials with tailored THz characteristics.
Up to now, a diverse array of versatile materials based on metal complexes have been designed and prepared.37–41 Among them, lanthanide ions (Ln(III)) stand out as one of the most promising metal centers for the assembly of diverse molecular complexes.42–47 Notably, similarity in geometry and charges together with the lanthanide contraction offer lanthanide ions as promising candidates to achieve controllable tuning effects on structures and various properties. For instance, Wong et al. reported the study of second harmonic generation (SHG) as well as quadratic hyperpolarizability for a series of compounds [(C9H7O2)3Ln]n, in which both non-linear optical (NLO) properties feature a similar dependence over the lanthanide series with maxima of SHG for Gd(III) and hyperpolarizability for Tb(III).48 Besides, it was reported [Ln(dma)5][W(CN)8] compounds exhibited diverse SHG properties with SH susceptibilities ranging from 4.7 × 10⁻¹² to 9.4 × 10⁻¹¹ esu.49 Furthermore, a smooth and continuous increase for both the CN stretching and bending modes in the Raman spectroscopy was reported for a sequence of samples [Ln(H2O)3][Au(CN)2]3 from larger Ln3+ ionic radius to smaller one, signifying great tuning effects via changing lanthanides.50 However, compared to the extensive studies for magnetic, luminescence, spectroscopic, and NLO properties for Ln(III) complexes, the lanthanide tuning effects have been rarely studied in the THz region.48–54 Concurrently, silver ions (Ag(I)) compounds have appeared to be noteworthy candidates to create THz absorbing materials. Notably, the phonon spectra of AgCN compound exhibit low-frequency THz peaks at ca. 4 meV (0.96 THz), and various Ag(I) complexes have been observed to manifest broad terahertz absorbing behaviors within the range of 0.2–3 THz.55,56
Therefore, in the present study, we prepared a series of [LnIII(H2O)3][AgI(CN)2]3 (LnAg, Ln = La, Ce, Pr, Nd, Sm, Eu, Gd, Tb, and Dy) complexes and investigated their tunable vibrational spectra and temperature-dependent THz absorption properties. Furthermore, we conducted density-functional theory (DFT) calculations of the THz spectra and performed impedance-matching simulations to validate the observed phenomena and potential applications.
Results and discussion
Structural studies
The crystallographic data of two representative crystals LaAg and DyAg, obtained as a result of a slow evaporation of the diluted aqueous solution containing LnCl3 (Ln = La(III) and Dy(III)) and K[Ag(CN)2], were collected at ca. 90 K in the single crystal X-ray diffraction measurement (refer to the details in the Experimental section, Table S1†). Both compounds are isostructural and crystallize in a three-dimensional (3D) network with a hexagonal P63/mcm space group. Analogously, the isostructural nature with the same space group aligns with observations in other reported dicyanoaurate and dicyanoargentate complexes in the literature.34,50,57–60 Nevertheless, the unit cell parameters (a, b, and c) and volumes (V) of DyAg are smaller than LaAg with a shrinkage of 1.4%, 1.4%, 3.0%, and 5.8% in a, b, c, and V, respectively, arising from the lanthanide contraction.61–63 The lanthanum(III) and dysprosium(III) ions are nine coordinates, including six nitrogen atoms originating from the cyanide ligand arranged in prismatic geometry and three coplanar oxygen atoms from the water (Fig. 1a). The average bond distances of 〈Ln–O〉 are 2.529(9) and 2.414(7) Å for LaAg and DyAg, respectively, slightly shorter than 2.653(7) Å for 〈La–N〉 and 2.505(5) Å for 〈Dy–N〉 (Table S2†). The linear configuration of [Ag(CN)2]− ions with average bond angles 〈Ag–C–N〉 of 178.7(8)° and 179.8(8)° for LaAg and DyAg, respectively, connects with two adjacent Ln(III) ions along the c-axis (Fig. 1b and Fig. S1, Table S3†).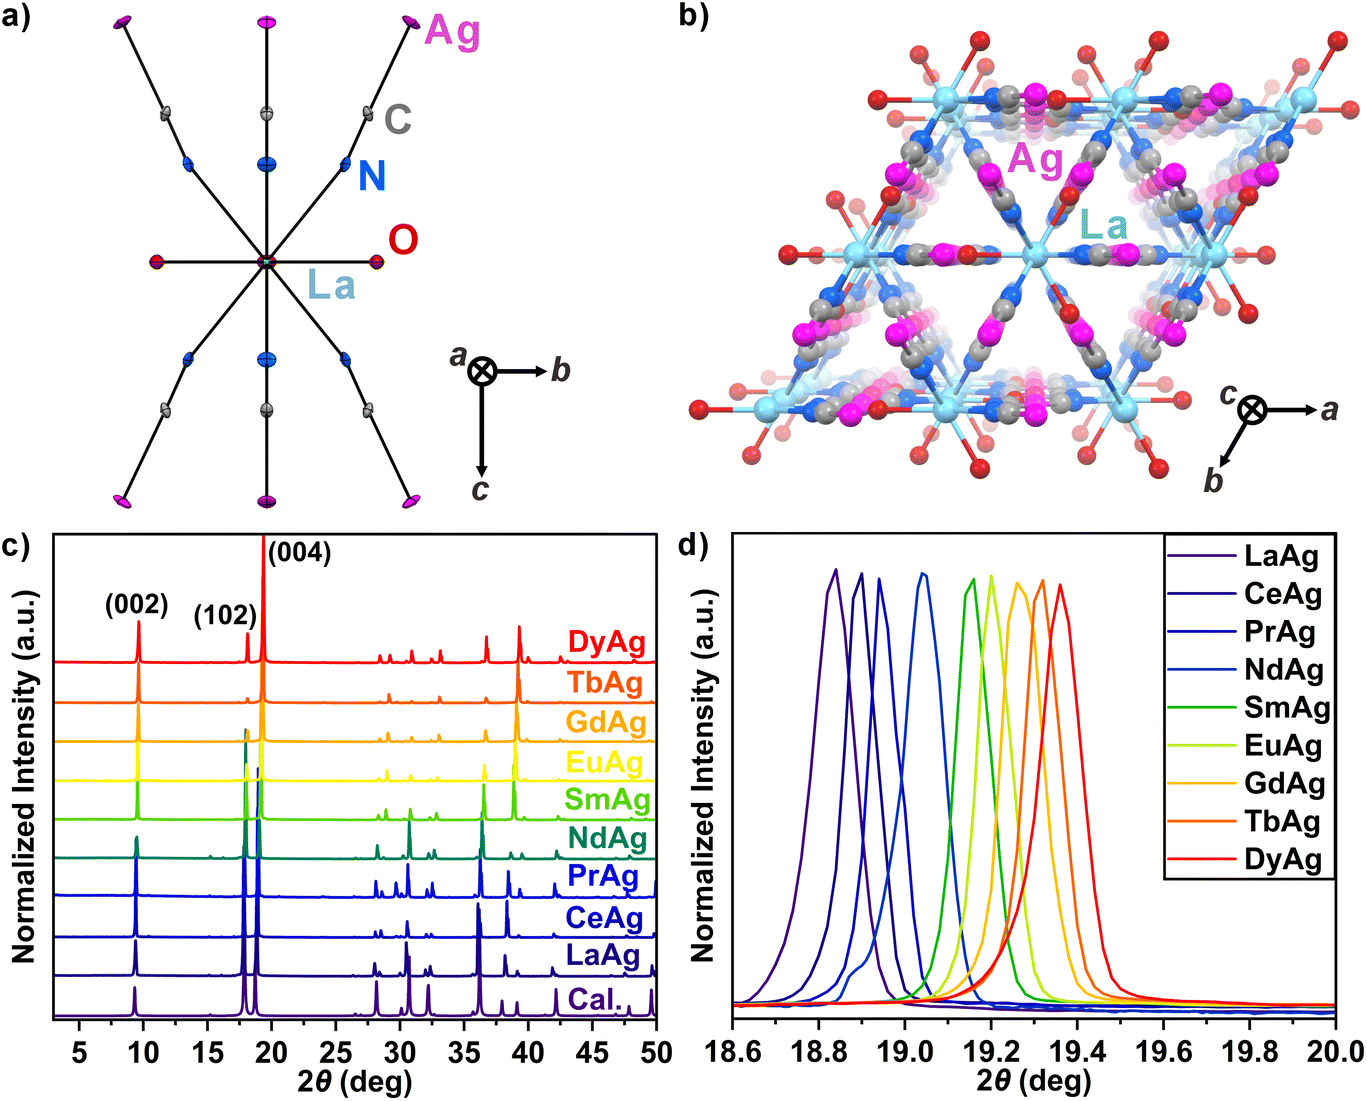 | ||
| Fig. 1 (a) Representative structural unit of LaAg with atoms labeling along the a-axis measured at 90 K. Thermal ellipsoids of 50% probability are shown. (b) Crystal packing of LaAg along the c-axis. Color: La, cyan; Ag, pink; C, dark gray; N, blue; O, red. All hydrogens are omitted for clarity. (c) Experimental powder X-ray diffraction (PXRD) patterns of different LnAg samples compared with the calculated (Cal.) one based on the single-crystal structure of LaAg at 90 K after normalization. The Miller indices are marked for three indicated peaks. (d) Normalized PXRD patterns for (004) Miller index of different LnAg samples in the zoomed region. | ||
Each Ag atom is arranged with four near Ag atoms in the ab-plane, thereby forming Ag–Ag interactions with typical distances of 3.3241(3) Å for LaAg and 3.2762(8) Å for DyAg (Table S2†). Such Ag–Ag interaction distances are comparable with the other isostructural complexes with different lanthanide ions.50,57,58 The 3D networks with argentophilic interactions as well as hydrogen-bonding interactions between the water and nitrogen atoms of cyanide lead to relatively robust thermal stability until 100 °C. Further heating results in the dehydration of three water molecules above 100 °C and the decomposition of cyanides exceeding ca. 200 °C (Fig. S2†).
The phase purity and isostructural nature of all nine single crystals and the powdered LnAg samples were confirmed by the good agreement between the experimental powder X-ray diffraction (PXRD) patterns and the simulated one based on the results of single-crystal X-ray analysis of the LaAg crystal structure (Fig. 1c). Moreover, the gradual shift of the peak position to higher 2θ angles is observed for three selected peaks with Miller indices (002), (102), and (004) from LaAg to DyAg (Fig. 1d and S3†), which agrees with the decreased unit cells, especially along c-axis, and volumes from crystallographic data. The tunable structural parameters concerning different Ln(III) ions open up possibilities of finely modulating the structure-related vibrational properties, especially in the rarely explored THz region, which depends on the crystal packing.
Vibrational properties
The infrared (IR) absorption and Raman scattering spectra were further investigated to elucidate the gradual transitions among diverse LnAg samples. The prominent features in the room-temperature IR spectra of LnAg comprise one principal ν(CN) stretching band between 2130 to 2170 cm−1, ν(O–H) symmetric and asymmetric stretching bands at ca. 3600 and 3534 cm−1, respectively, as well as δ(H–O–H) bending band at around 1609 cm−1 (Fig. 1a and S5†). In parallel, the Raman spectra of LnAg are characterized by one intense ν(CN) stretching band between 2150 to 2170 cm−1 and several bending modes between 250 to 450 cm−1, and weak Raman-active ν(O–H) stretching bands at ca. 3540 cm−1 (Fig. 1b and S6†). Some extra broad and intensive peaks are unexpectedly observed for EuAg (3260, 2088, 1913, and 947 cm−1) and SmAg (2535, 1913, 1703, 1673, and 818 cm−1), consistently observed across different positions of crystals and experimental settings. Such phenomenon can be explained by the fluorescence interference in Raman spectroscopy utilizing 532 nm lasers, which appears to correspond to the excitation process of EuAg and SmAg selectively to a higher electronic state and then relaxed to generate fluorescence light.34,64,65 The relatively inefficient Raman scattering can be easily masked by the fluorescence process, thereby leading to relatively weak ν(CN) and ν(O–H) signals.
Remarkably, a discernible and gradual shift in ν(CN) stretching frequencies for both IR and Raman spectra is observed from LaAg to DyAg (Fig. 2a and b). The IR-active ν(CN) stretching vibrations have slightly lower energies, ranging from 2150 to 2157 cm−1, whereas the Raman ν(CN) modes span from 2159 to 2163 cm−1. This shift demonstrates a linear correlation with the lanthanide ionic radii, within experimental error and setup resolution (Fig. 2c), akin to previously reported dicyanoaurate studies.58 The shift in the ν(CN) frequency associated with different LnAg samples is more obvious in IR spectra than in Raman spectra. In general, modifications in ν(CN) stretching bands originate from gradual changes in crystal structural unit cell parameters and volumes due to the systematic Shannon effective nine-coordinated ionic radius decrease in the lanthanide contraction phenomenon.61–63
 | ||
| Fig. 2 Normalized IR absorption (a) and Raman scattering (b) spectra of LnAg in the CN− stretching region. (c) Peak positions of the IR (blue) and Raman (orange) CN− stretching band for different LnAg samples analyzed by linear fitting with 95% confidence bands. | ||
Terahertz absorbing properties and first-principles calculations
Room-temperature (RT) THz absorption spectra for powders of LnAg were measured using THz-TDS to observe the low-frequency phonons. The THz absorption spectra in the measurement range of 0.5–1.5 THz reveal an intensive and sharp absorption signal between 1.0 and 1.2 THz with a maximum of around 1.1 THz for LaAg, CeAg, PrAg, and NdAg (Fig. 3a and S6†). Notably, this feature undergoes a gradual transition towards double peaks with a shoulder peak appearing at a higher frequency (ca. 1.15 THz) for samples SmAg, EuAg, GdAg, TbAg, and DyAg. The consistency and reproducibility of the peak position as well as splitting were further confirmed through multiple THz absorption measurements involving samples of varying thicknesses (Fig. S7†). As the amount of LnAg samples placed between sample holders increases, the absorbance increases simultaneously without altering the peak position. The multiple reflections between different interfaces barely impact the intense THz absorption signals (Fig. S8†). For precise determination of the peak position, the spectra were fitted with a single Lorentzian function (LaAg, CeAg, PrAg, and NdAg) and two Lorentzian functions (peak 1: higher frequency, peak 2: lower frequency) for SmAg, EuAg, GdAg, TbAg, and DyAg (Fig. 3c, d and Fig. S9, Table S4†). The THz spectral fitting unveils a gradual shift from the single peak at 1.090 THz for LaAg to peak 1 at 1.167 THz and peak 2 at 1.093 THz for DyAg. The approximately linear increase up to 74 GHz (0.074 THz) in frequency for both the single peak and peak 1 aligns coherently with the aforementioned IR spectra analysis (Fig. 3b). The low-temperature (liquid nitrogen, LN, T = 77 K) THz absorption spectra show a significant blueshift to a higher frequency for all LnAg samples (Fig. S10 and Table S4†). In particular, the most noticeable shift occurs for the PrAg sample with a change of 42 GHz, while LaAg, TbAg, and DyAg exhibit relatively modest responses of 14 GHz, 19 and 18 GHz (peaks 1 and 2), 19 and 24 GHz (peaks 1 and 2), respectively. Overall, the observed blue shifts, influenced by both lanthanide(III) ions and temperature-dependent factors, are attributable to the contraction in unit cell parameters and volume. Moreover, in comparison to room temperature, the full width at half maximum (FWHM) generally becomes narrower at low temperature for LnAg, aligning with the decrease in anharmonic thermal vibrations (Table S4†). The LnAg compounds with sharp absorbance together with narrow FWHM (ca. 100 GHz) show significant potential for providing efficient and selective shielding for THz radiations.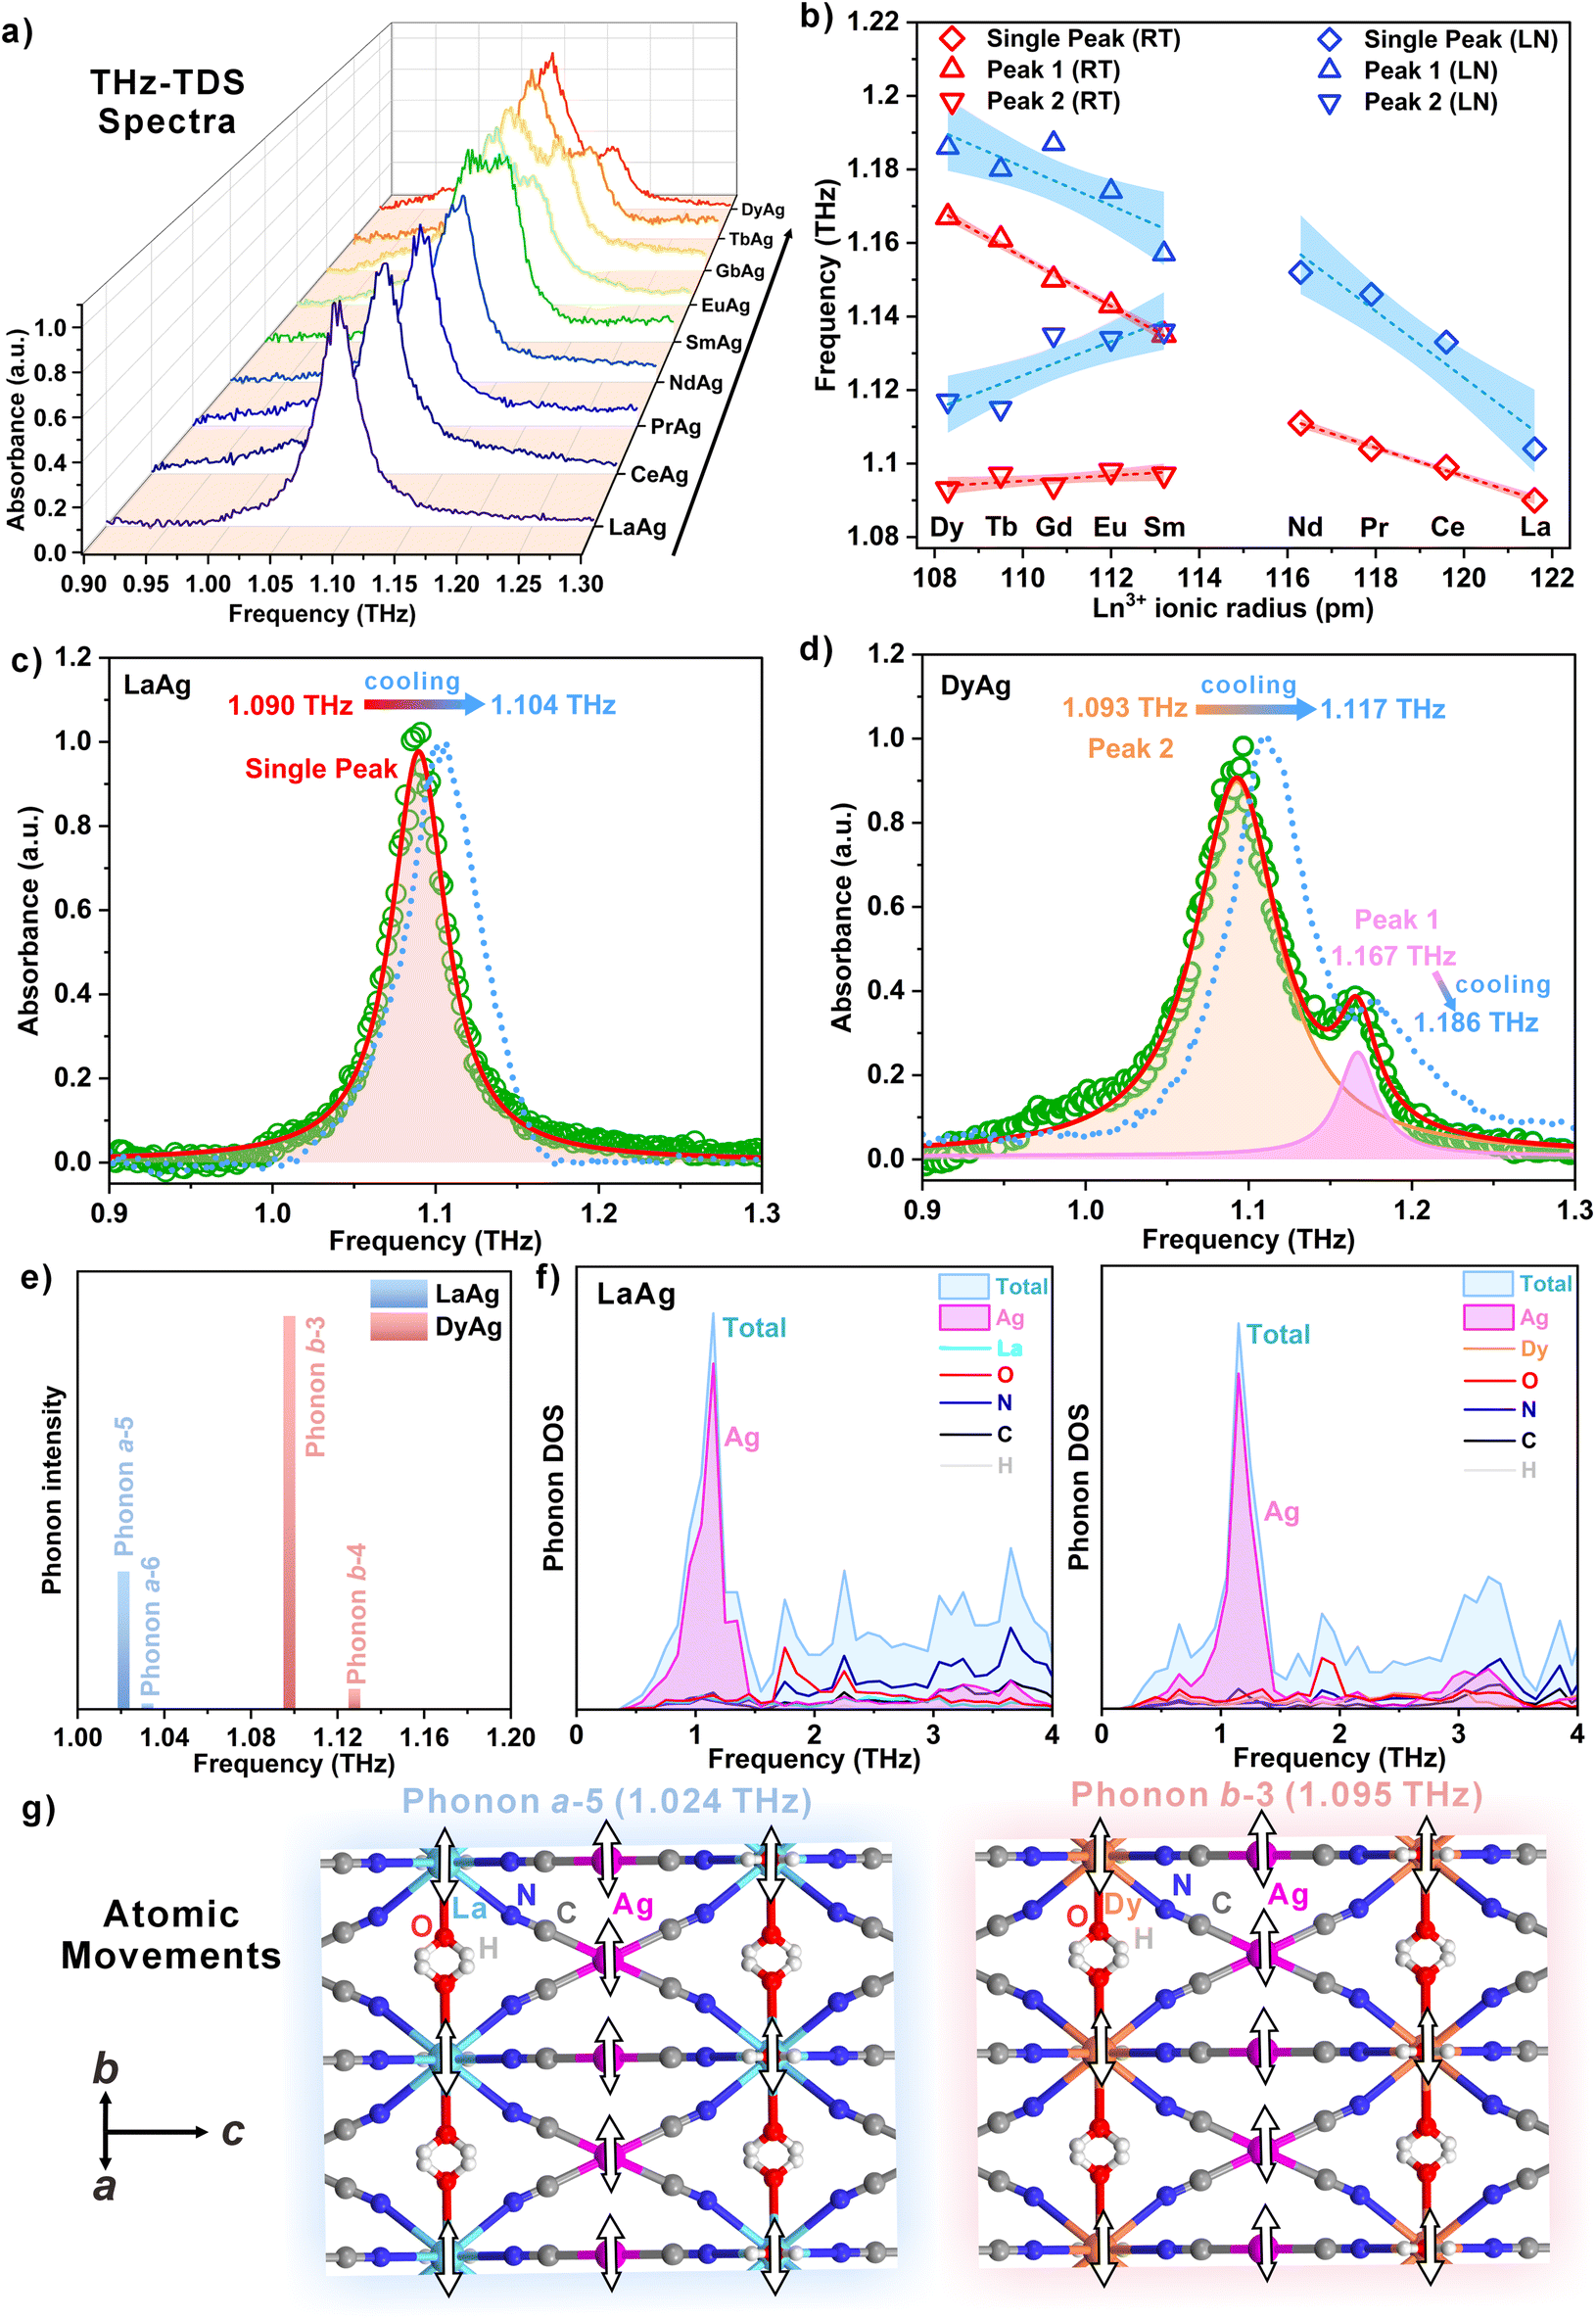 | ||
| Fig. 3 (a) Room-temperature (RT) THz-TDS spectra of different LnAg samples after normalization. (b) Peak positions of THz-TDS spectra determined by fitted with Lorentzian function at RT and liquid nitrogen (LN) temperatures for LnAg samples. Dotted lines and colored areas represent linear fitting with 85% confidence bands. The normalized RT THz-TDS spectra of LaAg (c) and DyAg (d) fitted with Lorentzian functions. Red lines show the fitted curves, colored peaks show the components of each peak, and green dots indicate the experimental data. The blue dotted lines show the THz-TDS spectra at LN temperature. (e) Vertical bars showing the position and relative intensities of the IR active phonon modes a for LaAg and b for DyAg at 1.024 THz (a-5), 1.035 THz (a-6), 1.095 THz (b-3), and 1.125 THz (b-4) in the indicated region. (f) Total phonon density of states (DOS) in light blue colored peaks of the LaAg (left) and DyAg (right) and partial phonon DOS of La, cyan line; Dy, orange line; Ag, pink colored peaks; O, red line; C, black line; N, blue line; H, grey line. (g) Atomic motion projections of the phonon modes for two main phonon modes a-5 and b-3. Color: La, cyan; Dy, orange; Ag, pink; C, dark gray; N, blue; O, red; H, light gray. The arrows indicate the vibration vectors. | ||
To further simulate these THz absorbances and gain deeper insights into their vibration origins, periodic DFT calculations of the phonon modes for LaAg and DyAg were performed starting from their experimentally determined crystal structures using the Vienna ab initio simulation package (VASP) and the PHONON code;66,67 see Experimental section for details. Previous reports have shown that first-principles calculations are effective tools to understand the properties and mechanisms of functional materials.68–70 In the case of the present compounds, the computed phonon modes show comparable phonon distribution and consist of IR active phonons for LaAg and DyAg defined as modes a and b, respectively, at 1.024 THz (a-5), 1.035 THz (a-6), 1.095 THz (b-3), and 1.125 THz (b-4) within the 1.0–1.2 THz range (Fig. 3e and Table S5†). The prominent infrared intensity observed in modes a-5 and b-3 can be assigned as transverse phonon modes with an IR active E1u irreducible representation, while modes a-6 and b-4 in much weaker intensity belong to longitudinal phonon modes with a mixture of 9A2u + 15E1u and 7A2u + 15E1u, respectively. Considering the table of irreducible representations of point group D6h (6/mmm) outlined in Table S6,† E1u and A2u correspond to the linear (x, y) and z functions, respectively. Notably, the higher frequency for DyAg phonon modes compared to LaAg phonon modes aligns with the blueshift in peak positions from LaAg to DyAg. Moreover, the substantial disparity in frequency (30 GHz) between phonon modes b-3 and b-4 for DyAg, in contrast to the 11 GHz difference for a-5 and a-6 in LaAg phonon modes, concurs with the experimentally observed peak splitting into a double peak for the latter lanthanides. The relatively reliable mimic of the experimental peak positions at low temperatures confirms the validity of the DFT THz calculation. Further analysis of the phonon density of states (phonon DOS) and phonon dispersion for LaAg and DyAg indicates similar distributions of partial DOS of atoms due to the isostructural nature of these compounds (Fig. 3f and S13, S14†). Particularly, in the low-frequency region, the largest contribution to the total phonon DOS originates from Ag atoms, followed by O atoms. Consequently, the experimental THz absorbance observed at approximately 1.1 THz is primarily from the Ag vibrations within the networks. Based on the video of the atomic movements (Fig. 3g and Fig. S15, Movie S1†), the major phonon vibrations a-5 and b-3 for LaAg and DyAg exhibit similarity and can be interpreted as the opposite translational modes of Ag atoms and H2O molecules around Ln atoms in the ab-plane. This computational approach significantly enhances our comprehension of the intricate phonon dynamics governing the observed THz absorbances in LnAg.
Meanwhile, to investigate the THz wave absorbing capability, impedance matching analyses were conducted to simulate the return loss (RL) in decibels (dB) based on fitted single Lorentzian function peak (LaAg, CeAg, PrAg, and NdAg) and the dominant peak 2 for SmAg, EuAg, GdAg, TbAg, and DyAg around 1.1 THz (Fig. 4 and S11, S12†),71–73 see Experimental section for details. As illustrated in Fig. 4a, the intensity of the reflected wave (blue line) diminishes across varying thicknesses when an incident THz wave (red line) is absorbed by LnAg absorbers on a metal plate. Remarkably, the minimum RL of −48.2 dB (100% absorption) and −39.2 dB (99.99% absorption) at 1.088 and 1.084 THz can be achieved with optimal 69 and 225 μm thicknesses for LaAg and DyAg, respectively. These optimal thicknesses correspond to the phase-matching condition, where the wave reflected on the surface of the absorber interferes with the wave reflected on the surface of the metal plate (Fig. 4c and d). In addition, based on the RL spectra at the optimal thicknesses, absorption intensities of −20 dB (99%) are satisfied over a wide range of 8 and 20 GHz for LaAg and DyAg, respectively (Fig. 4e and f); RL analyses for other LnAg samples are provided in the ESI (Fig. S11 and S12†). A comprehensive comparison of the THz wave absorbing performance for various LnAg samples is summarized in Fig. 4b. Generally, the results underscore that the LnAg compounds show an increase in effective bandwidth concerning thickness from LaAg to DyAg. In particular, GdAg possesses a superior effective bandwidth in 21 GHz, whereas the thinnest matching thickness (55 μm) can be achieved for PrAg. The simulations suggest that thin LnAg films possess a promising absorption performance at around 1.09 THz with a substantial return loss (<−20 dB) value across the maximum 21 GHz frequency range.
 | ||
| Fig. 4 Impedance matching analysis for the peak around 1.10 THz of LnAg. (a) Schematic illustration of THz absorber based on impedance matching. Irradiating an incident THz wave (red line) into LnAg absorbers on a metal plate minimizes the reflective wave (blue line) intensity in different thicknesses. (b) Comparison of THz wave absorbing performance for different LnAg samples. Colormaps depicting the RL intensity in dB as a function of frequency and thickness for LaAg (c) and DyAg (d) from impedance matching simulations. The white dash lines denote the optimal thickness with the largest RL intensity. The calculated RL spectra of the LaAg thin film (e) and DyAg thin film (f) from impedance matching simulations in the optimal thicknesses of 69 and 225 μm, respectively. The violet arrows mark the effective bandwidth (GHz) at −20 dB return loss. | ||
Compared to other state-of-the-art THz EM interference shielding materials in the literature, such as graphene foam, polymer composites, and two-dimensional transition metal carbides or nitrides materials, they usually reveal very broad THz shielding properties ranging from 0.2 to 2 THz.74–76 This work presents an easy preparation for a series of coordination complexes with a sharp and intense THz shielding performance exclusively around 1.09 THz with a narrow range. The tunable THz shielding effect from lanthanides allows the fine blocking of THz radiation in a specific and narrow range as a potential candidate for adjustable THz filters. Moreover, it should be noted that the wide optical transparency of most of LnAg was determined using solid-state UV-Vis-NR absorption spectroscopy (Fig. S4†), which offers the feasibility of optical window while shielding THz radiations simultaneously and presents potential applications for future THz devices.
Conclusions
In this work, a sequence of nine [LnIII(H2O)3][AgI(CN)2]3 (LnAg, Ln = La, Ce, Pr, Nd, Sm, Eu, Gd, Tb, and Dy) complexes were prepared and investigated their tunable vibrational spectra and temperature-dependent THz absorption properties systematically. It is noteworthy that all LnAg samples exhibit robust and adjustable absorptions with narrow FWHM, demonstrating significant responsiveness to variations in lanthanide(III) ion or temperature in the range of 1.0 to 1.2 THz and displaying commendable reproducibility. Impedance matching calculations support the feasibility of preparing thin THz absorbing films with thicknesses less than 0.3 mm, yielding a significant return loss value in a broad frequency range.In addition, advanced periodic DFT calculations based on the single-crystal structures of LaAg and DyAg reliably reproduce the experimental spectra within the computation approximation and highlight the immense potential to facilitate THz-absorbing materials by modifying the structural elements identified in the theoretical calculations. Further modulations may be realized by replacing the Ln(III) ions with other transition metals or by modifying the dicyanoargentate with other building blocks to meet the requirements of beyond 5G communication technologies. This comprehensive study opens up a novel and facile pathway for the design and tuning effects of THz waves, significantly contributing to our understanding of vibrations in the low-frequency domain.
Experimental
Materials
All starting materials: lanthanum(III) chloride heptahydrate, cerium(III) chloride heptahydrate, praseodymium(III) chloride heptahydrate, neodymium(III) chloride hexahydrate, samarium(III) chloride heptahydrate, europium(III) chloride hexahydrate, gadolinium(III) chloride hexahydrate, terbium(III) chloride hexahydrate, dysprosium(III) chloride hexahydrate, and potassium dicyanidoargentate(I) were purchased from Sigma-Aldrich and Wako Pure Chemical Industries and utilized without further purification.Caution! The cyanide compounds are toxic and should be handled with care.
General synthetic procedures for [LnIII(H2O)3][AgI(CN)2]3 (LnAg, Ln = La, Ce, Pr, Nd, Sm, Eu, Gd, Tb, and Dy) complexes
The reaction of a 0.3 mmol aqueous solution of LnCl3·6H2O (3 mL) with a 0.9 mmol solution of K[Ag(CN)2] in an H2O solution (3 mL) with vigorous stirring for 3 hours resulted in the formation of precipitation, from which the powder solids were collected by filtration under normal pressure and dried under the ambient conditions. The remaining solutions of LaAg and DyAg were evaporated slowly at room temperature inside a dark chamber to avoid photodecomposition and their crystals formed in a week. The crystalline and powder materials were used for further investigations. In addition, it should be noted that an analogous lanthanoid series of elements, specifically Y, Ho, Er, Tm, Yb, and Lu, was employed to synthesize similar compounds incorporating [Ag(CN)2]− ions based on identical synthetic procedures. However, the resultant samples predominantly comprised decomposed AgCN, associated with the smaller Ln(III) ion radius and the consequential collapse of the networks, which will not be considered in this work.N)]. Raman (crystal, cm−1): 2159vs [ν(CN)].
N)]. Raman (crystal, cm−1): 2159vs [ν(CN)].
N)]. Raman (crystal, cm−1): 2159vs [ν(CN)].
N)]. Raman (crystal, cm−1): 2160vs [ν(CN)].
N)]. Raman (crystal, cm−1): 2161vs [ν(CN)].
N)]. Raman (crystal, cm−1): 2162vs [ν(CN)].
N)]. Raman (crystal, cm−1): 2162vs [ν(CN)].
N)]. Raman (crystal, cm−1): 2163vs [ν(CN)].
N)]. Raman (crystal, cm−1): 2163vs [ν(CN)].
X-Ray crystallography
Pristine crystals of LaAg and DyAg submerged in Paratone (Hampton Research) oil, were mounted with a 100 μm Dual Thickness MicroMount™ (MiTeGen) loop and cooled down to 90 K in a cold nitrogen gas stream. X-ray diffraction data were collected with a Rigaku R-AXIS RAPID diffractometer equipped with an imaging plate area detector using graphite monochromated Mo-Kα radiation [λ = 0.71075 Å]. Data integration was performed by Rigaku RAPID AUTO software. Structures were solved by direct methods using SHELXS-97 incorporated in the Crystal Structure 4.0 crystallographic software package and refined using an F2 full-matrix least squares technique of SHELXL-2019/3 included in the OLEX-2 1.5 software package.77,78 Anisotropic refinement was performed for all non-hydrogen atoms, while hydrogen atoms were positioned with the help of the electron density map. Due to the presence of two heavier elements, La and Ag, and Dy and Ag for LaAg and DyAg, respectively, in the densely packed crystal structure, we observed strong diffuse scattering of X-rays with smaller density unassignable Q peaks. All attempts to solve this issue by introducing several disorder models did not improve refinement parameters. Therefore, residual density appeared due to the presence of heavier elements and defects in the crystal. Crystal data, data collection, and refinement parameters were gathered in ESI (Table S1†). CCDC numbers 2339311 and 2339312 contain the supplementary crystallographic data for LaAg and DyAg, respectively.† The structural models presented as figures were prepared with the use of the CCDC Mercury 3.10 visualization software.79 Powder X-ray diffraction patterns at room temperature were collected for powdered samples placed on Si plates with a RIGAKU MiniFlex diffractometer equipped with monochromated Cu-Kα radiation (λ = 1.5406 Å).Physical characterizations
Elemental analyses (C, H, and N) were conducted with an Elementar Analysensysteme GmbH: vario MICRO cube. All infrared absorption spectra were collected with a JASCO FT/IR-4100 spectrometer for samples dispersed in the KBr pellet. JASCO NRS-7500 laser Raman spectrometer, equipped with a 532.12 nm laser (power = 0.8 mW), single monochromator, MPLFLN 20×/100× objective lens, BS 30/70, and 1–5% (OD 1.3) attenuator, was used to perform Raman spectroscopy in the range of 4000–100 cm−1 (L 600/B 500 nm grating, 10 × 1000 μm slit, d-4000 μm aperture) on the single crystals of all samples in the reflectance mode. The terahertz (THz) wave absorption measurements at room temperature were conducted by compressing samples into pellets (diameter = 1.00 cm) of different thicknesses and masses between two white polyethylene plates using Advantest TAS7400TS THz-TDS in the transmittance mode. The thicknesses were determined five times for different pellet positions by the electronic outside micrometer with 0.001 mm resolution. For the THz-TDS measurements at liquid nitrogen temperature, the pellets of samples between two polyethylene plates were placed in a liquid-nitrogen-cooled cryostat (Oxford Instruments) connected to the digital temperature controller. Thermogravimetric analyses were performed on a Rigaku Thermo Plus TG8120 in the 25–400 °C range in dry air with a 2 °C min−1 heating rate and Al2O3 as reference material.First-principles calculations
Periodic structure calculations were performed for LaAg and DyAg utilizing experimental crystal structures by using the Vienna ab initio Simulation Package (VASP).66,67 The 1 × 1 × 1 structures were fully optimized with convergence energy of 1.0 × 10⁻⁹ eV and the maximal residual forces on each atom less than 0.0001 eV Å−1. The optimized 1 × 1 × 1 structures of LaAg and DyAg are used for further phonon calculations by the direct method implemented in the Phonon code with displacements of 1 pm.80 The correlation energy was calculated using the generalized gradient approximation developed by Perdew, Burke, and Ernzerhof (GGA-PBE).81 A plane-wave basis set was used with a cut-off energy of 400 eV throughout the calculations. The k-mesh of 3 × 3 × 1 for both LaAg and DyAg were used for the Brillouin zone samplings.Impedance matching analysis
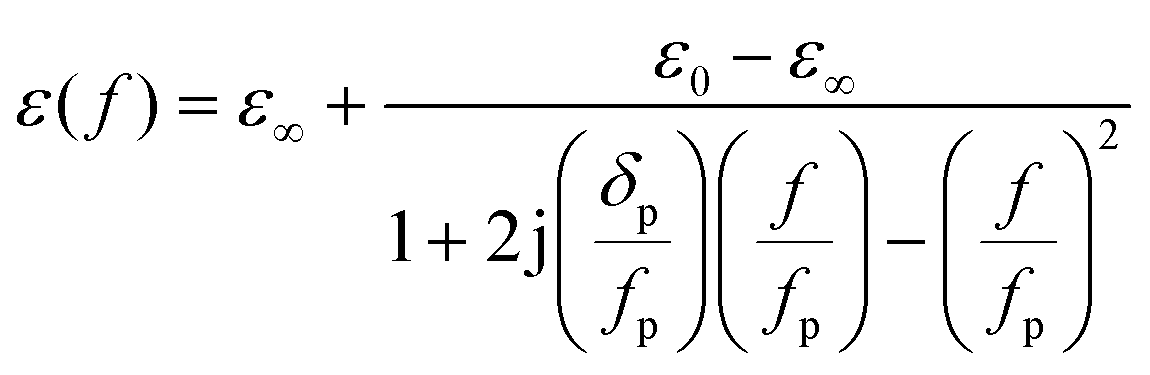
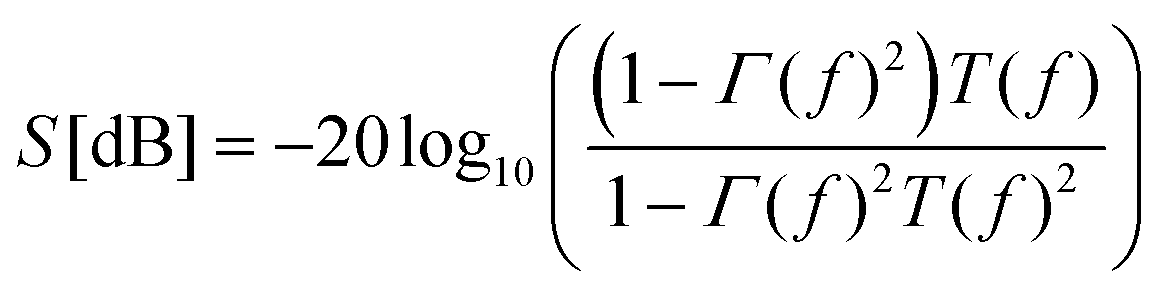
In the impedance matching analysis, a metal-backed THz wave absorber model composed of LnAg was designed.72,73 When a THz wave is vertically incident to a LnAg sheet applied on a reflective metal plate, interference occurs between the electromagnetic wave reflected on the surface of the sheet and the metal plate. The suitable thickness was simulated that exhibits maximum absorption by canceling out the reflected wave on the metal plate with that on the surface of the absorbers. Such a decrease in the reflection intensity is expressed by the return loss (RL) [dB], which is the amount of light reflected toward the source. It can be estimated through eqn (1) by using the normalized input impedance, Zin. | (1) |
 | (2) |
As for obtaining the permittivity εnew(f) in eqn (2), the observed THz wave absorption spectra for compounds LnAg were fitted with Lorentzian functions. The fitted single Lorentzian function peak (LaAg, CeAg, PrAg, and NdAg) and Lorentzian function peak 2 (lower frequency) for SmAg, EuAg, GdAg, TbAg, and DyAg around 1.1 THz were used for the impedance matching analyses. The frequency-dependent permittivity ε(f) of the compound was calculated by deciding ε0, ε∞, and calculated peak frequency fp in eqn (3), which gave the minimum difference between the calculated absorption and the decomposed peak. The ε0 and ε∞ are the permittivities when the frequency is close to 0 and infinite, respectively.
 | (3) |
Calculated absorption S was obtained from eqn (4).
 | (4) |
 | (5) |
 | (6) |
In eqn (5), frequency-dependent permeability μ(f) was set to 1. The permittivity εnew(f) of the measured sample was calculated by applying eqn (7). Vair and V3 are the fill rate of air and LnAg in the measured pellet.
| εnew(f) = Vairεair + V3ε(f) | (7) |
Using the calculated permittivity εnew(f) in eqn (1), the optimal sample thickness was obtained with the change of thickness and frequency, and the minimum value of return loss was around 1.10 THz.
Author contributions
G. L. – conceptualization, data curation, formal analysis, funding acquisition, investigation, methodology, project administration, validation, visualization, writing – original draft. O. S. – conceptualization, data curation, formal analysis, funding acquisition, investigation, methodology, project administration, supervision, validation, visualization. K. K. – formal analysis, funding acquisition, investigation, methodology, validation, visualization. Y. M. – data curation, formal analysis, funding acquisition, investigation, validation, visualization. L. W. – formal analysis, funding acquisition, investigation, validation, visualization. K. N. – funding acquisition, validation, visualization. M. Y. – formal analysis, validation, visualization. N. F. C. – formal analysis, funding acquisition, supervision, validation, visualization. S. O. – conceptualization, data curation, funding acquisition, methodology, resources, project administration, supervision, validation, visualization.Conflicts of interest
There are no conflicts to declare.Acknowledgements
This work was financed in part by a JSPS Grant-in-Aid for Scientific Research (A) (Grant Number 20H00369), IRL DYNACOM (CNRS), the CNRS-University of Tokyo “Excellence Science” Joint Research Program, and the Second CNRS – University of Tokyo PhD Joint Program. The authors acknowledge the Cryogenic Research Center, The University of Tokyo, the Center for Nano Lithography & Analysis, The University of Tokyo supported by MEXT, and the MEXT Quantum Leap Flagship Program (Grant Number JPMXS0118068681) for the support. G. L. is grateful to JSPS KAKENHI (Grant Number 23KJ0736). O. S. is thankful to JSPS KAKENHI (Grant Number 21K14582). K. K. acknowledges a Grant-in-Aid for JSPS fellows (Grant Number 23K19238). Y. M. and L. W. thank the JST SPRING (Grant Number JPMJSP2108). K. N. recognizes the Iketani Science and Technology Foundation (Grant Number 0351111-A). M. Y. is grateful to JSPS Grant-in-Aid for Young Scientists (Grant Number JP24K17606). N. F. C. thanks The University of Manchester and The Australian National University for their support.Notes and references
- Sensing with Terahertz Radiation, ed. D. Mittleman, Springer Series in Optical Sciences, Berlin, 2003 Search PubMed.
- B. Ferguson and X.-C. Zhang, Materials for terahertz science and technology, Nat. Mater., 2002, 1, 26–33 CrossRef CAS PubMed.
- C. A. Schmuttenmaer, Exploring Dynamics in the Far-Infrared with Terahertz Spectroscopy, Chem. Rev., 2004, 104, 1759–1779 CrossRef CAS PubMed.
- R. Köhler, A. Tredicucci, F. Beltram, H. E. Beere, E. H. Linfield, A. G. Davies, D. A. Ritchie, R. C. Iotti and F. Rossi, Terahertz semiconductor-heterostructure laser, Nature, 2002, 417, 156–159 CrossRef PubMed.
- P. H. Siegel, Terahertz technology, IEEE Trans. Microwave Theory Tech., 2002, 50, 910–928 CrossRef.
- M. Tonouchi, Cutting-edge terahertz technology, Nat. Photonics, 2007, 1, 97–105 CrossRef CAS.
- K. Kawase, Y. Ogawa, Y. Watanabe and H. Inoue, Non-destructive terahertz imaging of illicit drugs using spectral fingerprints, Opt. Express, 2003, 11, 2549–2554 CrossRef CAS PubMed.
- E. Collet, G. Azzolina, T. Ichii, L. Guerin, R. Bertoni, A. Moréac, M. Cammarata, N. Daro, G. Chastanet, J. Kubicki, K. Tanaka and S. F. Matar, Lattice phonon modes of the spin crossover crystal [Fe(phen)2(NCS)2] studied by THz, IR, Raman spectroscopies and DFT calculations, Eur. Phys. J. B, 2019, 92, 12 CrossRef.
- H. Suzuki, C. Otani, N. Yoshinari and T. Konno, A terahertz absorption spectroscopy study of structural changes in D-penicillaminato CuI8CuII6 clusters induced by water desorption, Inorg. Chem. Front., 2016, 3, 274–278 RSC.
- J. Neu and C. A. Schmuttenmaer, Tutorial: An introduction to terahertz time domain spectroscopy (THz-TDS), J. Appl. Phys., 2018, 124, 231101 CrossRef.
- N. Wang, J. Deng, J. Chen and X. Xing, Phonon spectrum attributes for the negative thermal expansion of MZrF6 (M = Ca, Mn–Ni, Zn), Inorg. Chem. Front., 2019, 6, 1022–1028 RSC.
- T. Yoshida, K. Nakabayashi, H. Tokoro, M. Yoshikiyo, A. Namai, K. Imoto, K. Chiba and S. Ohkoshi, Extremely low-frequency phonon material and its temperature- and photo-induced switching effects, Chem. Sci., 2020, 11, 8989–8998 RSC.
- G. Li, O. Stefanczyk, K. Kumar, Y. Mineo, K. Nakabayashi and S. Ohkoshi, Low-Frequency Sub-Terahertz Absorption in HgII–XCN–FeII (X = S, Se) Coordination Polymers, Angew. Chem., Int. Ed., 2023, 62, e202214673 CrossRef CAS PubMed.
- M. A. Palacios, I. F. Díaz-Ortega, H. Nojiri, E. A. Suturina, M. Ozerov, J. Krzystek and E. Colacio, Tuning magnetic anisotropy by the π-bonding features of the axial ligands and the electronic effects of gold(I) atoms in 2D {Co(L)2[Au(CN)2]2}n metal–organic frameworks with field-induced single-ion magnet behaviour, Inorg. Chem. Front., 2020, 7, 4611–4630 RSC.
- A. Świtlicka, B. Machura, A. Bieńko, S. Kozieł, D. C. Bieńko, C. Rajnák, R. Boča, A. Ozarowski and M. Ozerov, Non-traditional thermal behavior of Co(II) coordination networks showing slow magnetic relaxation, Inorg. Chem. Front., 2021, 8, 4356–4366 RSC.
- M. Ksiądzyna, V. Kinzhybalo, A. Bieńko, W. Medycki, R. Jakubas, C. Rajnák, R. Boča, A. Ozarowski, M. Ozerov and A. Piecha-Bisiorek, Symmetry-breaking phase transitions, dielectric and magnetic properties of pyrrolidinium-tetrahalidocobaltates, Inorg. Chem. Front., 2022, 9, 2353–2364 RSC.
- P. U. Jepsen, D. Cooke and M. Koch, Terahertz spectroscopy and imaging – Modern techniques and applications, Laser Photonics Rev., 2011, 5, 124–166 CrossRef CAS.
- L. Yang, T. Guo, X. Zhang, S. Cao and X. Ding, Toxic chemical compound detection by terahertz spectroscopy: a review, Rev. Anal. Chem., 2018, 37, 20170021 CAS.
- A. Gong, Y. Qiu, X. Chen, Z. Zhao, L. Xia and Y. Shao, Biomedical applications of terahertz technology, Appl. Spectrosc. Rev., 2020, 55, 418–438 CrossRef CAS.
- Z. Wang, Y. Xu, T. Feng, C. Lei, Y. Zhao and X. Zhu, Tera-hertz (THz) catalysis on MXene for enhanced selectivity from CO2 to CO, Inorg. Chem. Front., 2023, 10, 2903–2910 RSC.
- K. Wang and D. M. Mittleman, Metal wires for terahertz wave guiding, Nature, 2004, 432, 376–379 CrossRef CAS PubMed.
- S. Koenig, D. Lopez-Diaz, J. Antes, F. Boes, R. Henneberger, A. Leuther, A. Tessmann, R. Schmogrow, D. Hillerkuss, R. Palmer, T. Zwick, C. Koos, W. Freude, O. Ambacher, J. Leuthold and I. Kallfass, Wireless sub-THz communication system with high data rate, Nat. Photonics, 2013, 7, 977–981 CrossRef CAS.
- T. Nagatsuma, G. Ducournau and C. C. Renaud, Advances in terahertz communications accelerated by photonics, Nat. Photonics, 2016, 10, 371–379 CrossRef CAS.
- S. Dang, O. Amin, B. Shihada and M.-S. Alouini, What should 6G be?, Nat. Electron., 2020, 3, 20–29 CrossRef.
- M. Zdrojek, J. Bomba, A. Lapińska, A. Dużyńska, K. Żerańska-Chudek, J. Suszek, L. Stobiński, A. Taube, M. Sypek and J. Judek, Graphene-based plastic absorber for total sub-terahertz radiation shielding, Nanoscale, 2018, 10, 13426–13431 RSC.
- N. Wongkasem, Electromagnetic pollution alert: Microwave radiation and absorption in human organs and tissues, Electromagn. Biol. Med., 2021, 40, 236–253 CrossRef CAS PubMed.
- R. Song, Z. Wang, Y. Hui, N. Zhang, R. Fang, J. Zhang, Y. Wu, Q. Ge, K. S. Novoselov and D. He, Comparison of copper and graphene-assembled films in 5G wireless communication and THz electromagnetic-interference shielding, Proc. Natl. Acad. Sci. U. S. A., 2023, 120, e2209807120 CrossRef CAS PubMed.
- A. L. Goodwin, M. Calleja, M. J. Conterio, M. T. Dove, J. S. O. Evans, D. A. Keen, L. Peters and M. G. Tucker, Colossal Positive and Negative Thermal Expansion in the Framework Material Ag3[Co(CN)6], Science, 2008, 319, 794–797 CrossRef CAS PubMed.
- E. Colacio, J. Ruiz, A. J. Mota, M. A. Palacios, E. Cremades, E. Ruiz, F. J. White and E. K. Brechin, Family of Carboxylate- and Nitrate-diphenoxo Triply Bridged Dinuclear NiIILnIII Complexes (Ln = Eu, Gd, Tb, Ho, Er, Y): Synthesis, Experimental and Theoretical Magneto-Structural Studies, and Single-Molecule Magnet Behavior, Inorg. Chem., 2012, 51, 5857–5868 CrossRef CAS PubMed.
- S. Goswami, A. K. Mondala and S. Konar, Nanoscopic molecular magnets, Inorg. Chem. Front., 2015, 2, 687–712 RSC.
- E. Clerich, S. Affès, E. Anticó, X. Fontrodona, F. Teixidor and I. Romero, Molecular and supported ruthenium complexes as photoredox oxidation catalysts in water, Inorg. Chem. Front., 2022, 9, 5347–5359 RSC.
- C. A. Gould, K. R. McClain, D. Reta, J. G. C. Kragskow, D. A. Marchiori, E. Lachman, E.-S. Choi, J. G. Analytis, R. D. Britt, N. F. Chilton, B. G. Harvey and J. R. Long, Ultrahard magnetism from mixed-valence dilanthanide complexes with metal-metal bonding, Science, 2022, 375, 198–202 CrossRef CAS PubMed.
- G. Li, O. Stefanczyk, K. Kumar, K. Imoto, K. Nakabayashi and S. Ohkoshi, Thermometric Properties of Thio/Selenocyanato-Bridged Spin-Crossover Networks, Chem. Mater., 2023, 35, 9613–9622 CrossRef CAS.
- K. Kumar, G. Li, O. Stefanczyk, S. Chorazy, K. Nakabayashi and S. Ohkoshi, Slow magnetic relaxation in Nd(III) and Sm(III) complexes formed in three-dimensional lanthanide-dicyanidometallate(I) frameworks exhibiting luminescent properties, J. Mater. Chem. C, 2023, 11, 1008–1020 RSC.
- G. Li, O. Stefanczyk, K. Kumar, K. Nakabayashi and S. Ohkoshi, Nonlinear Optical and Magnetic Properties of FeII-SCN-HgII Isomers: Centrosymmetric Layers and Chiral Networks, Inorg. Chem., 2023, 62, 3278–3287 CrossRef CAS PubMed.
- K. Jędrzejowska, J. Kobylarczyk, D. Tabor, M. Srebro-Hooper, K. Kumar, G. Li, O. Stefanczyk, T. M. Muzioł, K. Dziedzic-Kocurek, S. Ohkoshi and R. Podgajny, Nonlinear and Emissive {[MIII(CN)6]3−⋯Polyresorcinol} (M = Fe, Co, Cr) Cocrystals Exhibiting an Ultralow Frequency Raman Response, Inorg. Chem., 2024, 63, 1803–1815 CrossRef PubMed.
- O. Stefanczyk, K. Kumar, T. Pai, G. Li and S. Ohkoshi, Integration of Trinuclear Triangle Copper(II) Secondary Building Units in Octacyanidometallates(IV)-Based Frameworks, Inorg. Chem., 2022, 61, 8930–8939 CrossRef CAS PubMed.
- F. Ma, F. Mi, M. Sun, T. Huang, Z. Wang, T. Zhang and R. Cao, A highly stable Zn9-pyrazolate metal–organic framework with metallosalen ligands as a carbon dioxide cycloaddition catalyst, Inorg. Chem. Front., 2022, 9, 1812–1818 RSC.
- N. Panagiotou, F. G. Moscoso, T. Lopes-Costa, J. M. Pedrosa and A. J. Tasiopoulos, 2-Dimensional rare earth metal–organic frameworks based on a hexanuclear secondary building unit as efficient detectors for vapours of nitroaromatics and volatile organic compounds, Inorg. Chem. Front., 2022, 9, 4850–4863 RSC.
- G. Li, O. Stefanczyk, F. Jia, S. Nagashima, K. Kumar, K. Imoto, H. Tokoro and S. Ohkoshi, Mechanical Exfoliation of Multilayer Pseudohalogen-Bridged Nanosheets, J. Phys. Chem. Lett., 2023, 14, 10420–10426 CrossRef CAS PubMed.
- Q. Song, O. Stefanczyk, G. Li, K. Kumar, K. Nakamura, K. Nakabayashi and S. Ohkoshi, Water-Solvation-Dependent Spin Transitions in Cobalt(II)-Octacyanidometallate Complexes, Eur. J. Inorg. Chem., 2023, 26, e202300307 CrossRef CAS.
- L. Armelao, S. Quici, F. Barigelletti, G. Accorsi, G. Bottaro, M. Cavazzini and E. Tondello, Design of luminescent lanthanide complexes: From molecules to highly efficient photo-emitting materials, Coord. Chem. Rev., 2010, 254, 487–505 CrossRef CAS.
- K. Kumar, O. Stefanczyk, K. Nakabayashi, K. Imoto and S. Ohkoshi, Studies of Er(III)–W(V) compounds showing nonlinear optical activity and single-molecule magnetic properties, CrystEngComm, 2019, 21, 5882–5889 RSC.
- C. D. Buch, S. H. Hansen, C. M. Tram, D. Mitcov and S. Piligkos, Functionalized Trigonal Lanthanide Complexes: A New Family of 4f Single-Ion Magnets, Inorg. Chem., 2020, 59, 16328–16340 CrossRef CAS PubMed.
- A. Mondal, M. Raizada, P. K. Sahu and S. Konar, A new family of Fe4Ln4 (Ln = DyIII, GdIII, YIII) wheel type complexes with ferromagnetic interaction, magnetocaloric effect and zero-field SMM behavior, Inorg. Chem. Front., 2021, 8, 4625–4633 RSC.
- J. G. C. Kragskow, J. Marbey, C. D. Buch, J. Nehrkorn, M. Ozerov, S. Piligkos, S. Hill and N. F. Chilton, Analysis of vibronic coupling in a 4f molecular magnet with FIRMS, Nat. Commun., 2022, 13, 825 CrossRef CAS PubMed.
- J. Wang, J. J. Zakrzewski, M. Zychowicz, Y. Xin, H. Tokoro, S. Chorazy and S. Ohkoshi, Desolvation-Induced Highly Symmetrical Terbium(III) Single-Molecule Magnet Exhibiting Luminescent Self-Monitoring of Temperature, Angew. Chem., Int. Ed., 2023, 62, e202306372 CrossRef CAS PubMed.
- G. L. Law, K. L. Wong, K. K. Lau, S. Lap, P. A. Tanner, F. Kuo and W. T. Wong, Nonlinear optical activity in dipolar organic-lanthanide complexes, J. Mater. Chem., 2010, 20, 4074–4079 RSC.
- K. Kumar, O. Stefanczyk, N. F. Chilton, K. Nakabayashi, K. Imoto, R. E. P. Winpenny and S. Ohkoshi, Magnetic Properties and Second Harmonic Generation of Noncentrosymmetric Cyanido-Bridged Ln(III)–W(V) Assemblies, Inorg. Chem., 2021, 60, 12009–12019 CrossRef CAS PubMed.
- P. A. Tanner, X. Zhou, W.-T. Wong, C. Kratzer and H. Yersin, Structure and Spectroscopy of Tb[Au(CN)2]3·3H2O, J. Phys. Chem. B, 2005, 109, 13083–13090 CrossRef CAS PubMed.
- R. L. Ayscue, C. P. Verwiel, J. A. Bertke and K. E. Knope, Excitation-Dependent Photoluminescence Color Tuning in Lanthanide-Organic Hybrid Materials, Inorg. Chem., 2020, 59, 7539–7552 CrossRef CAS PubMed.
- L. Bogani, L. Cavigli, K. Bernot, R. Sessoli, M. Gurioli and D. Gatteschi, Evidence of intermolecular p-stacking enhancement of second-harmonic generation in a family of single chain magnets, J. Mater. Chem., 2006, 16, 2587–2592 RSC.
- Z.-Q. Wang, L.-Z. Sun, X.-N. Kuang, Y.-L. Lu, Y.-Y. Li, Y.-P. Yang, J.-M. Liu, Y.-Y. Niu and Q.-H. Jin, Intermolecular interactions, photocatalysis and THz-TDS interrelationships for lanthanide phosphine oxide complexes based on {PW12}, Environ. Res., 2022, 203, 111873 CrossRef CAS PubMed.
- Y. Ma, Y.-S. Yang, Y.-H. Jiang, Y.-X. Li, M. Liu, Z.-F. Li, H.-L. Han, Y.-P. Yang, X.-L. Xin and Q.-H. Jin, Lanthanide contraction and chelating effect on a new family of lanthanide complexes with tetrakis(O-isopropyl)methyle-nediphosphonate: synthesis, structures and terahertz time-domain spectroscopy, RSC Adv., 2017, 7, 41651–41666 RSC.
- M. K. Gupta, B. Singh, R. Mittal, S. Rols and S. L. Chaplot, Lattice dynamics and thermal expansion behavior in the metal cyanides MCN (M = Cu, Ag, Au): Neutron inelastic scattering and first-principles calculations, Phys. Rev. B, 2016, 93, 134307 CrossRef.
- Y. Wang, X.-N. Kuang, Y.-Z. Cui, X.-L. Xin, H.-L. Han, M. Liu, Y.-P. Yang and Q.-H. Jin, Synthesis, structure, luminescent properties, and photocatalytic behavior of 0D–3D silver(I) complexes bearing both diphosphine ligands and 1,10-phenanthroline derivatives, Polyhedron, 2018, 155, 135–143 CrossRef CAS.
- Z. Assefa, R. J. Staples, J. P. Fackler Jr, H. H. Patterson and G. Shankle, Europium(III) Tris[dicyanoargentate(I)] Trihydrate, Eu[Ag(CN)2]3·3H2O, Acta Crystallogr., Sect. C: Cryst. Struct. Commun., 1995, C51, 2527–2529 CrossRef CAS.
- P. A. Tanner, X. Zhou, W.-T. Wong, C. Kratzer and H. Yersin, Structure and Spectroscopy of Tb[Au(CN)2]3·3H2O, J. Phys. Chem. B, 2005, 109, 13083–13090 CrossRef CAS PubMed.
- J. C. F. Colis, C. Larochelle, R. Staples, R. Herbst-Irmer and H. Patterson, Structural studies of lanthanide ion complexes of pure gold, pure silver and mixed metal (gold–silver) dicyanides, Dalton Trans., 2005, 675–679 RSC.
- C. L. Larochelle and J. K. Krebs, Synthesis and spectral properties of Ce[Ag(CN)2]3, Opt. Mater., 2008, 30, 1446–1450 CrossRef CAS.
- R. D. Shannon, Revised effective ionic radii and systematic studies of interatomic distances in halides and chalcogenides, Acta Crystallogr., Sect. A: Cryst. Phys., Diffr., Theor. Gen. Crystallogr., 1976, 32, 751–767 CrossRef.
- P. D'Angelo, A. Zitolo, V. Migliorati, G. Chillemi, M. Duvail, P. Vitorge, S. Abadie and R. Spezia, Revised Ionic Radii of Lanthanoid(III) Ions in Aqueous Solution, Inorg. Chem., 2011, 50, 4572–4579 CrossRef PubMed.
- O. Stefanczyk, A. M. Majcher, K. Nakabayashi and S. Ohkoshi, Chiral LnIII(tetramethylurea)–[WV(CN)8] Coordination Chains Showing Slow Magnetic Relaxation, Cryst. Growth Des., 2018, 18, 1848–1856 CrossRef CAS.
- Y. Jinqiu, C. Lei, H. Huaqiang, Y. Shihong, H. Yunsheng and W. Hao, Raman spectra of RE2O3 (RE = Eu, Gd, Dy, Ho, Er, Tm, Yb, Lu, Sc and Y): laser-excited luminescence and trace impurity analysis, J. Rare Earths, 2014, 32, 1–4 CrossRef.
- D. Wei, S. Chen and Q. Liu, Review of Fluorescence Suppression Techniques in Raman Spectroscopy, Appl. Spectrosc. Rev., 2015, 50, 387–406 CrossRef.
- G. Kresse and J. Furthmuller, Efficiency of ab-initio total energy calculations for metals and semiconductors using a plane-wave basis set, Comput. Mater. Sci., 1996, 6, 15–50 CrossRef CAS.
- G. Kresse and J. Furthmuller, Efficient iterative schemes for ab initio total-energy calculations using a plane-wave basis set, Phys. Rev. B: Condens. Matter Mater. Phys., 1996, 54, 11169–11186 CrossRef CAS PubMed.
- M. Yoshikiyo, K. Yamada, A. Namai and S. Ohkoshi, Study of the Electronic Structure and Magnetic Properties of ε-Fe2O3 by First-Principles Calculation and Molecular Orbital Calculations, J. Phys. Chem. C, 2012, 116, 8688–8691 CrossRef CAS.
- S. Ohkoshi, M. Yoshikiyo, A. Namai, K. Nakagawa, K. Chiba, R. Fujiwara and H. Tokoro, Cesium ion detection by terahertz light, Sci. Rep., 2017, 7, 8088 CrossRef PubMed.
- S. Ohkoshi, M. Yoshikiyo, Y. Umeta, M. Komine, R. Fujiwara, H. Tokoro, K. Chiba, T. Soejima, A. Namai, Y. Miyamoto and T. Nasu, Phonon-Mode Calculation, Far- and Mid-Infrared, and Raman Spectra of an ε-Ga0.5Fe1.5O3 Magnet, J. Phys. Chem. C, 2017, 121, 5812–5819 CrossRef CAS.
- S. S. Kim, S. B. Jo, K. I. Gueon, K. K. Choi, J. M. Kim and K. S. Churn, Complex permeability and permittivity and microwave absorption of ferrite-rubber composite at X-band frequencies, IEEE Trans. Magn., 1991, 27, 5462–5464 CAS.
- S. J. Yan, L. Zhen, C. Y. Xu, J. T. Jiang, W. Z. Shoa and J. K. Tang, Synthesis, characterization and electromagnetic properties of Fe1−xCox alloy flower-like microparticles, J. Magn. Magn. Mater., 2011, 323, 515–520 CrossRef CAS.
- A. Namai, S. Kurahashi, T. Goto and S. Ohkoshi, Theoretical Design of a High-Frequency Millimeter Wave Absorbing Sheet Composed of Gallium Substituted ε-Fe2O3 Nanomagnet, IEEE Trans. Magn., 2012, 48, 4386–4389 CAS.
- Z. Lin, J. Liu, W. Peng, Y. Zhu, Y. Zhao, K. Jiang, M. Peng and Y. Tan, Highly Stable 3D Ti3C2Tx MXene-Based Foam Architectures toward High-Performance Terahertz Radiation Shielding, ACS Nano, 2020, 14, 2109–2117 CrossRef CAS PubMed.
- Z. Huang, H. Chen, S. Xu, L. Y. Chen, Y. Huang, Z. Ge, W. Ma, J. Liang, F. Fan, S. Chang and Y. Chen, Graphene-Based Composites Combining Both Excellent Terahertz Shielding and Stealth Performance, Adv. Opt. Mater., 2018, 6, 1801165 CrossRef.
- D.-X. Yan, H. Pang, B. Li, R. Vajtai, L. Xu, P.-G. Ren, J.-H. Wang and Z.-M. Li, Structured Reduced Graphene Oxide/Polymer Composites for Ultra-Efficient Electromagnetic Interference Shielding, Adv. Funct. Mater., 2015, 25, 559–566 CrossRef CAS.
- G. M. Sheldrick, Crystal structure refinement with SHELXL, Acta Crystallogr., Sect. C: Struct. Chem., 2015, 71, 3–8 Search PubMed.
- O. V. Dolomanov, L. J. Bourhis, R. J. Gildea, J. A. Howard and H. Puschmann, OLEX2: a complete structure solution, refinement and analysis program, J. Appl. Crystallogr., 2009, 42, 339–341 CrossRef CAS.
- C. F. Macrae, I. J. Bruno, J. A. Chisholm, P. R. Edgington, P. McCabe, E. Pidcock, L. Rodriguez-Monge, R. Taylor, J. van de Streek and P. A. Wood, Mercury CSD 2.0 – new features for the visualization and investigation of crystal structures, J. Appl. Crystallogr., 2008, 41, 466–470 CrossRef CAS.
- K. Parlinski, Z. Q. Li and Y. Kawazoe, First-Principles Determination of the Soft Mode in Cubic ZrO2, Phys. Rev. Lett., 1997, 78, 4063–4066 CrossRef CAS.
- J. P. Perdew, K. Burke and M. Ernzerhof, Generalized Gradient Approximation Made Simple, Phys. Rev. Lett., 1996, 77, 3865–3868 CrossRef CAS PubMed.
Footnote |
| † Electronic supplementary information (ESI) available: Legends for supporting movie; single crystal X-ray diffraction analyses; thermogravimetric data; powder X-ray diffraction studies; IR absorption and Raman scattering spectroscopies; terahertz time-domain spectroscopy; first-principles phonon mode calculation data. CCDC 2339311 (LaAg) and 2339312 (DyAg). For ESI and crystallographic data in CIF or other electronic format see DOI: https://doi.org/10.1039/d4qi00800f |
| This journal is © the Partner Organisations 2024 |