
 Open Access Article
 This Open Access Article is licensed under a Creative Commons Attribution-Non Commercial 3.0 Unported Licence
Development of In–Cu binary oxide catalysts for hydrogenating CO2via thermocatalytic and electrocatalytic routes†
Marco Pietro
Mezzapesa
 a,
Fabio
Salomone
a,
Hilmar
Guzmán
a,
Federica
Zammillo
a,
Roberto
Millini
d,
Letizia
Bua
c,
Gianluigi
Marra
b,
Alessandra
Tacca
b,
Rosamaria
Marrazzo
b,
Nunzio
Russo
a,
Raffaele
Pirone
a,
Simelys
Hernández
*ae and
Samir
Bensaid
*a
a,
Fabio
Salomone
a,
Hilmar
Guzmán
a,
Federica
Zammillo
a,
Roberto
Millini
d,
Letizia
Bua
c,
Gianluigi
Marra
b,
Alessandra
Tacca
b,
Rosamaria
Marrazzo
b,
Nunzio
Russo
a,
Raffaele
Pirone
a,
Simelys
Hernández
*ae and
Samir
Bensaid
*a
aDepartment of Applied Science and Technology (DISAT), Politecnico di Torino, Corso Duca degli Abruzzi 24, 10129 Turin, Italy. E-mail: samir.bensaid@polito.it; simelys.hernandez@polito.it
bEni S.p.A., DE-R&D, Via Giacomo Fauser 4, 28100 Novara, Italy
cEni S.p.A., R&D, Via Giacomo Fauser 4, 28100 Novara, Italy
dEni S.p.A., DOW R&D, Via Felice Maritano 26, 20097 San Donato Milanese, Milan, Italy
eIstituto Italiano di Tecnologia (IIT), Via Livorno 60, 10144 Turin, Italy
First published on 23rd February 2024
Abstract
Carbon dioxide (CO2) hydrogenation to obtain valuable chemicals and fuels via thermocatalysis or electrocatalysis is a promising and sustainable method for CO2 utilization. Here, binary In–Cu oxide co-precipitated materials were investigated to evaluate the catalytic performance in the mentioned conversion processes. The In-rich binary material exhibits remarkable selectivity (>60%) to methanol along with high activity for CO2 conversion (>2%) at 21 bar and 300 °C, achieving a productivity of about 265 mgMeOH h−1 gIn2O3−1, which is almost 3 times higher than that of the bare In2O3 catalyst. CO2-temperature programmed desorption revealed that the basicity of the In-rich catalyst remains constant between the calcined and spent samples, so the capacity to adsorb CO2 does not vary when the catalyst is exposed to the reaction atmosphere. Such a catalyst was demonstrated to be active for formate production in the electrochemical process as the main product. Ex situ characterization after testing proved that the In2O3 phase was the active site of methanol synthesis during CO2 hydrogenation at high temperatures and pressures. In contrast, depending on the cell configuration, different indium interfaces were stabilized at the electrocatalyst surface under ambient conditions. It is envisioned that the co-presence of In0, In2O3, and In(OH)3 phases increases the local amount of *CO intermediates, promoting the formation of more reduced products, such as ethanol and 2-propanol, through the *CO dimerization reaction in the electrochemical process. These findings highlight the potential of nonreducible hydroxides as promoters in the electrochemical CO2 reduction process.
Introduction
Nowadays, greenhouse gases present a serious problem. In particular, CO2 is a greenhouse gas emitted by many human activities as a waste product (e.g. automobiles, chemical industry, home heating, etc.). Carbon Capture and Storage (CCS) or Carbon Capture and Utilization (CCU) are possible solutions to reduce environmental impact, such as by capturing CO2 from flue gas. In particular, CCU provides the possibility of transforming it into high-value products (e.g., methanol, gasoline, and olefins). Among the possible products, methanol has specific relevance; in fact, it can be used as a solvent, fuel additive or chemical building block and in different processes, for example:• Methanol Steam Reforming (MSR1–3) is useful for transporting hydrogen and using it as a clean energy source;
• Gasoline production (methanol-to-gasoline4–7);
• Olefin production (methanol-to-olefins4,5,8–12).
Methanol production is a known industrial catalytic process. Currently, methanol is produced by passing a CO:CO2:H2 mixture over a copper-based catalyst;13–15 the main reactions involved in the methanol synthesis process are CO2 hydrogenation, Reverse Water Gas Shift (RWGS) reaction, CO hydrogenation, and CO2 and CO methanation that are reported in eqn (1), (2), (3), (4) and (5), respectively.4,16,17
| CO2 + 3H2 ⇌ CH3OH + H2O ΔRH° = −49.5 kJ mol−1 | (1) |
| CO2 + H2 ⇌ CO + H2O ΔRH° = +41.5 kJ mol−1 | (2) |
| CO + 2H2 ⇌ CH3OH ΔRH° = −91.0 kJ mol−1 | (3) |
| CO2 + 4H2 ⇌ CH4 + 2H2O ΔRH° = −165 kJ mol−1 | (4) |
| CO + 3H2 ⇌ CH4 + H2O ΔRH° = −206 kJ mol−1 | (5) |
Thus, the methanol synthesis process involves a series of by-products, the main ones being CO (2) and CH4 (thermodynamically favored products). For executing this process industrially, the catalyst Cu/ZnO/Al2O3 (CZA) is used. This catalyst works at pressures between 50 and 100 bar and temperatures in the range 240–280 °C. Under these conditions, CZA enables high CO2 conversion but poor methanol selectivity.4,18,19 With CZA, copper adsorbs CO2 and helps its conversion to CO for subsequent hydrogenation to methanol; otherwise, ZnO is needed to store hydrogen and react with CO and CO2viareactions (1)–(5).13–15
In the literature, researchers have proposed different catalysts for producing methanol with higher performance. In particular, In2O3 catalysts have shown good methanol selectivity and CO2 conversion. Chou et al.18 have shown a series of different catalysts with their performance, and among these catalysts are those based on indium (In2O3). The indium oxide catalyst presents a better performance than CZA in terms of methanol selectivity and yield. Martin et al.20 have tested CZA and In2O3 under the same conditions and have compared their performance. Under their reaction conditions (300 °C, 50 bar, H2/CO2 = 4![[thin space (1/6-em)]](https://www.rsc.org/images/entities/char_2009.gif) :1 and GHSV equal to 16000 h−1), In2O3 has a methanol productivity of 0.20 gMeOH h−1 gcat−1 and CZA has a productivity of 0.15 gMeOH h−1 gcat−1. There is an even more significant difference in terms of methanol selectivity: for In2O3, it is nearly 100%, and for CZA it is about 16%. In addition, Martin et al.20 observed a monotonic increase in productivity vs. temperature (200–300 °C) for In2O3 and an opposite trend for CZA. This difference could be related to the fact that the RWGS reaction is slower in In2O3 than in CZA, because In2O3 does not catalyze reaction (2). Thereafter, In2O3 inhibits CO formation. Furthermore, CO is a substance capable of activating In2O3; this is because it reduces the indium oxide and increases the oxygen vacancies.20,21 Indeed, oxygen vacancies play a central role in the In2O3 catalytic methanol synthesis mechanism, as it involves their structural features to adsorb and activate CO2.22 Like each catalyst, the performance of In2O3 can be further enhanced by adding the right support or promoters. Martin et al.23 have shown that zirconia (ZrO2) induces the formation of oxygen vacancies on the surface of In2O3 and inhibits CO formation, so it is possible to have higher conversion without losing selectivity. Frei et al.24 have studied the effect of palladium (Pd) on In2O3 catalysis; they observed that atomically dispersed Pd inhibits RWGS (2) and improves both the stability and activity of In2O3. In addition, they have recently investigated the effect of dispersion of different metals on the surface of In2O3 for enhancing methanol productivity.25
:1 and GHSV equal to 16000 h−1), In2O3 has a methanol productivity of 0.20 gMeOH h−1 gcat−1 and CZA has a productivity of 0.15 gMeOH h−1 gcat−1. There is an even more significant difference in terms of methanol selectivity: for In2O3, it is nearly 100%, and for CZA it is about 16%. In addition, Martin et al.20 observed a monotonic increase in productivity vs. temperature (200–300 °C) for In2O3 and an opposite trend for CZA. This difference could be related to the fact that the RWGS reaction is slower in In2O3 than in CZA, because In2O3 does not catalyze reaction (2). Thereafter, In2O3 inhibits CO formation. Furthermore, CO is a substance capable of activating In2O3; this is because it reduces the indium oxide and increases the oxygen vacancies.20,21 Indeed, oxygen vacancies play a central role in the In2O3 catalytic methanol synthesis mechanism, as it involves their structural features to adsorb and activate CO2.22 Like each catalyst, the performance of In2O3 can be further enhanced by adding the right support or promoters. Martin et al.23 have shown that zirconia (ZrO2) induces the formation of oxygen vacancies on the surface of In2O3 and inhibits CO formation, so it is possible to have higher conversion without losing selectivity. Frei et al.24 have studied the effect of palladium (Pd) on In2O3 catalysis; they observed that atomically dispersed Pd inhibits RWGS (2) and improves both the stability and activity of In2O3. In addition, they have recently investigated the effect of dispersion of different metals on the surface of In2O3 for enhancing methanol productivity.25
The aforementioned catalysts for the production of methanol have been studied to exploit the thermocatalytic (TC) process of CO2 conversion. Among the different technologies, TC processes are currently suitable for wide market size and large scale of production with a high technological readiness level. However, focusing attention on emerging technologies and future scenarios, electrocatalytic (EC) processes may become suitable and very promising under certain circumstances and they could have similar environmental impact.16 For these reasons, this study investigates the applicability of our catalysts for both TC and EC processes. Thus, the literature review on these kinds of catalysts for EC applications reported hereunder will help in understanding the state-of-the-art on these catalysts.
Among the different materials studied for CO2 electroreduction (CO2R), indium metal has been proposed as a suitable electrocatalyst due to its intrinsic high overpotential towards the HER and interesting formate selectivity.26 Nonetheless, several studies have reported that materials based on indium suffer from low activity. Moreover, the poor stability of these catalysts has been also shown.27 The rational design of catalysts can enable a significant improvement of the metrics needed for the practical application of CO2R. Among the strategies, indium-based catalysts with different morphologies have been developed to enhance their selectivity. Xia and coworkers28 synthesized a needle-like porous electrode that displayed a lower onset potential compared to the indium foil electrode. The novel nanostructured catalyst also enabled a faradaic efficiency (FE) toward formate of 86%, with a current density of 5.8 mA cm−2 at −0.86 V vs. RHE. Another strategy discussed in the literature is the incorporation of a second metal into In nanoparticles to form bimetallic materials. Either alloys or heterostructures can be formed, resulting in electronic interactions or synergistic effects at the interfacial regions. Either way the catalyst selectivity shifts to carbon monoxide from formate. Rasul et al.29 designed a surface Cu–In alloy by electrochemically depositing In on a rough Cu layer which showed a stable FE of 85% for CO for 7 h. In the work performed by Luo and colleagues, a thin layer of metallic In was deposited on Cu nanowires, achieving a FECO of about 93% at −0.6 to −0.8 V vs. RHE with a remarkable stability of 60 hours.30 According to density functional theory (DFT) calculations, that selectivity is attributed to the enhanced adsorption strength of *COOH and the destabilization of the *H adsorption on the Cu–In interfaces. On the other hand, monodisperse core–shell Cu/In2O3 nanoparticles were synthesized in another work to boost syngas formation.31 Herein, a wide range of H2/CO ratios was obtained by varying the In2O3 shell thickness. The mechanistic discussion revealed that the compression strain and Cu dopant in the shell both promoted CO selectivity. By combining electrochemical measurements with ex situ characterization techniques, surface In(OH)3 sites have been suggested by Larrazábal et al. as the active species that play a crucial role in selective CO formation.32 Furthermore, the work performed by Zhu et al. demonstrated that, by changing the metal ratio of Cu/In, the catalyst selectivity shifts from CO (core–shell structure) to HCOOH (well-mixed structure). DFT calculations helped correlate the structure-sensitive binding strength of the *COOH and *OCHO intermediates with the catalytic performance.33
In this work, the catalytic activities and deactivation phenomena of bimetallic In/Cu catalysts are assessed. In particular, the main focus is on the effect of Cu on In2O3 activity and the achievement of a better-performing catalyst with respect to In2O3 and Cu alone. Shi et al.34,35 have recently studied In–Cu binary oxide catalysts for methanol synthesis from CO2. They have tested this kind of catalyst in TC and observed the formation of In–Cu alloys. As a result, the alloy increased the methanol yield and catalyst stability.35 Moreover, they observed that the formation of the Cu11In9 alloy enhances the performance more than the presence of the Cu7In3 alloy.34 However, they have not investigated the formation of these alloys in the EC CO2 conversion process and they have compared samples with relatively high amounts of Cu and In atoms (i.e., from Cu/In = 1/3 to Cu/In = 3/1), without studying the effect of doping.
The catalysts reported here were synthesized using the gel–oxalate coprecipitation technique that allowed us to obtain samples with a wide specific surface area and small crystallites.36–38 Binary oxide catalysts (InxCu100−xOy) with five different In/Cu atomic ratios were prepared, characterized, and tested, for the first time, for both the thermochemical and electrochemical conversion of CO2 and H2 to added-value products. The chosen atomic ratios were 0, 10, 50, 90, and 100 to explore the whole range of possible compositions. Characterization was also performed on each sample to evaluate its chemical, physical, and morphological characteristics. For the thermocatalytic tests, characterization was performed on fresh and spent catalysts. In a recent work, we found that Cu–Zn-based catalysts operate with some similarities in the reaction mechanisms of TC and EC CO2 conversion.17 Thus, the aim of this work is to deeply investigate the catalytic performances of In–Cu-based catalysts in these two processes and find eventual synergies that can be exploited to develop novel electrocatalysts inspired by the thermocatalysts for the sustainable production of chemicals and fuels.
Methodology
Catalyst synthesis
As done by Shi et al.,34,35 the catalysts were synthesized using the co-precipitation technique. In our work, oxalates were co-precipitated from metal nitrates (indium and copper). Each sample was prepared by dissolving an appropriate amount of salts (In(NO3)3·xH2O and Cu(NO3)2·3H2O) in ethanol to obtain a 0.1 mol L−1 solution of metallic cations. On the other hand, 1 mol L−1 oxalic acid solution in ethanol was prepared with an excess of 20% of oxalic acid with respect to the stoichiometric amount. The solutions were prepared under ambient conditions with vigorous stirring. Then, the oxalic acid solution was added dropwise to the nitrate solution and the suspension was kept under stirring for 2 h. After the mixing time, the suspension was centrifuged (4000 rpm for 15 min) for collecting the oxalate gel from the bottom of the test tube. This gel was dried in an oven (70 °C for 16 h). Finally, the dried product was crushed and then calcined to produce oxides (50 °C ramp rate, +10 °C min−1 until 360 °C for 4 h). To perform the catalytic tests, each powder was pelletized under a loading of 2.65 kN, then the pellets were crushed and sieved between 250 μm and 500 μm to obtain the catalytic particles.The tested catalysts have the following formula: InxCu100−xOy, where x is the atomic fraction of indium. The synthesized catalysts are denoted as Cu100, In10Cu90, In50Cu50, In90Cu10, and In100. Indeed, the used formula does not report oxygen, but it is important to remember that they are oxides. Also, in the article the CuαInβ type formula represents indium–copper alloys.
Characterization analyses
Both fresh and spent catalysts were analyzed using several characterization techniques. First of all, the metallic composition was investigated by inductively coupled plasma mass spectrometry (ICP-MS), the specific surface area and the porosity of each catalyst were determined by N2 physisorption at 77 K and the structural features were evaluated by X-ray diffraction (XRD) and Raman spectroscopy. The reducibility of each sample was determined with temperature programmed reduction (H2-TPR), while the basicity was studied with temperature programmed desorption (CO2-TPD). Moreover, carbonaceous species deposited on the spent catalysts were quantified by means of temperature programmed combustion (TPC). Lastly, we performed scanning electron microscopy (SEM) and transmission electron microscopy (TEM).On the one hand, to perform the H2-TPR analyses, a suitable mass of the catalyst (∼20 mg) was firstly pre-treated under flowing He (40 cm3 min−1) at 300 °C (heating rate: +10 °C min−1) for 30 min. Then, the sample was cooled down to 50 °C under He flow. The H2-TPR analysis was performed by feeding a stream of 5 mol% H2/Ar (20 cm3 min−1) from 50 °C to 900 °C (+10 °C min−1) and holding it at 900 °C for 30 min.
On the other hand, to perform the CO2-TPD analyses, a certain amount of each catalyst (∼80 mg) was pre-treated under He flow (40 cm3 min−1) at 300 °C for 30 min and cooled down to 50 °C. Afterwards, the sample was saturated with flowing pure CO2 (40 cm3 min−1) at 50 °C for 60 min. After that, the reactor was purged using He flow (40 cm3 min−1) at 50 °C for 45 min. The CO2-TPD analysis was performed under flowing He (20 cm3 min−1) from 50 °C to 900 °C (+10 °C min−1) and holding it at 900 °C for 30 min.
The TPC analyses were performed in a U-tube quartz reactor containing 100 mg of spent catalyst (bed height: ∼5 mm). The reactor was fed with 100 cm3 min−1 of 5 mol% O2/N2 mixture without any pre-treatment. The oven was heated up to 800 °C with a heating rate of +10 °C min−1. Then, the oven was kept at 800 °C for 10 min. The concentrations of CO2 and CO at the outlet of the reactor were measured using an ABB Uras 14 gas analyzer, while the concentration of O2 was measured using an Emerson X-Stream analyzer.
High-resolution TEM (HRTEM) characterization was performed by using a JEOL (Akishima, Tokyo, Japan) JEM 2010 UHR, equipped with a LaB6 electron gun operating at 200 kV. All digital micrographs were acquired using an UltraScan 1000 camera, and the images were processed by a Gatan digital micrograph (Pleasanton, CA, USA). Specimens for HRTEM analysis were sonicated in 2-propanol and then transferred, as a suspension, to a copper grid covered with a holey carbon film. Micrographs were taken after solvent evaporation, spanning over the whole region of the sample to achieve a truly representative statistical mapping of the investigated material.
Thermocatalytic activity test
A stainless-steel fixed bed reactor (i.d. 8 mm) was used to test the catalytic activity of the synthesized catalysts. The reactor was heated with an insulated oven that enabled it to reach and maintain the desired temperature. The reactor outlet gases were analyzed with a gas-chromatograph (GC – Agilent Technologies 7890B GC system) equipped with a thermal conductivity detector (TCD) and a flame ionization detector (FID). Fig. S1† shows the plant configuration used for the thermocatalytic tests.Each sample (1.0 g of catalytic particles) was pre-treated under flowing N2 (60 NL h−1) at 2 bar from room temperature to 300 °C (heating rate: 10 °C min−1) and holding it at 300 °C for 1 h. After that, thermocatalytic tests were sequentially performed in the same reactor. The stability test was carried out feeding the reaction mixture (20 NL h−1 gcat−1 with a H2/CO2/N2 molar ratio of 15/5/1) at 21 bar and 275 °C for 20 h. After stabilization, activity tests were carried out varying the temperature from 200 °C to 300 °C under the same reaction gas flowrate and pressure.
CO2 conversion (ζCO2), methanol selectivity (σCH3OH) and methanol yield (ηCH3OH) were evaluated for each test according to eqn (6)–(8), respectively.
 | (6) |
 | (7) |
| ηCH3OH = ζCO2·σCH3OH | (8) |
Deactivation study
Based on the data obtained from the stability test, the deactivation phenomenon was studied. This methodology shows the equation used for modelling the deactivation kinetics. The hypothesis refers to the fluid dynamics of the gas flow through the catalytic bed located in the reactor. (a) sintering phenomenon is the predominant deactivation mechanism; (b) the reaction kinetic order is equal to 1; (c) the deactivation kinetic order is equal to 1 or 2; (d) the reactor fluid-dynamic was approximated with plug constant flow.39 The equations for studying deactivation were obtained by putting the following equations into a system: the reaction rate expression (9) and deactivation kinetics (10).| r′A = −k′·CAn·a | (9) |
 | (10) |
Therefore, eqn (11) and (12) can be obtained by linearizing the expressions of the variation of the CO2 conversion with time by assuming first-order and second-order deactivation kinetics, respectively. Both equations were obtained by assuming first-order reaction kinetics and the independence of the deactivation kinetic with respect to the concentration of the gas species.37
 | (11) |
 | (12) |
 (moli kgcat−1 h−1) is the apparent pre-exponential factor.
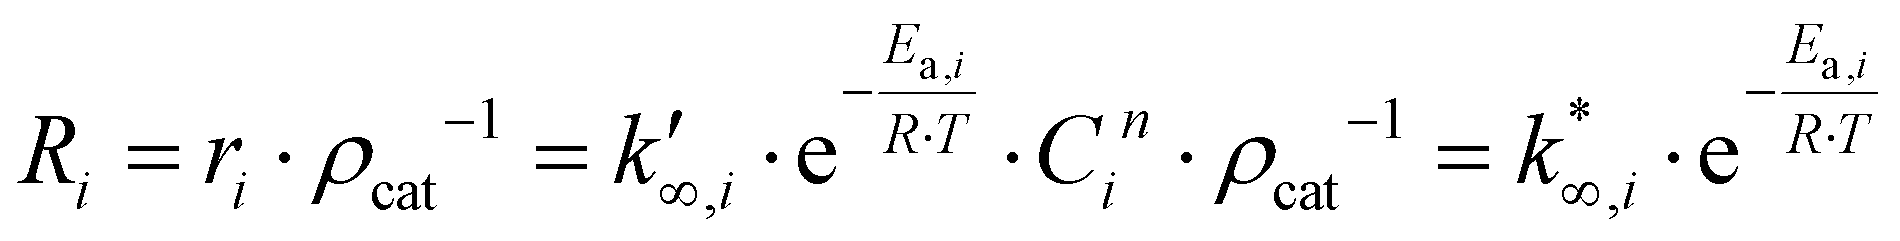 | (13) |
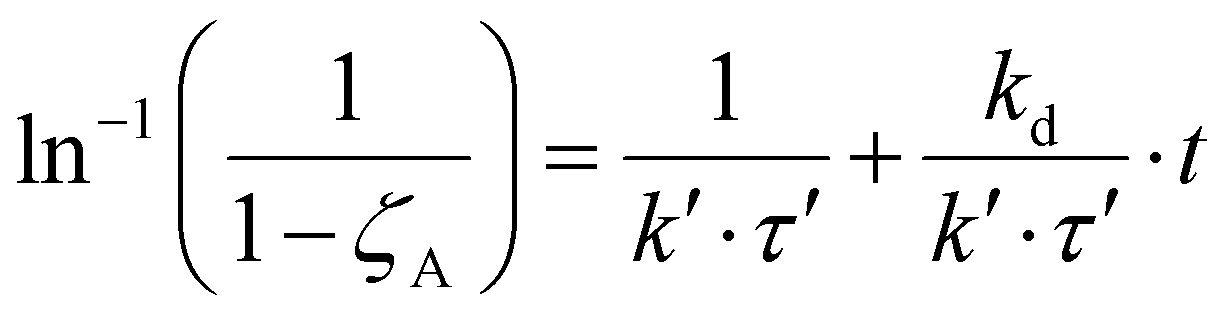
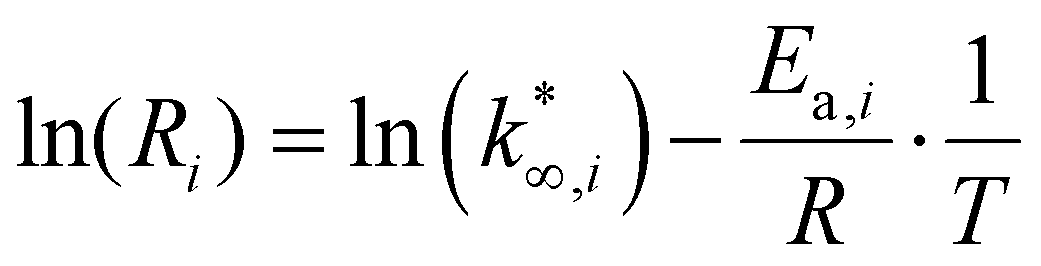
The approximation adopted for eqn (9) is used in eqn (13). Then, eqn (13) is linearized in eqn (14),37 to remove the dependence between the apparent activation energy and the apparent pre-exponential factor. For this reason, the value of the apparent activation energy is fixed, and the apparent pre-exponential factor is made explicit.
 | (14) |
Electrocatalytic set-up and tests
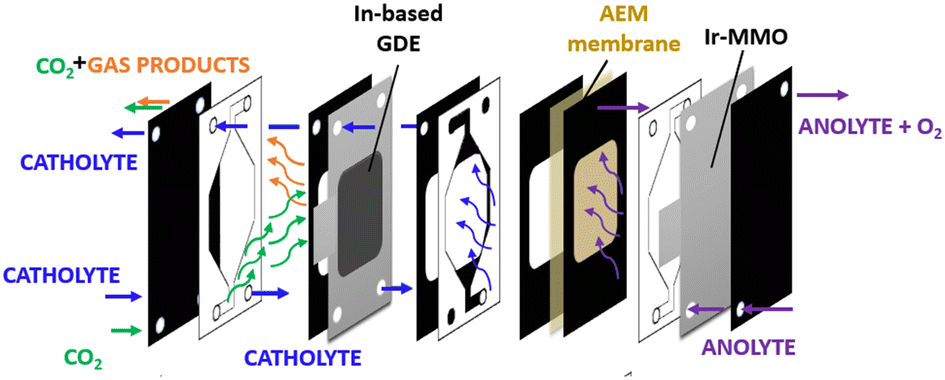 | ||
| Fig. 1 Schematic view of an experimental setup involving a continuous flow cell in GDE configuration. | ||
The catholyte and anolyte, 1 M KOH aqueous solutions, were recirculated with a flux rate of 26.5 mL min−1. A mass flow controller was used to keep the gas flow rate constant at 20 NmL min−1. The online gas product analysis was carried out by using a micro gas chromatograph (Agilent 990 Micro GC, equipped with Molsieve 5Å and Pora PLOT U capillary columns). A multichannel potentiostat (BioLogic VSP-300) was used for the electrochemical measurements.
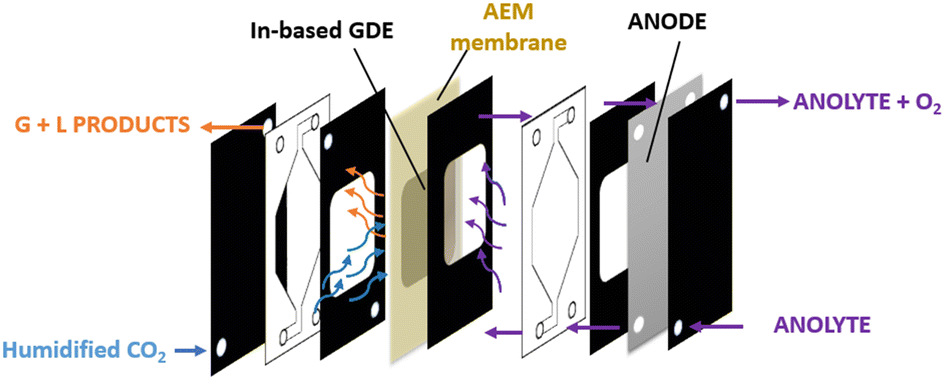 | ||
| Fig. 2 Schematic view of a continuous flow cell in MEA configuration. | ||
Results and discussion
Characterization of the fresh calcined samples
Characterization of the calcined samples was mainly performed to study the synthesised product's features. First of all, ICP analysis was performed to verify the correct metal composition in the binary catalyst. In Table 1 In/(In + Cu) data from the ICP analysis are reported, confirming that the final powders have the desired composition. For all the samples a mesoporous structure was obtained. The pores size was evaluated by N2 physisorption at 77 K and the results are reported in Table 1. Isotherms and pore distributions are reported in the ESI (Fig. S2 and S3†). Adsorption–desorption isotherms show the hysteresis phenomena confirming the mesoporosity of the powders. The shape of the hysteresis loop is associated with type IV isotherms. The hysteresis loops are like type H3; the only exception is In10Cu90, which is type H2. This indicates that each sample (except In10Cu90) contains an aggregate of plate-like particles. For In10Cu90 using the De Boer classification, this curve was type E so there are thin-bottle-shaped pores.40–42 From the analysis of the physisorption of nitrogen at 77 K, the specific surface (SSABET) of the sample is also evaluated (shown in the Table 1). The In10Cu90 catalyst shows the highest specific surface, which could be associated to the lower crystallite sizes and pore sizes (dP) than that of the other samples. In contrast, pure copper oxide (Cu100) has a very low specific surface area as expected. On the other hand, In100 has a higher specific surface area than Cu100. SSABET does not decrease much with an addition of 10% copper with respect to In100.| Sample |
|
V BJH | d P | SSABET |
|---|---|---|---|---|
| at% | cm3 g−1 | nm | m2 g−1 | |
| In100 | 100 | 0.134 | 12.7 | 35.6 |
| In90Cu10 | 89.1 | 0.147 | 17.3 | 30.0 |
| In50Cu50 | 44.8 | 0.113 | 16.8 | 22.2 |
| In10Cu90 | 7.8 | 0.156 | 7.8 | 54.0 |
| Cu100 | 0 | 0.019 | 33.8 | 2.1 |
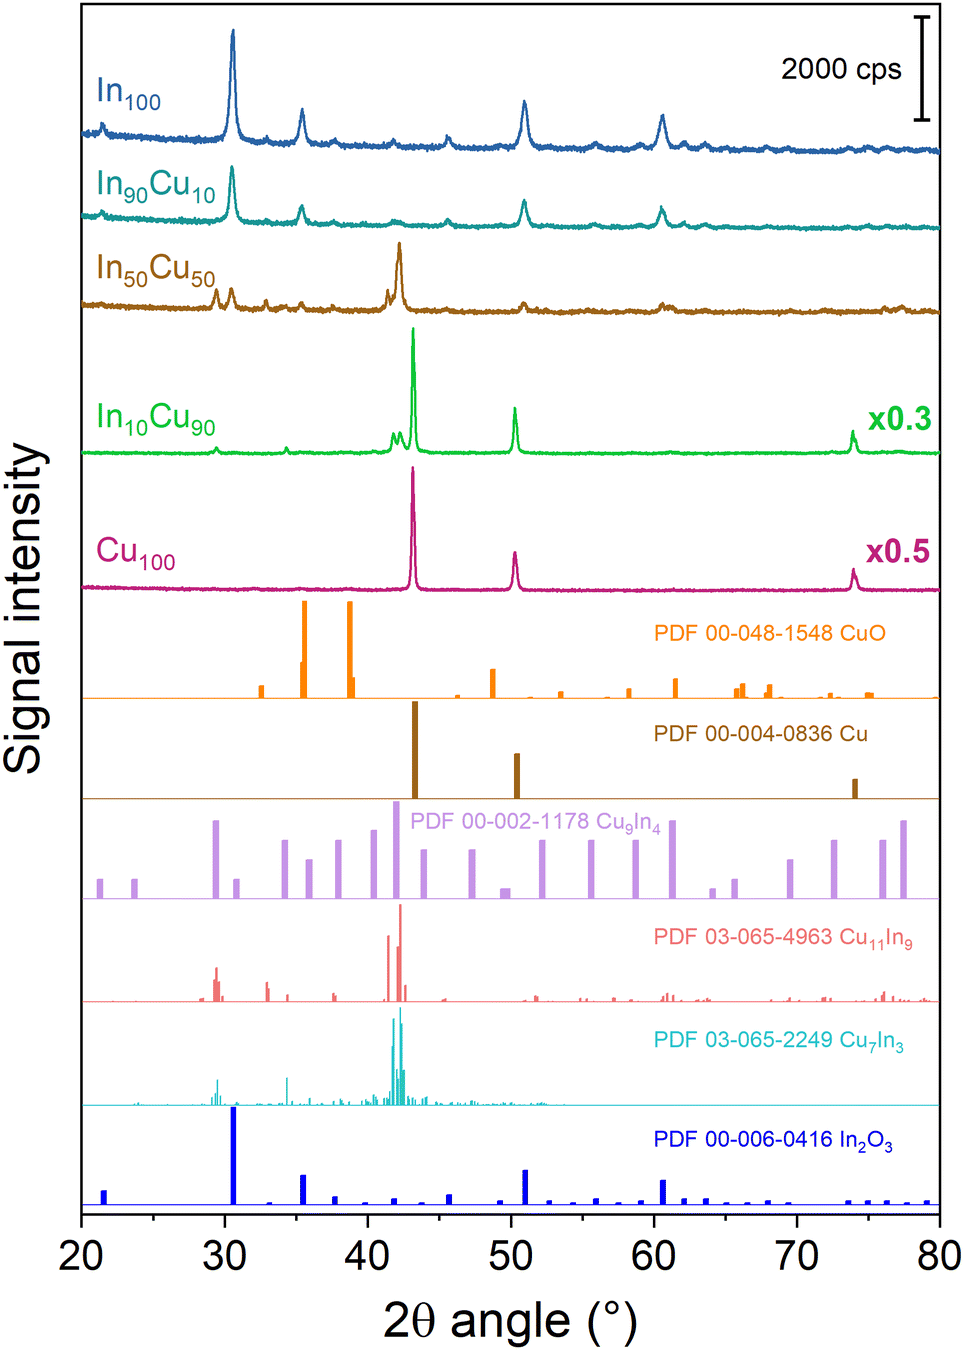
The diffractograms of the fresh calcined samples are reported in Fig. 3. The main crystalline oxide phases evidenced in the different catalysts are: In2O3, CuO (tenorite), and Cu2O (cuprite). For the In100 catalyst, the In2O3 main peaks are located at 21.49°, 30.57°, 35.44°, 50.98°, and 60.60° (PDF 00-006-0416). The same In2O3 peaks are found in In90Cu10 and In50Cu50 diffractograms. In contrast, no peaks of In2O3 are detected in the In10Cu90 sample. This deficiency could be due to the low fraction of indium oxide in the catalyst. With respect to the Cu100 catalyst, the XRD diffractogram outlines the co-presence of CuO, Cu2O and Cu (with the fractions shown in Table 2). In fact, the pattern shows the peaks at 32.42°, 35.51°, 38.71°, 48.81°, 61.58°, and 67.95° (PDF 00-048-1548) for CuO, the peaks at 29.57°, 36.43°, 42.31°, 61.39°, and 73.50° (PDF 00-005-0667) for Cu2O and the peaks at 43.3° (PDF 00-004-0836) for Cu. The XRD diffractograms give another information: The Cu100 diffractogram presents the most intense peaks. Therefore, this higher intensity could be related to a larger particle size than in the other samples. No peaks of Cu2O were found in the binary oxide catalysts, in contrast to the CuO peaks that are seen in all of them. The Raman spectra are consistent with the XRD data. In the Raman spectra of the Cu100 fresh sample (shown in Fig. S4 and S5†), two bands located at 215 cm−1 and 138 cm−1 are related to the modes of Cu2O, while two bands at 327 and 279 cm−1 are due to CuO.43 On the other hand, the Raman bands of Cu2O are not present in the spectra of In90Cu10 and In10Cu90 fresh samples. For all samples, the high full width at half maximum of the Raman bands suggests a small size of the crystallites. The size of the crystallites was calculated from the XRD diffractograms through Scherrer's equation. The crystallite dimensions obtained are reported in Table 2. In2O3 crystallites have a comparable dimension for each catalyst (≈24 nm). Instead, the CuO phase varies its dimension in different cases. The highest value of crystallite size is for Cu100. For the binary oxide catalyst, the crystallite size decreased if Cu fraction increased.
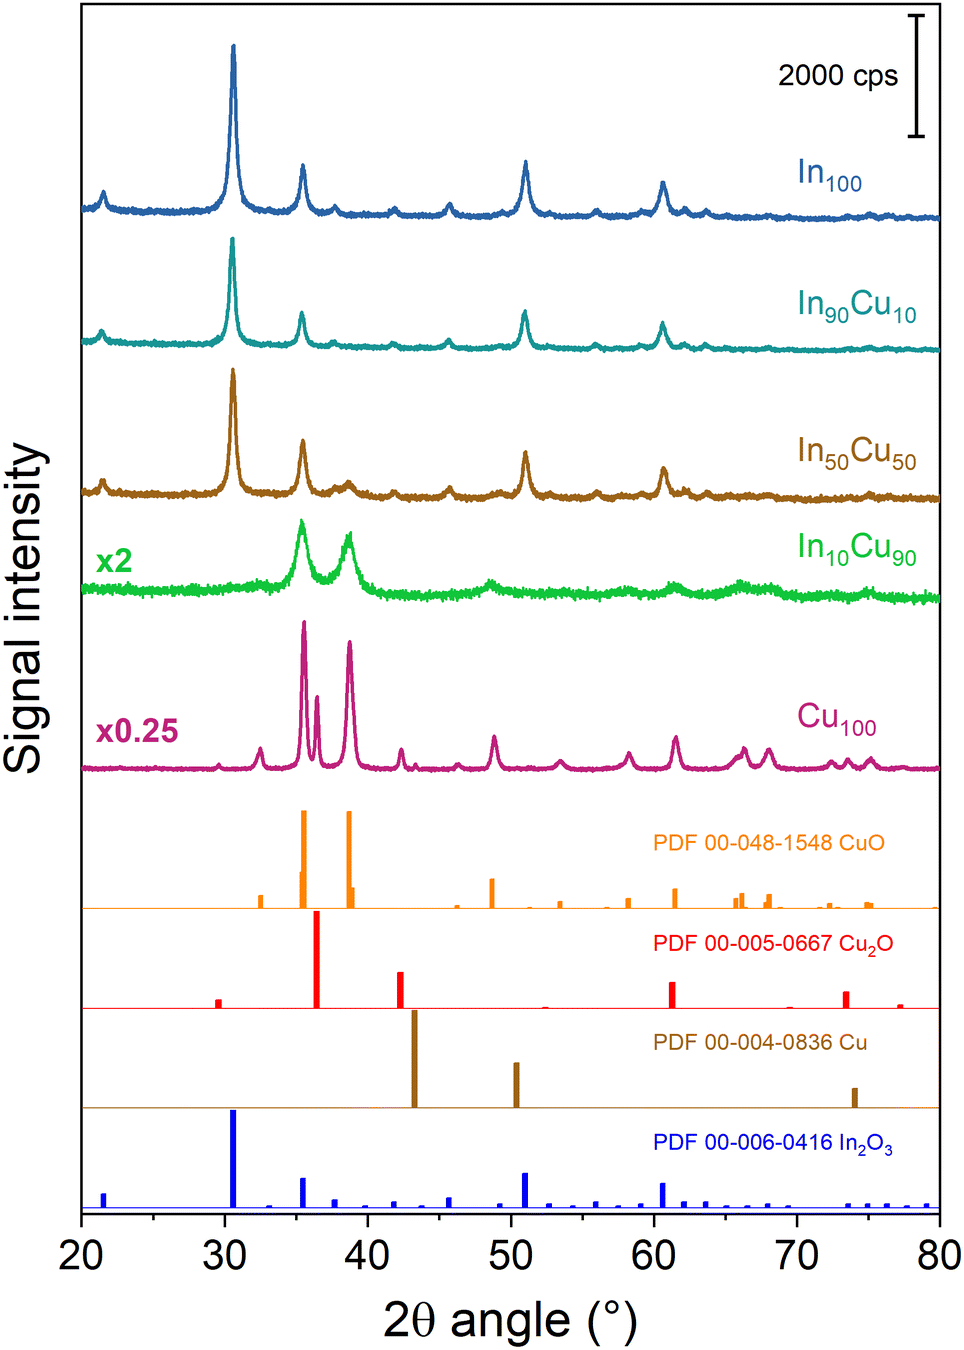 | ||
| Fig. 3 XRD diffractograms of the fresh calcined samples. For the sake of clarity, a diffractogram with multiplicative values has the measured intensity multiplied by that factor. | ||
The catalysts were characterized by the SEM technique and the images are shown in Fig. 4. In the binary samples, the two phases are not easily distinguished. In the figure it can be seen that the indium-based catalysts are more porous than the copper oxide ones. In particular, the In10Cu90 catalyst has a very sponge-like structure, in agreement with the high surface area of this sample. Moreover, an intimate contact between the In2O3 and CuO phase was confirmed from the TEM images (Fig. S6 and Table S1†).
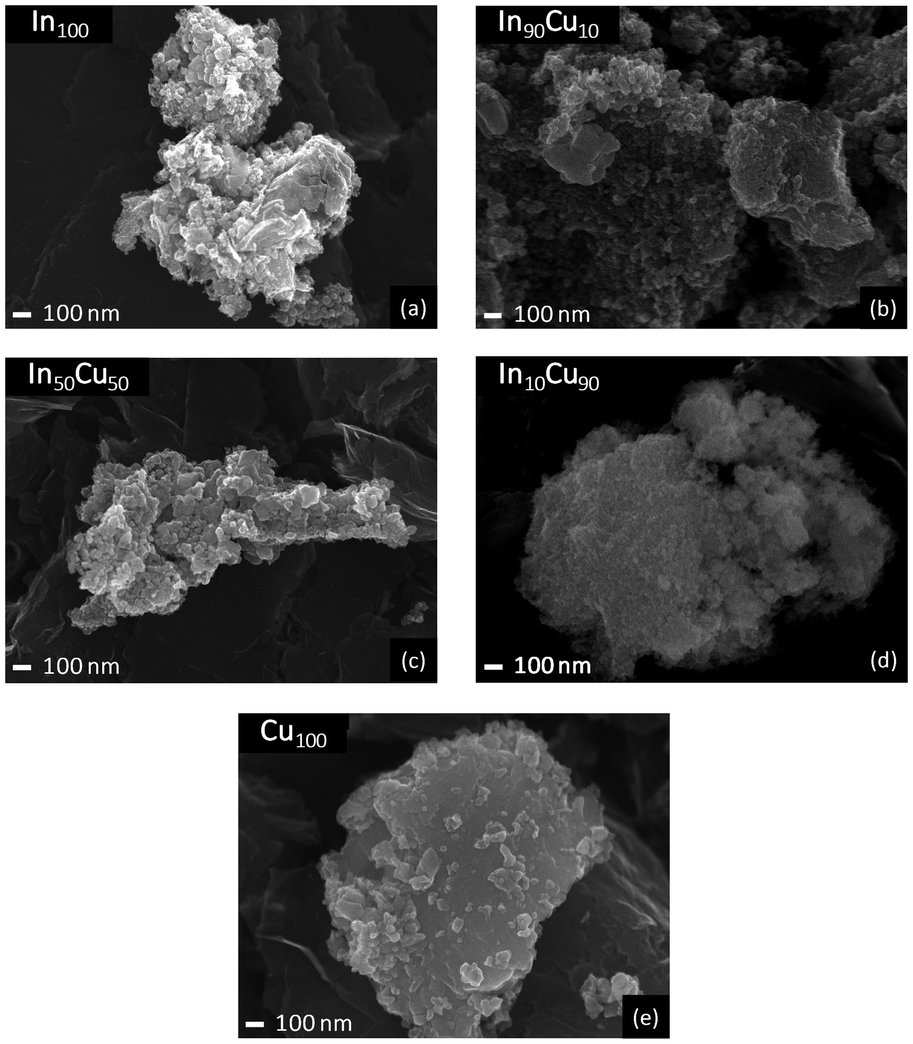 | ||
| Fig. 4 SEM images for fresh catalysts (50k× magnification). | ||
Another important feature is the catalysts’ reducibility. This property is evaluated for each sample by H2-TPR analysis. Reducibility is an important characteristic as the catalyst will be exposed to a H2-rich environment and high temperatures and pressures for the TC tests. In particular, it is important that CuO and Cu2O are reduced to metallic copper (the active catalytic phase).
At the same time, In2O3 should not be reduced under the reaction conditions. H2-TPR analysis confirms this behaviour, as shown in Fig. 5 and from the data reported in Table 3.
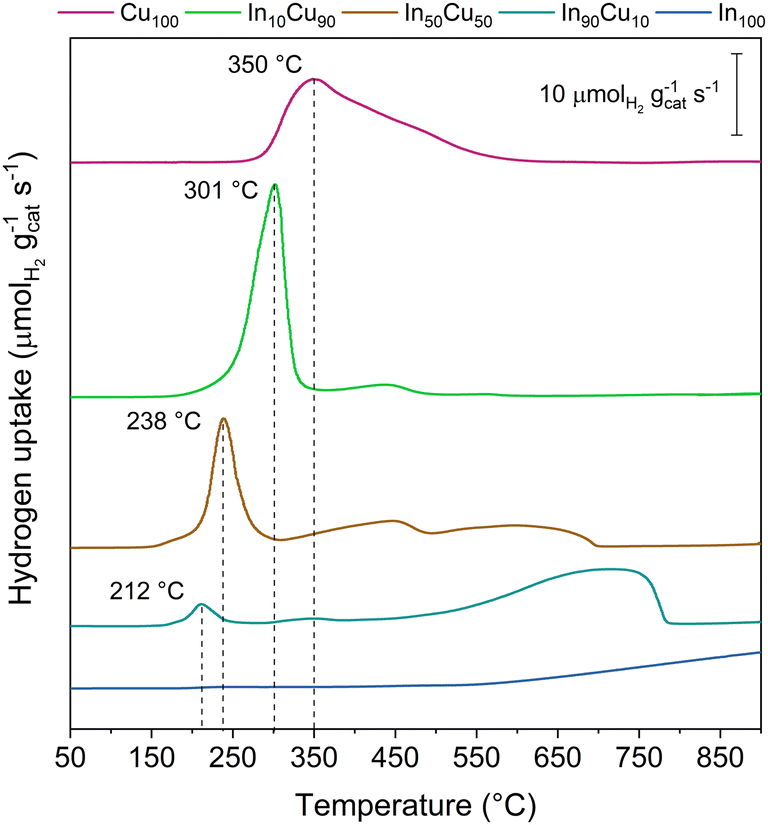 | ||
| Fig. 5 H2-TPR analysis plot results. The peaks assigned were related to CuO reduction. The other signal could be related to a Cu2O reduction and a partial In2O3 reduction. | ||
| Sample | H2 uptake | CO2 desorbed |
|---|---|---|
| μmolH2 mgcat−1 | μmolCO2 mgcat−1 | |
| In100 | 3.18 | 0.886 |
| In90Cu10 | 11.75 | 0.459 |
| In50Cu50 | 11.23 | 0.808 |
| In10Cu90 | 10.28 | 1.723 |
| Cu100 | 9.66 | — |
The reducibility of copper increases on decreasing the copper content in the samples. Indeed, Cu100 shows an asymmetric peak at 350 °C while In90Cu10 has a symmetric peak at 212 °C. The asymmetry of the Cu100 peak is attributed to the presence of Cu2O. Finally, an increase in the reacted H2 is observed as the fraction of indium present increases (In100 excluded).
Finally, the basicity of each catalyst was evaluated by CO2-TPD.
Table 3 reports the integral results obtained from this analysis. For binary oxide catalysts, the Cu-rich catalysts show a higher amount of desorbed CO2 which could be related to higher basicity. So, it is expected that the In10Cu90 catalyst will exhibit greater catalytic activity.
In conclusion, the most promising catalysts appear to be In90Cu10 and In10Cu90. In10Cu90 shows a high specific surface area and intimate contact (low crystallite size and microscopy results). In90Cu10 shows good specific surface area compared to Cu100 and H2-TPR reports good copper distribution of In2O3 with small particles, which is confirmed by the lowest copper reduction temperature.
Thermocatalytic results
This section shows the results of the thermo-catalytic tests on the catalysts. The thermo-catalytic results are preceded by the characterization of the spent catalysts. Then, the stability thermo-catalytic test and activity thermo-catalytic test are reported.Hence, Cu-rich binary oxide catalysts show low structural stability. Other interesting information comes from the XRD analysis of the spent catalysts. The XRD diffractograms obtained for these catalysts are shown in Fig. 6.
 | ||
| Fig. 6 XRD diffractograms of the spent TC samples. For the sake of clarity, a diffractogram with multiplicative values has the measured intensity multiplied by that factor. | ||
First of all, reduction of copper oxides (CuO, Cu2O) is revealed in the Cu100 catalyst. Indeed, the peaks at 43.12°, 50.25°, and 73.93° are associated with metallic copper (PDF 00-004-0836). At the same time, In2O3 persists in its oxidation state (In100 sample). In fact, the In100 XRD diffractogram reveals the same peaks as those of the fresh catalyst (Fig. 3). These aspects of indium oxide are also true for the binary oxide catalysts, where the copper peaks are not always visible. Moreover, all binary oxide catalyst diffractograms reveal the formation of alloys. Starting from the spent In90Cu10 XRD diffractogram, there are peaks associated with In2O3 and the Cu7In3 alloy (at 29.5°, 34.3°, 41.7°, and 42.3°, PDF 03-065-2249). In the In50Cu50 spent catalyst, in addition to In2O3 peaks, the formation of Cu11In9 and Cu9In4 alloys is observed. In fact, the peaks at 29.4°, 32.9°, 41.4°, 42.07°, and 42.1° (PDF 03-065-4963) are associated with the Cu11In9 alloy and the peaks at 29.4°, 34.2°, 37.9°, 42.0°, 43.9°, 47.3°, 52.2°, 55.7°, 58.8°, 61.3°, 72.7°, 76.1°, and 77.5° (PDF 00-002-1178) are associated with the Cu9In4 alloy. For the In10Cu90 spent catalyst, three phases are observed: Cu with the same abovementioned peaks, In2O3 with two peaks at 30.6° and 60.6° and the Cu7In3 alloy with the peaks at 29.5°, 34.3°, 41.7°, and 42.3° (PDF 03-065-2249). As mentioned previously, alloy formation is a phenomenon studied by Shi et al.35,44 They have shown that the presence of In–Cu alloys enhances the activity and stability of the catalysts for the TC CO2 conversion. Shi et al.35 have shown that Cu11In9 is formed during the oxide reduction at 350 °C with pure H2 (In:Cu = 2:1); under these conditions, an amount of In2O3 and all the CuO present in the catalyst were reduced. The presence of this alloy influences the Cu and In2O3 features leading to an increase of the H2 adsorption over Cu (alloy) and of the CO2 adsorption strength over the In2O3 at the interface with the alloy. Generally, this alloy shows thermal stability and an increase in methanol production. In a later work, Shi et al.44 have shown that the post-reduction composition of the catalyst varies with the Cu:In molar ratio. Two alloys Cu11In9 and Cu7In3, were mainly observed, but the first one remains the best option (highest Cu dispersion and highest oxygen vacancy concentration). For obtaining only the Cu11In9 alloy, Shi et al.45 found that the In:Cu molar ratio must be lower or equal to 2:1. In this work, Cu11In9 alloy formation was observed. According to the literature,45 the Cu11In9 alloy could help the H2 adsorption over Cu. At the same time, the Cu11In9–In2O3 interface could enhance the CO2 adsorption over In2O3. Looking at the XRD diffractogram, another important information is obtained from the crystallite size (Table 5).
| Sample | Phase fraction (%) | Crystallite size (nm) | ||||||||||
|---|---|---|---|---|---|---|---|---|---|---|---|---|
| In2O3 | CuO | Cu | Cu7In3 | Cu11In9 | Cu9In4 | In2O3 | CuO | Cu | Cu7In3 | Cu11In9 | Cu9In4 | |
| In100 | 100 | — | — | — | — | — | 32 | — | — | — | — | — |
| In90Cu10 | 90.7 | — | — | 9.3 | — | — | 33 | — | — | 30 | — | — |
| In50Cu50 | 18.6 | — | — | — | 54.9 | 26.5 | 36 | — | — | — | 140 | 20 |
| In10Cu90 | 1.9 | — | 62.3 | 35.8 | — | — | — | — | 52 | 51 | — | — |
| Cu100 | — | 7.4 | 92.6 | — | — | — | — | 12 | 88 | — | — | — |
By comparing copper oxides’ crystallite size with that of metallic copper, an increase in dimension in the spent catalysts is observed. Therefore, a sintering phenomenon due to reduction processes occurs. What was observed by XRD analysis is confirmed by Raman spectroscopy (Fig. S7–S11†). Raman spectroscopy for In100 and In90Cu10 did not reveal significant differences; at the same time, for Cu100 and In10Cu90 samples, a decrease of CuO content and an increase of Cu2O content from fresh to spent catalysts were observed. The formation of Cu2O could be ascribed to the aging process that reduced CuO. However, Raman spectroscopy was an ex situ measurement, so the superficial passivation of Cu was possibly not excluded. Moreover, for the In10Cu90 spent catalyst, the full width at half maximum of the CuO Raman bands decreased, confirming the effects of the sintering phenomena that occurred during the reaction. Analysis of the crystalline planes obtained by TEM (pictures are shown in Fig. S6 and Table S1†) highlights the formation of the Cu7In3 alloy in the In90Cu10 spent catalyst (see Table 5).
The SEM technique is applied again over the spent catalyst. Fig. 7 shows the pictures captured by the microscope. The SEM technique highlights the sintering phenomena due to high-temperature and reductive ambient conditions during the reaction. In fact, each image shows a reduction in the sponginess with more compact particles. In particular, spent Cu100 (Fig. 7(e)) shows very compact and bigger particles compared to other catalysts.
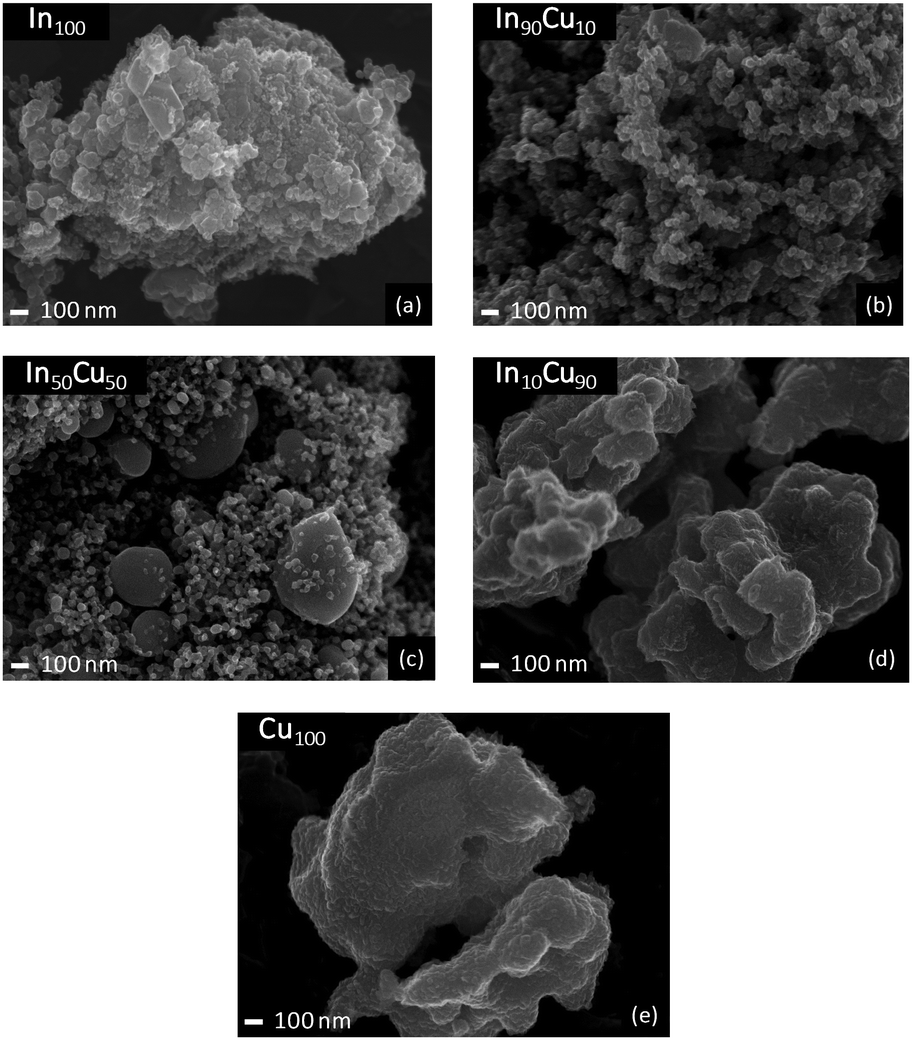 | ||
| Fig. 7 SEM images of the TC spent catalysts: (a) 80k× magnification; (b–e) 50k× magnification. | ||
Temperature-programmed analyses (TPC, TPD) were performed over the spent catalysts. CO2-TPD evaluates the basicity variation due to the reaction's ambient exposure. Table 6 reports the integral results for CO2 desorbed over spent catalysts. The catalyst with the highest basicity is In100, which quintuples the desorbed CO2. For binary catalysts, a loss of the trend is observed. The In-rich catalyst has the highest basicity compared to the other binary catalysts. Then, TPC evaluated the carbonaceous substance deposited on the catalyst surface. Table 6 reports the carbonaceous mass fraction obtained from TPC analysis. The highest value was obtained for Cu100. At the same time, In100 and In90Cu10 show a similar carbonaceous fraction. From these measurements, we can conclude that the deactivation occurs mainly by sintering with respect to the deposition of carbonaceous material. Finally, by comparing CO2-TPD and TPC, it is observed that as the basicity of the catalyst increases, and there is a greater fraction of carbon deposited.
| Sample | Carbonaceous mass fraction | CO2 desorbed |
|---|---|---|
| % | μmolCO2 mgcat−1 | |
| In100 | 0.39 | 4.054 |
| In90Cu10 | 0.36 | 0.385 |
| In50Cu50 | 0.05 | 0.084 |
| In10Cu90 | 0.14 | 0.137 |
| Cu100 | 0.50 | n.a. |
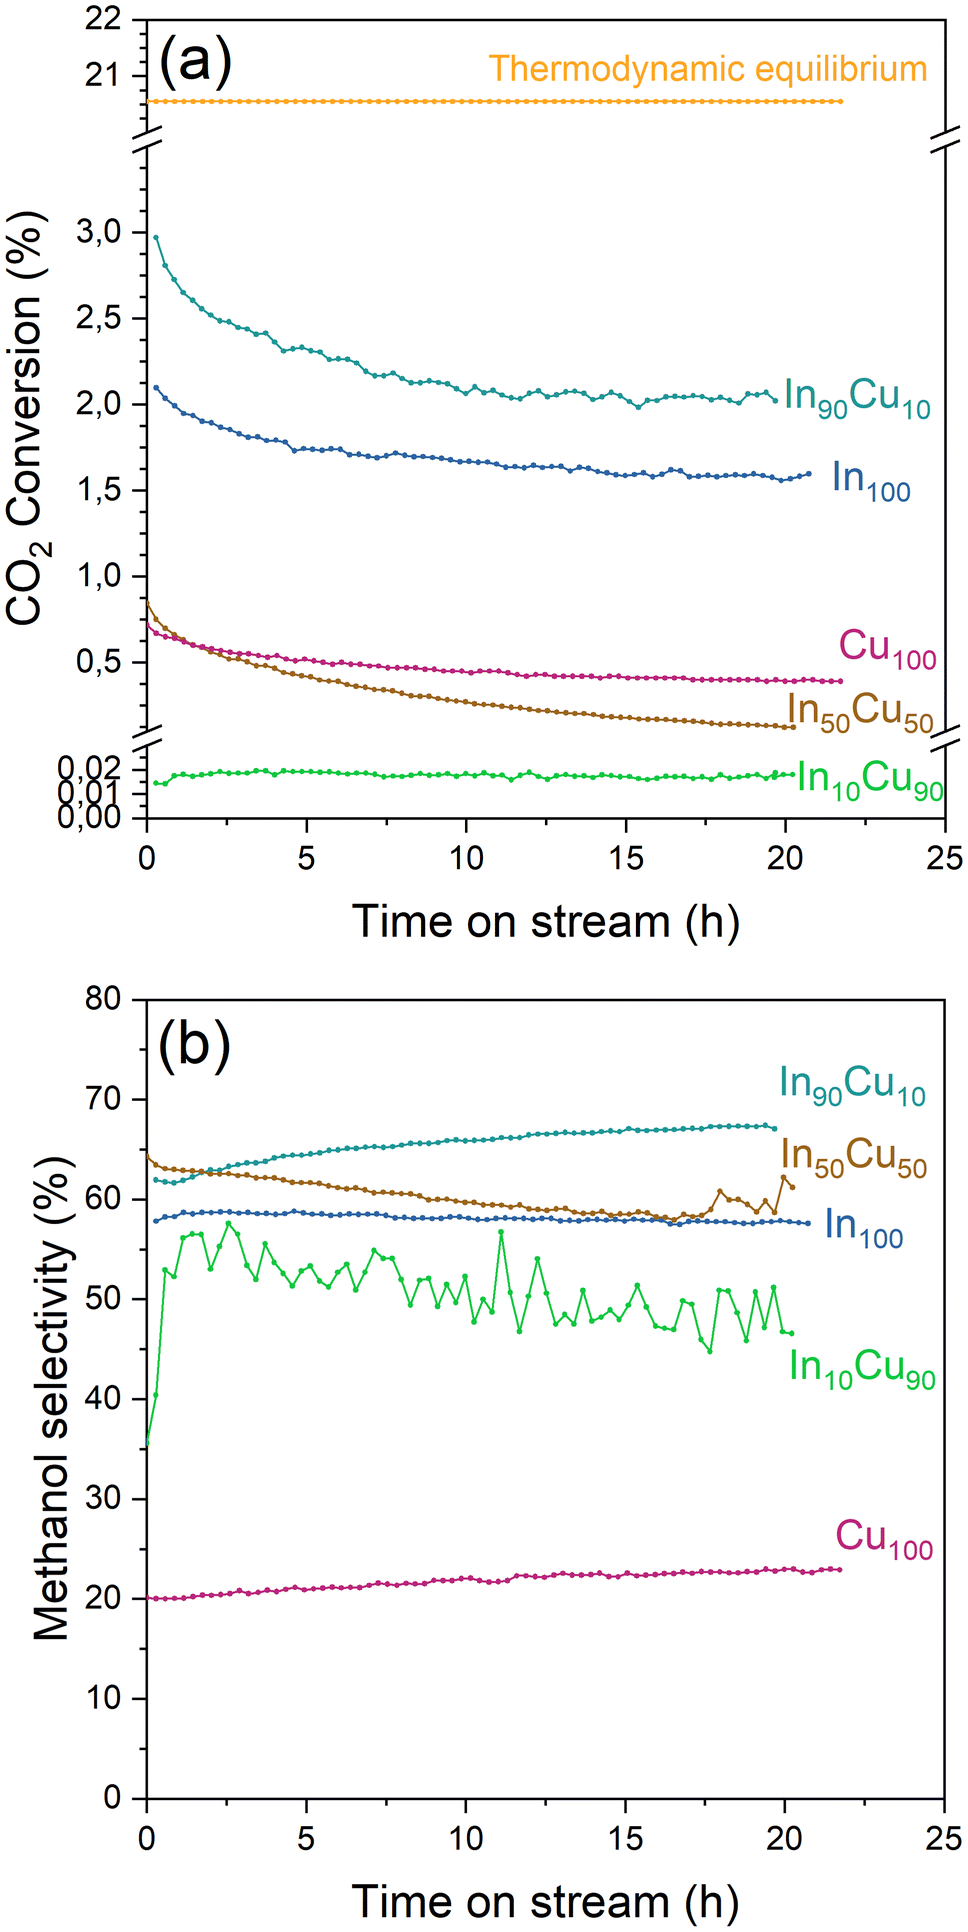 | ||
| Fig. 8 (a) CO2 conversion and (b) methanol selectivity of each catalyst during the stability test. Reaction conditions: 20 NL h−1 gcat−1, H2/CO2/N2 = 15/5/1 molar ratio, 21 bar, 275 °C for 20 h. | ||
During the stability test, it is possible to study the deactivation phenomena. The CO2 conversion profile for each catalyst (In10Cu90 excluded) presents a steep decline during the initial part of the tests (Fig. 8). This decrease could be caused by a loss of the active surface area due to the shrinkage and the rearrangement of the structure or by sintering of the particles that leads to a reduction of the dispersion of the active phase.37 After this initial decrease, the deactivation phenomena continue to influence the activity with a decrease of the CO2 conversion. In particular, the In100–In90Cu10–Cu100 have slow activity loss after 5 h. In contrast, In50Cu50 had a very fast deactivation. Considering the information obtained from the characterizations on the fresh and spent catalysts, the deactivation phenomena that take place are sintering of the particles and deposition of carbonaceous material. In particular, the effect of sintering would seem to be more significant than the deposition of the carbonaceous material (SSABET, SEM–TEM data, TPC).
At least, the deactivation kinetic is studied with eqn (11) and (12). The best-fitting equation is (12), so the results obtained with eqn (11) are reported in Table S3.†Table 7 reports the results obtained from the interpolation of eqn (12) with experimental data. Deactivation kinetic parameters show higher deactivation rates for the In50Cu50 samples as expected from the fast CO2 conversion reduction. Moreover, In50Cu50 and Cu100 catalysts show a very good fitting with our model, so it is possible to conclude that all the initial hypotheses are acceptable for these samples. Then, it is probable that sintering is the main deactivation phenomena for In50Cu50 and Cu100. To further corroborate this thesis, the SSABET variation (reported in Table 7) is equal to – 89% for this sample and SEM–TEM figures (Fig. 6 for SEM images and Fig. S6† for TEM pictures) show a loss of the initial spongy structure. Instead, In100 and In90Cu10 show a good estimate of deactivation. The deviation from the model is caused by the initial steep decrease in approximately 5 hours. It can be concluded that sintering could be the main deactivation phenomena during the catalytic activity. Fig. 9 shows the variation of the initial conversion compared to the change of SSABET before and after the stability test. It can be observed that the catalysts which have a non-zero catalytic activity, and which do not reset to zero have a comparable specific surface area variation.
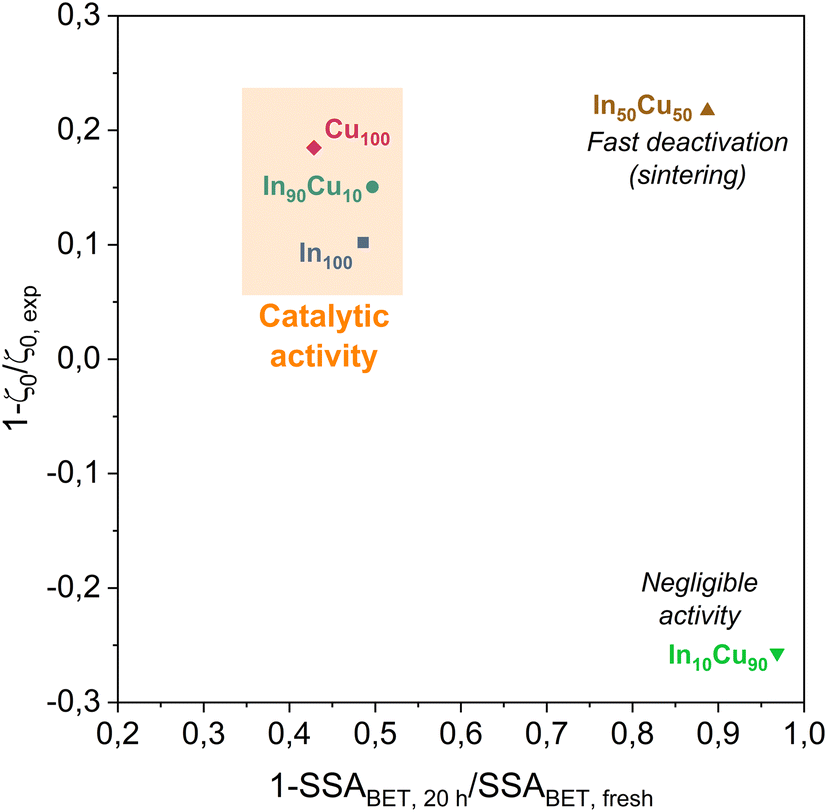 | ||
| Fig. 9 Comparison between the ratio of initial conversions ζ0 (estimated and real) and the specific surface area variation. All catalysts with significant catalytic activity are highlighted in the orange zone. | ||
| Sample | k′ | Deactivation constant kd | Correlation coefficient R2 |
|---|---|---|---|
| Nm3 kg−1 h−1 | h−1 | — | |
| a Catalyst with zero conversion, so the data obtained from the interpolation is meaningless and subject to physical errors. | |||
| In100 | 0.38 | 0.011 | 0.86 |
| In90Cu10 | 0.51 | 0.016 | 0.80 |
| In50Cu50 | 0.25 | 0.40 | 0.98 |
| In10Cu90a |
— | — | — |
| Cu100 | 0.12 | 0.027 | 0.92 |
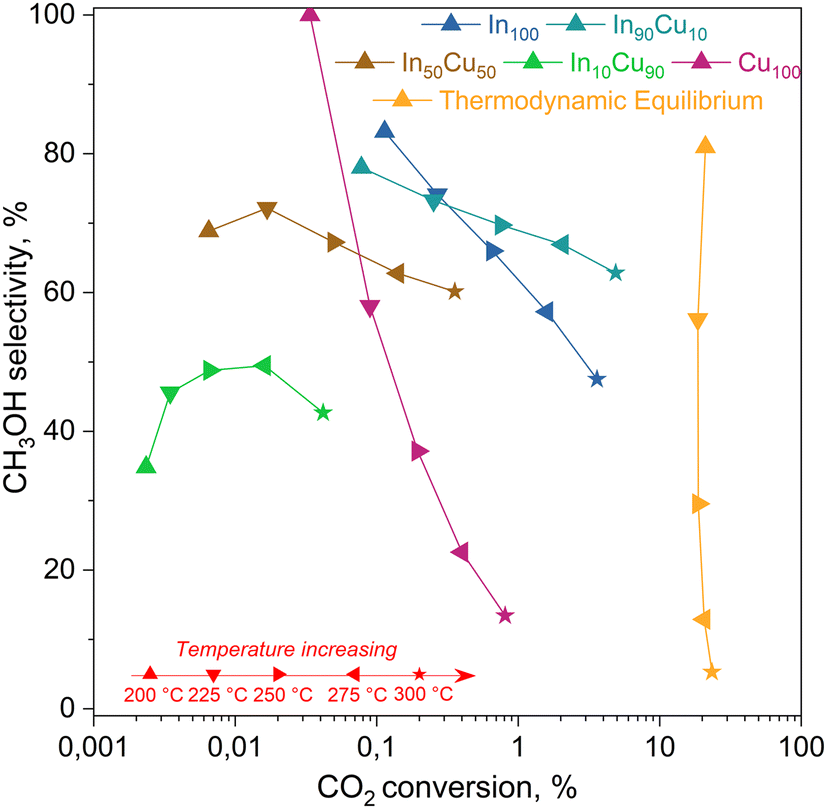 | ||
| Fig. 10 Activity test results for each catalyst. On the x-axis, the CO2 conversion estimated with eqn (6) and on the y-axis methanol selectivity calculated with eqn (7). Reaction conditions: 20 NL h−1 gcat−1, H2/CO2/N2 = 15/5/1 molar ratio, 21 bar, 200–300 °C. The equilibrium curve was calculated as equilibrium restricted to CO and methanol. | ||
From this data, a kinetic analysis was performed. Table S4† reports the results of data fitting with eqn (14). As seen in Salomone's work,37 the apparent activation energy is higher in CO synthesis than methanol synthesis. This is confirmed by the fact that methanol synthesis occurs at a lower temperature than the CO synthesis. In-based catalysts have similar activation energy, so the reaction mechanism of copper could be different. For this reason, an average value of Ea is fixed for the In-based catalyst in an attempt to decouple Ea and  . Table 8 reports the apparent pre-exponential factor obtained from Ea approximation. From the obtained data, the pre-exponential factor is higher in In100 and In90Cu10. Therefore, it is possible to conclude that the latter catalyst has a highest number of active sites that are related to a higher concentration of O defects on the surface of the catalyst, as revealed by the XPS measurements (see Table S2†), and the interaction between In2O3 and Cu–In intermetallic compounds.34,37


 :2)).
:2)).
| Catalyst | Cu content | H2/CO2 ratio | Temperature | Pressure | Space velocity | CO2 conversion | CH3OH selectivity | CH3OH space time yield | References |
|---|---|---|---|---|---|---|---|---|---|
| at% | — | °C | bar | NL kgcat−1 h−1 | % | % | gCH3OH kgcat−1 h−1 | ||
| In90Cu10 | 10.9 | 3/1 | 300 | 21 | 20000 |
4.9 | 62.8 | 265 | This work |
| CuIn-350 | 33.3 | 3/1 | 220 | 30 | 7500 | 6.9 | 89 | 131 | Shi et al. (2019)45 |
| 33.3 | 3/1 | 280 | 30 | 7500 | 11.4 | 80.5 | 197 | ||
| CuIn (1:2) |
33.6 | 3/1 | 220 | 30 | 7500 | 7 | 90 | 131 | Shi et al. (2022)34 |
| 33.6 | 3/1 | 280 | 30 | 7500 | 11.5 | 80 | 192 | ||
| CuIn@SiO2 | 8.0 | 3/1 | 280 | 30 | 7500 | 12.5 | 78.2 | 209 | Shi et al. (2019)46 |
| 8.0 | 3/1 | 280 | 30 | 20000 |
9.8 | 78.1 | 438 | ||
| CuIn/SiO2 | 8.0 | 3/1 | 280 | 30 | 7500 | 7.7 | 81.8 | 135 | Shi et al. (2019)46 |
| Cu1In2Zr4–O | 33.3 | 3/1 | 270 | 20 | 12000 |
12.8 | 72.8 | 347 | Gao et al. (2020)47 |
Electrocatalytic test results
The electrocatalytic tests were performed in the presence of a KOH-based solution. Indeed, although most studies have been performed with the bicarbonate anion (HCO3−) in an aqueous electrolyte, highly alkaline electrolytes have been shown to improve C2+ selectivity and suppress hydrogen evolution.48 Besides the effect on CO2 reduction reaction kinetics, the conductivity of the solution is an important aspect. For a large-scale implementation, the ohmic losses must be in fact minimized, given their direct impact on the energy efficiency of the whole process.49 In this regard, the conductivity of 1.0 M KOH solution is an order of magnitude higher than in the case of 0.1 M KHCO3. Therefore, the Cu-rich and In-rich catalysts were tested under such conditions to compare their performance in terms of products obtained with the same catalysts used for CO2 thermocatalytic conditions and to literature data on heterogeneous electrocatalysts. Considering the chemical composition of the In-containing catalysts showing mainly In2O3 in the XRD spectra (see Fig. 3), a pre-treatment step for their partial reduction was applied to promote the formation of defective indium/indium oxide heterostructures. Indeed, the literature shows a boosted performance for CO2 reduction due to the cooperation between formate production sites (metallic indium) and hydrogen-suppressing sites (indium oxide).26 The electrochemical analyses were conducted under the working conditions described in the Electrode measurements section. Fig. 11(a) shows the electroactivity of the In–Cu bicomponent catalysts between 0 and −2.5 V vs. Ag/AgCl in aqueous media. A rightward shift of the onset value towards more positive applied potentials can be noticed due to the Cu-enrichment. In addition, higher activity was evidenced by the In-poor catalysts: the In50Cu50, In10Cu90 and Cu100, showing a cathodic current density of −75 mA cm−2 at −2.5 V vs. Ag/AgCl, which is approx. 33% higher than the one developed by In100 and In90Cu10 electrodes, respectively. Furthermore, to promote CO2 conversion to more reduced products, a not pre-treated Cu100-based electrode also was tested, looking to preserve the Cu1+/Cu2+ interfaces of the fresh samples (see Fig. 3). The reductive current density recorded in this case, −85 mA cm−2, at the most negative potential, far exceeded the values mentioned before.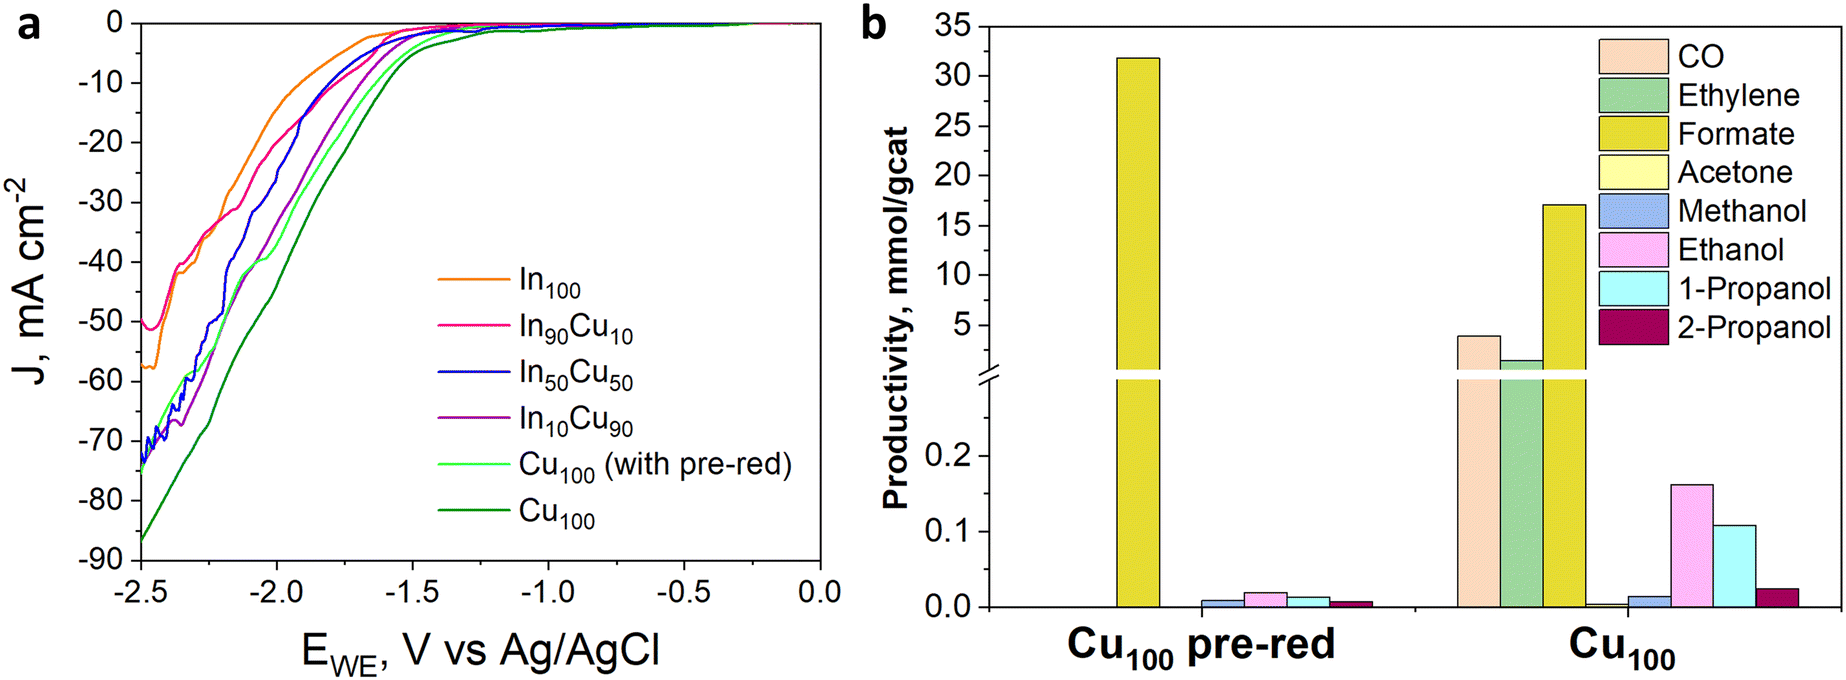 | ||
| Fig. 11 (a) LSV curves under CO2 flow of InxCuy-based electrodes with a catalyst loading of 1.4 mg cm−2 carried out in 1 M KOH aqueous electrolyte; (b) productivity of Cu100-based electrodes (with and without pre-reduction treatment) with a catalyst loading of 1.4 mg cm−2 tested in 1 M KOH aqueous electrolyte. | ||
In Fig. 11(b), from comparing the product distribution of the two Cu100 electrodes (the pre-reduced and the not-pre-treated one), it is possible to observe that some C-containing products other than formate were obtained by avoiding the pre-reduction step. Such a catalyst was demonstrated to also be active for the thermodynamically preferred hydrogen evolution reaction. Moreover, the distribution of gaseous and liquid CO2 reduction products for the InxCuy catalysts (see Fig. 12(a)) reveals that the higher the indium content, the higher the formate faradaic efficiency (FE), suppressing the hydrogen production, as shown in Fig. 12(b). It could be attributed to the spontaneously formed oxide layer that covers the In2O3 materials.50 In particular, the In100 catalyst reported a FEformate of about 16%.
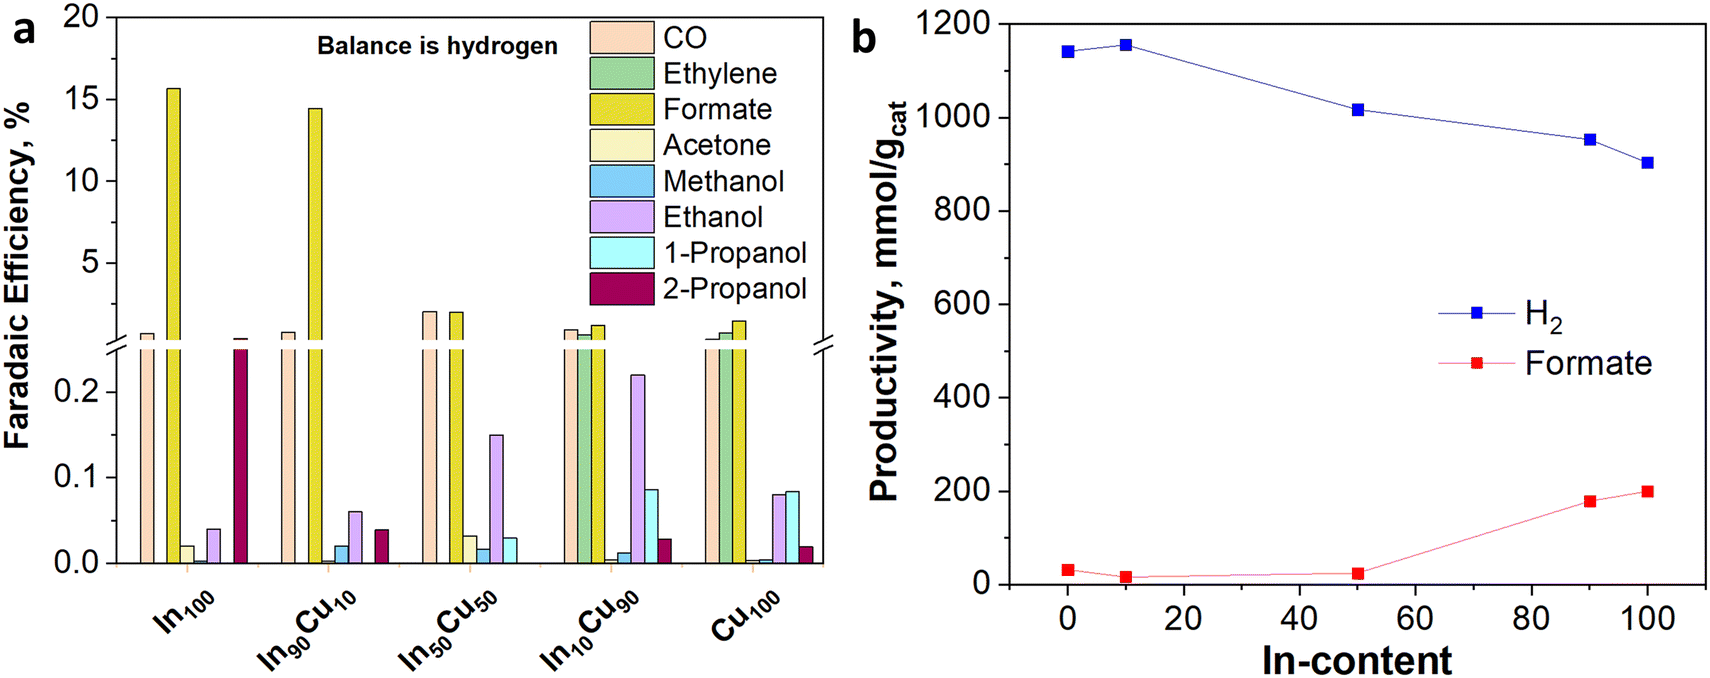 | ||
| Fig. 12 (a) Faradaic efficiency distribution of InxCuy-based electrodes with a catalyst loading of 1.4 mg cm−2, tested in 1 M KOH aqueous electrolyte at −50 mA cm−2 (b) relationship between hydrogen and formate productivity with the In-content. | ||
With a particular focus on industrial deployment, CO2 electrolyzers must provide modest cell voltages during operations and selectively produce concentrated target products at high rates.51 Many researchers face this challenge by adopting a membrane-electrode assembly configuration, an attractive cell design exhibiting low ohmic loss and high energy efficiency.52 On the other hand, the use of this kind of system for the EC CO2R to liquid products is attractive because it could avoid problems of CO2 solubility, and it is not required to use expensive and energy-intensive processes to recover the products from the liquid phase (such as distillation processes).53 Moreover, MEA cells can reach current densities that are one order of magnitude higher than the ones developed with typical aqueous architectures.54 Therefore, the MEA configuration was investigated to assess the electroactivity and selectivity of the best-performing InxCuy catalyst, in terms of CO2 reduction products, under gas-phase electrolysis conditions. The linear sweep voltammetry curves characterizing the In100 catalyst and depicted in Fig. 13(a) revealed a lower onset potential in MEA, as well as a better total activity, with a higher cathodic current density (−65 mA cm−2), attained at the highest applied potential than that observed in the GDE system. Considering the distribution of the product in Fig. 13(b), it can also be noticed that the MEA configuration improved the CO2 reduction reaction. In particular, the MEA configuration allowed a slight increase in formate and CO productivity compared to GDE. The higher selectivity towards a single liquid demonstrates that the zero-gap electrolyzers offer a real opportunity to produce concentrated target products. Table 10 summarises the EC performance of our best electrodes (In90Cu10 and In100) and compares them with other In-based catalysts for CO2 electroreduction. Very selective and stable materials for C1 products are reported in the literature. However, these tests have been carried out mainly in batch and small scale-systems (active area ≤ 4 cm2). Several issues must be addressed when scaling the electrode area, among which is minimising the reactant and product gradients within the chambers, which can show up as early as in the transition from 1 cm2 to 10 cm2.
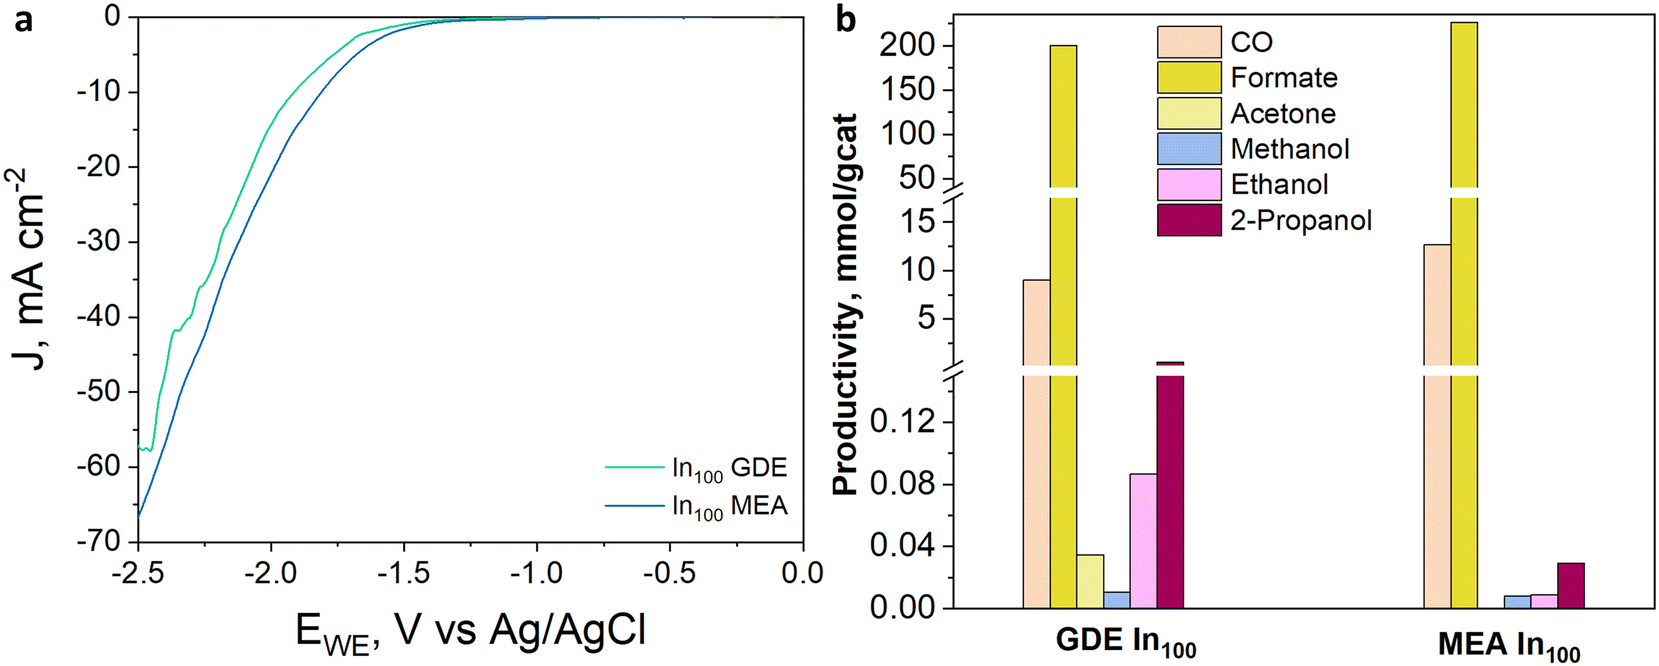 | ||
| Fig. 13 (a) LSV curves under CO2 flow and (b) productivity of In100-based electrodes (GDE and MEA) with a catalyst loading of 1.4 mg cm−2 tested in 1 M KOH aqueous electrolyte at −50 mA cm−2. | ||
| Catalyst | Cell type | FECO | FEHCOO− | Current density | Testing time | Area | Electrolyte | References |
|---|---|---|---|---|---|---|---|---|
| — | % | % | mA cm−2 | hours | cm2 | Salt, concentration | ||
| In90Cu10 | Flow cell | 1 | 15.7 | 50 | 2 | 10 | KOH, 1.0 M | This work |
| In100 | Flow cell | 1 | 17.3 | 50 | 2 | 10 | KOH, 1.0 M | This work |
| ZnIn2S4 | Flow cell | — | 97 | 300 | 60 | 1 | KHCO3, 1.0 M | Chi et al. 202155 |
| In–N3–V | H-cell | 95 | — | ∼2 | 14 | 1 | KHCO3, 0.5 M | Li et al. 202256 |
| In–N3–V | Flow cell | 97 | — | 10 | <1 | 2.25 | KOH, 1.0 M | Li et al. 202256 |
| In–N | Flow cell | — | 91 | 30 | 3 | 4 | KOH, 1.0 M | Zhang et al. 202057 |
| In–Sn alloy | H-cell | — | 78.6 | ∼10 | 12 | 0.5 | KHCO3, 0.1 M | Jae Dong et al. 201758 |
| Cu25In75 | H-cell | — | 84.1 | 5.3 | 1 | — | NaHCO3, 0.5 M | Zhu et al. 201933 |
Electrode characterization
Post-mortem SEM and XRD analyses were conducted to get deeper insights into the electrochemical behavior of the tested electrodes. The data demonstrated the current-induced morphological and crystallographic structural changes of the indium-based catalysts occurring under different cell configurations. An EDS map (see Fig. 14) was made in the deposited layer, demonstrating a uniform coverage of In element on the carbon substrate even after the test. Other elements (i.e., K, C, F, and S) were also visible in the EDS analyses due to the carbon substrate, the binder (Nafion) used for the catalytic ink preparation and the electrolyte (KOH).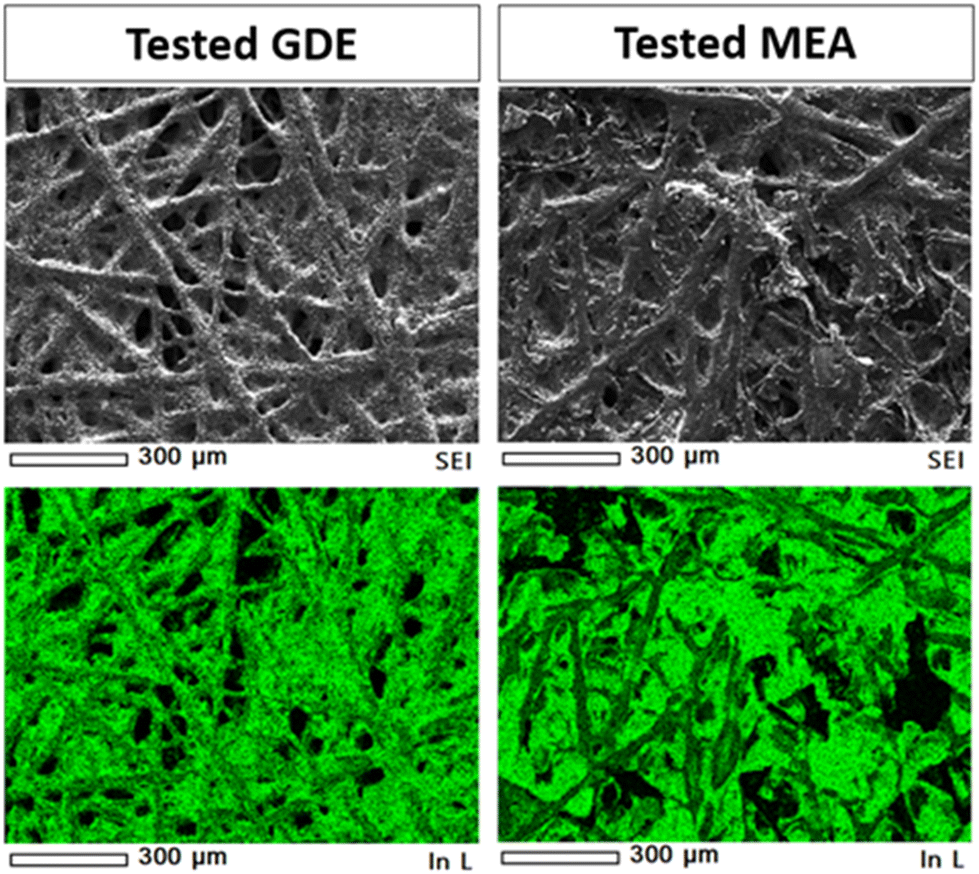 | ||
| Fig. 14 SEM-EDS analyses of In100 electrodes: low magnification SEM images and EDS maps of In element on the GDE and MEA electrodes after electrochemical CO2 reduction tests in 1 M KOH aqueous electrolyte at −50 mA cm−2. | ||
The post-mortem microscopy characterization of the In100 tested electrode in the GDE system demonstrated the presence of more coalesced particles than the fresh powder (Fig. 15(a)). In addition, the In100 tested in GDE exhibited snowflake-like particles after the electrochemical CO2 reduction, as seen in Fig. 15(b). The test of the In100 catalyst in MEA configuration provoked a different morphological transformation. After testing, the pristine shape of the powder was no longer observed, having coalesced into a smooth surface covered with nanoparticles, as shown in Fig. 15(c). The chemical composition and the bonding state on the surface generated after co-electrolysis were identified by XPS analysis. Fig. S13† shows the In 3d core levels of In100 fresh, In100 tested in GDE and In100 tested in MEA. The binding energies at 444.1 eV and the one at 451.6 eV were assigned to In 3d5/2 and In 3d3/2, correspondingly. The spin orbit splitting between 3d3/2 and In 3d5/2 is 7.5 eV, indicating that the pristine In100 nanoparticles are 100% In2O3.59 Moreover, it is demonstrated that In3+ species are stabilized at the catalyst surface of both electrodes after testing. A slight shift to higher binding energy after testing in GDE was observed, signaling that the electronic structure was affected during operation. The results are consistent with the presence of In(OH)3 in the XRD patterns, confirming that the oxidation state of In3+ is predominant on the surface at the expense of metallic In. Interestingly the MEA electrode surface evidenced the presence of both In3+ and In0. This behavior could be ascribed to the different reaction media, with aqueous electrolyte in the GDE and humidified gas in the MEA. The post-mortem XRD analysis of the GDE electrode detected In0, In2O3, and In(OH)3 phases after testing (see Fig. 15(d)). Instead, Fig. 15(e) shows that on the In100 tested electrode in MEA, only the In(OH)3 was detected as the In-content phase. Inorganic phase related to potassium compounds were identified in both cases, which is ascribed to the electrolyte solution (either to the catholyte in the GDE case or to the anolyte in the MEA case because of K+ crossover through the membrane).60 The ex situ XRD analysis demonstrated that the presence and stabilization of In(OH)3 actively participate in the electrochemical CO2 reduction reaction mechanism, promoting the two proton-coupled electron-transfer (PCET) reactions and favouring the formation of CO and formate. Indeed, a recent study demonstrated the potential of nonreducible hydroxides to act as promoters in CO2 reduction electrocatalysis.32 On the other hand, the formation of other In-based species with different oxidation states than In2O3 (i.e. In and In(OH)3) under the electroreductive conditions demonstrated inducing a synergistic effect that favoured the formation of C3 products, like 2-propanol in the GDE configuration. The co-presence of those interfaces contributed to the dimerization of *CO (CO adsorbed) to generate C–C bonds, which could justify the diverse selectivity of these electrodes.
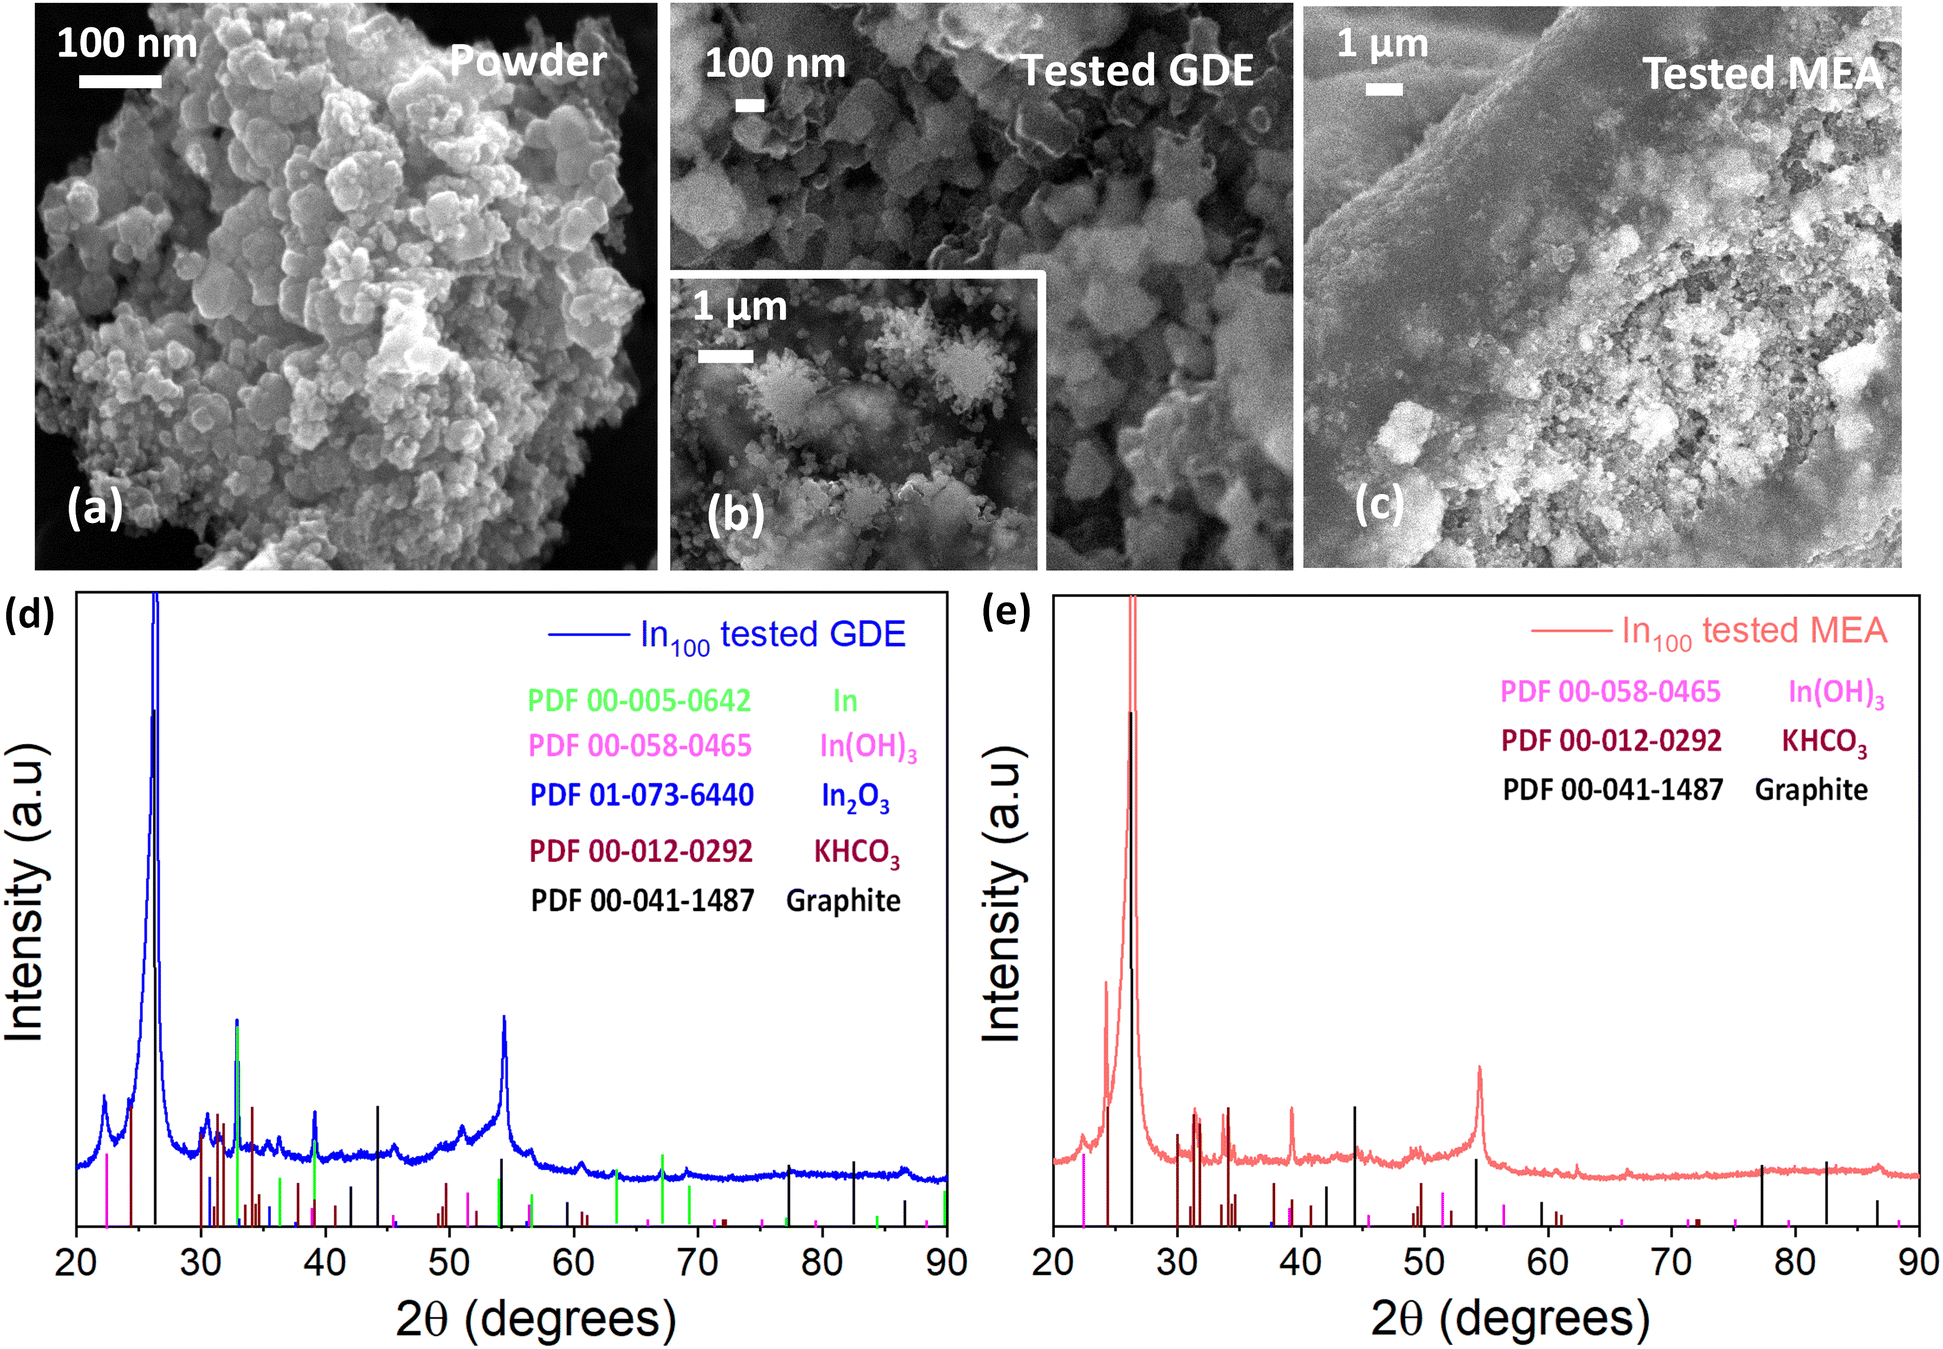 | ||
| Fig. 15 In100 catalyst: SEM images of (a) fresh nanopowder; (b) after electrochemical CO2 reduction in the GDE system; (c) after electrochemical CO2 reduction in the MEA system; (d) XRD pattern obtained on the post-mortem GDE electrode, and (e) XRD pattern obtained at Eni SpA in the post-mortem MEA electrode. | ||
Relationships between thermo- and electrocatalysis
Indium belongs to the p-block metals, which are considered adequate in a quantitative scale of oxophilicity. The spontaneously formed oxide layer that covers the p-block metals gives them basicity, promoting the chemisorption of acidic CO2 molecules.61 Those point defects on the In2O3 surface are believed to be periodically generated, encouraging CO2 hydrogenation to methanol and inhibiting side reactions in a thermochemical system. Regarding electrocatalysis, in the literature, those post-transition elements are classified to possess a weak *H bond, suppressing hydrogen evolution and favouring the thermodynamically preferred CO2 reduction.62In situ and operando characterization have demonstrated that In2O3 is the active phase for the methanol formation, whereas In0 led to the catalyst deactivation in the CO2 hydrogenation at high temperatures and pressures.62 Conversely, our results evidenced that the co-presence of different phases and oxidation states (In0, In2O3, In(OH)3) actively participate in the electrochemical CO2 reduction reaction to formate and more reduced products, demonstrating that employing fundamental similarities from the viewpoint of surface science and electrical potentials instead of elevated temperatures show a synergistic interaction in hydrogenating CO2.32,50 Formate or formic acid is a desirable liquid fuel candidate and profitable product because of its high energy density (7.6 MJ L−1) and value as a raw material for obtaining several organic compounds. At the present stage, producing formic acid or formate through two proton-coupled-electron-transfer (PCET) processes seems to have more commercial opportunities than methanol, which requires six exchanged protons and electrons to be formed.63
DFT calculations have been performed to establish the reaction pathways and the corresponding rate-determining steps for CO2 hydrogenation through elevated temperatures or electrical potentials on p-block metal-based materials. Dou et al.64,65 stated that exothermic methanol from CO2 thermochemical hydrogenation could be produced through HCOO* and RWGS routes on defective In2O3 surfaces. The energy barrier for the formation of methanol from CO hydrogenation (1.26 eV) is lower than the formate pathway (1.54 eV), and kinetically more favourable in the presence of water-derived species.66,67 Thus, calculations show that CO2 hydrogenation to methanol may also follow the *COOH route, although the methoxy (H3CO*) species obtained from formate (HCOO*) species hydrogenation are thermodynamically the most stable surface intermediates. Likewise, under electrochemical conditions, the reaction pathways for these types of electrocatalysts are similar to the abovementioned: (i) through direct carbon-bond *COOH intermediates, as described by Hori et al.,68 and (ii) via a PCET process via HCOO* intermediates.69 Our results revealed that the In100 is an effective In2O3 surface for CH3OH formation in the thermocatalytic process, demonstrating a high selectivity (∼60%). The performance was enhanced by introducing a small atomic fraction (10%) of a d-block element (Cu) into the catalyst (∼70% methanol selectivity), indicating that the energy barrier accordingly decreased. It can be attributed to preserving the oxygen vacancies on the In2O3 surface during the reaction (Fig. 11), stabilizing the key intermediates involved in methanol formation. On the other hand, the electrochemical CO2 activation and hydrogenation on the In100 electrocatalyst faced the competitive hydrogen evolution reaction (HER), which was the major product. However, it led to formate and CO production after two PCET reactions in both GDE and MEA configurations. Interestingly, despite the potential for the spontaneous surface oxide layer, the catalyst was reduced under CO2 reduction conditions, whose species participated in the reduction reaction. In particular, in the GDE configuration, the co-presence of In0, In2O3 and In(OH)3 active phases promoted *CO dimerization, leading to more reduced products, such as ethanol and 2-propanol. Nevertheless, further efforts are required to break the strong linear correlation between the free energies of COOH* and H* to boost the electrocatalytic CO2 reduction performance over the HER, including morphology control, nanostructuring, doping, alloying and defect engineering.
Conclusions
The catalytic performance of In-based catalysts was evaluated in thermocatalytic and electrocatalytic processes. The influence of Cu-based materials was assessed in the catalyst structure. The bare Cu-based catalyst presents good CO2 conversion but low methanol selectivity at high temperatures and pressures. Conversely, In2O3 shows an interesting methanol selectivity but low CO2 conversion. Herein, the synthesized In-rich binary materials improve the methanol yield, increasing almost 3 times the productivity, achieving a value of 265 mgMeOH h−1 gIn2O3−1. Moreover, In90Cu10 showed very promising thermocatalytic performance when compared with other catalysts reported in the literature; in fact, it achieved a CO2 conversion of 4.87%, a methanol selectivity of 62.8%, and a methanol yield of 3.06% at 300 °C, which correspond to 51% of the equilibrium methanol yield. XRD measurements after testing confirmed that the In2O3 phase was the active site of methanol formation during CO2 hydrogenation. Instead, in the electrochemical process, different In active sites (In0, In2O3, and In(OH)3) take part in the CO2 reduction reaction to formate and more reduced products, evidencing the potential of nonreducible hydroxides as promoters. Fundamental similarities in surface science and electrical potentials instead of elevated temperatures show a synergistic interaction in hydrogenating CO2.Author contributions
M. P. Mezzapesa: catalyst synthesis, thermocatalytic investigation, methodology, visualization and writing – original draft; F. Salomone: conceptualization, catalysts synthesis, thermocatalytic investigation, methodology validation and writing – original draft; H. Guzmán: conceptualization, electrocatalytic investigation, methodology validation and writing – original draft; F. Zammillo: conceptualization, electrocatalytic investigation, methodology, visualization and writing – original draft; R. Millini: conceptualization, resources, supervision and writing – review and editing; L. Bua: conceptualization, resources, supervision and writing – review and editing; G. Marra: X-ray diffraction investigation, writing – review and editing; A. Tacca: conceptualization, resources, supervision, writing – review and editing; R. Marrazzo: Raman spectroscopy investigation, visualization and writing – review and editing; N. Russo: methodology, writing – review & editing; R. Pirone: methodology, supervision and writing – review and editing; S. Bensaid: conceptualization, thermocatalytic investigation, methodology, project administration, resources, supervision and writing – review and editing; S. Hernández: conceptualization, electrocatalytic investigation, methodology, project administration, resources, supervision, writing – original draft and writing – review and editing. All authors have read and agreed to the published version of the manuscript.Conflicts of interest
There are no conflicts to declare.Acknowledgements
F. S. acknowledges the Italian Ministry of University and Research (MUR), program FSE REACT-EU PON Ricerca e Innovazione 2014-2020 (D.M. 1062/2021). S. H. acknowledges the project CO2Synthesis (ID ROL: 67910) funded by Fondazione Compagnia di San Paolo in the Call Trapezio – Linea 1. This manuscript reflects only the authors’ views and opinions; neither the European Union nor the European Commission can be considered responsible for them.References
- P. P. C. Udani, P. V. D. S. Gunawardana, H. C. Lee and D. H. Kim, Steam reforming and oxidative steam reforming of methanol over CuO-CeO2 catalysts, Int. J. Hydrogen Energy, 2009, 34, 7648–7655 CrossRef CAS.
- S. Sá, H. Silva, L. Brandão, J. M. Sousa and A. Mendes, Catalysts for methanol steam reforming-A review, Appl. Catal., B, 2010, 99, 43–57 CrossRef.
- Z.-J. Zuo, L. Wang, P.-D. Han and W. Huang, Insights into the reaction mechanisms of methanol decomposition, methanol oxidation and steam reforming of methanol on Cu(111): A density functional theory study, Int. J. Hydrogen Energy, 2014, 39, 1664–1679 CrossRef CAS.
- J. A. Moulijn, M. Makkee and A. E. Van Diepen, Chemical Process Technology, 2nd edn, 2013 Search PubMed.
- R. C. Baliban, J. A. Elia, V. Weekman and C. A. Floudas, Process synthesis of hybrid coal, biomass, and natural gas to liquids via Fischer-Tropsch synthesis, ZSM-5 catalytic conversion, methanol synthesis, methanol-to-gasoline, and methanol-to-olefins/distillate technologies, Comput. Chem. Eng., 2012, 47, 29–56 CrossRef CAS.
- A. A. Rownaghi and J. Hedlund, Methanol to gasoline-range hydrocarbons: Influence of nanocrystal size and mesoporosity on catalytic performance and product distribution of ZSM-5, Ind. Eng. Chem. Res., 2011, 50, 11872–11878 CrossRef CAS.
- Z. Wan, W. Wu, W. Chen, H. Yang and D. Zhang, Direct synthesis of hierarchical ZSM-5 zeolite and its performance in catalyzing methanol to gasoline conversion, Ind. Eng. Chem. Res., 2014, 53, 19471–19478 CrossRef CAS.
- B. P. C. Hereijgers, F. Bleken, M. H. Nilsen, S. Svelle, K. P. Lillerud, M. Bjørgen, B. M. Weckhuysen and U. Olsbye, Product shape selectivity dominates the Methanol-to-Olefins (MTO) reaction over H-SAPO-34 catalysts, J. Catal., 2009, 264, 77–87 CrossRef CAS.
- M. R. Gogate, Methanol-to-olefins process technology: current status and future prospects, Pet. Sci. Technol., 2019, 37, 559–565 CrossRef CAS.
- M. Ye, P. Tian and Z. Liu, DMTO: A Sustainable Methanol-to-Olefins Technology, Engineering, 2021, 7, 17–21 CrossRef.
- P. Tian, Y. Wei, M. Ye and Z. Liu, Methanol to olefins (MTO): From fundamentals to commercialization, ACS Catal., 2015, 5, 1922–1938 CrossRef CAS.
- M. Yang, D. Fan, Y. Wei, P. Tian and Z. Liu, Recent Progress in Methanol-to-Olefins (MTO) Catalysts, Adv. Mater., 2019, 31, 1902181 CrossRef CAS PubMed.
- L. C. Grabow and M. Mavrikakis, Mechanism of methanol synthesis on cu through CO2 and CO hydrogenation, ACS Catal., 2011, 1, 365–384 CrossRef CAS.
- R. Burch, R. J. Chappell and S. E. Golunski, Synergy between copper and zinc oxide during methanol synthesis. Transfer of activating species, J. Chem. Soc., Faraday Trans. 1, 1989, 85, 3569–3578 RSC.
- M. Bowker, R. A. Hadden, H. Houghton, J. N. K. Hyland and K. C. Waugh, The mechanism of methanol synthesis on copper/zinc oxide/alumina catalysts, J. Catal., 1988, 109, 263–273 CrossRef CAS.
- H. Guzmán, F. Salomone, E. Batuecas, T. Tommasi, N. Russo, S. Bensaid and S. Hernández, How to make sustainable CO2 conversion to Methanol: Thermocatalytic versus electrocatalytic technology, Chem. Eng. J., 2020, 127973 Search PubMed.
- H. Guzmán, F. Salomone, S. Bensaid, M. Castellino, N. Russo and S. Hernández, CO2 Conversion to Alcohols over Cu/ZnO Catalysts: Prospective Synergies between Electrocatalytic and Thermocatalytic Routes, ACS Appl. Mater. Interfaces, 2022, 14, 517–530 CrossRef PubMed.
- C. Y. Chou and R. F. Lobo, Direct conversion of CO2 into methanol over promoted indium oxide-based catalysts, Appl. Catal., A, 2019, 583, 117144 CrossRef CAS.
- A. A. Kiss, J. J. Pragt, H. J. Vos, G. Bargeman and M. T. de Groot, Novel efficient process for methanol synthesis by CO2 hydrogenation, Chem. Eng. J., 2016, 284, 260–269 CrossRef CAS.
- O. Martin, A. J. Martín, C. Mondelli, S. Mitchell, T. F. Segawa, R. Hauert, C. Drouilly, D. Curulla-Ferré and J. Pérez-Ramírez, Indium Oxide as a Superior Catalyst for Methanol Synthesis by CO2 Hydrogenation, Angew. Chem., Int. Ed., 2016, 55, 6261–6265 CrossRef CAS PubMed.
- T. P. Araújo, A. Shah, C. Mondelli, J. A. Stewart, D. Curulla Ferré and J. Pérez-Ramírez, Impact of hybrid CO2-CO feeds on methanol synthesis over In2O3-based catalysts, Appl. Catal., B, 2021, 285, 119878 CrossRef.
- J. Ye, C. Liu, D. Mei and Q. Ge, Active Oxygen Vacancy Site for Methanol Synthesis from CO2 Hydrogenation on In2O3(110): A DFT Study, ACS Catal., 2013, 3, 1296–1306 CrossRef CAS.
- O. Martin, A. J. Martín, C. Mondelli, S. Mitchell, T. F. Segawa, R. Hauert, C. Drouilly, D. Curulla-Ferré and J. Pérez-Ramírez, Indium Oxide as a Superior Catalyst for Methanol Synthesis by CO2 Hydrogenation, Angew. Chem., Int. Ed., 2016, 55, 6261–6265 CrossRef CAS PubMed.
- M. S. Frei, C. Mondelli, R. García-Muelas, K. S. Kley, B. Puértolas, N. López, O. V. Safonova, J. A. Stewart, D. Curulla Ferré and J. Pérez-Ramírez, Atomic-scale engineering of indium oxide promotion by palladium for methanol production via CO2 hydrogenation, Nat. Commun., 2019, 10, 1–11 CrossRef PubMed.
- T. Pinheiro Araújo, J. Morales-Vidal, T. Zou, R. García-Muelas, P. O. Willi, K. M. Engel, O. V. Safonova, D. Faust Akl, F. Krumeich, R. N. Grass, C. Mondelli, N. López and J. Pérez-Ramírez, Flame Spray Pyrolysis as a Synthesis Platform to Assess Metal Promotion in In2O3-Catalyzed CO2 Hydrogenation, Adv. Energy Mater., 2022, 12 DOI:10.1002/aenm.202103707.
- W. Yang, Y. Zhao, S. Chen, W. Ren, X. Chen, C. Jia, Z. Su, Y. Wang and C. Zhao, Defective Indium/Indium Oxide Heterostructures for Highly Selective Carbon Dioxide Electrocatalysis, Inorg. Chem., 2020, 59, 12437–12444 CrossRef CAS PubMed.
- Z. M. Detweiler, J. L. White, S. L. Bernasek and A. B. Bocarsly, Anodized Indium Metal Electrodes for Enhanced Carbon Dioxide Reduction in Aqueous Electrolyte, Langmuir, 2014, 30, 7593–7600 CrossRef CAS PubMed.
- Z. Xia, M. Freeman, D. Zhang, B. Yang, L. Lei, Z. Li and Y. Hou, Highly Selective Electrochemical Conversion of CO2 to HCOOH on Dendritic Indium Foams, ChemElectroChem, 2018, 5, 253–259 CrossRef CAS.
- S. Rasul, D. H. Anjum, A. Jedidi, Y. Minenkov, L. Cavallo and K. Takanabe, A Highly Selective Copper-Indium Bimetallic Electrocatalyst for the Electrochemical Reduction of Aqueous CO2 to CO, Angew. Chem., Int. Ed., 2015, 54, 2146–2150 CrossRef CAS PubMed.
- W. Luo, W. Xie, R. Mutschler, E. Oveisi, G. L. De Gregorio, R. Buonsanti and A. Züttel, Selective and Stable Electroreduction of CO2 to CO at the Copper/Indium Interface, ACS Catal., 2018, 8, 6571–6581 CrossRef CAS.
- H. Xie, S. Chen, F. Ma, J. Liang, Z. Miao, T. Wang, H.-L. Wang, Y. Huang and Q. Li, Boosting Tunable Syngas Formation via Electrochemical CO2 Reduction on Cu/In2O3 Core/Shell Nanoparticles, ACS Appl. Mater. Interfaces, 2018, 10, 36996–37004 CrossRef CAS PubMed.
- G. O. Larrazábal, A. J. Martín, S. Mitchell, R. Hauert and J. Pérez-Ramírez, Enhanced Reduction of CO2 to CO over Cu–In Electrocatalysts: Catalyst Evolution Is the Key, ACS Catal., 2016, 6, 6265–6274 CrossRef.
- M. Zhu, P. Tian, J. Li, J. Chen, J. Xu and Y. Han, Structure-Tunable Copper–Indium Catalysts for Highly Selective CO2 Electroreduction to CO or HCOOH, ChemSusChem, 2019, 12, 3955–3959 CrossRef CAS PubMed.
- Z. Shi, M. Pan, X. Wei and D. Wu, Cu–In intermetallic compounds as highly active catalysts for CH3OH formation from CO2 hydrogenation, Int. J. Energy Res., 2022, 46, 1285–1298 CrossRef CAS.
- Z. Shi, Q. Tan, C. Tian, Y. Pan, X. Sun, J. Zhang and D. Wu, CO2 hydrogenation to methanol over Cu-In intermetallic catalysts: Effect of reduction temperature, J. Catal., 2019, 379, 78–89 CrossRef CAS.
- F. Salomone, G. Bonura, F. Frusteri, M. Castellino, M. Fontana, A. M. Chiodoni, N. Russo, R. Pirone and S. Bensaid, Physico-Chemical Modifications Affecting the Activity and Stability of Cu-Based Hybrid Catalysts during the Direct Hydrogenation of Carbon Dioxide into Dimethyl-Ether, Materials, 2022, 15, 7774 CrossRef CAS PubMed.
- F. Salomone, E. Sartoretti, S. Ballauri, M. Castellino, C. Novara, F. Giorgis, R. Pirone and S. Bensaid, CO2 hydrogenation to methanol over Zr- and Ce-doped indium oxide, Catal. Today, 2023, 423, 114023 CrossRef CAS.
- G. Bonura, M. Cordaro, C. Cannilla, F. Arena and F. Frusteri, The changing nature of the active site of Cu-Zn-Zr catalysts for the CO2 hydrogenation reaction to methanol, Appl. Catal., B, 2014, 152–153, 152–161 CrossRef CAS.
- O. Levenspiel, Chemical Reaction Engineering, John Wiley & Sons, 3rd edn, 1999, vol. 35 Search PubMed.
- K. S. W. Sing, Reporting physisorption data for gas/solid systems with special reference to the determination of surface area and porosity (Provisional), Pure Appl. Chem., 1982, 54, 2201–2218 CrossRef.
- R. Wang, S. Sang, D. Zhu, S. Liu and K. Yu, Pore characteristics and controlling factors of the Lower Cambrian Hetang Formation shale in Northeast Jiangxi, China, Energy Explor. Exploit., 2018, 36, 43–65 CrossRef CAS.
- J. C. P. Broekhoff, Mesopore Determination from Nitrogen Sorption Isotherms: Fundamentals, Scope, Limitations, 1979, pp. 663–684 Search PubMed.
- L. Debbichi, M. C. Marco de Lucas, J. F. Pierson and P. Krüger, Vibrational Properties of CuO and Cu4O3 from First-Principles Calculations, and Raman and Infrared Spectroscopy, J. Phys. Chem. C, 2012, 116, 10232–10237 CrossRef CAS.
- Z. Shi, M. Pan, X. Wei and D. Wu, Cu–In intermetallic compounds as highly active catalysts for CH3OH formation from CO2 hydrogenation, Int. J. Energy Res., 2022, 46, 1285–1298 CrossRef CAS.
- Z. Shi, Q. Tan, C. Tian, Y. Pan, X. Sun, J. Zhang and D. Wu, CO2 hydrogenation to methanol over Cu-In intermetallic catalysts: Effect of reduction temperature, J. Catal., 2019, 379, 78–89 CrossRef CAS.
- Z. Shi, Q. Tan and D. Wu, A novel Core–Shell structured CuIn@SiO2 catalyst for CO2 hydrogenation to methanol, AIChE J., 2019, 65, 1047–1058 CrossRef CAS.
- J. Gao, F. Song, Y. Li, W. Cheng, H. Yuan and Q. Xu, Cu2In Nanoalloy Enhanced Performance of Cu/ZrO2 Catalysts for the CO2 Hydrogenation to Methanol, Ind. Eng. Chem. Res., 2020, 59, 12331–12337 CrossRef CAS.
- T. Jaster, A. Gawel, D. Siegmund, J. Holzmann, H. Lohmann, E. Klemm and U.-P. Apfel, Electrochemical CO2 reduction toward multicarbon alcohols – The microscopic world of catalysts & process conditions, iScience, 2022, 25, 104010 CrossRef CAS PubMed.
- M. G. Kibria, J. P. Edwards, C. M. Gabardo, C. Dinh, A. Seifitokaldani, D. Sinton and E. H. Sargent, Electrochemical CO2 Reduction into Chemical Feedstocks: From Mechanistic Electrocatalysis Models to System Design, Adv. Mater., 2019, 31, 1807166 CrossRef PubMed.
- B. Jia, Z. Chen, C. Li, Z. Li, X. Zhou, T. Wang, W. Yang, L. Sun and B. Zhang, Indium Cyanamide for Industrial-Grade CO2 Electroreduction to Formic Acid, J. Am. Chem. Soc., 2023, 145, 14101–14111 CrossRef CAS PubMed.
- C. M. Gabardo, C. P. O'Brien, J. P. Edwards, C. McCallum, Y. Xu, C. T. Dinh, J. Li, E. H. Sargent and D. Sinton, Continuous Carbon Dioxide Electroreduction to Concentrated Multi-carbon Products Using a Membrane Electrode Assembly, Joule, 2019, 3, 2777–2791 CrossRef CAS.
- L. C. Weng, A. T. Bell and A. Z. Weber, Towards membrane-electrode assembly systems for CO2 reduction: A modeling study, Energy Environ. Sci., 2019, 12, 1950–1968 RSC.
- H. Guzmán, N. Russo and S. Hernández, CO2 valorisation towards alcohols by Cu-based electrocatalysts: challenges and perspectives, Green Chem., 2021, 23, 1896–1920 RSC.
- L. Ge, H. Rabiee, M. Li, S. Subramanian, Y. Zheng, J. H. Lee, T. Burdyny and H. Wang, Electrochemical CO2 reduction in membrane-electrode assemblies, Chem, 2022, 8, 663–692 CAS.
- L.-P. Chi, Z.-Z. Niu, X.-L. Zhang, P.-P. Yang, J. Liao, F.-Y. Gao, Z.-Z. Wu, K.-B. Tang and M.-R. Gao, Stabilizing indium sulfide for CO2 electroreduction to formate at high rate by zinc incorporation, Nat. Commun., 2021, 12, 5835 CrossRef CAS PubMed.
- S. Li, X. Lu, S. Zhao, M. Ceccato, X.-M. Hu, A. Roldan, M. Liu and K. Daasbjerg, p-Block Indium Single-Atom Catalyst with Low-Coordinated In–N Motif for Enhanced Electrochemical CO2 Reduction, ACS Catal., 2022, 12, 7386–7395 CrossRef CAS.
- A. Zhang, Y. Liang, H. Li, B. Zhang, Z. Liu, Q. Chang, H. Zhang, C.-F. Zhu, Z. Geng, W. Zhu and J. Zeng, In-Situ Surface Reconstruction of InN Nanosheets for Efficient CO2 Electroreduction into Formate, Nano Lett., 2020, 20, 8229–8235 CrossRef CAS PubMed.
- W. J. Dong, C. J. Yoo and J.-L. Lee, Monolithic Nanoporous In–Sn Alloy for Electrochemical Reduction of Carbon Dioxide, ACS Appl. Mater. Interfaces, 2017, 9, 43575–43582 CrossRef CAS PubMed.
- X. Zuo, Z. Yang, J. Kong, Z. Han, J. Zhang, X. Meng, S. Hao, L. Wu, S. Wu, J. Liu, Z. Wang and F. Wang, Imbedding Pd Nanoparticles into Porous In2O3 Structure for Enhanced Low-Concentration Methane Sensing, Sensors, 2023, 23, 1163 CrossRef CAS PubMed.
- G. A. El-Nagar, F. Haun, S. Gupta, S. Stojkovikj and M. T. Mayer, Unintended cation crossover influences CO2 reduction selectivity in Cu-based zero-gap electrolysers, Nat. Commun., 2023, 14, 2062 CrossRef CAS PubMed.
- Z. Yang, F. E. Oropeza and K. H. L. Zhang, P-block metal-based (Sn, In, Bi, Pb) electrocatalysts for selective reduction of CO2 to formate, APL Mater., 2020, 8, 060901 CrossRef CAS.
- D. Cai, Y. Cai, K. B. Tan and G. Zhan, Recent Advances of Indium Oxide-Based Catalysts for CO2 Hydrogenation to Methanol: Experimental and Theoretical, Materials, 2023, 16, 2803 CrossRef CAS PubMed.
- L. Ai, S. Ng and W. Ong, A Prospective Life Cycle Assessment of Electrochemical CO2 Reduction to Selective Formic Acid and Ethylene, ChemSusChem, 2022, 15(19), e202200857 CrossRef CAS PubMed.
- M. Dou, M. Zhang, Y. Chen and Y. Yu, DFT study of In2O3-Catalyzed methanol synthesis from CO2 and CO hydrogenation on the defective site, New J. Chem., 2018, 42, 3293–3300 RSC.
- M. Dou, M. Zhang, Y. Chen and Y. Yu, Theoretical study of methanol synthesis from CO2 and CO hydrogenation on the surface of ZrO2 supported In2O3 catalyst, Surf. Sci., 2018, 672–673, 7–12 CrossRef CAS.
- S. Dang, B. Qin, Y. Yang, H. Wang, J. Cai, Y. Han, S. Li, P. Gao and Y. Sun, Rationally designed indium oxide catalysts for CO2 hydrogenation to methanol with high activity and selectivity, Sci. Adv., 2020, 6(25), eaaz2060 CrossRef CAS PubMed.
- Y.-F. Zhao, Y. Yang, C. Mims, C. H. F. Peden, J. Li and D. Mei, Insight into methanol synthesis from CO2 hydrogenation on Cu(111): Complex reaction network and the effects of H2O, J. Catal., 2011, 281, 199–211 CrossRef CAS.
- Y. Hori, H. Wakebe, T. Tsukamoto and O. Koga, Electrocatalytic process of CO selectivity in electrochemical reduction of CO2 at metal electrodes in aqueous media, Electrochim. Acta, 1994, 39, 1833–1839 CrossRef CAS.
- J. S. Yoo, R. Christensen, T. Vegge, J. K. Nørskov and F. Studt, Theoretical Insight into the Trends that Guide the Electrochemical Reduction of Carbon Dioxide to Formic Acid, ChemSusChem, 2016, 9, 358–363 CrossRef CAS PubMed.
Footnote |
| † Electronic supplementary information (ESI) available. See DOI: https://doi.org/10.1039/d3qi02499g |
| This journal is © the Partner Organisations 2024 |