 Open Access Article
Creative Commons Attribution 3.0 Unported Licence
Harnessing ligand design to develop primary and self-calibrated luminescent thermometers with field-induced single ion magnet behaviour in Dy3+ complexes†
Julio
Corredoira-Vázquez
 ab,
Cristina
González-Barreira
 a,
Ana M.
García-Deibe
 a,
Jesús
Sanmartín-Matalobos
 ac,
Miguel A.
Hernández-Rodríguez‡
 b,
Carlos D. S.
Brites
 b,
Luís D.
Carlos
 *b and
Matilde
Fondo
 *a
*a
aDepartamento de Química Inorgánica, Facultade de Química, Universidade de Santiago de Compostela, 15782 Santiago de Compostela, Spain. E-mail: matilde.fondo@usc.es
bPhantom-g, CICECO – Aveiro Institute of Materials, Department of Physics, University of Aveiro, 3810-193 – Aveiro, Portugal. E-mail: lcarlos@ua.pt
cInstitute of Materials (iMATUS), Universidade de Santiago de Compostela, 15782 Santiago de Compostela, Spain
First published on 27th December 2023
Abstract
Novel complexes {[Dy(LN6en)(OAc)2](NO3)}·2H2O (1·2H2O) and {[Dy(LN6prop)(OAc)2](NO3)}·CHCl3 (2·CHCl3), containing partially flexible symmetric N6 macrocycles, are reported. We explore the influence of the spacer length between two symmetrical N3 rigid moieties of the ligand on their structural, magnetic, and luminescence properties. Crystallographic analysis reveals the presence of Dy3+ ions in distorted tetradecahedral (1·2H2O) or bicapped square antiprism (2·CHCl3) environments. This underscores the increased flexibility of the LN6prop ligand, resulting in greater distortion of the N6 macrocycle plane. Both complexes exhibit single-molecule magnet behaviour under an optimal field of 2000 Oe, with 2·CHCl3 displaying the highest Ueff value of 127 K, despite its less planar N6 macrocycle. Luminescence measurements indicate that the ratio between the integrated intensity of the ligands and that of the the Dy3+ 4F9/2 → 6H13/2 transition can define secondary luminescent thermometers. Maximum relative thermal sensitivity values of 2.3 (1·2H2O) and 5.1% K−1 (2·CHCl3) are achieved. Furthermore, deconvolution of the 4F9/2 → 6H15/2 transition in 2·CHCl3 supports the previous determination of the energy barrier for magnetic relaxation. This permits the demonstration of the first example of a Dy3+ primary luminescent thermometer based on two thermally coupled Kramer's doublets of the 4F9/2 level. Remarkably, 2·CHCl3 is also the first self-calibrated luminescent thermometer with magnetic relaxation operating within the 86–211 K range, showcasing its potential in precise temperature sensing applications.
Introduction
Lanthanoid metal ions intrinsically have unique properties that make them particularly attractive for their use in luminescent materials and single-molecule magnets (SMMs).1 Thus, they show marked single-ion anisotropy due to the combined contributions from strong spin–orbit coupling and the crystal field effect, which is much weaker but critical from the point of view of SMM attributes.2 In fact, according to Long's theory3 the axial arrangement of negatively charged donors around oblate lanthanoid ions, such as Dy3+, is the most efficient way to generate high-performance SMMs, with record blocking temperatures of up to 80 K.4 These molecular magnetic nanomaterials show great potential in magnetic storage, as they would allow data banking and processing at unprecedented speeds.5Lanthanoid ions also exhibit unique luminescent properties due to their f–f electronic transitions, namely in the trivalent state (Ln3+).6 This has led to the development of luminescent molecular materials with applications in disparate fields, including bioimaging,7 chemical sensing,8 and optical thermometry.9 From a theoretical perspective, combining luminescence and molecular magnet properties provides a powerful tool for understanding magnetic behaviour. High-resolution emission spectra of Ln3+ complexes reveal the energy of different electronic states, which directly correlates with the energy barrier for magnetization reversal.10
In addition to its theoretical significance, the combination of these two properties holds substantial practical promise. It offers a viable solution to a significant challenge faced in the integration of molecular magnets into next-generation data storage devices – temperature control.11 Accordingly, SMMs could function as luminescent thermometers, enabling self-monitoring of temperature in these nanomaterials.12,13 Currently, there are several examples of mono-, di-, or homopolynuclear Nd3+,14 Dy3+,12,15–20 Tb3+,21 Ho3+,22 or Yb3+ complexes,23–25 as well as heteronuclear Yb3+Co3+,26,27 Dy3+Co3+,28,29 or Dy3+Eu3+ compounds,30 in addition to some diluted Ln3+Y3+ complexes31,32 that exhibit both slow relaxation of magnetization and luminescence thermometry (Table 1).
| Ln3+-SMM thermometer | U eff (K)/Hdc (kOe) | Thermometric parameter | λ (nm) | ΔT (K) | S m (% K−1) | T m (K) | Ref. |
|---|---|---|---|---|---|---|---|
| TTA = 4,4,4-trifluoro-1-(2-thienyl)-1,3-butanedione; H2bbpen = H2bbpen=N,N′-bis(2-hydroxybenzyl)-N,N′-bis(2-methylpyridyl)ethyl-enedi-amine; H3L1,1,4 = N4O3 aminophenol; acac− = acetylacetonate; PyAm = 2-amidinopyridine; PmAm = 2-amidinopyrimidine; bpm = 2,2′-bipyrimidine; tfac− = 1,1,1-trifluoroacetylacetonate; tba− = thiobenzoate; phen = phenantroline; bpyO2 = 2,2′-dipyridyl N,N′-dioxide; 4-benpyo = 4-benzyloxy-pyridine N-oxide; HL = 8-hydroxyquinoline; hfac− = hexafluoroacetylacetonate; H2valdien = N1,N3-bis(3-methoxysalicylidene)diethylenetriamine; TPPO = triphenylphosphine oxide; hmpa = hexamethylphosphoramide.a Two components of the 4F3/2 → 4I9/2 transition.b Two components of the 4F9/2 → 6H13/2 transition.c Ligand (T1 → S0) and Dy3+ (4F9/2 → 6H13/2) emission bands.d Two spectral ranges of the 4F9/2 → 6H15/2 transition.e Two components of the 4F9/2 → 6H15/2 transition.f Ligand and Dy3+-related emission bands.g 5D0 → 7F4 transition upon 590 (7F1 → 5D0) and 612 nm (7F2 → 5D0) excitations.h Two spectral ranges of the 5D4 → 7F6 transition.i 5I8 → 5F1 (446 nm) and 5I8 → 5G6 (456 nm).j 5I8 → 5F1 (446 nm) and 5I8 → 5G6 (459 nm).k Two spectral ranges ascribed to the 2F5/2 → 2H7/2 transition.l Sr obtained from the fitting procedure of the lifetime values according to a Mott–Seitz model.m Ligand band. | |||||||
| [Nd(TTA)3(MeOH)2] | 19.7/1.0 | Intensity ratio | 392 | 75–300 | 0.2a | 75 | 14 |
| 360 | 10–300 | 0.02a | 125 | ||||
| [Dy(bbpen)Cl] | 942.4/0 | 312 | 12–300 | 0.3b | 255 | 18 | |
| [Dy4(H3L1,1,4)2(OAc)6]·CH3OH | 39.7/0 | 358 | 11–295 | 1.6c | 295 | 17 | |
| [Dy(acac)3(H2O)2]·H2O | 137/0 | 364 | 5–290 | 5.4b | 33 | 16 | |
| [Dy(acac)3(PyAm)] | Not Orbach/1.4 | 328 | 12–323 | 2.0b | 12 | 15 | |
| [Dy(acac)3(PmAm)] | Not Orbach/0 | 328 | 12–340 | 0.8b | 82 | ||
| [Dy(acac)3(bpm)] | 309/0 | 330 | 30–140 | 1.5b | 70 | 19 | |
| [Dy2(bpm)(tfac)6] | Not Orbach/0 | 405 | 5.4–85.5 | 1.8d | 5.4 | 12 | |
| 330 | 90–300 | 0.5d | 90 | ||||
| 330 | 298–398 | 3.3c | 298 | ||||
| [Dy(tba)3phen] | 136.8/0 | 329 | 10–50 | 1.1b | 50 | 20 | |
| [DyCo(CN)6(bpyO2)2(H2O)3]·4H2O | 86.5/1.0 | 375 | 11–200 | 1.8b | 70 | 28 | |
| 0.2e | 90 | ||||||
| {[Dy4Co4(CN)24(4-benpyo)17(H2O)] 7H2O}n | Not Orbach/2.0 | 464 | 16–350 | 2.3f | 240 | 29 | |
| {(NEt4)2[(Ph4Si4O8)2Dy0.87Eu3.12(NO3)6(EtOH)(MeCN)2]}·4MeCN | 16.3/1.0 | 590/612 | 293–373 | 1.2g | 293 | 30 | |
| {[Tb(H2O)2][Co(CN)6]·2.7H2O}@Y | Not Orbach/2.0 | 320 | 8–78 | 2.6h | 18.3 | 31 | |
| {Tb[Co(CN)6]} | 854/3.0 | 310 | 6–42 | 5.3h | 15.9 | ||
| {Tb[Co(CN)6]}@Y | 859/3.0 | 6–96 | 5.4h | 14.7 | |||
| {[Ho(4-pyridone)4(H2O)2][Co(CN)6]}@Y | Not Orbach/0.15 | 370 | 25–140 | 6.9i | 28 | 22 | |
| 60–195 | 5.8j | 58 | |||||
| {[Ho(4-pyridone)4(H2O)2][Rh(CN)6]}@Y | Not Orbach/0.1 | 25–130 | 2.7i | 42 | |||
| 55–205 | 4.5j | 69 | |||||
| {[Ho(4-pyridone)4(H2O)2][Ir(CN)6]}@Y | Not Orbach/0.1 | 35–144 | 4.6i | 37 | |||
| 70–197 | 5.3j | 61 | |||||
| [Yb2(valdien)2(NO3)2] | 65.6 /1.0 | 390 | 80–320 | 1.1k | 130 | 23 | |
| [Yb(H3L1,1,4)]·2MeOH | Not Orbach/1.6 | 360 | 25–300 | 0.2k | 300 | 24 | |
| [Yb(TPPO)3(NCS)3] | nr/1.5 | 320 | 10–300 | 1.5k | 150 | 25 | |
| [Yb(TPPO)3(NCSe)3] | nr/1.5 | 360 | 10–300 | 1.7k | 150 | ||
| {(H5O2)2(H)[Yb(hmpa)4][Co(CN)6]2} | Not Orbach/1.0 | 320 | 50–175 | 4.6k | 50 | 26 | |
| [YbCo(CN)6(bpyO2)2(H2O)3] | Not Orbach /1.25 | 315 | 125–275 | 0.1k | 180 | 27 | |
| [Tb2(bpm)(acac)6] | 34.3/1.0 | Lifetime | 350 | 83–283 | 4.9l | 250 | 21 |
| [Tb2(bpm)(tfac)6] | nr | 330 | 83–413 | 5.9l | 300 | ||
| [Tb2(bpm)(hfac)6(H2O)2] | nr | 350 | 83–323 | 2.4l | 320 | ||
| [NaDy0.02Y0.98(μ2-L)4]n | 68.0/0 | Single intensity band | 350 | 80–300 | 0.8m | 300 | 32 |
Exploring the intricate interplay of factors that jointly affect both properties is a research topic still in its infancy. Therefore, in this work, leveraging our experience in luminescence thermometry of Ln3+ complexes with slow relaxation of magnetization,16,17,24,27,28 we investigate the impact of the aliphatic chain as a spacer between the N3 units of a symmetric hexadentate N6 ligand on the magnetic and thermometric properties of its Dy3+ derivatives. Moreover, we investigate the temperature determination using both secondary (requiring previous calibration) and primary (not requiring previous calibration) luminescence thermometry, comparing the performance of both approaches and discussing their ability to accomplish self-calibration of the luminescent thermometers.
Results and discussion
Synthetic procedures
The macrocyclic complexes {[Dy(LN6en)(OAc)2](NO3)}·2H2O (1·2H2O) and {[Dy(LN6prop)(OAc)2](NO3)}·CHCl3 (2·CHCl3) were obtained in a classical template synthesis, from the reaction of Dy(OAc)3·4H2O, Dy(NO3)3·6H2O, ethylene- or propylendiamine and 2,6-pyridinedicarboxaldehyde in adequate molar ratios, as shown in Scheme 1. This procedure is similar to that previously described for the isolation of {[Dy(LN6en)(NO3)2](NO3)}.33 In both cases, the complexes were obtained by refluxing the mixtures in methanol. The concentration of the reaction solutions leads to the isolation of oils, the recrystallisation of which in CHCl3 layered with diethyl ether yields 1·2H2O and 2·CHCl3 as single crystals.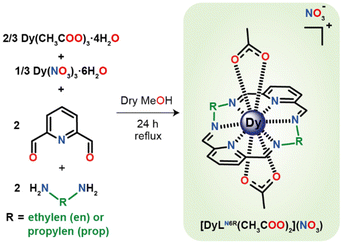 | ||
| Scheme 1 Synthetic route for the isolation of {[Dy(LN6en)(OAc)2](NO3)} and {[Dy(LN6prop)(OAc)2](NO3)}. Solvate molecules are omitted for clarity. | ||
These were characterized not only by X-ray diffraction studies but also by elemental analysis and IR spectroscopy (Fig. S1†). Thus, the IR spectra of both compounds show characteristic bands of the iminic and pyridinic C![[double bond, length as m-dash]](https://www.rsc.org/images/entities/char_e001.gif) N bonds at ca. 1660 and 1590 cm−1, respectively.34 In addition, both complexes show typical bands that can be attributed to the acetate ligands at ca. 1540 and 1450 cm−1,35 as well as a strong band at ca. 1330 cm−1, in agreement with the presence of the nitrate counterion.35,36
N bonds at ca. 1660 and 1590 cm−1, respectively.34 In addition, both complexes show typical bands that can be attributed to the acetate ligands at ca. 1540 and 1450 cm−1,35 as well as a strong band at ca. 1330 cm−1, in agreement with the presence of the nitrate counterion.35,36
X-ray diffraction studies
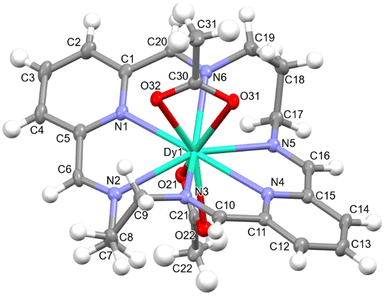
Fig. S2† and Fig. 1 show ellipsoid diagrams for complexes 1·2H2O and 2·CHCl3, respectively, and their main distances and angles around the Dy3+ ions are summarised in Table S1.† Both complexes are quite similar to the previously reported {[Dy(LN6cet)(OAc)2](OAc)}·9H2O, where LN6acet is the Schiff base resulting from the condensation of acetophenone and ethylendiamine,37 and to {[Dy(LN6en)(NO3)2](BPh4)}.331·2H2O and 2·CHCl3 also show many similarities between them, and for this reason, they will be described together. Their unit cell contains [Dy(LN6x)(OAc)2]+ (x = en or prop) cations, NO3− anions, and different solvates (two water molecules per complex in 1·2H2O and one CHCl3 molecule per complex in 2·CHCl3). In the [Dy(LN6x)(OAc)2]+ cations, the semi-rigid Schiff base ligands LN6en or LN6prop act as neutral hexadentates, occupying the equatorial plane in the vicinity of Dy3+. The pyridine N-atoms are the ones that deviate the least from the mean calculated N6 plane, and the deviation is even smaller for 1·2H2O than for 2·CHCl3, with the Dy3+ ion standing out very little from this theoretical plane (Table S2†). Nevertheless, the imine nitrogen atoms protrude significantly from this plane. Accordingly, these N-atoms are ca. 0.5 Å above or below the plane (2 above and 2 below) for 1·2H2O, and ca. 0.73 Å for 2·CHCl3, indicating that the longer aliphatic chain favours a greater distortion of this equatorial plane formed by the N6 donor, as could be expected.
The coordination sphere of the Dy3+ ion is fulfilled by two acetate anions, acting as bidentate chelate donors, which leads to coordination number 10 around Dy3+, with a N6O4 environment. The calculations of the grade of distortion of the DyN6O4 core relative to an ideal polyhedron of ten vertexes with the SHAPE program38 reveal a largely distorted geometry, between a tetradecahedron (as in the related {[Dy(LN6en)(NO3)2](BPh4)}33) and a staggered dodecahedron for 1·2H2O, and between a bicapped square antiprism and a sphenocorona for 2·CHCl3 (Table S3†). Accordingly, the length of the spacer between the imine moieties has a profound impact on the geometry of the complex, which will obviously have significant repercussions for the magnetic and luminescence properties. The main angles and distances of the Dy3+ ion (Table S1†) are comparable with those previously reported for this kind of compound,33,37 and do not deserve further consideration.
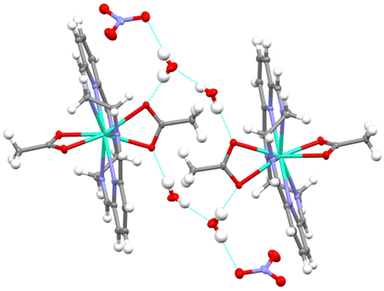
Finally, the mononuclear units [Dy(LN6en)(OAc)2]+ in 1·2H2O establish hydrogen bonds with the water solvates, in such a way that pseudodimers are formed (Fig. 2), with an intermolecular Dy⋯Dy distance of 8.9404(6) Å. In the case of 2·CH3Cl, the chloroform solvate seems to be held in the cell by weaker interactions, and no hydrogen bonds are observed, but a quite strong interaction between Cl12 and O2, with a distance of 2.82 Å, is observed (Fig. S3†). These interactions lead to longer intermolecular Dy⋯Dy distances of 9.8809(6) Å.
In addition, powder X-ray diffraction measures for raw samples of 1·2H2O and 2·CHCl3 were performed (Fig. S4†). These studies show that the isolated products and the solved single crystals are the same complexes and that they have been obtained with high purity, given that no other peaks can be observed in the experimental diffractograms.
Magnetic properties
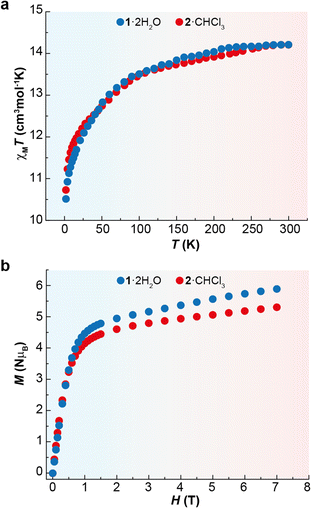
Direct-current (dc) magnetic susceptibility measurements were recorded for 1·2H2O and 2·CHCl3 as a function of the temperature. The graphs of χMT vs. T are shown in Fig. 3. The χMT values for the complexes at 300 K are 14.2 cm3 mol−1 K in both cases, which are very close to the expected value for one uncoupled Dy3+ ion at room temperature (14.17 cm3 mol−1 K).39 The experimental curves continuously decrease until 2 K, reaching χMT values close to 10.5 cm3 mol−1 K. This drop in the curves can be mainly ascribed to thermal depopulation of the excited Kramer's doublets (KDs), which arises from the split of the ground term by crystal field effects.The magnetic field dependence of the reduced magnetisation at 2 K at the maximum applied field of 7 T is 5.8NμB for 1·2H2O and 5.3NμB for 2·CHCl3 (Fig. 3). These values are lower than the theoretical saturation characteristic of an isolated Dy3+ ion (10NμB), but quite close to the value of 5NμB for a highly anisotropic Dy3+ ion with an Ising-like ground doublet.2
The dynamic magnetic properties of the two mononuclear complexes were also studied, but none of the compounds show out-of-phase peaks of the susceptibility (χ′′M) as a function of the temperature or the frequency above 2 K, as occurs in {[Dy(LN6cet)(OAc)2](OAc)}·9H2O,37 and {[Dy(LN6en)(NO3)2](BPh4)}.33 This can be a consequence of the quantum tunnelling of the magnetization (QTM).
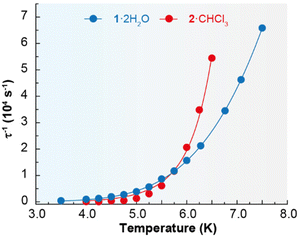
Accordingly, the alternating-current (ac) data were newly recorded in the presence of an optimum field of 2000 Oe (Fig. S5†), and now χ′′M for 1·2H2O and 2·CHCl3 shows frequency and temperature dependence, with clear peaks (Fig. 4 and Fig. S6†), in agreement with single ion magnet (SIM) behaviour. Besides, the Cole–Cole plots (Fig. S7†) display curves with a wider distribution of the relaxation times for 1·2H2O (α parameter in the range 0.45–0.53) than for 2·CHCl3 (α values in the range 0.33–0.29). The relaxation dynamics were examined by the temperature dependence of the relaxation time (Fig. 5). The data deviate from linearity, indicating that the curve cannot be adequately reproduced by a simple Orbach model, as anticipated given the α parameter values. Hence, we have tried to fit these plots considering all the possible relaxation processes (Orbach, Raman, direct, and QTM), according to eqn (1), individually or grouped.
| τ−1 = τ0−1e−Ueff/kBT + CTn + AT + τQTM−1 | (1) |
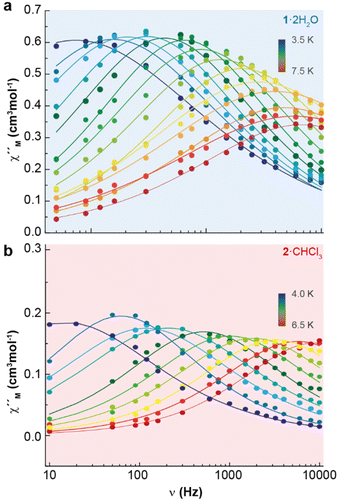 | ||
| Fig. 4 Frequency dependence of χ′′M for 1·2H2O (a) and 2·CHCl3 (b) in a dc-applied field of 2000 Oe at different temperatures. | ||
The best fits of the data are obtained in both cases considering Orbach and Raman relaxation processes, and these render the parameters Ueff = 46.3(1) K (32.2 ± 0.7 cm−1), τ0 = 4.0(2) × 10−8 s, C = 0.4(1) s−1 K−n, and n = 5.2(5) for 1·2H2O, and Ueff = 127.0(4) K (88.3 ± 0.2 cm−1), τ0 = 1.3(1) × 10−13 s, C = 2.2(6) × 10−3 s−1 K−n, and n = 8.7(1) for 2·CHCl3.
The energy barrier between the ground and first excited state for 2·CHCl3 was also calculated by luminescence spectroscopy (100.2 cm−1, vide infra), and, accordingly, these studies support the thermally activated Orbach relaxation pathway. However, it is not possible to perform these spectroscopic calculations for 1·2H2O, as detailed below, but its barrier is similar to the one obtained for {[Dy(LN6en)(NO3)2](BPh4)} (37.8 K).33 In spite of this, the relaxation dynamics of 1·2H2O were also analysed excluding the Orbach mechanism, and the data can be simply fitted with a Raman process (Fig. S8†), rendering the values C = 0.13(2) s−1 K−n and n = 6.5(1), comparable with those observed for {[Dy(LN6en)(NO3)2](BPh4)}. Nevertheless, multiple attempts to fit the τ−1vs. T curve for 2·CHCl3 without considering the Orbach process were unsuccessful, which also supports the proposed Orbach plus Raman relaxation pathways. Comparing the energy barriers of 1·2H2O, 2·CHCl3 and the related {[Dy(LN6en)(NO3)2](BPh4)} complex reveals that the exchange between bidentate chelate nitrate and acetate ligands has minimal impact on Ueff, while the chain length between the N3 entities of N6 macrocyclic ligands significantly affects magnetic relaxation. This observation suggests that a greater barrier should be expected for 1·2H2O and {[Dy(LN6en)(NO3)2](BPh4)}, due to their less distorted N6 planes, and geometries closer to a pseudo-hexagonal bipyramid. However, Ueff is unexpectedly higher for 2·CHCl3. Accordingly, it seems that the less semirigid ligand induces the highest energy barrier for the spin reversal. Additionally, as anticipated,40 the nature of the counteranion appears to have no influence on Ueff.
Photoluminescence
Excitation spectra for both compounds were recorded while monitoring the 4F9/2 → 6H13/2 transition at 570 nm, revealing both sharp and broadband features (Fig. S9†). These features were assigned to transitions from the Dy3+ ions and organic ligands, respectively. The presence of the latter contribution indicates ligand-sensitized emission.
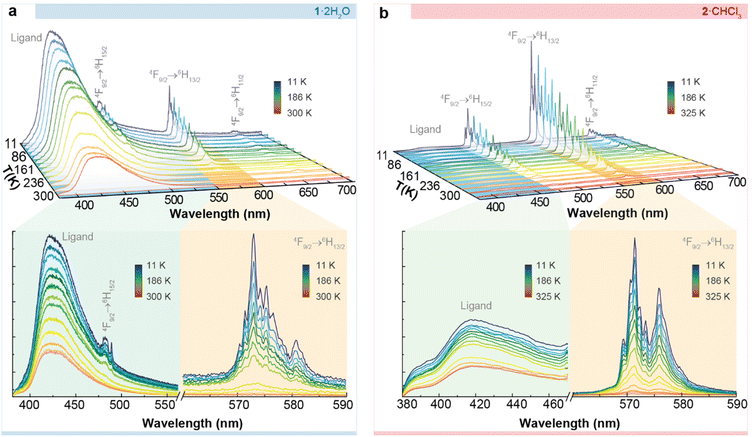
Fig. 6 depicts the temperature dependence of the emission spectra of 1·2H2O and 2·CHCl3, recorded using excitation wavelengths of 324 nm and 326 nm, respectively, in agreement with the maxima observed in the excitation spectrum. We observe the characteristic Dy3+ 4F9/2 → 6H11/2, 13/2, 15/2intra-4f transitions within the visible spectral region. At all examined temperatures, the emission spectra exhibited a broad band in the UV-visible spectral region, attributed to the ligands. This band is notably more intense in 1·2H2O than in 2·CHCl3. This behaviour has been previously observed for Er3+ derivatives with the same macrocyclic ligands.41 Moreover, the energy of the triplet state for both ligands was estimated, and they do not differ significantly in energy (∼25![[thin space (1/6-em)]](https://www.rsc.org/images/entities/char_2009.gif) 063 cm−1).41
063 cm−1).41
However, despite having the same energy for the donor state, minor structural differences may result in shifting donor–acceptor distances, i.e. the centroid of the ligand excited state (T1 or S1) to the Ln3+ ion. A shorter distance, in turn, may lead to a faster energy transfer rate.42 For instance, it is known that the excited states of the ligand are localized near an electronic delocalization structure, as discussed elsewhere.42–46 This may imply variations in the energy transfer rates from the excited states (in this case, the T1) of the macrocyclic ligand LN6en or LN6prop to Dy3+. Qualitatively, it is clear that the ligand-to-metal energy transfer is more effective in 2·CHCl3, which can be justified based on structural differences, even when this difference is slight. In 2·CHCl3, the donor–acceptor distance of the triplet state is shorter (Fig. S10†), leading to higher energy transfer rates and a more efficient “antenna” effect.
For 2·CHCl3, we deconvoluted the 4F9/2 → 6H15/2 transition to extract more detailed information (Fig. S11†). As Dy3+ is a Kramer's ion, the maximum crystal field splitting of a level into KDs should be J + 1/2. The presence of at least 9 components, exceeding the anticipated 8 KDs for the 6H15/2 level (attributed to the low symmetry Dy3+ local group), points out that the first excited KD of the 4F9/2 level is populated (even at 11 K), resulting in the formation of what is commonly referred to a hot band. The deconvolution permits calculation of the relative energy of each KD, as depicted in Fig. S12.† The results reveal an energy gap between the first two KDs of the 6H15/2 ground level of 100.2 ± 0.3 cm−1 (referred to as ΔE1). The energy gap between the first two KDs of the 4F9/2 emitting level (referred to as ΔE2) is 98 ± 0.3 cm−1.
As mentioned above, the value found, 100.2 ± 0.3 cm−1, is similar to but slightly higher than the energy barrier observed in the ac magnetic studies (88.3 ± 0.2 cm−1). Comparable differences between magnetic and luminescent calculated barriers were found for previously reported complexes,47 thus supporting the interpretation of the magnetic results. On the contrary, for 1·2H2O, the overlap between the emissions of the ligands and Dy3+ ions precluded the deconvolution (Fig. 6a), and, therefore, the calculation of the energy gaps between mj states.
Luminescence thermometry
The ratio between the integrated intensity of the ligand (IL) and that of the dominant Dy3+ 4F9/2 → 6H13/2 transition (IF) is defined as the thermometric parameter (Δ) and is used to assess the thermometric properties of 1·2H2O and 2·CHCl3 (Fig. S13 and section 4 of the ESI† for details). The difference in the temperature dependence of IL and IF in both complexes underscores the influence of the spacer length between the two symmetrical N3 rigid moieties of the ligand on the luminescence of these compounds.Fig. 7 shows the temperature dependence of Δ for both compounds, which exhibits a linear decrease. For 2·CHCl3, the operating range as a luminescent thermometer encompasses 11–286 K, while for 1·2H2O it is narrower (11–211 K). For temperatures higher than 286 and 211 K, respectively, the variations in Δ are of the same order of their uncertainties and, thus, 1·2H2O and 2 CHCl3 are out of the thermometric operating range.48
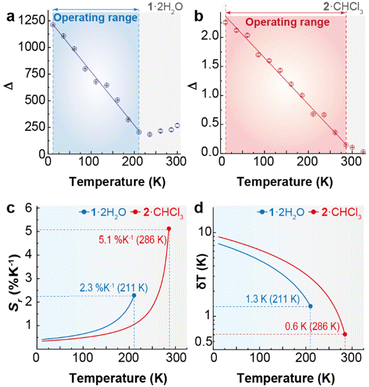 | ||
| Fig. 7 Temperature dependence of the thermometric parameter (Δ) for (a) 1·2H2O and (b) 2·CHCl3. The lines represent the best linear fits (r2 > 0.99) to the experimental data (fit details in Table S5†). Temperature dependence of (c) Sr and (d) δT for 1·2H2O and 2·CHCl3. | ||
The thermometric performance of the two compounds was assessed through the typical figures of merit for luminescent thermometers: Sr and δT49,50 (Fig. 8 and ESI† for details). Whereas 1·2H2O achieves a maximum Sr value of 2.3% K−1, 2·CHCl3 has 5.1% K−1. The corresponding minimum temperature uncertainty values are 0.1 K and 0.2 K, respectively, at the indicated temperatures.
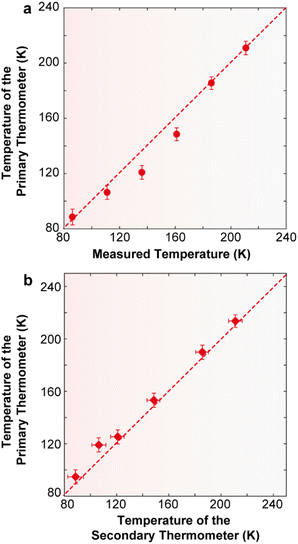 | ||
| Fig. 8 (a) Comparison between the temperature values measured using a reference silicon thermometer (y) and calculated using eqn (2) (x) for 2·CHCl3. The solid line is a guide for the eyes corresponding to y = x. The horizontal error bars are the temperature uncertainty on the calculated temperature, calculated using eqn (S10).† The uncertainties in the measured temperature (not represented) are 0.5 K (12–30 K), 0.25 K (30–60 K), and 0.15 K (60–300 K). (b) Dependence of the calibrated temperature (y) with the calculated value (x). The solid line is a guide for the eyes corresponding to y = x. The horizontal and vertical error bars are the temperature uncertainty on the calculated temperature, calculated using eqn (S10) and (S6),† respectively. | ||
In addition to the previously discussed intensity ratio between the ligand and the 4F9/2 → 6H13/2 transition, the concept of a primary luminescent thermometer can also be applied in 2·CHCl3. Primary luminescent thermometers eliminate the need for prior calibration procedures, a major advantage in luminescence thermometry.51 Indeed, 2·CHCl3 is the first example of a Dy3+ primary luminescent thermometer based on the intensity ratio between transitions from the lowest energy state or second lowest energy state of the excited 4F9/2 level to the 6H15/2 ground state multiplet.51 The other reported example of a Dy3+ primary luminescent thermometer with slow magnetic relaxation operating in the presence of a magnetic field up to 3.6 T is based on the classical Mott–Seitz model.16
Beyond Dy3+, primary luminescent thermometers have also been explored in Yb3+/Er3+-doped upconverting materials,51–53 and Yb3+/Pr3+ co-doped fluoride phosphate glasses.54 This technique uses the ratio between the intensities arising from two thermally coupled levels of the Ln3+ ions that are directly related to the absolute temperature, T, through a well-established equation:
 | (2) |
Taking advantage of the distinct temperature dependence of the deconvolution of the 4F9/2 → 6H15/2 transition, the energy gap between the fundamental and first level (hot band) of the 4F9/2 state was estimated to be ΔE = 98 ± 0.3 cm−1 (Fig S12†). The excitation source does not induce local discernible temperature increments, ensuring that the Δ′0 value could be determined for any given temperature value.
To illustrate that 2·CHCl3 is a luminescent primary thermometer, we begin by plotting ln(Δ′) versus 1/T to identify the temperature range for which eqn (2) is valid (i.e., a linear relation between ln(Δ) and 1/T, Fig. S14†). We conclude that a linear relation is observed for 86 ≤ T ≤ 211 K. Thus, we set T0 = 211 K and Δ′0 = 0.1477, where T0 corresponds to the value that minimizes the absolute deviation between the calculated and measured temperatures. Next, we apply eqn (2) and find that the temperature value predicted by the primary thermometer fits well with the temperature determined experimentally by the calibration procedure up to 211 K. The deviation between predicted and measured values can be quantified using the mean absolute deviation, which is 5% for the primary thermometer (Fig. S15†). The Sr and δT for the primary 2·CHCl3 luminescence thermometer (Fig. S16†) are comparable with those of the secondary thermometer, the best values being 1.8%·K−1 and 2 K, respectively, at 86 K.
Additionally, and as an added benefit, in 2·CHCl3 the primary molecular thermometer can be used to calibrate the secondary one, offering an extra advantage of this compound. Fig. 8b illustrates the calibration of the ratio between the integrated intensity of the ligand and that of the Dy3+ 4F9/2 → 6H13/2 transition (secondary thermometer) using the temperature calculated using eqn (2) (primary thermometer). Notably, the uncertainty associated with the calculated temperature values is comparable with that of the calibrated temperature. A previous study on a poly(methylmethacrylate) film containing Er3+- and Tm3+-doped upconverting nanoparticles has demonstrated the use of a luminescent primary thermometer based on the Er3+ 2H11/2 → 4I15/2 and 4S3/2 → 4I15/2 transitions to calibrate a secondary thermometer based on the 1G4 → 3H6 (Tm3+) and the 4S3/2 → 4I15/2 (Er3+) transitions.55
Conclusions
The structural features and the magnetic and luminescence properties of mononuclear Dy3+ complexes derived from symmetrical N6 semirigid macrocycles are strongly influenced by the spacer between the two N3 rigid moieties. This is evident in the different coordination geometries observed for {[Dy(LN6en)(OAc)2](NO3)}·2H2O (1·2H2O) (tetradecahedron) and {[Dy(LN6prop)(OAc)2](NO3)}·CHCl3 (2·CHCl3) (bicapped square antiprism). These different environments also impact the magnetic properties of the complexes, which behave as SIMs in the presence of a dc field, with 2·CHCl3 exhibiting the highest energy barrier.The luminescence measurements show that the ratio between the integrated intensity of the ligands and that of the Dy3+ 4F9/2 → 6H13/2 transition can be used to develop secondary luminescent thermometers with maximum relative thermal sensitivity values of 2.3 (1·2H2O) and 5.1% K−1 (2·CHCl3). The minimum temperature uncertainties are, respectively, 1.3 (at 211 K) and 0.6 K (at 286 K). These values are comparable with those already reported for analogous thermographic SIMs (Table 1), and also show the better thermometric characteristics of 2·CHCl3 with respect to 1·2H2O.
The deconvolution of the 4F9/2 → 6H15/2 transition in 2·CHCl3 provides further support for the determination of the energy barrier for magnetic relaxation. Moreover, this deconvolution enables the demonstration of the first example of a Dy3+ primary luminescent thermometer based on two thermally coupled KDs of the 4F9/2 level. Additionally, 2·CHCl3 is the first self-calibrated luminescent thermometer with magnetic relaxation, operating within the 86–211 K range. The calibration of the luminescent secondary thermometer closely aligns with the calculated temperature of the primary thermometer, with observed uncertainties in calculated temperature values comparable with the calibrated temperatures. As the intensity ratio between the fundamental and first excited KDs of the 4F9/2 level and the ground KD of the 6H15/2 multiplet is calibrated through eqn (2), it eliminates the need for recurrent calibration procedures whenever the system operates in new conditions. Therefore, 2·CHCl3 is unique among its class, and it not only contributes to increasing the very small number of SMMs with primary luminescence thermometry, but also represents a significant advancement in the various mechanisms of luminescent thermometers using Dy3+ as the emitter.
Experimental
Materials and general methods
All chemical reagents were purchased from commercial sources and used as received without further purification. Elemental analyses of C, H, and N were performed on a Themoscientific Flash Smart analyser. FT-IR spectra were recorded on a Varian FT–IR 670 spectrometer equipped with an attenuated total reflectance (ATR) accessory, in the 500–4000 cm−1 range.Syntheses
The Dy3+ complexes were obtained by variation of a method previously reported.40 The synthesis of {[Dy(LN6en)(OAc)2](NO3)}·2H2O (1·2H2O) exemplifies the procedure.![[small nu, Greek, tilde]](https://www.rsc.org/images/entities/i_char_e0e1.gif) /cm−1): 1534 (COO), 1594 (C
/cm−1): 1534 (COO), 1594 (C![[double bond, length as m-dash]](https://www.rsc.org/images/entities/char_e001.gif) Npy), 1659 (C
Npy), 1659 (C![[double bond, length as m-dash]](https://www.rsc.org/images/entities/char_e001.gif) Nimine), 3415 (OH).
Nimine), 3415 (OH).
![[small nu, Greek, tilde]](https://www.rsc.org/images/entities/i_char_e0e1.gif) /cm−1): 1539 (COO), 1592 (C
/cm−1): 1539 (COO), 1592 (C![[double bond, length as m-dash]](https://www.rsc.org/images/entities/char_e001.gif) Npy), 1655 (C
Npy), 1655 (C![[double bond, length as m-dash]](https://www.rsc.org/images/entities/char_e001.gif) Nimine), 3440 (OH).
Nimine), 3440 (OH).
Single X-ray crystallographic refinement and structure solution
The crystal data and details of refinement are given in Table S4.† Data were collected at 100 K on a Bruker D8 VENTURE PHOTON III-14 diffractometer, employing graphite monochromatised Mo-Kα (λ = 0.71073 Å) radiation. Multi-scan absorption corrections were applied using the SADABS routine.56 The structure was solved by standard direct methods employing SHELXT,57 and then refined by full-matrix least-squares techniques on F2 using SHELXL,58 from the program package SHELX-2018.57,58 All atoms different from hydrogen were anisotropically refined, while H atoms were typically included in the structure factor calculations in geometrically idealised positions. However, to reveal the hydrogen bonding scheme, hydrogen atoms belonging to water solvate in 1·2H2O were located in the corresponding Fourier map. In this case, they were freely refined.Powder X-ray diffraction studies
The powder diffractograms for 1·2H2O and 2·CHCl3 were recorded in a Philips diffractometer with a control unity type “PW1710”, a vertical goniometer type “PW1820/00” and a generator type “Enraf Nonius FR590”, operating at 40 kV and 30 mA, using monochromated Cu-Kα (λ = 1.5418 Å) radiation. A scan was performed in the range 2 < 2θ < 30° with t = 3 s and Δ2θ = 0.02°. LeBail refinement was obtained with the aid of HighScore Plus Version 3.0d.Magnetic measurements
Magnetic susceptibility dc and ac measurements for microcrystalline samples of 1·2H2O and 2·CHCl3 were carried out with a PPMS Quantum Design susceptometer. The dc magnetic susceptibility data were recorded under a magnetic field of 1000 Oe in the temperature range 2–300 K. Magnetisation measurements at 2.0 K were recorded under magnetic fields ranging from 0 to 70![[thin space (1/6-em)]](https://www.rsc.org/images/entities/char_2009.gif) 000 Oe. Diamagnetic corrections were estimated from Pascal's Tables. Alternating current (ac) susceptibility measurements at zero dc field were performed with an oscillating ac field of 3.5 Oe, and ac frequencies of 8000 and 10
000 Oe. Diamagnetic corrections were estimated from Pascal's Tables. Alternating current (ac) susceptibility measurements at zero dc field were performed with an oscillating ac field of 3.5 Oe, and ac frequencies of 8000 and 10![[thin space (1/6-em)]](https://www.rsc.org/images/entities/char_2009.gif) 000 Hz in the 2–20 K temperature range. ac measurements at 3 K were also recorded under magnetic fields from 250 to 3000 Oe, with an oscillating ac field of 3.5 Oe, and frequencies ranging from 50 to 1500 Hz. New ac data were acquired for 1·2H2O and 2·CHCl3 under a dc field of 2000 Oe, and with frequencies ranging from 50 to 10
000 Hz in the 2–20 K temperature range. ac measurements at 3 K were also recorded under magnetic fields from 250 to 3000 Oe, with an oscillating ac field of 3.5 Oe, and frequencies ranging from 50 to 1500 Hz. New ac data were acquired for 1·2H2O and 2·CHCl3 under a dc field of 2000 Oe, and with frequencies ranging from 50 to 10![[thin space (1/6-em)]](https://www.rsc.org/images/entities/char_2009.gif) 000 Hz.
000 Hz.
Luminescence measurements
The temperature-dependent emission and excitation spectra of 1·2H2O and 2·CHCl3 (in the solid state) were acquired in a Fluorolog3® spectrofluorometer (FL3-2T, Horiba) with a modular double grating excitation monochromator (fitted with a 1200 grooves per mm grating blazed at 330 nm) and a TRIAX 320 single emission monochromator (fitted with a 1200 grooves per mm grating blazed at 500 nm, reciprocal linear density of 2.6 nm mm−1), coupled with a photomultiplier (R298, Hamamatsu), using the front face acquisition mode. The excitation source was a 450 W Xe arc lamp. The emission spectra were corrected for detection and the optical spectral response of the spectrofluorimeter, and the excitation spectra were corrected for the spectral distribution of the lamp intensity using a photodiode reference detector. The temperature was controlled using a helium-closed cycle cryostat, a vacuum system (4 × 10⁻⁴ Pa), and an autotuning temperature controller (Lakeshore 330, Lakeshore) with a resistance heater. The temperature was measured using a silicon diode cryogenic sensor (DT-470-SD, Lakeshore) with accuracies of ±0.5 K (12–30 K), ±0.25 K (30–60 K), and ±0.15 K (60–340 K).Thermometric measurements
The thermometric performance of the materials was determined using MatLab®. The integrated areas of the transitions and the corresponding errors together with the thermometric parameters were determined as detailed in section 4 in the ESI.† The deconvolution of the 4F9/2 → 6H13/2 Dy3+ transition was implemented in OriginLab© as detailed in the same section.Author contributions
Conceptualization: J.C.-V., L.D.C., M.F.; methodology: J.C.-V., C.G.-B, M.A.H.-R., J.S.-M.; validation: L.D.C., M.F.; formal analysis: J.C.-V., A.M.G.-D., C.D.S.B., M.F.; investigation: J.C.-V., C.G.-B; resources: L.D.C., M.F.; visualization: J.C.-V., C.D.S.B.; data curation and supervision: L.D.C., M.F.; writing – original draft preparation: J.C.-V., L.D.C., C.D.S.B, M.F.; writing – review & editing: J.C.-V., C.D.S.B., L.D.C., M.F.; project administration: L.D.C., M.F.; funding acquisition: J. C.-V., L.D.C., M.F. All authors have read and agreed to the published version of the manuscript.Conflicts of interest
There are no conflicts to declare.Acknowledgements
This work was developed within the scope of the project CICECO – Aveiro Institute of Materials, UIDB/50011/2020, UIDP/50011/2020, and LA/P/0006/2020, financed by national funds through the FCT/MCTES (PIDDAC). This article is also based upon work from COST Action CA22131, supported by COST (European Cooperation in Science and Technology). The authors acknowledge fruitful discussions with Dr Albano N. Carneiro Neto (University of Aveiro) concerning ligand-to-metal energy transfer. J. C. V. also thanks Xunta de Galicia for his postdoctoral fellowship (ED481B-2022-068).References
- J. Larionova, Y. Guari, S. Sene and G. Félix, in Handbook on the Physics and Chemistry of Rare Earths, Elsevier, 2023, DOI:10.1016/bs.hpcre.2023.10.003.
- J.-L. Liu, Y.-C. Chen and M.-L. Tong, Symmetry strategies for high performance lanthanide-based single-molecule magnets, Chem. Soc. Rev., 2018, 47, 2431–2453 RSC.
- J. D. Rinehart and J. R. Long, Exploiting single-ion anisotropy in the design of f-element single-molecule magnets, Chem. Sci., 2011, 2, 2078–2085 RSC.
- F.-S. Guo, B. M. Day, Y.-C. Chen, M.-L. Tong, A. Mansikkamäki and R. A. Layfield, Magnetic hysteresis up to 80 Kelvin in a dysprosium metallocene single-molecule magnet, Science, 2018, 362, 1400–1403 CrossRef CAS PubMed.
- M. Bałanda and R. Pełka, in Molecular Magnetic Materials: Concepts and Applications, ed. B. Sieklucka and D. Pinkowicz, Wiley-VCH, 2017 Search PubMed.
- J.-C. G. Bünzli and C. Piguet, Taking advantage of luminescent lanthanide ions, Chem. Soc. Rev., 2005, 34, 1048–1077 RSC.
- A. T. Bui, M. Beyler, A. Grichine, A. Duperray, J.-C. Mulatier, Y. Guyot, C. Andraud, R. Tripier, S. Brasselet and O. Maury, Near infrared two photon imaging using a bright cationic Yb(III) bioprobe spontaneously internalized into live cells, Chem. Commun., 2017, 53, 6005–6008 RSC.
- B. Yan, Lanthanide-functionalized metal–organic framework hybrid systems to create multiple luminescent centers for chemical sensing, Acc. Chem. Res., 2017, 50, 2789–2798 CrossRef CAS PubMed.
- C. D. S. Brites, S. Balabhadra and L. D. Carlos, Lanthanide-based thermometers: At the cutting-edge of luminescence thermometry, Adv. Opt. Mater., 2019, 7, 1801239 CrossRef.
- F. Pointillart, B. le Guennic, O. Cador, O. Maury and L. Ouahab, Lanthanide ion and tetrathiafulvalene-based ligand as a “magic” couple toward luminescence, single molecule magnets, and magnetostructural correlations, Acc. Chem. Res., 2015, 48, 2834–2842 CrossRef CAS PubMed.
- A. Zabala-Lekuona, J. M. Seco and E. Colacio, Single-molecule magnets: From Mn12-ac to dysprosium metallocenes, a travel in time, Coord. Chem. Rev., 2021, 441, 213984 CrossRef CAS.
- D. Errulat, R. Marin, D. A. Gálico, K. L. M. Harriman, A. Pialat, B. Gabidullin, F. Iikawa, O. D. D. Couto, Jr., J. O. Moilanen, E. Hemmer, F. A. Sigoli and M. Murugesu, A luminescent thermometer exhibiting slow relaxation of the magnetization: Toward self-monitored building blocks for next-generation optomagnetic devices, ACS Cent. Sci., 2019, 5, 1187–1198 CrossRef CAS PubMed.
- R. Marin, G. Brunet and M. Murugesu, Shining new light on multifunctional lanthanide single-molecule magnets, Angew. Chem., Int. Ed., 2021, 60, 1728–1746 CrossRef CAS PubMed.
- K. Kumar, D. Abe, K. Komori-Orisaku, O. Stefańczyk, K. Nakabayashi, J. R. Shakirova, S. P. Tunik and S.-i. Ohkoshi, Neodymium β-diketonate showing slow magnetic relaxation and acting as a ratiometric thermometer based on near-infrared emission, RSC Adv., 2019, 9, 23444–23449 RSC.
- A. A. Kitos, D. A. Gálico, N. Mavragani, R. Castañeda, J. O. Moilanen, J. L. Brusso and M. Murugesu, Probing optical and magnetic properties via subtle stereoelectronic effects in mononuclear DyIII-complexes, Chem. Commun., 2021, 57, 7818–7821 RSC.
- R. A. S. Ferreira, E. Mamontova, A. M. P. Botas, M. Shestakov, J. Vanacken, V. Moshchalkov, Y. Guari, L. F. Chibotaru, D. Luneau, P. S. André, J. Larionova, J. Long and L. D. Carlos, Synchronous temperature and magnetic field dual-sensing by luminescence in a dysprosium single-molecule magnet, Adv. Opt. Mater., 2021, 9, 2101495 CrossRef CAS.
- J. Corredoira-Vázquez, C. González-Barreira, M. Fondo, A. M. García-Deibe, J. Sanmartín-Matalobos, M. A. Hernández-Rodríguez and L. D. Carlos, Luminescence thermometry in a Dy4 single molecule magnet, Dalton Trans., 2022, 51, 15593–15600 RSC.
- S. Zanella, M. Aragon-Alberti, C. D. S. Brite, F. Salles, L. D. Carlos and J. Long, Luminescent single-molecule magnets as dual magneto-optical molecular thermometers, Angew. Chem., Int. Ed., 2023, 62, e202306970 CrossRef CAS PubMed.
- A. G. Bispo-Jr, L. Yeh, D. Errulat, D. A. Gálico, F. A. Sigoli and M. Murugesu, Improving the performance of β-diketonate-based DyIII single-molecule magnets displaying luminescence thermometry, Chem. Commun., 2023, 59, 8723–8726 RSC.
- R. Marin, D. A. Gálico, R. Gayfullina, J. O. Moilanen, L. D. Carlos, D. Jaque and M. Murugesu, A zero-field single-molecule magnet with luminescence thermometry capabilities containing soft donors, J. Mater. Chem. C, 2022, 10, 13946–13953 RSC.
- D. A. Gálico, R. Marin, G. Brunet, D. Errulat, E. Hemmer, F. A. Sigoli, J. O. Moilanen and M. Murugesu, Triplet-state position and crystal-field tuning in opto-magnetic lanthanide complexes: Two sides of the same coin, Chem. – Eur. J., 2019, 25, 14625–14637 CrossRef PubMed.
- J. Wang, J. J. Zakrzewski, M. Zychowicz, V. Vieru, L. F. Chibotaru, K. Nakabayashi, S. Chorazy and S.-i. Ohkoshi, Holmium(III) molecular nanomagnets for optical thermometry exploring the luminescence re-absorption effect, Chem. Sci., 2021, 12, 730–741 RSC.
- G. Brunet, R. Marin, M.-J. Monk, U. Resch-Genger, D. A. Gálico, F. A. Sigoli, E. A. Suturina, E. Hemmer and M. Murugesu, Exploring the dual functionality of an ytterbium complex for luminescence thermometry and slow magnetic relaxation, Chem. Sci., 2019, 10, 6799–6808 RSC.
- M. Fondo, J. Corredoira-Vázquez, A. M. García-Deibe, J. Sanmartín-Matalobos, M. Amoza, A. M. P. Botas, R. A. S. Ferreira, L. D. Carlos and E. Colacio, Field-induced slow magnetic relaxation and luminescence thermometry in a mononuclear ytterbium complex, Inorg. Chem. Front., 2020, 7, 3019–3029 RSC.
- K. Kumar, O. Stefanczyk, K. Nakabayashi, K. Imoto, Y. Oki and S.-i. Ohkoshi, Detection of sub-terahertz Raman response and nonlinear optical effects for luminescent Yb(III) complexes, Adv. Opt. Mater., 2022, 10, 2101721 CrossRef CAS.
- J. Wang, J. J. Zakrzewski, M. Heczko, M. Zychowicz, K. Nakagawa, K. Nakabayashi, B. Sieklucka, S. Chorazy and S.-i. Ohkoshi, Proton conductive luminescent thermometer based on near-infrared emissive {YbCo2} molecular nanomagnets, J. Am. Chem. Soc., 2020, 142, 3970–3979 CrossRef CAS.
- K. Karachousos-Spiliotakopoulos, V. Tangoulis, N. Panagiotou, A. Tasiopoulos, E. Moreno-Pineda, W. Wernsdorfer, M. Schulze, A. M. P. Botas and L. D. Carlos, Luminescence thermometry and field induced slow magnetic relaxation based on a near infrared emissive heterometallic complex, Dalton Trans., 2022, 51, 8208–8216 RSC.
- V. Tangoulis, V. Nastopoulos, N. Panagiotou, A. Tasiopoulos, G. Itskos, M. Athanasiou, E. Moreno-Pineda, W. Wernsdorfer, M. Schulze and O. Malina, High-performance luminescence thermometer with field-induced slow magnetic relaxation based on a heterometallic cyanido-bridged 3d–4f complex, Inorg. Chem., 2022, 61, 2546–2557 CrossRef CAS PubMed.
- K. Karachousos-Spiliotakopoulos, V. Tangoulis, N. Panagiotou, A. Tasiopoulos, V. Nastopoulos, E. Moreno-Pineda, W. Wernsdorfer, M. Schulze, A. M. P. Botas and L. D. Carlos, Lanthanide luminescence thermometry and slow magnetic relaxation in 3-D polycyanidometallate-based materials, Inorg. Chem., 2022, 61, 18629–18639 CrossRef CAS PubMed.
- G. Félix, S. Sene, A. Kulakova, A. N. Bilyachenko, V. N. Khrustalev, E. S. Shubina, Y. Guari and J. Larionova, Tetranuclear lanthanide-based silsesquioxanes: Towards a combination of a slow relaxation of the magnetization and a luminescent thermometry, RSC Adv., 2023, 13, 26302–26312 RSC.
- J. Wang, J. J. Zakrzewski, M. Zychowicz, Y. Xin, H. Tokoro, S. Chorazy and S.-i. Ohkoshi, Desolvation-induced highly symmetrical terbium(III) single-molecule magnet exhibiting luminescent self-monitoring of temperature, Angew. Chem., Int. Ed., 2023, 62, e202306372 CrossRef CAS PubMed.
- S. Ma, T. Zhang, J.-P. Zhao, Z.-Y. Liu and F.-C. Liu, A magnetic site dilution approach to achieve bifunctional fluorescent thermometers and single-ion magnets, Dalton Trans., 2021, 50, 1307–1312 RSC.
- P.-Y. Liao, Y. Liu, Z.-Y. Ruan, H.-L. Wang, C.-G. Shi, W. Deng, S.-G. Wu, J.-H. Jia and M.-L. Tong, Magnetic and luminescent dual responses of photochromic hexaazamacrocyclic lanthanide complexes, Inorg. Chem., 2023, 62, 1075–1085 CrossRef CAS PubMed.
- J. Corredoira-Vázquez, P. Oreiro-Martínez, A. M. García-Deibe, J. Sanmartín-Matalobos and M. Fondo, A DyIII complex of a pentadentate Schiff base with field-induced single-ion magnet behaviour, Magnetochemistry, 2023, 9, 62 CrossRef.
- M. Fondo, J. Corredoira-Vázquez, A. M. García-Deibe, J. Sanmartín-Matalobos, J. M. Herrera and E. Colacio, Designing ligands to isolate ZnLn and Zn2Ln complexes: field-induced single-ion magnet behavior of the ZnDy, Zn2Dy, and Zn2Er analogues, Inorg. Chem., 2017, 56, 5646–5656 CrossRef CAS PubMed.
- M. Fondo, J. Corredoira-Vázquez, A. Herrera-Lanzós, A. M. García-Deibe, J. Sanmartín-Matalobos, J. M. Herrera, E. Colacio and C. Nuñez, Improving the SMM and luminescence properties of lanthanide complexes with LnO9 cores in the presence of ZnII: An emissive Zn2Dy single ion magnet, Dalton Trans., 2017, 46, 17000–17009 RSC.
- A. B. Canaj, S. Dey, E. R. Martí, C. Wilson, G. Rajaraman and M. Murrie, Insight into D6h symmetry: Targeting strong axiality in stable dysprosium(III) hexagonal bipyramidal single-ion magnets, Angew. Chem., Int. Ed., 2019, 58, 14146–14151 CrossRef CAS PubMed.
- (a) M. Llunell, D. Casanova, J. Cirera, P. Alemany and S. Alvarez, SHAPE, version 2.1, Universitat de Barcelona, Barcelona, Spain, 2013 Search PubMed; (b) A. Ruiz-Martínez, D. Casanova and S. Alvarez, Polyhedral structures with an odd number of vertices: Mine-coordinate metal compounds, Chem. – Eur. J., 2008, 14, 1291–1303 CrossRef PubMed; (c) M. Llunell, D. Casanova, J. Cirera, P. Alemany and S. Alvarez, SHAPE: Program for the stereochemical analysis of molecular fragments by means of continuous shape measures and associated tools, University of Barcelona, Barcelona, Spain, 2010 Search PubMed.
- J. Tang and P. Zhang, in Lanthanide Single Molecule Magnets, ed. J. Tang and P. Zhang, Springer, Berlin, Heidelberg, 2015, pp. 1–39 Search PubMed.
- J. Corredoira-Vázquez, C. González-Barreira, P. Oreiro-Martínez, A. M. García-Deibe, J. Sanmartín-Matalobos and M. Fondo, Lanthanoid complexes of pentadentate and hexadentate N5 and N6 macrocycles: synthesis and applications, J. Rare Earths, 2024, 42, 1–15 CrossRef.
- Y. Gil, R. C. de Santana, A. S. S. de Camargo, L. G. Merízio, P. F. Carreño, P. Fuentealba, J. Manzur and E. Spodine, Dual visible and near-infrared luminescence in mononuclear macrocyclic erbium(III) complexes via ligand and metal centred excitation, Dalton Trans., 2023, 52, 3158–3168 RSC.
- A. N. Carneiro Neto, E. E. S. Teotonio, G. F. de Sá, H. F. Brito, J. Legendziewicz, L. D. Carlos, M. C. F. C. Felinto, P. Gawryszewska, R. T. Moura, R. L. Longo, W. M. Faustino and O. L. Malta, in Handbook on the Physics and Chemistry of Rare Earths, ed. J.-C. G. Bünzli and V. K. Pecharsky, Elsevier, 2019, vol. 56, pp. 55–162 Search PubMed.
- A. N. Carneiro Neto, E. Mamontova, A. M. P. Botas, C. D. S. Brites, R. A. S. Ferreira, J. Rouquette, Y. Guari, J. Larionova, J. Long and L. D. Carlos, Rationalizing the thermal response of dual-center molecular thermometers: The example of an Eu/Tb coordination complex, Adv. Opt. Mater., 2022, 10, 2101870 CrossRef CAS.
- E. Kasprzycka, A. N. Carneiro Neto, V. A. Trush, L. Jerzykiewicz, V. M. Amirkhanov, O. L. Malta, J. Legendziewicz and P. Gawryszewska, How minor structural changes generate major consequences in photophysical properties of RE coordination compounds; Resonance effect, LMCT state, J. Rare Earths, 2020, 38, 552–563 CrossRef CAS.
- J. Manzur, P. Fuentealba, Y. Gil, J. Pérez-Obando, J. Morales Alfaro, A. I. Vega Carvallo, D. Aravena, R. C. d. Santana, A. N. Carneiro Neto and E. Spodine, Tuning the emission of homometallic DyIII, TbIII, and EuIII 1-D coordination polymers with 2,6-di(1H-1,2,4-triazole-1-yl-methyl)-4-R-phenoxo ligands: Sensitization through the singlet state, Inorg. Chem., 2023, 62, 19195–19207 CrossRef CAS PubMed.
- R. T. Moura Jr., J. A. Oliveira, I. A. Santos, E. M. de Lima, L. D. Carlos, E. C. Aguiar and A. N. C. Neto, Theoretical evidence of the singlet predominance in the intramolecular energy transfer in Ruhemann's purple Tb(III) complexes, Adv. Theory Simul., 2021, 4, 2000304 CrossRef.
- S. Chorazy, M. Rams, K. Nakabayashi, B. Sieklucka and S.-i. Ohkoshi, White light emissive DyIII single-molecule magnets sensitized by diamagnetic [CoIII(CN)6]3− linkers, Chem. – Eur. J., 2016, 22, 7371–7375 CrossRef CAS PubMed.
- A. Bednarkiewicz, L. Marciniak, L. D. Carlos and D. Jaque, Standardizing luminescence nanothermometry for biomedical applications, Nanoscale, 2020, 12, 14405–14421 RSC.
- C. D. S. Brites, P. P. Lima, N. J. O. Silva, A. Millán, V. S. Amaral, F. Palacio and L. D. Carlos, Thermometry at the nanoscale, Nanoscale, 2012, 4, 4799–4829 RSC.
- C. D. S. Brites, A. Millán and L. D. Carlos, in Handbook on the physics and chemistry of rare earths, ed. B. Jean-Claude and P. Vitalij K, Elsevier, 2016, vol. 49, pp. 339–427 Search PubMed.
- J. C. Martins, C. D. S. Brites, A. N. C. Neto, R. A. S. Ferreira and L. D. Carlos, An overview of luminescent primary thermometers, Springer International Publishing, Cham, 2023 Search PubMed.
- J. C. Martins, A. R. N. Bastos, R. A. S. Ferreira, X. Wang, G. Chen and L. D. Carlos, Primary luminescent nanothermometers for temperature measurements reliability assessment, Adv. Photonics Res., 2021, 2, 2000169 CrossRef CAS.
- S. Balabhadra, M. L. Debasu, C. D. S. Brites, R. A. S. Ferreira and L. D. Carlos, Upconverting nanoparticles working as primary thermometers in different media, J. Phys. Chem. C, 2017, 121, 13962–13968 CrossRef CAS.
- F. E. Maturi, A. Gaddam, C. D. S. Brites, J. M. M. Souza, H. Eckert, S. J. L. Ribeiro, L. D. Carlos and D. Manzani, Extending the palette of luminescent primary thermometers: Yb3+/Pr3 + co-doped fluoride phosphate glasses, Chem. Mater., 2023, 35, 7229–7238 CrossRef CAS PubMed.
- C. D. S. Brites, E. D. Martínez, R. R. Urbano, C. Rettori and L. D. Carlos, Self-calibrated double luminescent thermometers through upconverting nanoparticles, Front. Chem., 2019, 7, 267 CrossRef CAS PubMed.
- G. M. Sheldrick, SADABS, area-detector absorption correction, Siemens Industrial Automation, Inc., Madison, WI, 2007 Search PubMed.
- G. Sheldrick, SHELXT - Integrated space-group and crystal-structure determination, Acta Crystallogr., Sect. A: Found. Adv., 2015, 71, 3–8 CrossRef.
- G. M. Sheldrick, Crystal structure refinement with SHELXL, Acta Crystallogr., Sect. C: Struct. Chem., 2015, 71, 3–8 Search PubMed.
Footnotes |
| † Electronic supplementary information (ESI) available: Structural, magnetic, photoluminescence and thermometric characterization. CCDC 2238908 and 2238909. For ESI and crystallographic data in CIF or other electronic format see DOI: https://doi.org/10.1039/d3qi02374e |
| ‡ Current address: Departamento de Física, Universidad de La Laguna, Apdo. Correos 456, E-38200 San Cristóbal de La Laguna, Santa Cruz de Tenerife, Spain. |
| This journal is © the Partner Organisations 2024 |

