 Open Access Article
A pharmaco–technical investigation of oxaprozin and gaultheria oil nanoemulgel: a combination therapy
Talha†
a,
Ahsan
Ali†
a,
Sradhanjali
Mohapatra
 a,
Ayesha
Siddiqui
a,
Uzma
Farooq
a,
Athar
Shamim
a,
Ayesha
Siddiqui
a,
Uzma
Farooq
a,
Athar
Shamim
 a,
Pooja
Jain
a,
Mohammed
Aslam
b,
Ramsha
Ansari
a,
Mohd. Aamir
Mirza
*a and
Zeenat
Iqbal
a,
Pooja
Jain
a,
Mohammed
Aslam
b,
Ramsha
Ansari
a,
Mohd. Aamir
Mirza
*a and
Zeenat
Iqbal
 *a
*a
aNanotechnology Lab, Dept of Pharmaceutics, School of Pharmaceutics Education and Research (SPER), Jamia Hamdard, New Delhi, India. E-mail: zeenatiqbal@jamiahamdard.ac.in; Tel: +919811733016
bPharmacy Dept. Tishk International University, Erbil, Kurdistan Region, Iraq
First published on 11th June 2024
Abstract
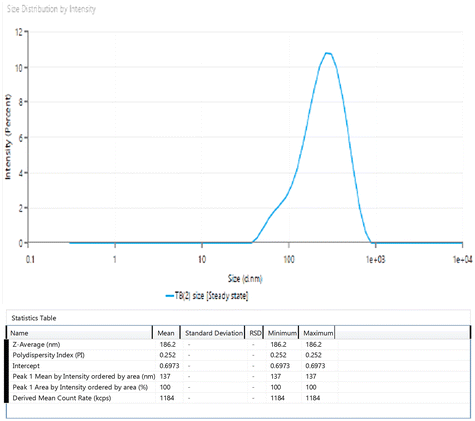
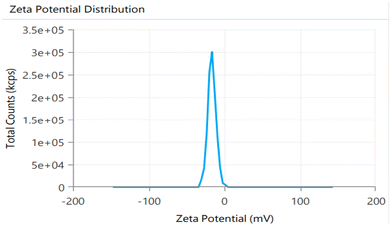
Worldwide, osteoarthritis is a significant cause of pain, disability, and socioeconomic losses. The disorder's epidemiology is diverse and complicated. Chondrocyte viability and function are compromised by oxidative stress, mechanical stress, and inflammatory mediators. This reprogrammes the cells to undergo hypertrophic differentiation and early “senescence” and increases their susceptibility to pro-catabolic and pro-inflammatory mediators. Given the above discussed pathophysiology of osteoarthritis, it is anticipated that the combination of oxaprozin and gaultheria oil (utilized in traditional medicine for rheumatoid arthritis) will definitely help alleviate the multifactorial disease. The objective of the research was to develop and assess a nanoemulsion gel/nanoemulgel (NEG) by combining oxaprozin, a non-steroidal anti-inflammatory drug (NSAID), and gaultheria oil using Carbopol 974 as a gelling agent. The aqueous titration method was used to create the nanoemulsion by plotting a pseudo-ternary phase diagram, and Smix was used to draw the phase diagram. The formulation was optimized by employing the design of the experiment and incorporated into Carbopol 974 to formulate the NEG. Various properties of the developed formulation, such as the vesicular size, polydispersity index (PDI), zeta potential, morphology and thermodynamic stability, were tested. Furthermore, pH, homogeneity, spreadability, extrudability, texture, bioadhesion, stability, and skin irritation were assessed for the NEG. Additionally, in vitro and ex vivo tests were conducted for the assessment of the improved formulation. The result shows that the nanoemulsion has a vesicular size of 196.2 nm with good PDI and a zeta potential of −12.33 mV. Furthermore, the results show that the NEG had a biphasic release pattern with a percent cumulative drug release (%CDR) of 78.123 after 25 h. The optimized formulation was also found to be stable at 4 °C for up to 4 weeks. Furthermore, the NEG shows good drug penetration and sustained drug release pattern, which may facilitate the transport of oxaprozin and gaultheria oil through joint tissues, resulting in longer pain alleviation and decreased inflammation. In conclusion, the new formulation would be a good choice for topical medication delivery to improve the oil and oxaprozin combined therapeutic efficacy in the management of osteoarthritis.
1. Introduction
One of the most prevalent degenerative diseases that affect joints and gets worse over time is osteoarthritis, often resulting in chronic pain. The prevalence of this disease is significantly high among adults throughout the world. Osteoarthritis ranks as the second most prevalent rheumatologic condition and is the most common joint disease in India, affecting 22% to 39% of the population. This condition is more prevalent among women than men, with its occurrence significantly rising with age. Approximately 45% of women over 65 experience symptoms, and radiological evidence is present for 70% of individuals in this age group.1,2 This condition affects the musculoskeletal system and is characterised by the progressive degeneration of articular cartilage, localised inflammation, and debilitating joint pain.3,4 Since there are no available medications that can alter the course of the disease, symptomatic treatments such as glucocorticoids, monoclonal antibodies, analgesics, and non-steroidal anti-inflammatory drugs (NSAIDs) are commonly prescribed for this condition.5,6 NSAIDs are commonly used to treat and manage osteoarthritis. Oral NSAIDs are popular among patients, but are linked with serious gastrointestinal side effects (for instance, bleeding, ulceration, and irritation). Hence, numerous research endeavours are focused on devising an effective method of NSAID delivery through topical application to reduce systemic side effects and improve local concentration.7Compared to the oral route, administration through the skin has several advantages, including continuous and smooth delivery of the medication to the site of action without systemic side effects at a comparatively lower dose. A new NSAID belonging to the propionic acid class called oxaprozin is used to treat painful inflammatory conditions associated with osteoarthritis,8,9 although it comes with some side effects. Moreover, it is a member of BCS Class II, and its inadequate oral absorption capacity may be primarily due to its poor solubility throughout the gastrointestinal tract. Therefore, a topical delivery system is a better option for this drug to increase its efficiency by decreasing the dose and hence side effects. Moreover, topical administration lengthens the contact time, by avoiding the first-pass metabolism.10 Additionally, a marketed formulation of oxaprozin through topical route is not available.
An innovative drug delivery technique called nano-emulgel (NEG) aims to enhance the therapeutic profile of medications having poor solubility.11 NEG is an amalgamated preparation of a gel and nanoemulsion (NE). Low viscosity in NEs can result in low retention time and spreadability. However, this can be overcome by incorporating an appropriate gelling agent by forming the NEG. It improves stability, and makes it possible for drugs to be delivered with controlled and immediate release. In comparison to other nano-carrier systems, it is also associated with advantages like a high drug-loading capacity, improved penetration, diffusion, and minimal skin irritation.12
One of the main problems associated with NE is stability. An acceptable preparation technique combined with a suitable choice of oils and surfactants is necessary to produce a stable nanoemulsion. Lipid base emulsions are a class of NEs that not only improve drug retention and bioavailability, but also have the ability to dissolve hydrophobic drugs and shield them from enzymatic degradation and dermal hydrolysis. For centuries, gaultheria oil has been utilized in traditional medicine to address conditions associated with inflammation or infection, such as rheumatoid arthritis.13,14 The primary focus of the pharmacological activities of both pure compounds and crude extract from this genus was on their analgesic and anti-inflammatory characteristics.15 Gaultheria oil is an essential oil having methyl salicylate as the primary constituent, which is usually used to relieve pain associated with rheumatic arthritis.
This study was conducted to develop a new NEG containing both oxaprozin and gaultheria oil for the treatment of pain related to osteoarthritis using a topical application method. Using the aqueous titration method, gaultheria oil-loaded oxaprozin NE was formulated. Aqueous titration was used to create a pseudo-ternary phase diagram, and Smix was used to draw the phase diagram. The formulation was optimized by employing the design of the experiment (DOE). Finally, NEG was prepared by using Carbopol 974, and characterised and evaluated for its topical application over the skin. Furthermore, the effectiveness of the formulation was confirmed through stability testing in vitro, release analysis, ex vivo permeation study, and confocal microscopy studies.
The formulation was expected to have a better efficacy owing to the synergistic action of both active components through local application. It would also enhance the patient compliance by decreasing the side effects, as it has a natural component. Furthermore, nanotechnology was exploited for formulating the nanoemulsion, which would definitely increase the skin permeation by reducing the size. This research may open a novel path for utilizing a traditional herbal oil, along with a synthetic drug for osteoarthritis treatment through topical route.
2. Materials and methods
Oxaprozin was procured from Prince Scientific, Hyderabad, India. Gaultheria, sunflower, apricot, lemongrass, clove, and kalonji oils were procured from the local market. The supplier of Carbopol 974® was SD Fine Chemicals India Pvt. Ltd (Mumbai, India). Rhodamine B was sourced from Sigma-Aldrich in Darmstadt, Germany. Surfactants like polyethylene glycol, PEG 400, Tween 20, Tween 40, and Tween 80 were procured from Sisco Research Laboratories Pvt Ltd (Mumbai, India). Solvents like acetone, methanol, and ethanol were supplied by CDH (Delhi, India). Loba Chemie Pvt. Ltd (Mumbai, India) provided the triethanolamine. Other chemicals and all solvents and reagents were of analytical grade.2.1. Screening of excipients
A number of excipients, including oil, surfactants, and co-surfactants, were thoroughly screened in order to produce a NE. Oils like Gaultheria oil, sunflower oil, apricot oil, lemongrass oil, clove oil, and kalonji oil were screened for the drug's solubility and miscibility before being used in the formulation.16 The oil with the highest concentration of dissolved oxaprozin was chosen. According to the ionic characteristics and unique HLB values, the surfactants and co-surfactants Tween 20, Tween 40, Tween 80, and PEG-400 were taken into consideration for screening. The HLB value of a surfactant is an important factor in the formulation of emulsions because it enables the choice of an appropriate surfactant or surfactant combination to create a stable emulsion system. The procedure followed in a glass vial, where 1 ml of each of these excipient (oil or surfactant) was added, along with an excess amount of drug. To aid in solubilisation, the materials were vortexed (Remi CM-101 cyclomixer) and kept at 25 °C for 72 min an incubator shaker. The solution's supernatant was extracted after centrifugation (Remi R8C Laboratory centrifuge) at 3000 ± 50 rpm for 10 min and mixed with methanol, and the resultant solution was vortexed and filtered through a 0.22 μm syringe filter. The amount of solubilized drug in the diluted samples was measured in a UV spectrophotometer (UV 1601, Shimadzu, Japan) at a λmax of 285 nm.17,182.2. Formulation development
![[thin space (1/6-em)]](https://www.rsc.org/images/entities/char_2009.gif) :
:![[thin space (1/6-em)]](https://www.rsc.org/images/entities/char_2009.gif) 0, 1
0, 1![[thin space (1/6-em)]](https://www.rsc.org/images/entities/char_2009.gif) :
:![[thin space (1/6-em)]](https://www.rsc.org/images/entities/char_2009.gif) 1, 2
1, 2![[thin space (1/6-em)]](https://www.rsc.org/images/entities/char_2009.gif) :
:![[thin space (1/6-em)]](https://www.rsc.org/images/entities/char_2009.gif) 1, 3
1, 3![[thin space (1/6-em)]](https://www.rsc.org/images/entities/char_2009.gif) :
:![[thin space (1/6-em)]](https://www.rsc.org/images/entities/char_2009.gif) 1, and 4
1, and 4![[thin space (1/6-em)]](https://www.rsc.org/images/entities/char_2009.gif) :
:![[thin space (1/6-em)]](https://www.rsc.org/images/entities/char_2009.gif) 1.
1.
Then, in order to cover the study's maximum ratios, the oil phase and Smix were blended at weight ratios of 1![[thin space (1/6-em)]](https://www.rsc.org/images/entities/char_2009.gif) :
:![[thin space (1/6-em)]](https://www.rsc.org/images/entities/char_2009.gif) 9, 2
9, 2![[thin space (1/6-em)]](https://www.rsc.org/images/entities/char_2009.gif) :
:![[thin space (1/6-em)]](https://www.rsc.org/images/entities/char_2009.gif) 8(1
8(1![[thin space (1/6-em)]](https://www.rsc.org/images/entities/char_2009.gif) :
:![[thin space (1/6-em)]](https://www.rsc.org/images/entities/char_2009.gif) 4), 3
4), 3![[thin space (1/6-em)]](https://www.rsc.org/images/entities/char_2009.gif) :
:![[thin space (1/6-em)]](https://www.rsc.org/images/entities/char_2009.gif) 7(1
7(1![[thin space (1/6-em)]](https://www.rsc.org/images/entities/char_2009.gif) :
:![[thin space (1/6-em)]](https://www.rsc.org/images/entities/char_2009.gif) 2.3), 4
2.3), 4![[thin space (1/6-em)]](https://www.rsc.org/images/entities/char_2009.gif) :
:![[thin space (1/6-em)]](https://www.rsc.org/images/entities/char_2009.gif) 6(1
6(1![[thin space (1/6-em)]](https://www.rsc.org/images/entities/char_2009.gif) :
:![[thin space (1/6-em)]](https://www.rsc.org/images/entities/char_2009.gif) 1.5), 5
1.5), 5![[thin space (1/6-em)]](https://www.rsc.org/images/entities/char_2009.gif) :
:![[thin space (1/6-em)]](https://www.rsc.org/images/entities/char_2009.gif) 5(1
5(1![[thin space (1/6-em)]](https://www.rsc.org/images/entities/char_2009.gif) :
:![[thin space (1/6-em)]](https://www.rsc.org/images/entities/char_2009.gif) 1), 6
1), 6![[thin space (1/6-em)]](https://www.rsc.org/images/entities/char_2009.gif) :
:![[thin space (1/6-em)]](https://www.rsc.org/images/entities/char_2009.gif) 4(1
4(1![[thin space (1/6-em)]](https://www.rsc.org/images/entities/char_2009.gif) :
:![[thin space (1/6-em)]](https://www.rsc.org/images/entities/char_2009.gif) 0.7), 8
0.7), 8![[thin space (1/6-em)]](https://www.rsc.org/images/entities/char_2009.gif) :
:![[thin space (1/6-em)]](https://www.rsc.org/images/entities/char_2009.gif) 2(1
2(1![[thin space (1/6-em)]](https://www.rsc.org/images/entities/char_2009.gif) :
:![[thin space (1/6-em)]](https://www.rsc.org/images/entities/char_2009.gif) 0.25), 9
0.25), 9![[thin space (1/6-em)]](https://www.rsc.org/images/entities/char_2009.gif) :
:![[thin space (1/6-em)]](https://www.rsc.org/images/entities/char_2009.gif) 1(1
1(1![[thin space (1/6-em)]](https://www.rsc.org/images/entities/char_2009.gif) :
:![[thin space (1/6-em)]](https://www.rsc.org/images/entities/char_2009.gif) 0.1), 1
0.1), 1![[thin space (1/6-em)]](https://www.rsc.org/images/entities/char_2009.gif) :
:![[thin space (1/6-em)]](https://www.rsc.org/images/entities/char_2009.gif) 2, 1
2, 1![[thin space (1/6-em)]](https://www.rsc.org/images/entities/char_2009.gif) :
:![[thin space (1/6-em)]](https://www.rsc.org/images/entities/char_2009.gif) 3, 1
3, 1![[thin space (1/6-em)]](https://www.rsc.org/images/entities/char_2009.gif) :
:![[thin space (1/6-em)]](https://www.rsc.org/images/entities/char_2009.gif) 3.5, 1
3.5, 1![[thin space (1/6-em)]](https://www.rsc.org/images/entities/char_2009.gif) :
:![[thin space (1/6-em)]](https://www.rsc.org/images/entities/char_2009.gif) 5, 1
5, 1![[thin space (1/6-em)]](https://www.rsc.org/images/entities/char_2009.gif) :
:![[thin space (1/6-em)]](https://www.rsc.org/images/entities/char_2009.gif) 6, 1
6, 1![[thin space (1/6-em)]](https://www.rsc.org/images/entities/char_2009.gif) :
:![[thin space (1/6-em)]](https://www.rsc.org/images/entities/char_2009.gif) 7, and 1
7, and 1![[thin space (1/6-em)]](https://www.rsc.org/images/entities/char_2009.gif) :
:![[thin space (1/6-em)]](https://www.rsc.org/images/entities/char_2009.gif) 8 (w/w). The aqueous titration technique was used to prepare the NE that was previously mentioned. Under moderate agitation, these weight ratios of Smix and oil were diluted dropwise. The mixtures were evaluated visually after being equilibrated, and they were found to be NEs due to their clarity, transparency, and flow ability. Prior to being solubilized in a Smix, the required amount of oxaprozin was first dissolved in a pre-selected oil. A vortex mixer was then used to combine the final mixture. For the characterization studies, nanoemulsions were kept in tightly sealed glass containers at 25 °C.20
8 (w/w). The aqueous titration technique was used to prepare the NE that was previously mentioned. Under moderate agitation, these weight ratios of Smix and oil were diluted dropwise. The mixtures were evaluated visually after being equilibrated, and they were found to be NEs due to their clarity, transparency, and flow ability. Prior to being solubilized in a Smix, the required amount of oxaprozin was first dissolved in a pre-selected oil. A vortex mixer was then used to combine the final mixture. For the characterization studies, nanoemulsions were kept in tightly sealed glass containers at 25 °C.20
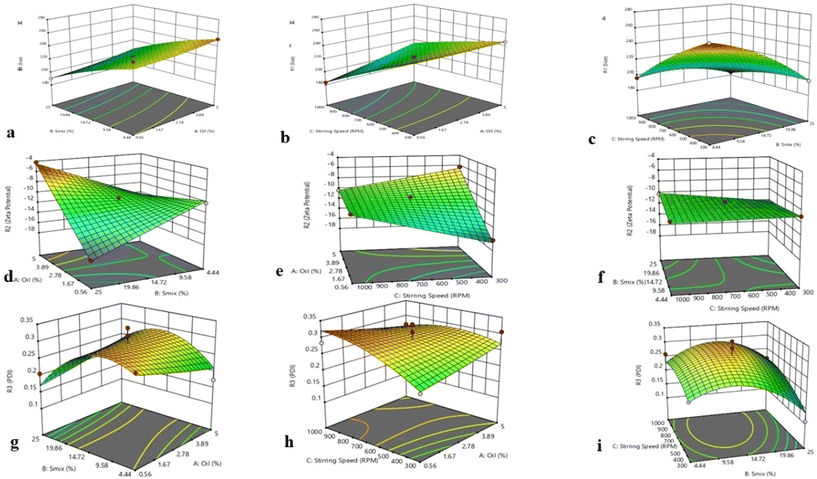
In this formulation, the dependent variables were the stirring speed (rpm), oil concentration (%), and surfactant concentration (%), while the independent responses were the particle size (nm), zeta potential (mV) and polydispersity index (PDI). Furthermore, in accordance with the DoE requirements, the oil and surfactant concentrations were chosen at high, medium, and low levels using the ternary phase diagrams. To predict the effects of independent variables on dependent responses, the central composite design (CCD), a response surface methodology approach, was used as the optimization design.21 A total of fifteen randomised runs were gathered and compared using CCD in order to determine the optimal formulation.22–24
2.3. Thermodynamic stability stress-stability studies
The screening method was used to determine which formulation was the best and most stable. The stress-stability studies that were conducted on the NEs have the following explanation.The chosen formulations underwent three cycles of heating and cooling, ranging from 4 to 45 degrees Celsius, and were maintained at each temperature for 48 h. Following the heating–cooling cycle, the formulations underwent physical instability checks for things like flocculation, cracking, phase separation, and precipitation. After passing the first test, the NEs underwent a 30 minute centrifugation at 3500 rpm to make sure the metastable system was ruled out, and to check for any homogeneous changes that might have occurred during the process. Ultimately, the preparations were kept in storage at −21 °C to +25 °C for three cycles of 48 h each. There were variations in the emulsions’ homogeneity for Freeze–Thaw cycle.26,27
2.4. Characterization of optimized NE
2.5. Preparation of conventional gel
The conventional gel was developed by dispersing oxaprozin (previously solubilized in ethanol) and the gelling agent in water, and continuously stirring at a moderate speed with a magnetic stirrer. Carbopol 974 was accurately weighed out and added in small amounts, while being continuously stirred at 750 rpm until all of the Carbopol was mixed. The necessary amount of the drug solution was added. After allowing the mixture to sit for an entire night, it was neutralised by adding triethanolamine (0.056%) dropwise until the gel was formed. Following preparation, the obtained mixture was examined for colour, appearance, viscosity, and consistency.2.6. Preparation of the oxaprozin-loaded NEG
Carbopol 974 (0.5%–2%) was precisely weighed and dispersed in water for 6 h. In order to avoid trapping extra air, NE was also added to the gel gradually, while being continuously agitated at 750 rpm. The mixture was then neutralized by adding dropwise amounts of triethanolamine (0.056%) until the gel had formed. The NEG compositions’ consistency, viscosity, colour, and appearance were evaluated after preparation.2.7. Evaluation of NEG
Gel characterization was done for different parameters.The purpose of the Extrudability Study is to quantify the force needed to extrude the gel from a tube. For this, the emulgel formulation was dispensed into a regular capped collapsible laminate tube and sealed. The weight of the filled tube was measured and noted. The tube was then secured between two glass slides and clamped down. A 500 g weight was placed on top of the glass slide. Subsequently, the cap was opened to allow extrusion of the emulgel. The quantity of emulgel extruded was collected and weighed, enabling the calculation of the percentage of extruded emulgel.
Using the following formula, the extrudability of the optimized formulation was determined:
| E = M/A |
| Bioadhesive strength = weight required (in gm)/area (cm2) |
Glycerol was eliminated by washing with running water for 8 h. It was then treated for one minute with 0.3% w/v aq. sodium sulfide solution to remove any remaining sulfur components. Then, the process included acidification with a 0.2% (v/v) sulfuric acid solution, followed by a hot water rinse at 60 °C for 2 minutes to eliminate the acid. Meanwhile, 500 ml of pH 7.4 phosphate buffer (release media) was prepared in accordance with I. P 2007.
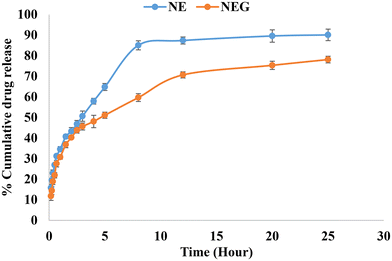
The dialysis bag method was utilized, which is a cellulose membrane (Sigma, USA) that permits the free drug to diffuse. The dialysis bag was submerged in release media for 12 h before use. Following the placement of the formulations inside the dialysis bag, it was immersed in 100 ml of release media containing a solvent mixture of 80% (v/v) phosphate buffered saline (PBS) (pH 7.4) and methanol in a beaker. At a temperature of 37 ± 0.05 °C, the beaker was maintained in an incubator shaker operating at 200 rpm. In order to maintain sink conditions, one ml aliquots of the sample were taken at predetermined intervals (0, 10, 15, 20, 30, 40, 60, 90, and up to 300 minutes), and an equivalent volume of media was added. Oxaprozin at 285 nm was evaluated using a UV spectrophotometer. The measurement was done in triplicate. The in vitro release graph (cumulative percent release) for NEG was calculated.36 The nanoemulgel (14 mg of oxaprozin) was compared with the nanoemulsion (14 mg of oxaprozin).
3 Results and discussion
3.1 Screening of excipients
The investigation of oxaprozin's solubility in different excipients is shown in Fig. 1. Of the experimental oils, Gaultheria oil (3 ± 0.5 mg mL−1) showed the highest solubility of the drug, indicating that it is a suitable oil phase among all the chosen oils for the proposed formulation. Furthermore, it has been exploited in traditional medicine for rheumatoid arthritis, owing to its anti-inflammatory property. Tween 80:PEG 400 were chosen as the surfactant and co-surfactant, respectively, because they demonstrated the highest levels of drug miscibility and solubility (Fig. 1). In addition, the Tween 80![[thin space (1/6-em)]](https://www.rsc.org/images/entities/char_2009.gif) :
:![[thin space (1/6-em)]](https://www.rsc.org/images/entities/char_2009.gif) PEG 400 combination (Smix ratio) was chosen by using pseudo-ternary phase diagrams to generate a distinct NE with the placebo formulations. Drug solubilization studies are essential to the development of NE because they are vital to the stability, delivery, and upkeep of the formulation. Among other things, choosing the right excipients is essential to creating a homogenous, transparent formulation with a high API binding capacity (Table 1).
PEG 400 combination (Smix ratio) was chosen by using pseudo-ternary phase diagrams to generate a distinct NE with the placebo formulations. Drug solubilization studies are essential to the development of NE because they are vital to the stability, delivery, and upkeep of the formulation. Among other things, choosing the right excipients is essential to creating a homogenous, transparent formulation with a high API binding capacity (Table 1).
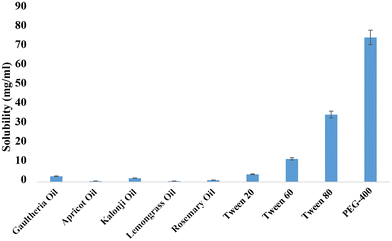 | ||
| Fig. 1 Solubility tests of oxaprozin in different oils, surfactants and co-surfactants were performed to formulate the NE. | ||
| S. no. | Surfactant/co-surfactant | HLB |
|---|---|---|
| 1 | Tween 20 | 16.7 |
| 2 | Tween 40 | 15.6 |
| 3 | Tween 80 | 15 |
| 4 | PEG 400 | 11.4 |
3.2 Formulation development
![[thin space (1/6-em)]](https://www.rsc.org/images/entities/char_2009.gif) :
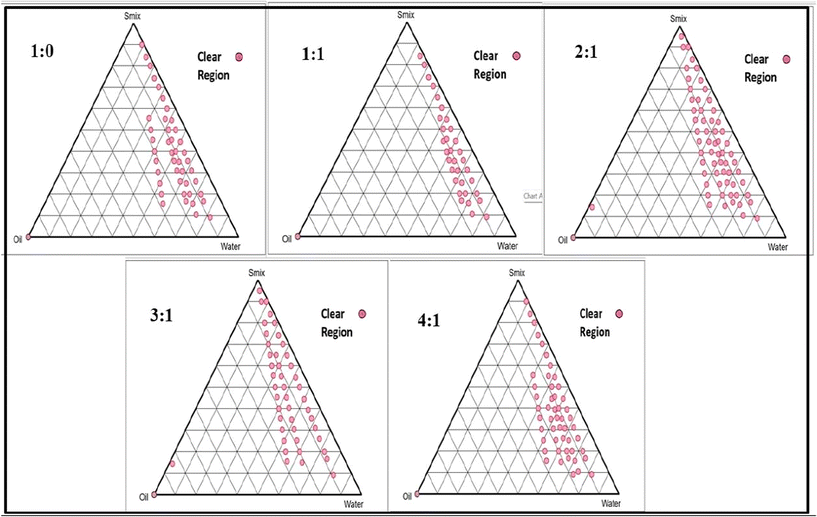
:![[thin space (1/6-em)]](https://www.rsc.org/images/entities/char_2009.gif) 1 Smix pseudoternary phase diagram, which covers the maximum stable o/w NE region, was selected for further study based on the image that comes before it. Whether the NE area is small or large depends on how well that specific surfactant or mixture of surfactants solubilizes the oil phase. A greater solubilization leads to a larger area containing a higher concentration of the transparent, uniform solution.
1 Smix pseudoternary phase diagram, which covers the maximum stable o/w NE region, was selected for further study based on the image that comes before it. Whether the NE area is small or large depends on how well that specific surfactant or mixture of surfactants solubilizes the oil phase. A greater solubilization leads to a larger area containing a higher concentration of the transparent, uniform solution.
| Run | Factor 1 A: Oil, % | Factor 2 B: Smix, % | Factor 3 A: Stirring speed (RPM) | Response 1 R1, size | Response 2 R2, zeta potential | Response 3 R3, PDI |
|---|---|---|---|---|---|---|
| 1 | 2.78 | 14.72 | 650 | 223.83 | −11.14 | 0.2888 |
| 2 | 0.56 | 14.72 | 300 | 226.05 | −16.51 | 0.0054 |
| 3 | 0.56 | 4.44 | 650 | 210.2 | −9.86 | 0.2296 |
| 4 | 2.78 | 4.44 | 300 | 260.84 | −10.98 | 0.2482 |
| 5 | 5 | 4.44 | 650 | 250.88 | −12.51 | 0.2043 |
| 6 | 0.56 | 25 | 650 | 190.12 | −17.72 | 0.1758 |
| 7 | 2.78 | 4.44 | 1000 | 196.22 | −11.31 | 0.233 |
| 8 | 2.78 | 14.72 | 650 | 223.83 | −11.19 | 0.2888 |
| 9 | 2.78 | 14.72 | 650 | 223.83 | −11.18 | 0.2888 |
| 10 | 2.78 | 14.72 | 650 | 223.83 | −11.14 | 0.2888 |
| 11 | 2.78 | 14.72 | 650 | 223.83 | −11.14 | 0.2888 |
| 12 | 2.78 | 25 | 1000 | 183.58 | −10.21 | 0.2301 |
| 13 | 5 | 25 | 650 | 195.75 | −4.49 | 0.143 |
| 14 | 2.78 | 25 | 300 | 198.27 | −12.1 | 0.136 |
| 15 | 2.78 | 14.72 | 650 | 223.83 | −11.19 | 0.2888 |
| 16 | 0.56 | 14.72 | 1000 | 189.7 | −11.05 | 0.3294 |
| 17 | 5 | 14.72 | 300 | 246.5 | −6.55 | 0.2609 |
| 18 | 5 | 14.72 | 1000 | 206.58 | −10.42 | 0.0162 |
| Intercept | A | B | C | AB | AC | BC | A2 | B2 | C2 | |
|---|---|---|---|---|---|---|---|---|---|---|
| R1 | 183.58 | 11.5762 | −18.8025 | −19.8263 | −8.7625 | 0.35 | 12.4825 | −6.35167 | −14.0742 | −8.3616 |
| 7 | ||||||||||
| p-Value s | <0.0001 | <0.0001 | <0.0001 | 0.0006 | 0.8337 | <0.0001 | 0.0034 | <0.0001 | 0.0006 | |
| R2 | −10.21 | 2.64625 | 0.0175 | 0.39375 | 3.97 | −2.3325 | 0.555 | |||
| p-Value s | <0.0001 | 0.1271 | <0.0001 | <0.0001 | <0.0001 | <0.0001 | ||||
| R3 | 0.2301 | −0.01447 | −0.02877 | 0.01977 | −0.00187 | −0.14217 | 0.02732 | −0.079737 | −0.020887 | −0.0560 |
| 5 | 5 | 5 | 5 | 5 | 5 | 5 | 5 | 875 | ||
| p-Values | <0.0001 | <0.0001 | <0.0001 | <0.0001 | <0.0001 | <0.0001 | <0.0001 | <0.0001 | <0.0001 |
3.3 Thermodynamic stability
Studies on the thermal stability, including centrifugation, the freeze–thaw cycle, and heating–cooling, showed that some NE formulations had phase separation and others were turbid (Table 4). The process of Ostwald ripening involves the diffusion of small droplets to form larger droplets or aggregates. This is a free-surface energy process, and may be the cause of this instability. More physical characterization was performed on the formulations that showed no signs of thermodynamic instability.| S mix | Batch no. | Turbidity | After 24 h turbidity. | Heating–cooling cycle | Centrifugation | Freeze thaw cycle |
|---|---|---|---|---|---|---|
| √: pass; x: fail; N: No. | ||||||
1![[thin space (1/6-em)]](https://www.rsc.org/images/entities/char_2009.gif) : :![[thin space (1/6-em)]](https://www.rsc.org/images/entities/char_2009.gif) 0 0 |
F1 (1![[thin space (1/6-em)]](https://www.rsc.org/images/entities/char_2009.gif) : :![[thin space (1/6-em)]](https://www.rsc.org/images/entities/char_2009.gif) 5) 5) |
N | N | x | — | — |
1![[thin space (1/6-em)]](https://www.rsc.org/images/entities/char_2009.gif) : :![[thin space (1/6-em)]](https://www.rsc.org/images/entities/char_2009.gif) 0 0 |
F2 (1![[thin space (1/6-em)]](https://www.rsc.org/images/entities/char_2009.gif) : :![[thin space (1/6-em)]](https://www.rsc.org/images/entities/char_2009.gif) 7) 7) |
N | N | √ | √ | √ |
1![[thin space (1/6-em)]](https://www.rsc.org/images/entities/char_2009.gif) : :![[thin space (1/6-em)]](https://www.rsc.org/images/entities/char_2009.gif) 0 0 |
F3 (1![[thin space (1/6-em)]](https://www.rsc.org/images/entities/char_2009.gif) : :![[thin space (1/6-em)]](https://www.rsc.org/images/entities/char_2009.gif) 9) 9) |
N | N | √ | √ | √ |
1![[thin space (1/6-em)]](https://www.rsc.org/images/entities/char_2009.gif) : :![[thin space (1/6-em)]](https://www.rsc.org/images/entities/char_2009.gif) 0 0 |
F4 (1![[thin space (1/6-em)]](https://www.rsc.org/images/entities/char_2009.gif) : :![[thin space (1/6-em)]](https://www.rsc.org/images/entities/char_2009.gif) 8) 8) |
N | N | √ | √ | √ |
1![[thin space (1/6-em)]](https://www.rsc.org/images/entities/char_2009.gif) : :![[thin space (1/6-em)]](https://www.rsc.org/images/entities/char_2009.gif) 0 0 |
F5 (1![[thin space (1/6-em)]](https://www.rsc.org/images/entities/char_2009.gif) : :![[thin space (1/6-em)]](https://www.rsc.org/images/entities/char_2009.gif) 9) 9) |
N | N | √ | √ | √ |
1![[thin space (1/6-em)]](https://www.rsc.org/images/entities/char_2009.gif) : :![[thin space (1/6-em)]](https://www.rsc.org/images/entities/char_2009.gif) 1 1 |
F6 (1![[thin space (1/6-em)]](https://www.rsc.org/images/entities/char_2009.gif) : :![[thin space (1/6-em)]](https://www.rsc.org/images/entities/char_2009.gif) 6) 6) |
N | N | √ | √ | √ |
1![[thin space (1/6-em)]](https://www.rsc.org/images/entities/char_2009.gif) : :![[thin space (1/6-em)]](https://www.rsc.org/images/entities/char_2009.gif) 1 1 |
F7 (1![[thin space (1/6-em)]](https://www.rsc.org/images/entities/char_2009.gif) : :![[thin space (1/6-em)]](https://www.rsc.org/images/entities/char_2009.gif) 7) 7) |
N | N | √ | √ | √ |
1![[thin space (1/6-em)]](https://www.rsc.org/images/entities/char_2009.gif) : :![[thin space (1/6-em)]](https://www.rsc.org/images/entities/char_2009.gif) 1 1 |
F8 (1![[thin space (1/6-em)]](https://www.rsc.org/images/entities/char_2009.gif) : :![[thin space (1/6-em)]](https://www.rsc.org/images/entities/char_2009.gif) 8) 8) |
N | N | √ | √ | √ |
1![[thin space (1/6-em)]](https://www.rsc.org/images/entities/char_2009.gif) : :![[thin space (1/6-em)]](https://www.rsc.org/images/entities/char_2009.gif) 1 1 |
F9 (1![[thin space (1/6-em)]](https://www.rsc.org/images/entities/char_2009.gif) : :![[thin space (1/6-em)]](https://www.rsc.org/images/entities/char_2009.gif) 9) 9) |
N | N | √ | √ | √ |
1![[thin space (1/6-em)]](https://www.rsc.org/images/entities/char_2009.gif) : :![[thin space (1/6-em)]](https://www.rsc.org/images/entities/char_2009.gif) 1 1 |
F10 (1![[thin space (1/6-em)]](https://www.rsc.org/images/entities/char_2009.gif) : :![[thin space (1/6-em)]](https://www.rsc.org/images/entities/char_2009.gif) 9) 9) |
N | N | √ | √ | √ |
2![[thin space (1/6-em)]](https://www.rsc.org/images/entities/char_2009.gif) : :![[thin space (1/6-em)]](https://www.rsc.org/images/entities/char_2009.gif) 1 1 |
F11 (1![[thin space (1/6-em)]](https://www.rsc.org/images/entities/char_2009.gif) : :![[thin space (1/6-em)]](https://www.rsc.org/images/entities/char_2009.gif) 6) 6) |
N | N | x | — | — |
2![[thin space (1/6-em)]](https://www.rsc.org/images/entities/char_2009.gif) : :![[thin space (1/6-em)]](https://www.rsc.org/images/entities/char_2009.gif) 1 1 |
F12 (1![[thin space (1/6-em)]](https://www.rsc.org/images/entities/char_2009.gif) : :![[thin space (1/6-em)]](https://www.rsc.org/images/entities/char_2009.gif) 7) 7) |
N | N | √ | √ | √ |
2![[thin space (1/6-em)]](https://www.rsc.org/images/entities/char_2009.gif) : :![[thin space (1/6-em)]](https://www.rsc.org/images/entities/char_2009.gif) 1 1 |
F 13 (1![[thin space (1/6-em)]](https://www.rsc.org/images/entities/char_2009.gif) : :![[thin space (1/6-em)]](https://www.rsc.org/images/entities/char_2009.gif) 8) 8) |
N | N | √ | √ | √ |
2![[thin space (1/6-em)]](https://www.rsc.org/images/entities/char_2009.gif) : :![[thin space (1/6-em)]](https://www.rsc.org/images/entities/char_2009.gif) 1 1 |
F 14 (1![[thin space (1/6-em)]](https://www.rsc.org/images/entities/char_2009.gif) : :![[thin space (1/6-em)]](https://www.rsc.org/images/entities/char_2009.gif) 9) 9) |
N | N | √ | √ | √ |
3![[thin space (1/6-em)]](https://www.rsc.org/images/entities/char_2009.gif) : :![[thin space (1/6-em)]](https://www.rsc.org/images/entities/char_2009.gif) 1 1 |
F15 (1![[thin space (1/6-em)]](https://www.rsc.org/images/entities/char_2009.gif) : :![[thin space (1/6-em)]](https://www.rsc.org/images/entities/char_2009.gif) 7) 7) |
N | N | √ | √ | √ |
3![[thin space (1/6-em)]](https://www.rsc.org/images/entities/char_2009.gif) : :![[thin space (1/6-em)]](https://www.rsc.org/images/entities/char_2009.gif) 1 1 |
F16 (1![[thin space (1/6-em)]](https://www.rsc.org/images/entities/char_2009.gif) : :![[thin space (1/6-em)]](https://www.rsc.org/images/entities/char_2009.gif) 8) 8) |
N | N | √ | √ | √ |
3![[thin space (1/6-em)]](https://www.rsc.org/images/entities/char_2009.gif) : :![[thin space (1/6-em)]](https://www.rsc.org/images/entities/char_2009.gif) 1 1 |
F17 (1![[thin space (1/6-em)]](https://www.rsc.org/images/entities/char_2009.gif) : :![[thin space (1/6-em)]](https://www.rsc.org/images/entities/char_2009.gif) 9) 9) |
N | N | √ | √ | √ |
4![[thin space (1/6-em)]](https://www.rsc.org/images/entities/char_2009.gif) : :![[thin space (1/6-em)]](https://www.rsc.org/images/entities/char_2009.gif) 1 1 |
F18 (1![[thin space (1/6-em)]](https://www.rsc.org/images/entities/char_2009.gif) : :![[thin space (1/6-em)]](https://www.rsc.org/images/entities/char_2009.gif) 8) 8) |
N | N | √ | √ | √ |
4![[thin space (1/6-em)]](https://www.rsc.org/images/entities/char_2009.gif) : :![[thin space (1/6-em)]](https://www.rsc.org/images/entities/char_2009.gif) 1 1 |
F19 (1![[thin space (1/6-em)]](https://www.rsc.org/images/entities/char_2009.gif) : :![[thin space (1/6-em)]](https://www.rsc.org/images/entities/char_2009.gif) 9) 9) |
N | N | √ | √ | √ |
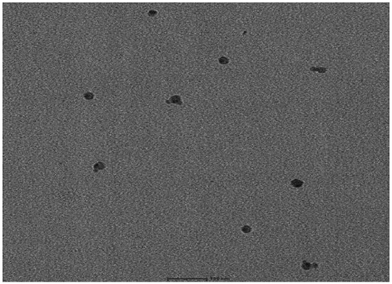
3.4 Characterization of the optimized NE
3.5 Preparation of oxaprozin loaded NEG
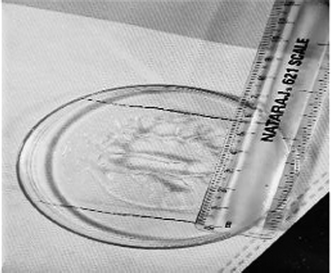
The best and most stable formulation was found to be a gel formulated with 1.5% w/v Carbopol in terms of appearance, texture, homogeneity, and spreadability. To the optimized gel formulation, 1% v/v glycerin was added as a humectant and 0.02% w/v methyl paraben as a preservative. It was also subjected to a variety of gel assessments and standards.3.6 Evaluation of NEG
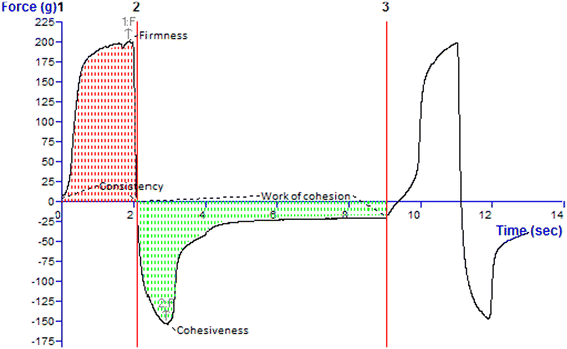
| Firmness (g) | Consistency (g s) | Cohesiveness (g) | Work of cohesion (g s−1) |
|---|---|---|---|
| 200.29 | 327.13 | −153.47 | −302.11 |
| Time scale | Nanoemulsion (NE) | Nanoemulgel (NEG) | ||||
|---|---|---|---|---|---|---|
| Particle size | PDI | Drug content | Appearance | pH | Drug content | |
| 1st week | 186.1 | 0.254 | 92.1 | White viscous creamy | 7.3 ± 0.05 | 92.1 |
| 2nd week | 189.3 | 0.269 | 92.1 | White viscous creamy | 7.5 ± 0.07 | 92.0 |
| 3rd week | 187.8 | 0.289 | 92.0 | White viscous creamy | 7.6 ± 0.09 | 92.0 |
| 4th week | 190.7 | 0.296 | 92.0 | White viscous creamy | 7.8 ± 0.1 | 91.9 |
3. Conclusions
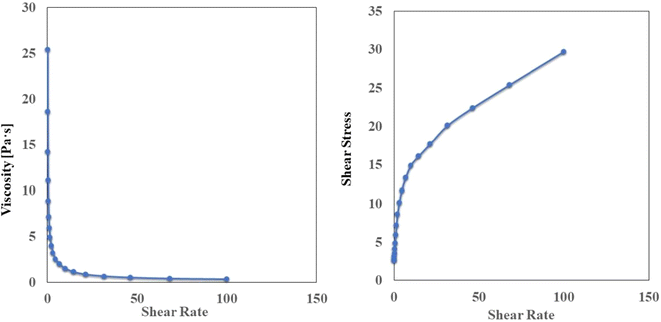
This research explored the formulation, characterization and evaluation of a nanoemulsion gel/nanoemulgel by aqueous titration method, employing the QbD optimization approach. Here, gaultheria oil is combined with oxaprozin to form a nanoemulgel for the management of osteoarthritis. The scientifically crafted nanoemulgel has a small vesicular size with good stability at 4 °C. It has a good drug content, in vitro release profile, bioadhesion and rheological properties with reduced skin irritancy. The formulation has a good permeation through the skin for effective delivery of active constituents, and can be established through a topical route. Hence, it is reasonable to assume that the optimised formulation has greater potential, and merits further study in preclinical and eventually clinical settings.Author contributions
Conceptualization, Ahsan Ali, Mohd. Aamir Mirza, and Zeenat Iqbal; methodology, Talha, Sradhanjali Mohapatra and Uzma Farooq; software, Ayesha Siddiqui and Ramsha Ansari; formal analysis, Mohd. Aamir Mirza, and Zeenat Iqbal; investigation, Talha, and Ahsan Ali; resources Mohd. Aamir Mirza, and Zeenat Iqbal; writing, Talha, and Sradhanjali Mohapatra; writing – review and editing, Sradhanjali Mohapatra and Pooja Jain; project administration, Mohd. Aamir Mirza, and Zeenat Iqbal. All authors have read and agreed to the published version of the manuscript.Institutional review board statement
The Institutional Animal Ethics Committee, Jamia Hamdard, New Delhi, India, approved protocol no. 1977 for Animal Studies (Registration No. 173/GO/Re/S/2000/CPCSEA, 21 December 2022).Conflicts of interest
The authors declare no conflict of interest.Acknowledgements
This research received no external funding. The authors are highly grateful to the Jamia Hamdard University, New Delhi, India for all its support.References
- R. Hamood, M. Tirosh, N. Fallach, G. Chodick, E. Eisenberg and O. Lubovsky, J. Clin. Med., 2021, 10, 1–11, DOI:10.3390/jcm10184282.
- S. Safiri, A. A. Kolahi, E. Smith, C. Hill, D. Bettampadi, M. A. Mansournia, D. Hoy, A. Ashrafi-Asgarabad, M. Sepidarkish, A. almasi-Hashiani, G. Collins, J. Kaufman, M. Qorbani, M. Moradi-Lakeh, A. D. Woolf, F. Guillemin, L. March and M. Cross, Ann. Rheum. Dis., 2020, 10, 1–10, DOI:10.1136/annrheumdis-2019-216515.
- K. Onishi, A. Utturkar, E. Chang, R. Panush, J. Hata and D. Perret-Karimi, Crit. Rev. Phys. Rehabil. Med., 2012, 24, 3–4, DOI:10.1615/critrevphysrehabilmed.2013007630.
- F. Zakir, S. Mohapatra, U. Farooq, M. A. Mirza and Z. Iqbal, Drug Delivery Systems for Metabolic Disorders, 2022, pp. 1–22 Search PubMed.
- A. Magni, P. Agostoni, C. Bonezzi, G. Massazza, P. Menè, V. Savarino and D. Fornasari, Pain Ther., 2021, 10, 783–808 CrossRef PubMed.
- L. A. Salman, G. Ahmed, S. G. Dakin, B. Kendrick and A. Price, Arthritis Res. Ther., 2023, 25, 1–27 CrossRef PubMed.
- R. L. Barkin, Am. J. Ther., 2015, 22, 388–407, DOI:10.1097/MJT.0b013e3182459abd.
- W. F. Kean, R. Kean and W. W. Buchanan, Inflammopharmacology, 2002, 10, 241–284 CrossRef CAS.
- A. Weaver, B. Rubin, J. Caldwell, F. G. McMahon, D. Lee, W. Makarowski, H. Offenberg, M. Sack, D. Sikes, R. Trapp, S. Rush, M. Kuss, J. Ganju and T. S. Bocanegra, Clin. Ther., 1995, 17, 735–745, DOI:10.1016/0149-2918(95)80050-6.
- V. Gupta, S. Mohapatra, H. Mishra, U. Farooq, K. Kumar, M. J. Ansari, M. F. Aldawsari, A. S. Alalaiwe, M. A. Mirza and Z. Iqbal, Gels, 2022, 8, 1–31 Search PubMed.
- M. R. Donthi, S. R. Munnangi, K. V. Krishna, R. N. Saha, G. Singhvi and S. K. Dubey, Pharmaceutics, 2023, 15, 1, DOI:10.3390/pharmaceutics15010164.
- G. C. Aithal, R. Narayan and U. Y. Nayak, Curr. Pharm. Des., 2020, 26, 279–291, DOI:10.2174/1381612826666191226100241.
- W. R. Liu, W. L. Qiao, Z. Z. Liu, X. H. Wang, R. Jiang, S. Y. Li, R. B. Shi and G. M. She, Molecules, 2013, 18, 10, DOI:10.3390/molecules181012071.
- M. Mukhopadhyay, P. Bantawa, T. K. Mondal and S. K. Nandi, Ind. Crops Prod., 2016, 81, 91–99, DOI:10.1016/j.indcrop.2015.11.042.
- M. Marrelli, V. Amodeo, M. R. Perri, F. Conforti and G. Statti, Plants, 2020, 9, 10, DOI:10.3390/plants9101252.
- A. Veseli, S. Žakelj and A. Kristl, Drug Dev. Ind. Pharm., 2019, 45, 1717–1724, DOI:10.1080/03639045.2019.1665062.
- M. Ganesh, B. Thangabalan, D. Thakur, K. Srinivasan, S. Ganguly and T. Sivakumar, Asian – J. Chem., 2008, 7, 5451–5454 Search PubMed.
- V. Bourganis, O. Kammona, A. Alexopoulos and C. Kiparissides, Eur. J. Pharm. Biopharm., 2018, 128, 337–362 CrossRef CAS PubMed.
- S. Baboota, A. Abdullah, G. Mustafa, J. K. Sahni and J. Ali, J. Excipients Food Chem., 2013, 4, 12–24 CAS.
- K. Jain, R. Suresh Kumar, S. Sood and K. Gowthamarajan, J. Pharm. Sci. Res., 2013, 5, 1–18 Search PubMed.
- A. Gull, S. Ahmed, F. J. Ahmad, U. Nagaich and A. Chandra, J. Drug Delivery Sci. Technol, 2020, 57, 1–11, DOI:10.1016/j.jddst.2020.101641.
- A. G. Khidhir and A. S. Hamadi, Adv. Chem. Eng. Sci., 2018, 08, 1–24, DOI:10.4236/aces.2018.83012.
- S. Beg, S. Swain, M. Rahman, M. S. Hasnain and S. S. Imam, in Pharmaceutical Quality by Design: Principles and Applications, 2019 Search PubMed.
- S. Beg, M. S. Hasnain, M. Rahman and S. Swain, in Pharmaceutical Quality by Design: Principles and Applications, 2019 Search PubMed.
- A. Azeem, M. Rizwan, F. J. Ahmad, Z. Iqbal, R. K. Khar, M. Aqil and S. Talegaonkar, AAPS PharmSciTech, 2009, 10, 69–76, DOI:10.1208/s12249-008-9178-x.
- M. S. Ali, M. S. Alam, N. Alam and M. R. Siddiqui, Iran. J. Pharm. Res., 2014, 13, 1125–1140 CAS.
- S. Al-Jawadi and S. S. Thakur, Int. J. Pharm., 2020, 585, 1–55, DOI:10.1016/j.ijpharm.2020.119559.
- F. Zakir, A. Ahmad, U. Farooq, M. A. Mirza, A. Tripathi, D. Singh, F. Shakeel, S. Mohapatra, F. J. Ahmad and K. Kohli, Nanomedicine, 2020, 1–21, DOI:10.2217/nnm-2020-0079.
- Z. I. Anam Choudhary, P. Jain, S. Mohapatra, G. Mustafa, M. J. Ansari, M. F. Aldawsari, A. S. Alalaiwe and M. A. Mirza, ACS Omega, 2022, 7, 15688–15694 CrossRef PubMed.
- U. Farooq, M. A. Mirza, A. Alshetaili, S. Mohapatra, P. Jain and N. Hassan, Nanoscale Adv., 2024, 6, 648–668, 10.1039/D3NA00943B.
- S. Mohapatra, M. A. Mirza, S. Ahmad, U. Farooq, M. J. Ansari, K. Kohli and Z. Iqbal, Pharmaceutics, 2023, 15, 1–25, DOI:10.3390/pharmaceutics15020465.
- R. Khan, M. A. Mirza, M. Aqil, N. Hassan, F. Zakir, M. J. Ansari and Z. Iqbal, Gels, 2023, 8, 1–24, DOI:10.3390/gels8110733.
- S. Ansari, M. A. I. Rashid, P. R. Waghmare and D. S. Nobes, SN Appl. Sci., 2020, 2, 1–15, DOI:10.1007/s42452-020-03561-w.
- M. Imran, M. K. Iqubal, K. Imtiyaz, S. Saleem, S. Mittal, M. M. A. Rizvi, J. Ali and S. Baboota, Int. J. Pharm., 2020, 1–17, DOI:10.1016/j.ijpharm.2020.119705.
- S. S. Sultana, P. Parveen, M. Sri Rekha, K. Deepthi, C. A. Sowjanya, D. Seetha and S. S. Sultana, Indo Am. J. Pharm. Res, 2017, 1–32, DOI:10.1016/j.xphs.2017.03.042.
- J. Luan, F. Zheng, X. Yang, A. Yu and G. Zhai, Colloids Surf., A, 2014, 1–27, DOI:10.1016/j.colsurfa.2014.11.015.
- C. S. Weil and R. A. Scala, Toxicol. Appl. Pharmacol., 1970, 19, 276–360, DOI:10.1016/0041-008X(71)90112-8.
- Jyotshna, A. Chand Gupta, D. U. Bawankule, A. K. Verma and K. Shanker, J. Drug Delivery Sci. Technol., 2020, 57, 1–9, DOI:10.1016/j.jddst.2020.101734.
- C. Thapa, A. Ahad, M. Aqil, S. S. Imam and Y. Sultana, J. Drug Delivery Sci. Technol., 2018, 4–35, DOI:10.1016/j.jddst.2018.02.003.
- D. Patel, M. Patel, T. Soni and B. Suhagia, J. Drug Delivery Sci. Technol, 2021, 61, 1–15, DOI:10.1016/j.jddst.2021.102329.
- P. Suresh, M. M. Salem-Bekhit, H. P. Veedu, S. Alshehri, S. C. Nair, S. I. Bukhari, V. Viswanad, E. I. Taha, R. K. Sahu, M. M. Ghoneim and I. Elbagory, Nanomaterials, 2022, 12, 1–16, DOI:10.3390/nano12081299.
- Z. Naz and F. J. Ahmad, Int. J. Nanomed., 2015, 1–15, DOI:10.2147/IJN.S82788.
- M. S. Khan, S. Mohapatra, V. Gupta, A. Ali, P. P. Naseef, M. S. Kurunian, A. A. F. Alshadidi, M. S. Alam, M. A. Mirza and Z. Iqbal, Membranes, 2023, 13, 1–30, DOI:10.3390/membranes13030343.
Footnote |
| † Authors share equal contribution. |
| This journal is © The Royal Society of Chemistry 2024 |

