 Open Access Article
Creative Commons Attribution 3.0 Unported Licence
Cell-resistant wavelength-shifting molecular beacons made of L-DNA and a clickable L-configured uridine†
Fabian
Lang
,
Franziska
Rönicke
and
Hans-Achim
Wagenknecht
 *
*
Institute of Organic Chemistry, Karlsruhe Institute of Technology (KIT), Fritz-Haber-Weg 6, 76131 Karlsruhe, Germany. E-mail: Wagenknecht@kit.edu
First published on 14th May 2024
Abstract
Wavelength-shifting molecular beacons were prepared from L-DNA. The clickable anchor for the two dyes, Cy3 and Cy5, was 2′-O-propargyl-L-uridine and was synthesized from L-ribose. Four clickable molecular beacons were prepared and double-modified with the azide dyes by a combination of click chemistry on a solid support for Cy3 during DNA synthesis and postsynthetic click chemistry for Cy5 in solution. Cy3 and Cy5 successfully formed a FRET pair in the beacons, and the closed form (red fluorescence) and the open form (green fluorescence) can be distinguished by the two-color fluorescence readout. Two molecular beacons were identified to show the greatest fluorescence contrast in temperature-dependent fluorescence measurements. The stability of the L-configured molecular beacons was demonstrated after several heating and cooling cycles as well as in the cell lysate. In comparison, D-configured molecular beacons showed a rapid decrease of fluorescence contrast in the cell lysate, which is caused by the opening of the beacons, probably due to degradation. This was confirmed in cell experiments using confocal microscopy. The L-configured molecular beacons are potential intracellular thermometers for future applications.
Introduction
A molecular beacon (MB) is a DNA architecture consisting of a stem region carrying the labels for readout and a loop region that is complementary to a part of the genetic sequence to be detected. For the readout, a fluorophore is combined with a non-fluorescent quencher, both as 3′-/5′-terminally attached labels.1,2 Advanced constructs include quencher-free molecular beacons,3 low-noise-stemless PNA molecular beacons,4 wavelength-shifting molecular beacons,5,6 and molecular beacons with an excimer readout.7 Besides the detection or imaging of genetic information, the use of molecular beacons as intracellular thermometers is a promising task.Temperature is an important parameter in living organisms and a change in temperature is often associated with diseases,8,9 such as cancer, local infections, febrile seizures or malignant hyperthermia.10–13 Monitoring temperature at the cellular level is important for therapies.14 An ideal intracellular thermometer must meet several requirements: (i) it should not be toxic to the cell. (ii) The readout should not be influenced by the cellular environment. (iii) Spatial and temperature resolution, reversibility, and a rapid response are advantageous.15 As first examples of cellular thermometers, Chapman et al. incorporated specially designed fluorophores into the membrane of living cells.16 Uchiyama et al. developed polymer-based thermometers with fluorophores.17 The use of thermosensitive polymers in cells was published by Tseeb et al. in 2009.18 Okabe et al. used fluorescence lifetime imaging microscopy (FLIM) in combination with a fluorescent polymer.19 There were other attempts based on quantum dots, lanthanide complexes or gold nanoparticles.9,20–26
The use of L-DNA provides resistance to the cellular environment.15L-DNA is not cytotoxic, cannot specifically bind to proteins or D-DNA strands, and is not degraded by enzymes.27–29 Molecular beacons with fluorophore–quencher combinations can display temperature changes only by an increase in fluorescence intensity, which is susceptible to false results due to other sources of fluorescence quenching. We present here how wavelength-shifting molecular beacons using Förster resonance energy transfer (FRET) can be combined with L-DNA to generate potential cellular thermometers (Fig. 1). Moreover, to simplify the synthesis we synthesized the clickable L-configured uridine 1 as a DNA building block to postsynthetically attach fluorophores by copper(I)-catalyzed azide–alkyne cycloaddition (CuAAC) to the DNA probes. This offers flexibility for positioning and choice of fluorophores.
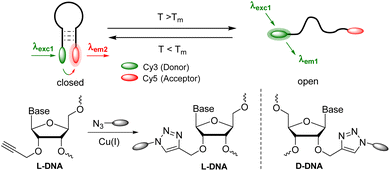 | ||
| Fig. 1 Concept of wavelength-shifting molecular beacons made of L- or D-DNA, with an L- or D-configured clickable anchor for the chromophores. | ||
Results and discussion
Synthesis of the clickable L-configured 2′-deoxyuridine building block and the L-DNA molecular beacons
2′-O-Propargyl-L-uridine (1) was synthesized from L-ribose and incorporated as phosphoramidite 2 into L-configured molecular beacons using automated solid-phase synthesis (Fig. 2). L-Uridine (3) was synthesized according to the literature.30 The synthesis of 1 was developed based on our procedure for the D-configured 2′-O-propargyl-uridine derivatives.31 The 3′- and 5′-hydroxy groups of L-uridine (3) were selectively protected by 1,3-dichloro-1,1,3,3-tetraisopropyldisiloxane (Markiewicz reagent). The alkyne group was then attached to the 2′-position of 4 using propargyl bromide. It was important to reduce the reaction temperature to −10 °C and to add the sodium hydride in portions to prevent cleavage of the uracil and thus decomposition of 4. The use of sodium hydride allowed to dispense with the expensive phosphazene base BEMP and the additional pivaloyloxymethyl protecting group at the imide nitrogen.32 The Markiewicz protecting group of 5 was cleaved off with 1 M tetrabutylammonium fluoride solution in THF to give 1 in quantitative yield. To complete the building block for automated solid-phase DNA synthesis, the 5′-hydroxy group of 1 was selectively protected with 4,4-dimethoxytrityl chloride in pyridine and the resulting intermediate 6 was reacted with 2-cyanoethyl-N,N-diisopropylchloro-phosphoramidite and diisopropylethylamine (DIPEA). The phosphoramidite 2 was obtained starting from L-uridine 3 with an overall yield of 29%.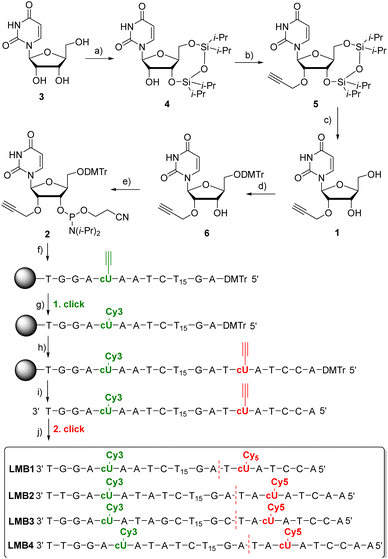 | ||
Fig. 2 Synthesis of 1 and 2 and the sequences of LMB1–LMB4. (a) TIPDSiCl2, pyridine, 2 h, 0 °C then r.t., o.n., 80%; (b) 1. NaH, THF, −10 °C, 15 min; 2. propargyl bromide, r.t., o.n., 54%; (c) 1 M TBAF/THF, THF, r.t., 5 min, quant.; (d) DMTr-Cl, pyridine, r.t., o.n., 80%; (e) 2-cyanoethyl-N,N-diisopropylchlorophosphoramidite, (iPr)2NEt, CH2Cl2, r.t., 3 h, 85%; (f) automated DNA synthesis on the solid phase (CPG), (g) Cy3-azide, (CH3CN)4Cu(PF6), sodium ascorbate, DMSO![[thin space (1/6-em)]](https://www.rsc.org/images/entities/char_2009.gif) : :![[thin space (1/6-em)]](https://www.rsc.org/images/entities/char_2009.gif) tBuOH tBuOH![[thin space (1/6-em)]](https://www.rsc.org/images/entities/char_2009.gif) : :![[thin space (1/6-em)]](https://www.rsc.org/images/entities/char_2009.gif) MeCN, 60 °C, 2 h; (h) automated DNA synthesis on the solid phase (CPG); (i) NH4OH, H2O, 55 °C, o.n.; (j) TBTA, (CH3CN)4Cu(PF6), sodium ascorbate, DMSO MeCN, 60 °C, 2 h; (h) automated DNA synthesis on the solid phase (CPG); (i) NH4OH, H2O, 55 °C, o.n.; (j) TBTA, (CH3CN)4Cu(PF6), sodium ascorbate, DMSO![[thin space (1/6-em)]](https://www.rsc.org/images/entities/char_2009.gif) : :![[thin space (1/6-em)]](https://www.rsc.org/images/entities/char_2009.gif) tBuOH tBuOH![[thin space (1/6-em)]](https://www.rsc.org/images/entities/char_2009.gif) : :![[thin space (1/6-em)]](https://www.rsc.org/images/entities/char_2009.gif) MeCN, 60 °C, 2 h. For details see the ESI (Fig. S1–S20).† The D-configured molecular beacons DMB1 and DMB4 have sequences identical to those of LMB1 and LMB4, respectively, but are made completely of D-configured nucleotides. MeCN, 60 °C, 2 h. For details see the ESI (Fig. S1–S20).† The D-configured molecular beacons DMB1 and DMB4 have sequences identical to those of LMB1 and LMB4, respectively, but are made completely of D-configured nucleotides. | ||
The synthesis of the molecular beacons LMB1–LMB4 (Fig. 2) and the incorporation of phosphoramidite 1 were carried out using automated solid phase synthesis (Table S1†). For the loop region, a section of 15 L-thymidines was chosen. The sequences and the lengths (7–9 nt) of the stem region were chosen so that melting temperatures (Tm) in the range of 40–50 °C were obtained. The cyanine dyes Cy3 and Cy5 were chosen as fluorophores. They are well-established as a FRET pair. More importantly, Cy3 is also stable under UltraFast cleavage conditions,33 a prerequisite to perform the first click modification by CuAAC on the solid phase. Together with the second CuAAC after cleavage from the solid phase, this enables the specific double dye modification by click chemistry. The synthesis of the oligonucleotides was carried out in two steps. First, the automated synthesis was carried out including the first incorporation site for 5 and up to the base before the second incorporation site for 5. The CPG column was removed from the DNA synthesizer and dried. The first click reaction was performed on the solid phase with the commercially available Cy3-azide. The CPG column was rinsed and reinserted into the DNA synthesizer, and the synthesis was completed including the second incorporation site for 5. After subsequent cleavage of the synthesized L-DNA from the solid phase, the second click reaction with the commercially available Cy5-azide was carried out post-synthetically. Finally, the double-modified L-configured oligonucleotide was purified using semi-preparative reversed-phase HPLC (Fig. S21–S25†), identified by MALDI-TOF mass spectrometry (Table S3†) and quantified by UV/Vis absorption (Table S2†). For comparison, the D-configured molecular beacons DMB1 and DMB4 were also representatively synthesized. Their sequences were identical to those of LMB1 and LMB4, respectively.
Fluorescence readout in vitro
The molecular beacons were characterized by UV/Vis absorption spectroscopy (Fig. S27†). The characteristic bands of Cy3 with the maximum at 552 nm as well as those of Cy5 with the maximum at 647 nm are clearly recognizable in the UV/Vis absorption spectra of LMB1–LMB4 with only minor variations in the extinction. The melting temperatures of LMB1–LMB4 were determined. LMB2 has the lowest melting temperature (Tm = 42 °C), although its stem has one base pair more than that of LMB1 (Tm = 43 °C) indicating that the exchange of an AT pair with a GC pair stabilizes the stem region more than the extension by one AT pair. This is also supported by LMB3, which shows the highest value (Tm = 54 °C), because two AT pairs were exchanged by two GC pairs. LMB4 with the longest stem has a rather low melting temperature (Tm = 49 °C), 5 °C below that of LMB3. The two D-configured molecular beacons DMB1 and DMB4 show the same melting temperatures (Tm = 43 °C and Tm = 49 °C) as LMB1 and LMB4, respectively. The melting temperatures are therefore in the defined range of 40–50 °C and the greatest change in emission of the molecular beacons should be expected therein.The distance between the Cy3 and Cy5 dyes in the stems of the molecular beacons is close and clearly below the Förster radius (R0 = 5.4 nm), and we can assume that the FRET efficiency is high. The energy transfer between the two dyes in the molecular beacons is influenced by (i) the relative orientation of the dyes, as described by the factor κ in the Förster equation, (ii) the interactions of the dyes with the DNA base pairs in the stem, and (iii) the interactions between the dyes. The theoretical prediction of this complex mixture of interactions is rather difficult as we showed for similar dye architectures in siRNA.34 The empirical approach is necessary with different stem lengths and base pair compositions. The emission of LMB1–LMB4 was recorded in the temperature range of 20–70 °C in order to investigate the fluorescence readout based on the FRET between the Cy3 and the Cy5 dyes (Fig. S28 and S29†). The excitation wavelength λexc of 518 nm was chosen, which lies in the shoulder of the Cy3 absorption but clearly outside the Cy5 absorption to avoid direct excitation of the acceptor dye. At the starting temperature of 20 °C, the fluorescence of the acceptor dye Cy5 at λem = 668 nm is the highest and decreases with increasing temperature. The fluorescence of the donor dye Cy3 at λem = 565 nm also decreases with increasing temperature. Both decreases are primarily due to the conventional thermal dependence of fluorescence. This is typical for nearly all dyes because higher temperatures facilitate non-radiative decay pathways from the excited state, such as internal conversion. This temperature-dependent fluorescence quenching is stronger in the case of Cy5 than for Cy3, because the Cy5 dye bears a longer oligomethine bridge between the two aromatic parts, which gives the Cy5 dye more conformational degrees of freedom for allowing internal conversion. To obtain the fluorescence readout through the opening of the molecular beacons, the ratios R of the intensity IA668 and ID565, R = IA668/ID565, were plotted against temperature (Fig. 3). All four plots show the expected sigmoidal behavior with transition points fitting to the determined melting temperatures of the molecular beacons. In the closed state at 20 °C, LMB1 and LMB4 show the highest intensity ratio with R ≈ 5. The R values of LMB2 and LMB3 are lower indicating that these molecular beacons are not preferred. In the open state at 70 °C, the fluorescence contrast of LMB2–LMB4 is decreased to a quite similar level of R ≈ 1.2, and only LMB1 shows a higher value of R ≈ 1.8. Taken together, LMB4 combines the optimal properties and is the optimal candidate in this small library, followed by LMB1.
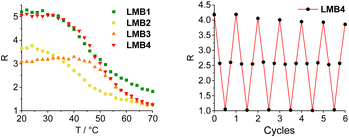 | ||
| Fig. 3 Temperature-dependent fluorescence intensity ratio R = IA668/ID565 of the molecular beacons LMB1 and LMB4 (left, 2.5 μM in 10 mM Na–Pi buffer, 250 mM NaCl, pH 7, λexc = 518 nm), and R observed during 6 cycles of heating and cooling of LMB1 (Fig. S30†) and LMB4 (right). | ||
Stability measurements were carried out with LMB1 (Fig. S30†) and LMB4 (Fig. 3) by repeated heating and cooling. For this purpose, the emission was recorded at 20, 50, 80 and again at 50 °C over six cycles. R was then calculated and plotted against the number of cycles. While R remains almost constant at 80 °C and 50 °C even after several cycles, only a slight decrease in R of 8–9% can be seen at 20 °C in the closed state. However, it is evident that the L-configured molecular beacons can be used several times in potential applications as intracellular thermometers. R was also determined for DMB1 and DMB4 and plotted against temperature (Fig. S31†). In the closed state at 70 °C, the values are significantly higher than those of LMB1 and LMB4. This is probably due the different interactions of the dyes with the dsDNA depending on the configuration of the anchor. In the open state at 70 °C, R values of DMB1 and DMB4 decrease to similar values to those of the L-configured molecular beacons.
Fluorescence readout in the cellular environment
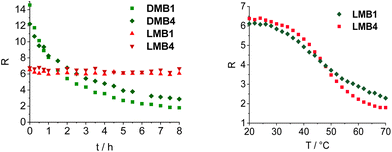
To validate the resistance of the molecular beacons in the cellular environment, the fluorescence intensity of DMB1, DMB4, LMB1 and LMB4 was recorded in the cell lysate from HeLa cells over 480 min at 37 °C (Fig. 4, S32 and S33†). The D-configured molecular beacons DMB1 and DMB4 show a strong decrease in the fluorescence of Cy5, whereas the emission of Cy3 increases with time. As a result, the R shows a large decrease over time. This indicates that they are opened in the cell lysate due to their degradation, probably by nucleases. In contrast, LMB1 and LMB4 show almost no change in emission over the entire period, and accordingly RFRET does not significantly change. This evidences that the L-configured molecular beacons remain closed and that they are resistant to cellular degradation and are not opened unspecifically. Additional fluorescence measurements of LMB1 and LMB4 were carried out to validate that the temperature-dependent opening is not influenced by the cellular components in the lysate (Fig. S34†). The sigmoidal shape of the temperature-dependent R curve (Fig. 4) is very similar to the results of measurements in pure buffer solutions, which supports that these L-configured molecular beacons are potential intracellular thermometers. Overall, the R values are higher in the cell lysate than in the buffer solution which is probably due to the changed ionic strength by the environment of cellular components.To validate the resistance of the molecular beacons in live cells, HeLa cells were transfected with LMB1/DMB1 (Fig. 5 and S35†) and LMB4/DMB4 (Fig. S36†). Lipofectamine was used as a reagent for the transfection of 100 ng of the molecular beacons into HeLa cells. Under these conditions, the published MTT assay evidences that the L-configured molecular beacons are not cytotoxic.15 The cells were then incubated at 37 °C and images of the cells were taken every hour by confocal microscopy. In order to visualize the same area for each image, the position of the detector was saved the first time and then automatically scanned. Selective excitation of the donor dye Cy3 was carried out at λexc = 488 nm and detection channels were set to λem = 545–585 nm for the donor dye Cy3 and to λem = 650–690 nm for the acceptor dye Cy5. The cell images allow the following qualitative discussion. Immediately after addition, both molecular beacons, LMB1 and DMB1, primarily show diffuse green emission, while hardly any red emission is visible. The fluorescence is mainly visible at the cell edges, which means that the molecular beacons are probably still in the liposomes of the transfection reagent. After 2 h, the first clear fluorescence signals within the cells increase in both samples, which indicates successful transfection. For DMB1, clear fluorescence signals are visible within three cell nuclei. After 3 h, the red fluorescence of DMB1 gets reduced. This is also evident in the overlay, in which primarily green fluorescence signals are recognizable, indicating that the molecular beacons have already been opened. With LMB1, on the other hand, the red emission is not only persistent, but also increasingly visible in the cell nuclei resulting in a more orange fluorescence readout in the overlay. After 6 h, the fluorescence signals from DMB1 appear to be more widely distributed in the cells and the green emission predominates. As expected from the fluorescence measurements in the cell lysate, DMB1 is opened by interaction with cell components or by degradation. In contrast, LMB1 continues to show a clear red emission and appears to be increasingly transported into the cell nuclei. Furthermore, an increase in dead cells can be seen with DMB1 over the course of the imaging, while there are fewer dead cells with LMB1. The cell experiments with DMB4 and LMB4 gave a similar result (Fig. S36†). As with DMB1, a decrease in red emission can be seen in DMB4 after just 3 h, which indicates that the molecular beacons are already opened. The primary green fluorescence signals with DMB4 become increasingly diffuse after 6 h and are distributed throughout the cells, while the number of dead cells is also increased. Dead cells are also visible with LMB4 compared to LMB1. However, LMB4 also shows more successfully transfected samples with a clear fluorescence signal in the cell nuclei. Taken together, these results obtained thus confirm the stability of LMBs in the cellular environment.
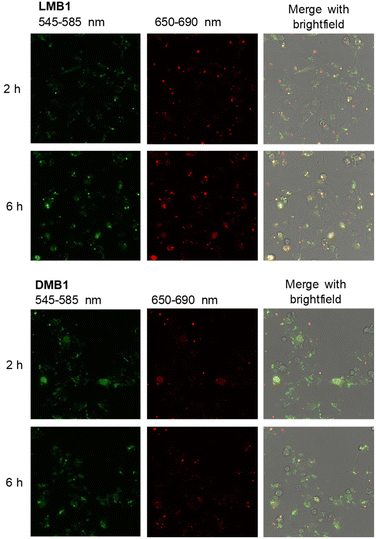 | ||
| Fig. 5 Confocal microscopy images 2 h and 6 h after transfection of HeLa cells with LMB1 (100 ng, top) and DMB1 (100 ng, bottom) in the presence of lipofectamine (λexc = 488 nm). For the other time points see Fig. S35,† for the cell experiments of DMB4 and LMB4 see Fig. S36.† | ||
Conclusions
2′-O-Propargyl-L-uridine (1) was successfully synthesized from L-ribose and incorporated as phosphoramidite 2 into clickable molecular beacons with an L-DNA configuration using automated solid phase synthesis. To yield wavelength-shifting molecular beacons, the oligonucleotides were successfully double-modified with azide dyes by a combination of click chemistry on a solid support for Cy3 during DNA synthesis and postsynthetic click chemistry for Cy5 in solution. Cy3 and Cy5 successfully form a FRET pair in the beacons, and the closed form and the open form can be distinguished by the two-color fluorescence readout. LMB1 and LMB4 showed the greatest fluorescence contrast in temperature-dependent measurements. The stability of the L-configured molecular beacons was demonstrated after several heating and cooling cycles as well as in the cell lysate. In comparison, D-configured molecular beacons showed a rapid decrease of the FRET-induced fluorescence in the cell lysate, which is caused by the opening of the beacons, probably due to degradation. This was confirmed in cell experiments using confocal microscopy. In LMB1 and LMB4, clear fluorescence of the acceptor dye Cy5 was visible for several hours, whereas DMB1 and DMB4 showed primarily the fluorescence of the donor dye Cy3 after a short time. LMB1 and LMB4 are potential intracellular thermometers in future applications. They combine flexible click chemistry for their preparation, a two-color fluorescence readout and resistance against degradation in the cellular environment. A significant color change of the fluorescence readout of LMB1 and LMB4 occurs between 40 °C and 50 °C, a temperature range that is specifically useful for hyperthermal treatment of cancer.Author contributions
FL prepared the molecular beacons and performed the cell experiments. FR imaged the cells by confocal microscopy. HAW supervised the research and wrote the manuscript.Conflicts of interest
There are no conflicts to declare.Acknowledgements
Financial support from the Deutsche Forschungsgemeinschaft (GRK 2039/2) and KIT is gratefully acknowledged.References
- S. Tyagi and F. R. Kramer, Nat. Biotechnol., 1996, 14, 303–308 CrossRef CAS PubMed.
- X. H. Fang, J. J. Li and W. H. Tan, Anal. Chem., 2000, 72, 3280–3285 CrossRef CAS PubMed.
- G. T. Hwang, Y. J. Seo and B. H. Kim, J. Am. Chem. Soc., 2004, 126, 6528–6529 CrossRef CAS PubMed.
- E. Socher, L. Bethge, A. Knoll, N. Jungnick, A. Herrmann and O. Seitz, Angew. Chem., Int. Ed., 2008, 47, 9555–9559 CrossRef CAS PubMed.
- P. Zhang, T. Beck and W. Tan, Angew. Chem., Int. Ed., 2001, 40, 402–405 CrossRef CAS PubMed.
- S. Tyagi, S. A. E. Marras and F. R. Kramer, Nat. Biotechnol., 2000, 18, 1191–1196 CrossRef CAS PubMed.
- P. Conlon, C. J. Yang, Y. Wu, Y. Chen, K. Martinez, Y. Kim, N. Stevens, A. A. Marti, S. Jockusch, N. J. Turro and W. Tan, J. Am. Chem. Soc., 2008, 130, 336–342 CrossRef CAS PubMed.
- K. Okabe, R. Sakaguchi, B. Shi and S. Kiyonaka, Pflügers Arch. – Eur. J. Physiol., 2018, 470, 717–731 CrossRef CAS PubMed.
- M. M. Ogle, A. D. Smith McWilliams, B. Jiang and A. A. Martí, ChemPhotoChem, 2020, 4, 255–270 CrossRef CAS.
- M. Karnebogen, D. Singer, M. Kallerhoff and R. H. Ringert, Thermochim. Acta, 1993, 229, 147–155 CrossRef.
- N. G. Waterman, L. Goldberg and T. Appel, Am. J. Surg., 1969, 118, 31–35 CrossRef CAS PubMed.
- I. S. Singh and J. D. Hasday, Int. J. Hyperthermia, 2013, 29, 423–435 CrossRef CAS PubMed.
- H. Rosenberg, N. Pollock, A. Schiemann, T. Bulger and K. Stowell, Orphanet J. Rare Dis., 2015, 10, 93 CrossRef PubMed.
- S. Lal, S. E. Clare and N. J. Halas, Acc. Chem. Res., 2008, 41, 1842–1851 CrossRef CAS PubMed.
- G. Ke, C. Wang, Y. Ge, N. Zheng, Z. Zhu and C. J. Yang, J. Am. Chem. Soc., 2012, 134, 18908–18911 CrossRef CAS PubMed.
- C. F. Chapman, Y. Liu, G. J. Sonek and B. J. Tromberg, Photochem. Photobiol., 1995, 62, 416–425 CrossRef CAS PubMed.
- S. Uchiyama, Y. Matsumura, A. P. de Silva and K. Iwai, Anal. Chem., 2003, 75, 5926–5935 CrossRef CAS PubMed.
- V. Tseeb, M. Suzuki, K. Oyama, K. Iwai and S. I. Ishiwata, HFSP J., 2009, 3, 117–123 CrossRef CAS PubMed.
- K. Okabe, N. Inada, C. Gota, Y. Harada, T. Funatsu and S. Uchiyama, Nat. Commun., 2012, 3, 705 CrossRef PubMed.
- C. D. S. Brites, P. P. Lima, N. J. O. Silva, A. Millán, V. S. Amaral, F. Palacio and L. D. Carlos, Nanoscale, 2012, 4, 4799–4829 RSC.
- T. Qin, B. Liu, K. Zhu, Z. Luo, Y. Huang, C. Pan and L. Wang, Trends Anal. Chem., 2018, 102, 259–271 CrossRef CAS.
- M. Nakano and T. Nagai, J. Photochem. Photobiol., C, 2017, 30, 2–9 CrossRef CAS.
- S. Ebrahimi, Y. Akhlaghi, M. Kompany-Zareh and Å. Rinnan, ACS Nano, 2014, 8, 10372–10382 CrossRef CAS PubMed.
- D. Gareau, A. Desrosiers and A. Vallée-Bélisle, Nano Lett., 2016, 16, 3976–3981 CrossRef CAS PubMed.
- T. Barilero, T. Le Saux, C. Gosse and L. Jullien, Anal. Chem., 2009, 81, 7988–8000 CrossRef CAS PubMed.
- A. T. Jonstrup, J. Fredsøe and A. H. Andersen, Sensors, 2013, 13, 5937–5944 CrossRef CAS PubMed.
- H. Urata, K. Shinohara, E. Ogura, Y. Ueda and M. Akagi, J. Am. Chem. Soc., 1991, 113, 8174–8175 CrossRef CAS.
- K. P. Williams, X.-H. Liu, T. N. M. Schumacher, H. Y. Lin, D. A. Ausiello, P. S. Kim and D. P. Bartel, Proc. Natl. Acad. Sci. U. S. A., 1997, 94, 11285–11290 CrossRef CAS PubMed.
- Y. Kim, C. J. Yang and W. Tan, Nucleic Acids Res., 2007, 35, 7279–7287 CrossRef CAS PubMed.
- E. Moyroud and P. Strazewski, Tetrahedron, 1999, 55, 1277–1284 CrossRef CAS.
- H.-K. Walter, B. Olshausen, U. Schepers and H.-A. Wagenknecht, Beilstein J. Org. Chem., 2017, 13, 127–137 CrossRef CAS PubMed.
- M. Grøtli, M. Douglas, R. Eritja and B. S. Sproat, Tetrahedron, 1998, 54, 5899–5914 CrossRef.
- J. C. Schulhof, D. Molko and R. Teoule, Nucleic Acids Res., 1987, 15, 397–416 CrossRef CAS PubMed.
- J. Steinmeyer, H.-K. Walter, M. Bichelberger, V. Schneider, T. Kubar, F. Rönicke, B. Olshausen, K. Nienhaus, G. U. Nienhaus, U. Schepers, M. Elstner and H.-A. Wagenknecht, Org. Biomol. Chem., 2018, 16, 3726–3731 RSC.
Footnote |
| † Electronic supplementary information (ESI) available: Synthesis of 1 and 2, preparation of molecular beacons, additional spectroscopy results, cell images, and images of NMR spectra and MS analyses. See DOI: https://doi.org/10.1039/d4ob00692e |
| This journal is © The Royal Society of Chemistry 2024 |

