
 Open Access Article
 This Open Access Article is licensed under a Creative Commons Attribution-Non Commercial 3.0 Unported Licence
Exploring the self-assembly dynamics of novel steroid–coumarin conjugates: a comprehensive spectroscopic and solid-state investigation†
Claudia M.
Ramírez-Lozano
 a,
Ma. Eugenia
Ochoa
a,
Pablo
Labra-Vázquez
b,
Arturo
Jiménez-Sánchez
c,
Norberto
Farfán
d and
Rosa
Santillan
*a
a,
Ma. Eugenia
Ochoa
a,
Pablo
Labra-Vázquez
b,
Arturo
Jiménez-Sánchez
c,
Norberto
Farfán
d and
Rosa
Santillan
*a
aDepartamento de Química, Centro de Investigación y de Estudios Avanzados del IPN, Apdo. Postal 14-740, 07000, Mexico. E-mail: rsantill@cinvestav.mx
bCIRIMAT, Université de Toulouse, CNRS, Université Toulouse 3 – Paul Sabatier, 118 Route de Narbonne, 31062, Toulouse, Cedex 9, France
cInstituto de Química, Universidad Nacional Autónoma de México, Circuito Exterior, Ciudad Universitaria, Coyoacán, Ciudad de México 04510, Mexico
dFacultad de Química, Departamento de Química Orgánica, Universidad Nacional Autónoma de México, 04510 CDMX, Mexico
First published on 27th March 2024
Abstract
The design, synthesis, and characterization of seven novel steroid–coumarin conjugates with diverse steroidal nuclei as lipophilic fluorescent materials for bioimaging applications are presented. The conjugates were synthesized through amidation, characterized using spectroscopic and spectrometric methods, and their main photophysical properties were determined. Dioxane![[thin space (1/6-em)]](https://www.rsc.org/images/entities/char_2009.gif) :water titration experiments revealed their ability to self-assemble, forming J-aggregates as evidenced by new spectral bands at higher wavelengths. Monocrystal X-ray diffraction analysis disclosed distinctive aggregation patterns exhibiting J- or H-aggregates for selected compounds. Bioimaging studies demonstrated cell membrane localization for most conjugates, with some of them displaying an interesting selectivity for lipid droplets. Notably, the presence of the steroid fragments significantly influenced both the self-assembly patterns and the cellular localization of the fluorescent probes.
:water titration experiments revealed their ability to self-assemble, forming J-aggregates as evidenced by new spectral bands at higher wavelengths. Monocrystal X-ray diffraction analysis disclosed distinctive aggregation patterns exhibiting J- or H-aggregates for selected compounds. Bioimaging studies demonstrated cell membrane localization for most conjugates, with some of them displaying an interesting selectivity for lipid droplets. Notably, the presence of the steroid fragments significantly influenced both the self-assembly patterns and the cellular localization of the fluorescent probes.
Introduction
In nature, molecular assembly plays an important role because a variety of chemical and biological processes occurs in organized structures.1 In an assembly, molecules are arranged neatly to form aggregates spontaneously, usually this process occurs through non-covalent interactions.2 This phenomenon could potentially impact the photophysical, photochemical, and biological characteristics of molecules exhibiting it.3Fluorophores demonstrating robust emission typically possess a structurally rigid, planar, and extensively conjugated architecture that promotes their exceptional photophysical properties. In aqueous media and, due to their aromatic nature, fluorophores may exhibit aggregation through π–π interactions; this can lead to two different effects on fluorescence. The first possibility is that a material presents a weak fluorescence emission or simply does not emit when it forms aggregates, the so-called aggregation-caused quenching (ACQ).4 In the second case, the formation of aggregates in solution leads to an improvement in the emission of fluorescence, a phenomenon known as aggregation-induced emission (AIE).5,6 In recent decades, molecules exhibiting AIE properties have attracted interest owing to their potential applications as fluorescent chemosensors,7 organic light-emitting diodes (OLEDs),8 metal ion sensors,9 materials for biological imaging,10 and building blocks for self-assembled structures.11,12
In this context, coumarins stand out as one of the most widely employed fluorophores for probe applications. These compounds are appealing due to their tunable emission wavelengths in the visible range through minor structural adjustments. Furthermore, they typically exhibit adaptable quantum yields, hydrophobicity, extended fluorescent lifetimes, photostability, and often a remarkable sensitivity to the polarity of the microenvironment.13–19
Several groups have explored the aggregation patterns of coumarins to understand the influence of different parameters on their self-assembly.20–26 These investigations have shown that the choice of solvent is paramount since 7-aminocoumarin derivatives tend to exhibit a bathochromically-shifted band that suggests the formation of highly ordered J-aggregates or dimers in low polarity solvents.20–22 Other reports indicate that in polar solvents, different emitting species that may correspond to the formation of dimeric and trimeric species may be present. This behavior, coupled with hypsochromic shifts, implies the existence of H-aggregates.23–26
In this regard, small fluorophores have been used to acquire important information on structural characteristics in organized sets due to their sensitivity to the microenvironment. Extrinsic fluorescent probes that combine steroids with small fluorophores, such as α-cyanostilbene–cholesterol and bile acids conjugated with tetraphenylene, dansyl, and α-cyanostilbene have been used for the selective detection of H2O2, as well as for the creation of nanomaterials and organogels.27–32 Studies on conjugates of cholesterol–coumarin33 and various bile salts with 7-diethylamino-4-methylcoumarin34 have addressed supramolecular interactions, however, the impact of steroids on coumarin aggregation and cell localization remains relatively unexplored.
In recent decades, interest in the design of fluorescent probes targeting organelles for intracellular visualization has also increased. For many years, lipid drops (LD) were seen as simple cellular structures that contained fat. However, contemporary understanding recognizes them as crucial dynamic organelles for maintaining lipid and energy balance. Unfortunately, the ability to observe the dynamic behavior of lipid droplets is severely restricted as lipophilic dyes are commonly used that stain most subcellular membranes.35–37
To design fluorescent probes that allow us to study the dynamics of aggregation of a series of different steroids through the photophysical properties of coumarin and also function as lipophilic tools that selectively enable the intracellular visualization of organelles, we propose to synthesize conjugates based on the selected group architecture, a linker, and a fluorophore (Fig. 1). Following previous reports on such molecular devices,38,39 six steroidal conjugates derived from pregnanes (1b and 2b), bile acids (4b, 6a and 7a), androstanes (3b) and estrogens (5b) were selected. Interest in these nuclei is due to their characteristics such as structural rigidity, permeability to biological membranes, easy availability, attractive aggregation properties in aqueous solution and they also exhibit an important biological role.40 By integrating the important characteristics of steroids, with a fluorescent fragment such as the fluorophore 7-(N,N-diethylamine)-3-aminocoumarin, characterized by good optical properties, probes have been developed to examine the self-assembly behavior of steroids in different proportions of an aqueous solution. Finally, faced with the challenge of decreasing the affinity of the probe due to the direct coupling of the fluorophore and the selected group, a spacer was incorporated to modulate its interaction;41,42 the synthesis of these steroidal hemiesters was previously reported by our research group.43
 | ||
| Fig. 1 Overview of fluorescent probes prepared in this work. | ||
Notably, the structural diversity provided by the steroidal nucleus guided the exploration of aggregation mechanisms in lipid domains, including cell membranes, with results suggesting that supramolecular interactions, aggregation patterns, and cellular location were predominantly influenced by the steroidal fragment. This was evidenced during titration experiments indicating J-aggregate behavior, contrasting with H-aggregates typically observed for non-steroidal 7-(N,N)-diethylaminocoumarin in aqueous medium, highlighting the relevance of introducing the various steroidal fragments. Monocrystal X-ray diffraction analyses emphasized the role of steroid structural characteristics in crystal packing interactions. Finally, bioimaging studies further revealed the lipophilic nature of these fluorescent probes and their cellular localization ability, with the selectivity of certain conjugates for marking lipid droplet organelles (LDs).
Results and discussion
Design, synthesis, and characterization
Our approach for the synthesis of the target fluorescent probes was through the amidation of steroidal hemiesters previously synthesized43 (Scheme 1a) and 7-(N,N)-diethylamino-3-aminocoumarin, using N-ethoxycarbonyl-2-ethoxy-1,2-dihydroquinoline (EEDQ) as a coupling agent in an equimolar ratio (Scheme 1b), obtaining steroid–coumarin conjugates in mostly moderate yields, after chromatographic purification (43–73%), except for compound 5b, the yield of which was low (18%). | ||
| Scheme 1 Synthesis of the fluorescent probes (1b–7a). | ||
The formation of steroid–coumarin conjugates was confirmed by the presence of different signals in the aromatic region corresponding to the coumarin nucleus, resonating at δ = 6.5 to 8.5 ppm as well as the aliphatic signals of the diethyl substituent of the coumarin nucleus in the 1H-NMR spectrum; this spin system appeared as a triplet and a quadruplet signal resonating around δ = 1.2 and δ = 3.4 ppm, respectively. An unequivocal assignment of the 1H and 13C-NMR signals from the complex steroidal backbone was achieved by comparison with data reported in the literature44 and employing APT as well as homonuclear (1H/1H) and heteronuclear (1H/13C) 2D NMR experiments.
Photophysical properties
The photophysical properties of the compounds under study were determined in DMSO and are presented in Table 1. As the same fluorophore was used for all steroidal compounds, their photophysical properties were largely similar, presenting a wide absorption band with λabs = 391–396 nm (Fig. 2a), which was attributed to charge transfer (CT) from the electron-donating N,N,-diethylamino group to the electron-withdrawing pyrone moiety. The fluorescence spectrum of these probes showed a wide band with λem = 468–469 nm (Fig. 2b), associated with slow emissive relaxation from the first excited state of the fluorophore. In general, the compounds exhibited high fluorescence quantum yields in DMSO, making them promising candidates as fluorescent materials for bioimaging applications. | ||
| Fig. 2 (a) UV-Vis absorption and (b) emission spectra (conc.: 2.0 × 10⁻⁵ M, λexc = 390 nm) of all compounds under investigation in DMSO. | ||
| λ abs (nm) | λ em , (nm) | Stokes shift (nm) | ε × 10−4 (cm−1 M−1) | Φ F | |
|---|---|---|---|---|---|
| λ abs = absorption maximum, λem = emission maximum.a Conc. 2.0 × 10⁻⁵ M.b Excitation wavelength 380 nm.c ΦF = fluorescence quantum yield, measured by using the integrating sphere method. | |||||
| 1b | 392 | 469 | 77 | 2.04 | 0.99 |
| 2b | 392 | 469 | 77 | 2.63 | 1.04 |
| 3b | 391 | 468 | 77 | 4.55 | 0.96 |
| 4b | 392 | 469 | 77 | 4.16 | 0.93 |
| 5b | 396 | 468 | 73 | 2.85 | 1.00 |
| 6a | 392 | 468 | 76 | 2.18 | 0.97 |
| 7a | 391 | 468 | 77 | 3.53 | 1.00 |
The electronic absorption profiles of the fluorescent probes were studied in solvents of varying polarity in order to obtain information about the effects resulting from their interactions with the solvent. Indeed, the 7-(N,N-diethylamino)coumarin fluorophore is characterized by a push–pull type structure with photophysical properties that are highly dependent on the solvent polarity. Solvatochromic effects observed for the conjugates reported in this work are consistent with those reported in the literature.45 This behavior was evaluated in different solvents using 6a (Fig. 3) and 2b (Fig. S22†) as model compounds. The absorption spectrum of 6a (Fig. 3a) showed a slight bathochromic shift of about 10–20 nm with respect to the free coumarin, which presents a maximum at around 370 nm, exhibiting the largest displacement in chloroform (λabs = 396 nm). In turn, the emission spectrum exhibited enhanced sensitivity to changes in polarity, as evidenced by the bathochromic shift of ca. 36 nm from toluene to methanol (Fig. 3b and Table 2). This increased susceptibility in the emission spectra arises from the formation of dipolar species in the excited state, potentially stabilized in hydrogen donating solvents, thereby promoting the formation of a solvated complex.16,17,19,45,46
 | ||
| Fig. 3 (a) UV-Vis absorption and (b) emission spectra (conc. 2.0 × 10⁻⁵ M, λexc = 390 nm) of fluorophore 6a in solvents of varying polarity. | ||
| Solvent | 2b | 6a | ||
|---|---|---|---|---|
| λ abs (nm) | λ em (nm) | λ abs (nm) | λ em (nm) | |
| a Excitation wavelength: λ = 380 nm. b Concentration 2.0 × 10⁻⁵ M, except for 2b in methanol (1.0 × 10⁻⁵ M). | ||||
| Toluene | 384 | 443 | 384 | 443 |
| THF | 385 | 445 | 385 | 445 |
| Chloroform | 394 | 452 | 396 | 454 |
| Dichloromethane | 392 | 455 | 392 | 455 |
| DMSO | 394 | 468 | 392 | 468 |
| Methanol | 390 | 479 | 391 | 480 |
Aggregation studies in 1,4-dioxane![[thin space (1/6-em)]](https://www.rsc.org/images/entities/h3_char_2009.gif) :water binary mixtures
:water binary mixtures
Having observed the bathochromic-shifted emission in polar solvents like DMSO or methanol for all conjugates, we decided to carry out titration experiments in 1,4-dioxane:water mixtures to explore the formation of aggregates through variations in their optical properties. Initially, a concentration study was conducted in dioxane, revealing a notable pattern in the emission spectra of the examined compounds with increasing concentration (ESI Fig. S23–S25†).
This phenomenon is exemplified in Fig. 4a for 3b, depicting the impact of changes in concentration on the absorption spectra of the fluorophore, which shows a clear Lambert–Beer law trend. This is characterized by a direct proportionality between concentration and absorbance, with a single band observed, similar to the spectrum previously discussed (Fig. 2). Conversely, the emission spectrum (Fig. 4b), obtained at an initial concentration of 6.7 × 10⁻⁷ M in the same solvent, displayed a single band with a maximum emission at 450 nm. Notably, as the concentration increases to 2.7 × 10⁻⁶ M, two distinct and well-defined bands emerge at 418 nm and a second at 506 nm.
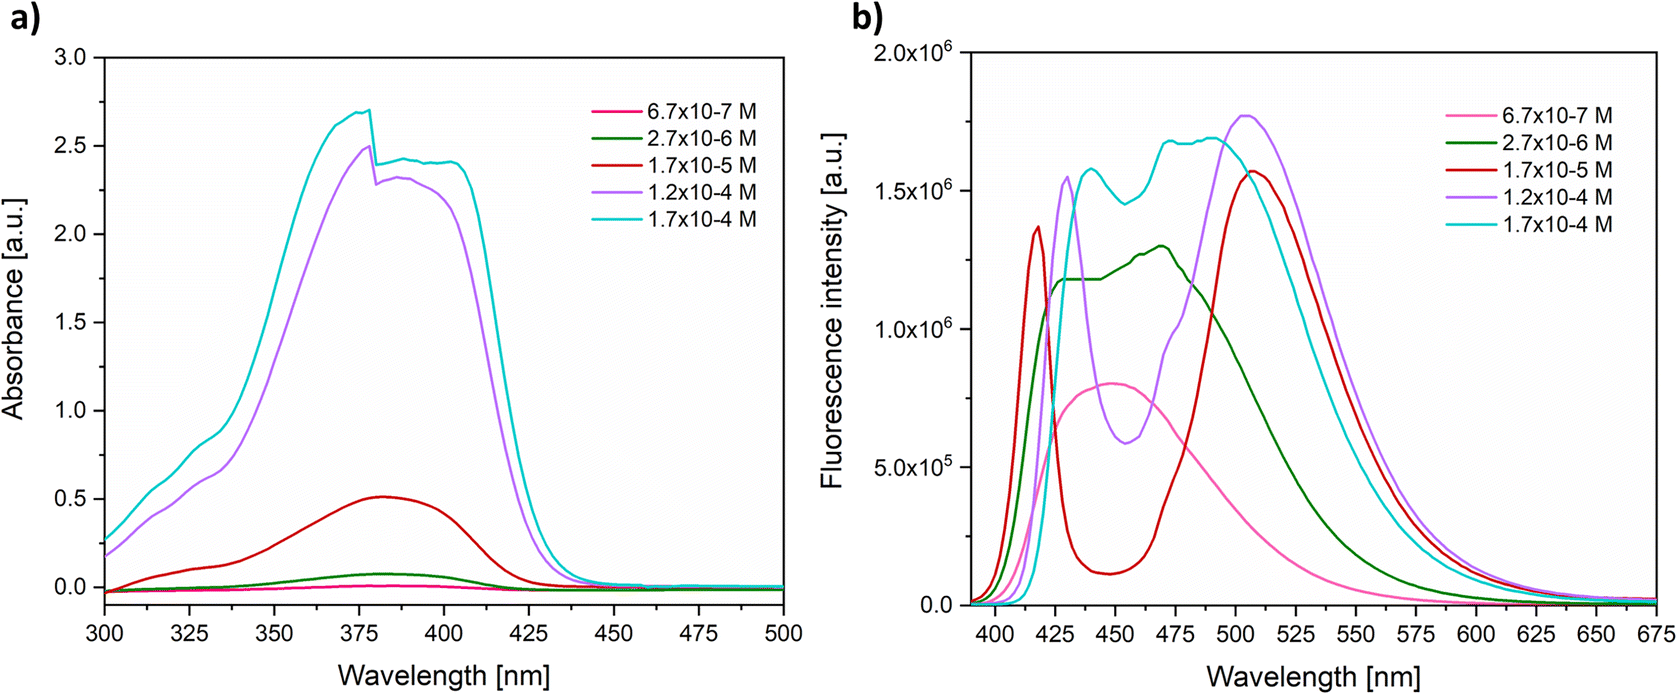 | ||
| Fig. 4 (a) Absorption and (b) fluorescence (λexc = 390 nm) spectra for various concentrations of 3b in 1,4-dioxane. | ||
Importantly, at a 1.2 × 10⁻⁴ M concentration, an additional band corresponding to a vibronic replica at 472 nm becomes apparent. As the concentration further increases, the bands progressively broaden to the extent that they merge into a single one. These preliminary investigations enabled the identification of diverse emissive species in solution depending on the concentration of the fluorophore, a phenomenon observed even in the absence of water in the medium. The observed variations in intensity and wavelength support the existence of an aggregation-induced emission (AIE) phenomenon.
To examine the impact of water on the aggregation state and obtain further evidence of the self-assembly of the molecules under investigation, experiments were conducted in 1,4-dioxane:water mixtures of varying composition. Two concentrations, previously identified to exhibit one and two well-defined equilibrium points, were selected for this purpose. The resulting absorption and emission spectra are presented in Fig. 5, and ESI Fig. S26–S32.† For practical categorization, the structural diversity of the steroids in this study can be grouped into four categories: pregnanes (1b and 2b), androstanes (3b), bile acids (4b, 6a, and 7a), and estrogens (5b).
 | ||
| Fig. 5 Absorption (a) and (c) and emission (b) and (d) spectra of 1,4-dioxane:water titration experiments of compound 2b. | ||
Examination of the absorption spectra of all the compounds under investigation shows that there is a redshift of ca. 18–26 nm with respect to their λmax values in 1,4-dioxane, as well as a decrease in absorbance as the fraction of water increases (see for example Fig. 5a and c for compound 2b). The occurrence of a moderate bathochromic shift is indicative of the presence of J-aggregates.47–49
At a low concentration of the sample, the emission spectra in dioxane show a single emission band at λem = 446–453 nm. However, with an increasing fraction of water, slight changes are observed in the spectra of pregnanes and androstanes (Fig. 5b for 2b and Fig. S26b and S28b† for 1b and 3b, respectively), which show a maximum bathochromic shift of the emission band when the water fraction is 50–70% at λem = 488–496 nm; this shift is accompanied by a decrease in fluorescence intensity, attributed to a twisted intramolecular charge transfer (TICT) state of the coumarin moiety, which is typically favored in solvents of increasing polarity,11 reaching a minimum fluorescence intensity in 100% water. Similarly, a bathochromic shift of the emission band is observed around 494–500 nm for cholestanes and estrogens (ESI Fig. S29b–S32b†) when the water fraction is 80%, which is accompanied by a drastic decrease in the fluorescence intensity, typical of aggregation-caused quenching (ACQ).
Conversely, in the emission spectra of compounds 1b, 2b, 4b, 5b, 6a and 7a at high analyte concentrations (Fig. 5d and ESI Fig. S26d, S29d–S32d†), the original band originating from charge transfer (CT) and initially centered at 450 nm in earlier experiments shifts to approximately 423 to 426 nm. Additionally, it becomes narrower when the dioxane fraction is 100%. With an increasing amount of water, a bathochromic shift of this band of up to 48 nm is observed as the water fraction increases from 0 to 60%. Accompanying this shift, there is a slight increase in fluorescence intensity. This displacement suggests the initiation of aggregation in these compounds,48 indicative of the AIE effect.
Simultaneously, a second band around 470–493 nm, corresponding to the emission of J-aggregates, which displays a bathochromic shift from 26 to 42 nm and reaches an emission maximum of 534 nm, is observed. Furthermore, this behavior is accompanied by the appearance of a shoulder at a lower wavelength that undergoes a hypsochromic shift as the volume of water increases. Another noteworthy observation from these experiments is that, at a water fraction of 70–80%, a single emission band centered at 490–512 nm emerges. Additionally, there is a substantial reduction in fluorescence intensity, likely attributable, once again, to the effect of aggregation-caused quenching (ACQ).
Compound 3b exhibits similar behavior, except that vibronic replication moving between the two main bands is observed with minimal intensity at a ratio of about 1:6 to the band at longer wavelength and 1:5 with respect to the lowest wavelength.
Based on these observations and monocrystal X-ray diffraction analysis, it is evident that the supramolecular interactions and the aggregation pattern found in the conjugates are influenced by the steroid fragment. This significant influence can be attributed to the structural characteristics of steroids, such as their structural rigidity, which usually aids in the separation between the hydrophilic and hydrophobic parts during the formation of aggregates. This effect is particularly evident in bile acid derivatives like compounds 4b, 6a, and 7a. Additionally, the accessible functional groups of steroids can participate in hydrogen bonds, which, along with the hydrophobic effect, provide further rigidity in the formation of aggregates.50
Previously, it was reported that substituted 7-aminocoumarins formed H-aggregates in aqueous medium,23–26 while 1,4-dioxane:water titration experiments revealed the characteristic behavior of J-aggregates. Specifically, the former interactions can provide a less polar environment by stabilizing the ICT state and inhibiting a TICT state in 7-N,N-diethyminocoumarin, which also favors increased fluorescence intensity.34 Likewise, the arrangement of the coumarin fragment with respect to the rest of the molecule and the steric volume of the steroids makes it difficult for these steroidal fluorescent probes to self-assemble in parallel and show π–π interactions.
Single-crystal XRD studies
Considering that the aim of these studies was to find potential evidence of the formation of J/H aggregates for these steroidal fluorescent probes, we studied their self-assembly in the solid state in detail. Although this is naturally a process different from the self-assembly that occurs in solution, important information can be obtained about the type of interactions that are present, as well as their packing patterns and geometries when forming aggregates. In this regard, suitable crystals of 1b, 2b, 5b and 6a were obtained. The structures of these compounds were confirmed by single crystal X-ray diffraction (SXRD) studies.The crystal structure and crystallographic data are shown in Fig. 6 and ESI Table S1.† Conjugates 1b, 2b and 5b crystallized in the space groups P21 and P1, with 4, 8, and 2 molecules per asymmetric unit, respectively. Compound 6a crystallized in the P1 space group, with 1 molecule per asymmetric unit as a CHCl3/H2O solvate from the crystallization process. The crystalline structure of the fluorescent probes is dominated by diverse supramolecular interactions, including ubiquitous hydrogen bonding (HB) interactions, details of which are presented in ESI Table S2.†
 | ||
| Fig. 6 ORTEP diagrams for compounds (a) 1b, (b) 2b, (c) 5b and (d) 6a, with thermal ellipsoids drawn with a probability of 50% for every atom other than hydrogen. | ||
Besides the aforementioned HB interactions in these crystals, a supramolecular interaction of higher relevance to this work is the occurrence of π-stacking interactions. Indeed, the aromatic nature of the coumarin core that delocalizes the electronic density is associated with a tendency towards stabilising π-stacking interactions.51 In the present study, these interactions can be observed solely in the crystalline structure of compounds 2b and 6a (Fig. 7).
 | ||
| Fig. 7 π-Stacking interactions in the crystal structures of (a) 2b, and (b) 6a; for clarity, neighbouring molecules in the crystal packing are omitted. | ||
In the first case, the molecules in the asymmetric unit of 2b interact along the crystallographic bc plane through π-stacking with an average interplanar distance between centroids of 3.562 Å (Fig. 7a). Additionally, the hydrogen bond interactions in N1–H1⋯O2A (2.14 Å), C24B–H90B⋯O22A (2.63 Å) and C24B–H90A⋯O2C (2.49 Å), as well as structural steric volume, do not favor face-to-face stacking between the coumarin nuclei (Fig. S34†), as reported for 7-diethylaminocoumarin derivatives.51,52 Although the crystal packing of compound 6a appears to be dominated by hydrogen bonds, π-stacks are also observed (Fig. 7b) with an average interplanar distance between centroids of 3.711 Å.
The different stacking arrangements depend on the relative disposition of the coumarin with respect to the steroidal fragment. Accordingly, a description of the relative disposition of these two fragments was attained by analysis of the torsion angles. As can be seen in compound 2b (Fig. 8a) the coumarin core is described by the plane formed by the C26–C27–C32 atoms, which show a periplanar arrangement with respect to the steroid plane with a dihedral angle of 19.2°. This rather flat arrangement favors the presence of π-stacking interactions in the crystal lattice discussed above. On the other hand, the plane of the coumarin core in compounds 1b (Fig. 8b) and 5b (Fig. 8c) presents a clinal arrangement with respect to the plane of the steroidal nucleus with dihedral angles of 60.5° and 40.6°, respectively. As expected, as the dihedral angle between the two fragments increases, the possibility of π-stacking interactions is lower, moreover, the presence of other interactions can direct the crystal packing.
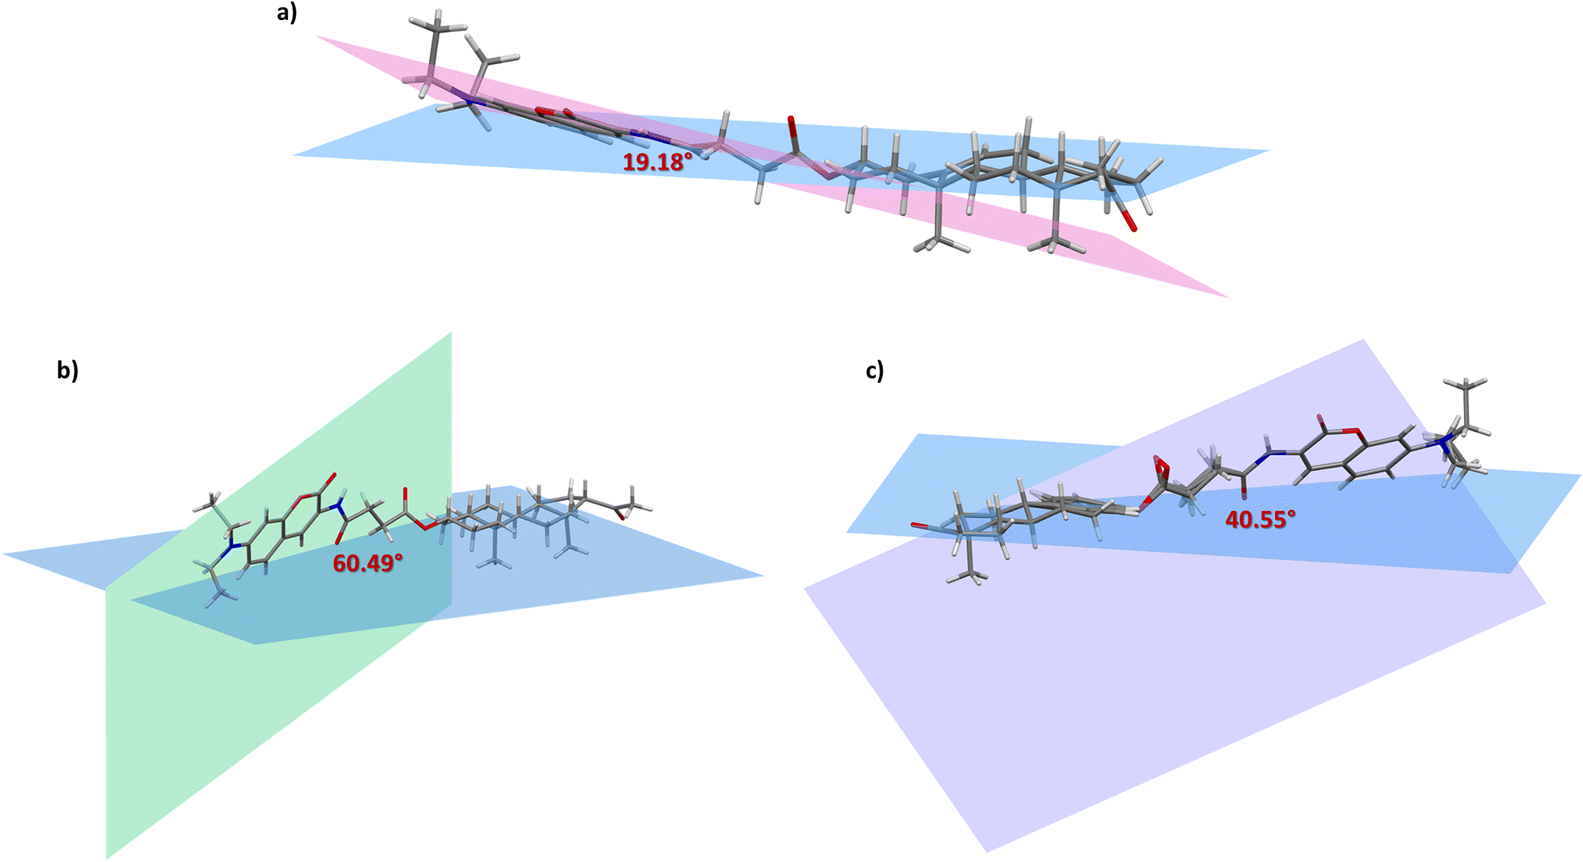 | ||
| Fig. 8 Dihedral angle between the selected planes of compounds (a) 2b, (b) 1b and (c) 5b; the plane of the coumarin nucleus is presented in pink, green and purple, respectively, while the plane of the steroidal nucleus is blue. | ||
The interactions present in the crystal packing of 2b favor the formation of columns of molecules stacked along the planes of the coumarin fragment, presenting a pitch angle of 46.4° and a perpendicular distance of 3.3 Å (Fig. 9a), which generates a partial π–π overlap, leading to the formation of J-aggregates. This interaction usually facilitates charge transfer between molecules, which promotes the high efficiency of the luminescence properties.47 As discussed above, in solution this phenomenon is observed as a second emission band that is accompanied by a bathochromic shift as the fraction of water increases, favoring the formation of supramolecular aggregates.
 | ||
| Fig. 9 Molecular packing and aggregation patterns of crystals of compounds (a) 2b and (b) 6a. | ||
Besides dimeric structures formed by hydrogen bond interactions (Fig. S36†), the molecules in the crystal packing of compound 6a are also stacked along the planes of the coumarin fragment, presenting an pitch angle of 79.9° and a perpendicular distance of 3.6 Å (Fig. 9b), which generates a parallel stack, favoring the formation of H-aggregates.
Concomitantly to the occurrence of these relevant π-stacking interactions, HB interactions also contribute significantly to stabilizing the crystal lattice in these steroids. Indeed, the crystal packing of compounds 1b, 5b and 6a clearly shows the dominance of HB interactions (ESI Fig. S33–S36†), which favor the formation of dimeric structures. These assemblies are predominantly formed between the N–H⋯O HBs involving the amide linker in compounds 1b and 5b, while in compound 6a these assemblies are formed through O–H⋯O HBs. In addition, all compounds present non-classical hydrogen bonds of the C–H⋯O type. These interactions arise mainly from the succinate chains and the N,N-diethyl groups of the coumarin fragment.53 It should be noted that the non-classical interaction in compound 6a occurs with a chloroform molecule present within the asymmetric unit.
Partition coefficient (logP) and confocal microscopy
The synthesized compounds were tested as fluorescent probes for obtaining cellular bioimages; the partition coefficient was calculated in terms of logP, and the obtained values are shown in Table 3.
P values for compounds 1b, 2b, 4b, 5b, 6a and 7a in octanol/water
The logP values range between 0.62 and 0.89, indicating that these molecules are more lipophilic than hydrophilic, primarily due to the presence of the steroidal fragment. This is in agreement with the well-established understanding that many structures of this nature exhibit amphiphilic characteristics. Generally, no correlation was found between lipophilicity and cell localization, but the structural diversity of steroids influences subcellular localization. For example, cholestane derivatives 4b, 6a and 7a are the most lipophilic compounds because they have the highest logP values and spread in the cell membrane (Fig. 10B and ESI Fig. S40 and S42†).
 | ||
| Fig. 10 Intracellular localization in live U-251 cells under confocal microscopy for (A) 5b and (B) 6a; bottom (from left to right): bright field, DAPI (λexc = 420 nm, λem = 460 nm) confocal channel. The high cytoplasmic localization indicates that both probes are cell-membrane specific. Pearson's coefficient = 0.95 and 0.93 for 5b and 6a, respectively (see ESI† for details). Scale bars = 20 μm. | ||
Unexpectedly, the compound derived from estrogen 5b proved to be the least lipophilic among the whole series, yet it predominantly localized in the cell membrane (Fig. 10A). The remarkable selectivity of this type of steroid is largely due to its unique horizontal orientation in the cell membrane. This results in optimal retention.54
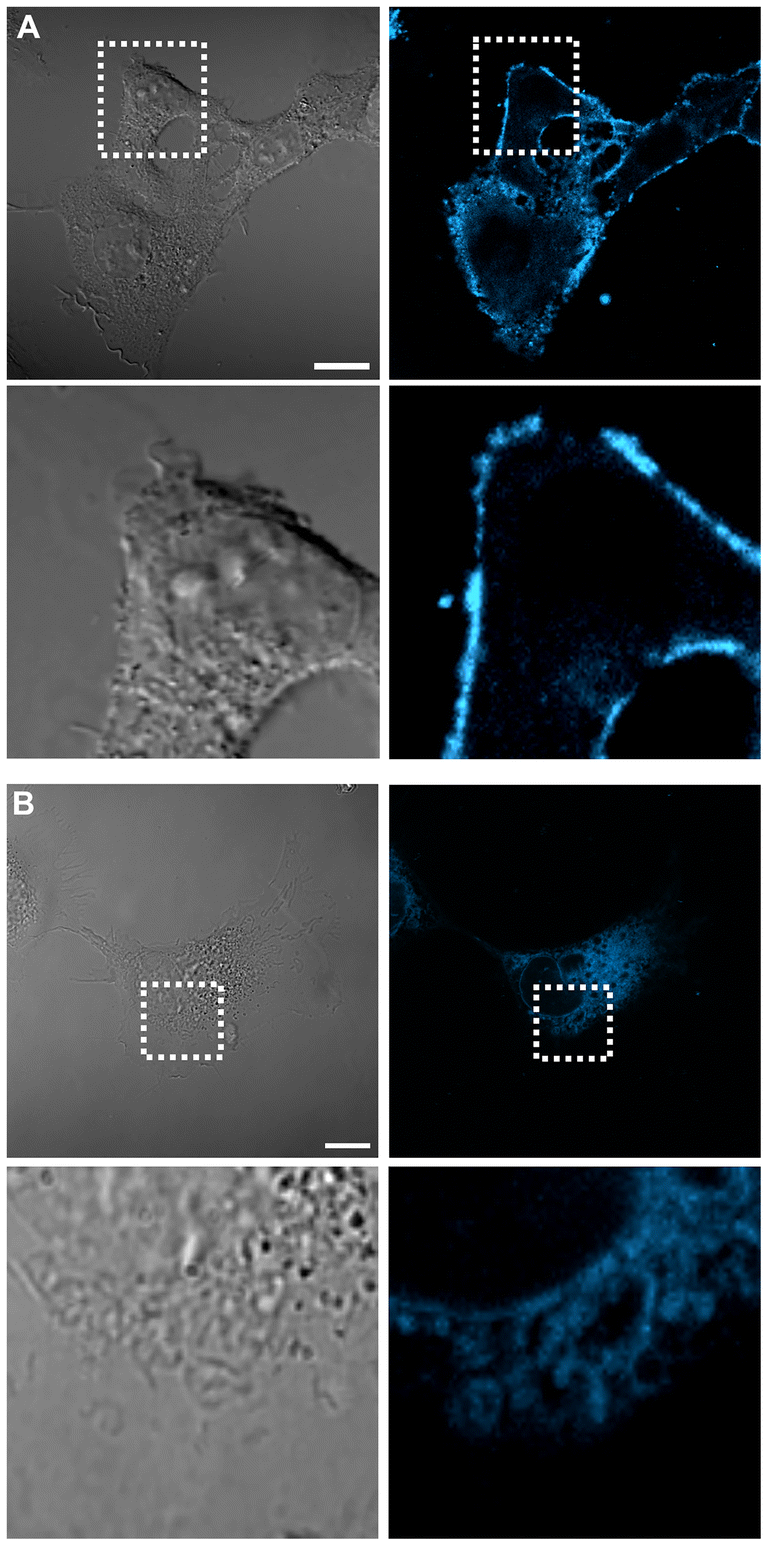
Finally, pregnane derivatives 1b and 2b, which are the least lipophilic, showed selectivity for lipid droplets (Fig. 11); these organelles play an important role in redox homeostasis and cellular stress, which are associated with cancer. As mentioned earlier, it is challenging to mark lipid droplets because most lipophilic dyes tend to stain cell membranes due to their high lipophilicity. The molecular conformation and the ability to form molecular aggregates also play a role in determining the selectivity towards these organelles. Pregnane derivatives such as 1b and 2b tend to present flatter conformations in the A/B/C/D rings system and, therefore, orient vertically across the membrane. These steroids also have a relatively hydrophobic group at C-17, which limits their ability to form hydrogen bonds.54 These characteristics make them less likely to be retained in the cell membrane. It has been recently reported that selective probes with high lipophilicity tend to accumulate in the environment surrounding these organelles, leading to the formation of fluorescent aggregates.55,56
 | ||
| Fig. 11 Intracellular localization in live U-251 cells under confocal microscopy for (A) 2b and (B) 1b; bottom: bright field illumination and DAPI (λexc = 420 nm, λem = 460 nm) confocal channel. The clear punctuated organelles are indicative of LDs’ specific localization. Pearson's coefficient = 0.96 (see ESI† for details). Scale bars = 20 μm. | ||
Conclusions
In this work, seven new steroid–coumarin conjugates were synthesized by amidation of steroidal hemiesters and 7-(N,N)-diethylamino-3-aminocoumarin by employing EEDQ as a coupling agent. All compounds were characterized by spectroscopic and spectrometric techniques. The aim was to use these compounds as fluorescent probes and to evaluate the influence of steroids on the aggregation properties of the coumarin fragment as well as to identify its cellular location by obtaining bioimages. The photophysical characterization of the conjugates confirmed that 7-(N,N)-diethylamine-3-aminocoumarin was highly sensitive to the polarity of the solvent used, leading to pronounced bathochromic shifts in its absorption and emission spectra in polar solvents. In general, these steroidal conjugates displayed good fluorescence properties in DMSO; this makes them promising candidates for use as fluorescent probes in bioimaging.Dioxane:water titration experiments indicated the formation of J-aggregates; this was supported by monocrystal X-ray diffraction analysis, through which it was identified that compound 2b favored the presence of J-aggregates featuring π-stacking interactions with a pitch angle of 43.4° among adjacent fluorophores. It was also determined that both the supramolecular interactions and the aggregation patterns found for the investigated fluorescent probes were mainly directed by the structural characteristics of the steroid fragment, as corroborated by compound 6a, for which the concave structure of the steroidal skeleton, as well as free hydroxyl groups, promoted interactions by hydrogen bonds over π-stacking. Finally, the bioimages obtained allowed us to identify that the cell location of most conjugates was centered in the cell membrane due to its lipophilic nature, while compounds 1b and 2b presented selectivity to mark lipid droplets.
Experimental section
Materials and methods
1H, 13C and two-dimensional HETCOR, HSQC, COSY and HMBC NMR spectra were obtained on JEOL Eclipse 270 MHz, JEOL ECA 500 MHz and Bruker 400 Avance MHz spectrometers in CDCl3 or methanol-d4. Chemical shifts (δ) are reported in ppm and all nuclei were referenced to TMS; coupling constants (J) are reported in Hz. Infrared spectra were recorded on a Varian FTIR series 640 instrument as solid samples using attenuated total reflectance and an Agilent series Cary Spectrum 600 FT-IR spectrometer. Melting points were measured on Electrothermal 9100 apparatus and are uncorrected. Low resolution mass spectra were acquired with an HPLC/coupled mass Agilent Technologies spectrometer (ESI). UV spectra were acquired on an EDINBURGH INSTRUMENTS DS5 UV-Vis spectrophotometer. The emission spectra were obtained on an EDINBURGH INSTRUMENTS FS5 spectrofluorometer by exciting the sample 10 nm below the longer wavelength absorption band. Quantum fluorescence yields were obtained using an integrating sphere in a PerkinElmer FL 8500 fluorescence spectrometer. X-ray diffraction was performed on a Bruker D8 VENTURE diffractometer and a Bruker APEX-II CCD diffractometer. Absorbances to estimate logP values were recorded on a Cytation 5 BioTek multi-modal imaging reader.
All reagents were commercially available and used without further purification. Reagent-grade solvents were dried according to procedures reported in the literature. Tetrahydrofuran (THF) was distilled from sodium–benzophenone in a continuous still under a nitrogen atmosphere.
3β,5α-Pregnanolone, 3β-pregnenolone, cholic acid, deoxycholic acid, 3β-19-dihydroxyandrost-5-en-17-one and estrone were donated by PROQUINA S.A. de C.V. The reaction products were isolated by column chromatography performed on 70–230 mesh silica gel. Yields refer to chromatographically purified products unless otherwise stated. Reactions were monitored by analytical thin layer chromatography (TLC) on pre-coated silica gel plates (ALUGRAM SIL G/UV254), under UV light.
Single-crystal XRD study details
Crystals of compounds 1a and 2a were grown by slow evaporation of a solution of CHCl3 containing a few drops of acetonitrile and compounds 5b and 6a were grown by diffusion of a solution of CHCl3 and EtOH. Structural data for steroidal derivatives 1b, 2b, 5b, and 6a were collected on a Bruker D8 VENTURE diffractometer at 298 K and 150 K. Crystals were mounted on glass fibers or conventional MicroLoops.™ All heavier atoms were found by difference Fourier mapping and all atoms appeared in the first solution. All reflection data were corrected for Lorentz and polarization effects. For all crystal structures, the first solution, refinement and output data were obtained using the SHELXL-2019 program.57 All software manipulations were performed using the ShelXle program.58 Mercury 2020.159 and ORTEP-360 were used to prepare artwork representations. CCDC 2325000 (1b), 2325001 (2b), 2325003 (5b) and 2325002 (6a)† contain the supplementary crystallographic data for this paper. Compound 2b presented four molecules in the unit cell, which is not common for a P21 space group, and was measured at low temperature. Disorder in compound 5b was modeled from the residual electron density. Meanwhile, compound 6a presented secondary extinction problems, derived from the crystal being very large and having to be fractionated at the time of collection. The data/parameter ratio was low. Because there are few reflections, there are not enough to model the disorder of water molecules; attempts to model this disorder led to an unstable refinement for this molecule. The problem persists in fixing the locations of hydrogens because it is hard to determine the positions of the hydrogens by X-ray diffraction due to their negligible effect on the diffraction pattern. In spite of these difficulties, the quality of the data enabled an unambiguous confirmation of the expected molecular structure.Synthesis procedures
General procedure for the coupling of 3-aminocoumarin to steroidal derivatives
The synthesis of compounds 1b, 2b, 3b, 4b, 5b, 6a and 7a was carried out using the following general methodology.In a round-bottomed flask, a steroidal hemisuccinate (1a to 5a), or the corresponding steroidal derivative for compounds 6a and 7a (cholic acid or deoxycholic acid) (1.0 equivalent), and N-ethoxycarbonyl-2-ethoxy-1,2-dihydroquinoline (EEDQ) (1.0 equivalent) were stirred in 5 mL of THF for 20 minutes, followed by the addition of 7-(N,N-diethylamino)-3-aminocoumarin (1.0 equivalent) previously dissolved in 2 mL of THF, under a N2 atmosphere. The reaction mixture was kept at room temperature overnight under stirring (the reaction was followed by TLC). The solvent was evaporated under vacuum and the crude product was dissolved in the minimum amount of ethyl acetate and enough hexane was added until the formation of precipitate, which was then separated by filtration; this step was performed 5–7 times. The product was purified by flash column chromatography.
:5 hexane:ethyl acetate mixtures). The product was purified over silica gel using hexane:AcOEt 9:1, to give 0.520 g of a yellow solid in 65% yield, mp = 215–217 °C. [α]20D +49.205 (c 0.333, CHCl3). FTIR-ATR (ν, cm−1): 3313 (NH), 1732 (C![[double bond, length as m-dash]](https://www.rsc.org/images/entities/char_e001.gif) O coumarin), 1701 (CO ester), 1662 (CO ketone), 1596 (CO amide), 1173 (C–O ester). 1H NMR [400 MHz, CDCl3] (δ, ppm): 8.57 (1H, s, H-4′), 8.06 (1H, s, NH), 7.28 (1H, d, J = 8.8 Hz, H-5′), 6.62 (1H, dd, J = 2.4, 8.8 Hz, H-6′), 6.51 (1H, d, J = 2.4 Hz, H-8′), 4.79–4.71 (1H, m, H-3), 3.41 (4H, q, J = 7.1 Hz, H-9′), 2.71 (4H, s, H-23 and H-24) 2.53 (1H, t, J = 8.9 Hz, H-17), 2.12 (3H, s, H-21) 1.21 (6H, t, J = 7.1 Hz, H-10′), 0.82 (3H, s, H-19), 0.61 (3H, s, H-18). 13C-NMR [100.5 MHz, CDCl3] (δ, ppm): 209.7 (C-20), 172.0 (C-22), 170.4 (C-25), 159.5 (C-2′), 152.6 (C-8ª′), 149.4 (C-7′), 128.6 (C-4′), 125.6 (C-5′), 118.9 (C-3′), 109.6 (C-6′), 108.3 (C-4a′), 97.4 (C-8′), 74.2 (C-3), 63.8 (C-17), 56.6 (C-14), 54.1 (C-9), 44.7 (C-9′), 44.6 (C-5), 44.2(C-13), 39.0 (C-4), 36.7 (C-1), 35.5 (C-10), 35.4 (C-8), 33.9 (C-12), 32.1 (C-2), 31.9 (C-24b), 31.5 (C-21), 29.7 (C-7), 28.4 (C-23b), 27.4 (C-6), 24.4 (C-15), 22.8 (C-16), 21.2 (C-11), 13.4 (C-18), 12.5 (C-10′), 12.2 (C-19). (ESI-TOF) calcd for [(C38H52N2O6) + H+]: 633.3898. Found: 633.3898 error 0.09. bInterchangeable signals. Elemental analysis found: C, 71.88; H, 8.46; N, 4.69. Required for C38H52N2O6: C, 72.12; H, 8.28; N, 4.43.
:3 hexane:ethyl acetate mixtures). The product was purified over silica gel using hexane:AcOEt 9:1, to give 0.066 g of a yellow solid in 43% yield, mp = 218–220 °C. [α]20D +10.201 (c 0.333, CHCl3). FTIR-ATR (ν, cm−1): 3313 (NH), 1734 (CO coumarin), 1701 (CO ester), 1662 (CO ketone), 1596 (CO amide), 1128 (C–O ester). 1H-NMR [500 MHz, CDCl3] (δ, ppm): 8.55 (1H, s, H-4′), 8.02 (1H, s, NH), 7.25 (1H, d, J = 8.8 Hz, H-5′), 6.60 (1H, dd, J = 8.8, 2.5 Hz, H-6′), 6.49 (1H, d, J = 2.4 Hz, H-8′), 5.36 (1H, d, J = 5.2, H-6) 4.67–4.62 (1H, m, H-3), 3.39 (4H, q, J = 7.1 Hz, H-9′), 2.70 (4H, s, H-23 and H-24), 2.52 (1H, t, J = 8.9, H-17), 2.11 (3H, s, H-21), 1.19 (2CH3, t, J = 7.1 Hz, H-10′), 1.00 (3H, s, H-19), 0.61 (3H, s, H-18). 13C-NMR [125.76 MHz, CDCl3] (δ, ppm): 209.8 (C-20), 172.0 (C-22), 170.4 (C-25), 159.7 (C-2′), 152.7 (C-8a′), 149.5 (C-7′), 139.7 (C-5), 128.7 (C-4′), 126.8 (C-5′), 122.5 (C-6), 118.9 (C-3′), 109.7 (C-6′), 108.3 (C-4a′), 97.5 (C-8′), 74.5 (C-3), 63.8 (C-17), 56.9 (C-14), 49.9 (C-9), 44.8 (C-9′), 44.1 (C-13), 38.9 (C-12), 38.1 (C-4), 37.1 (C-1), 36.7 (C-10), 32.2 (C-7), 31.9 (C-8), 31.8 (C-24a), 31.7 (C-21), 29.7 (C-23a), 27.8 (C-2), 24.6 (C-16), 22.9 (C-15), 21.1 (C-11), 19.4 (C-19), 13.3 (C-18), 12.5 (C-10′). MS (ESI) calcd for [(C38H50N2O6) + H+]: 631.37. Found: 631.4. Elemental analysis found: C, 72.08; H, 8.13; N, 4.87. Required for C38H50N2O6: C, 72.35; H, 7.99; N, 4.44.
:5 hexane:ethyl acetate mixtures). The product was purified over silica gel using hexane:AcOEt 6:4, to give 0.261 g of a yellow solid in 73% yield. Mp = 150–151 °C. FTIR-ATR (ν, cm−1): 3330 (NH), 1720 (CO ketone), 1680 (CO coumarin), 1604 (CO amide), 1163 (C–O ester). 1H-NMR [500 MHz, CDCl3] (δ, ppm): 8.54 (1H, s, H-4′), 8.52 (1H, s, H-4′′), 8.06 (1H, s, NH), 8.02 (1H, s, NH′), 7.24 (2H, d, J = 4.7 Hz, H-5′ and H-5′′), 6.60 (2H, d, J = 8.6 Hz, H-6′ and H-6′′), 6.48 (2H, brs, H-8′, H-8′′), 5.61 (1H, d, J = 2.4 Hz, H-6), 4.66–4.60 (1H, m, H-3), 4.54 (1H, d, J = 12.4 Hz, H-19a) and 4.00 (1H, J = 12.1 Hz, H-19b), 3.38 (8H, q, J = 7.1 Hz, H-9′ and H-9′′), 2.68 (8H, d, J = 7.1 Hz, H-21, H-21′, H-22 y H-22′), 1.17 (12H, t, J = 7.8, H-10′ and H-10′′), 0.89 (3H, s, H-18). 13C-NMR [125.76 MHz, CDCl3] (δ, ppm): 220.9 (C-17), 172.3 (C-20a), 172.0 (C-20′a), 171.9 (C-23b), 171.7 (C-23′b), 159.6 (C-2′ and C-2′′), 152.7 (C-8a′ and C-8a′′), 149.5 (C-7′ and 7′′), 134.8 (C-5), 128.7 (C-5′ y C-5′′), 126.2 (C-6, C-4′ y C-4′′), 125.8 (C-3′ y C-3′′), 118.9 (C-4a′ y C-4a′′), 109.8 (C-6′ y C-6′′), 97.5 (C-8′ y C-8′′), 73.7 (C-3), 64.6 (C-19), 52.3 (C-14), 50.2 (C-9), 47.7 (C-13), 44.9 (C-9′ y C-9′′), 40.0 (C-10), 38.1 (C-4), 35.8 (C-16), 33.3 (C-1), 32.5 (C-8), 32.1 (C-7), 31.9 (C-22c), 31.6 (C-22′c), 30.3 (C-12), 29.6 (C-21d), 29.3 (C-21′d), 27.8 (C-2), 21.9 (C-11), 21.1 (C-15), 13.8 (C-18), 12.5 (C-10′ y C-10′′). MS (ESI) calcd for [(C53H64N4O11) + H+]: 933.46. Found: 933.4. a,b,c,dInterchangeable signals. Elemental analysis found: C, 68.04; H, 7.1; N, 6.15. Required for C53H64N4O11: C, 68.22; H, 6.91; N, 6.00.
:5 hexane:ethyl acetate mixtures). The product was purified over silica gel using first hexane:AcOEt 1:1 to remove impurities and then ethyl acetate to obtain the product, to give 0.068 g of a yellow solid in 53% yield, mp. = 144–145 °C. FTIR-ATR (ν, cm−1): 3482 (OH), 3311 (NH), 1703 (CO ester), 1675 (CO coumarin), 1600 (CO amide), 1165 (C–O ester). 1H-NMR [500 MHz, CDCl3] (δ, ppm): 8.56 (1H, s, H-4′), 8.53 (1H, s, H-4′′), 8.10 (1H, s, NH), 7.93 (1H, s, NH′), 7.24 (1H, d, J = 1.3 Hz, H-5′), 7.23 (1H, d, J = 1.3 Hz, H-5′′), 6.58 (2H, dd, J = 8.8, 1.5 Hz H-6′, H-6′′), 6.46 (2H, dd, J = 7.1, 2.4 Hz, H-8′, H-8′′), 4.63–4.58 (1H, m, H-3), 3.97 (1H, s, H-12), 3.78 (1H, s, H-7), 3.37 (8H, c, J = 7.1 Hz, H-9′, H-9′′), 1.17 (12H, t, J = 7.1, H-10′, H-10′′), 1.04 (3H, d, J = 6.0 Hz, H-21), 0.86 (3H, s, H-19), 0.68 (3H, s, H-18). 13C-NMR [125.76 MHz, CDCl3] (δ, ppm): 172.7 (C-24, CO), 171.6 (C-25a, NH–CO), 170.8 (C-28a, CO), 159.8 and 159.7 (C-2′, C-2′′, CO), 152.7 and 152.6 (C-8a′ and C-8a′′), 149.5 and 149.4 (C-7′ and C-7′′), 128.8 and 128.7 (C-5′ and C-5′′), 126.1 and 125.7 (C-4′ and C-4′′), 119.1 and 118.9 (C-3′ and C-3′′), 109.7 and 109.6 (C-6′ and C-6′′), 108.4 and 108.3 (C-4a′ and C-4a′′), 97.4 and 97.3 (C-8′ and C-8′′), 75.5 (C-3), 73.0 (C-12), 68.2 (C-7), 47.2 (C-17), 46.7 (C-13), 44.8 (C-9′ y C-9′′), 42.0 (C-14), 41.2 (C-5), 39.6 (C-8), 35.5 (C-20), 35.1(C-1), 34.9, 34.8 and 34.7 (C-4, C-6 and C-10), 34.4 and 32.6 (C-22 and C-23), 31.5 and 30.3 (C-27 and C-26), 28.4 (C-2), 27.7 (C-11), 26.8 and 26.6 (C-9 and C-16), 23.3 (C-15), 22.5 (C-19), 17.5 (C-21), 12.7 (C-18), 12.6 and 12.5 (C-10′ and C-10′′). MS (ESI) calcd for [(C54H72N4O10) + H+]: 937.52. Found 937.5. aInterchangeable signals. Elemental analysis found: C, 66.49; H, 7.93; N, 4.94. Required for C54H72N4O10 + 2H2O: C, 66.64; H, 7.87; N, 5.76.
:3 hexane:ethyl acetate mixtures). The product was purified over silica gel using hexane:AcOEt 7:3, to give 0.028 g of a yellow solid in 18% yield, mp. = 215–217 °C. FTIR-ATR (ν, cm−1): 3325 (NH), 2928, 1737 (CO ester), 1666 (CO coumarin), 1597 (CO amide), 1127 (C–O ester). 1H-NMR [500 MHz, CDCl3] (δ, ppm): 8.57 (1H, s, H-4′), 7.99 (1H, s, NH), 7.26 (2H, d, J = 1.7 Hz, H-5′ y H-1), 6.87 (1H, dd, J = 8.5, 2.6 Hz, H-2), 6.84 (1H, d, J = 2.6 Hz, H-4), 6.61 (1H, dd, J = 8.8, 2.5 Hz H-6′), 6.49 (1H, d, J = 2.4 Hz, H-8′), 3.39 (4H, q, J = 7.1 Hz, H-9′), 2.97 (2H, t, J = 6.7 Hz, H-20 or H-21), 2.98–2.88 (2H, m, H-6), 2.81 (2H, t, J = 6.7 Hz, H-20 or H-21), 2.50 (1H, dd, J = 19.1, 8.4 Hz, H-16), 2.18–2.09 (1H, m, H-16) 1.19 (6H, t, J = 7.1, H-10′), 0.89 (3H, s, H-18). 13C-NMR [125.77 MHz, CDCl3] (δ, ppm): 221.0 (CO), 171.5 (C-19, CO), 170.0 (C-22, NH–CO), 159.6 (C-2′, CO), 152.8 (C-8a′), 149.5 (C-7′), 148.6 (C-3), 138.1 (C-10), 137.5 (C-5) 128.8 (C-5′), 126.5 (C-1), 125.9 (C-4′), 121.6 (C-4), 118.9 (C-3′), 118.8 (C-2), 109.7 (C-6′), 108.3 (C-4a′), 97.5 (C-8′), 50.5 (C-14), 48.0 (C-13), 44.8 (C-9′), 44.2 (C-9), 38.1 (C-8), 36.0 (C-16), 32.0 (C-6), 31.6 (C-12), 29.5 (C-20*), 29.4 (C-21*), 26.4 (C-2), 25.8 (C-11), 21.7 (C-15), 13.9 (C-18), 12.5 (C-10′). MS (ESI) calcd for [C35H40N2O6 + H+]: 585.3. Found 585.4. *Interchangeable signals. Elemental analysis found: C, 71.73; H, 7.04; N, 4.62. Required for C35H40N2O6: C, 71.90; H, 6.90; N, 4.79.
:ethyl acetate 5:5). The product was purified over silica gel using hexane:AcOEt 1:1, to give 0.595 g of a yellow solid in 64% yield, mp. = 264–266 °C. FTIR-ATR (ν, cm−1): 3448 (OH), 3279 (NH), 1711 (CO coumarin), 1600 (CO amide). 1H-NMR [400 MHz, CDCl3] (δ, ppm): 8.60 (1H, s, H-4′), 7.95 (1H, brs, NH), 7.28 (1H, d, J = 8.9 Hz, H-5′), 6.63 (1H, dd, J = 2.5, 8.9 Hz, H-6′), 6.51 (1H, d, J = 2.5 Hz, H-8′), 4.01 (1H, brs, H-12), 3.88 (1H, bs, H-7), 3.50–3.44 (1H, m, H-3), 3.42 (2CH2, q, J = 7.1 Hz H-9′), 1.22 (1 H, t, J = 7.1 Hz, H-10′), 1.05 (1H, d, J = 5.8 Hz, H-21), 0.91 (3H, s, H-19), 0.71 (3H, s, H-18). 13C-NMR [100.5 MHz, CDCl3] (δ, ppm): 172.6 (C-24, NH–CO), 159.7 (C-2′, CO), 152.6 (C-8a′), 149.4 (C-7′), 128.6 (C-5′), 125.6 (C-4′), 119.0 (C-3′), 109.6 (C-6′), 108.3 (C-4a′), 97.4 (C-8′), 73.0 (C-12), 72.0 (C-3), 68.4 (C-7), 47.0 (C-17), 46.5 (C-13), 44.7 (C-9′), 41.8 (C-14), 41.5 (C-5), 39.7 (C-4), 39.6 (C-8), 35.3, 35.2, 34.7, 34.6 and 34.5 (C-6, C-23, C-10, C-1, C-20), 31.4 (C-2), 30.5 (C-22), 28.3 (C-11), 27.6 (C-16), 26.5 (C-9), 23.3 (C-15), 22.5 (C-19), 17.5 (C-21), 12.6 (C-18), 12.5 (C-10′). HRMS (ESI-TOF) calcd for [(C37H54N2O6) + H+]: 623.4054. Found 623.4056. Elemental analysis found: C, 69.44; H, 8.94; N, 4.17. Required for C37H54N2O6 + H2O: C, 69.33; H, 8.43; N, 4.37.
:5 hexane:ethyl acetate mixtures). The product was purified over silica gel using hexane:AcOEt 1:1, to give 0.595 g of a yellow solid in 64% yield, mp = 248–251 °C. FTIR-ATR (ν, cm−1): 3440 (OH), 3317 (NH), 1707 (CO ester), 1603 (CO amide). 1H NMR [500 MHz, CDCl3](δ, ppm): 8.57 (1H, s, H-4′), 7.94 (1H, s, NH), 7.26 (1H, d, J = 8.8 Hz, H-5′), 6.60 (1H, dd, J = 2.5, 8.8 Hz, H-6′), 6.48 (1H, d, J = 2.5 Hz, H-8′), 4.64 (1H, sa, OH), 3.98 (1H, s, H-12), 3.62–3.58 (1H, m, H-3), 3.38 (2CH2, q, J = 7.1 Hz H-9′), 1.18 (2CH3, t, J = 7.1 Hz, H-10′), 1.00 (1H, d, J = 6.1 Hz, H-21), 0.89 (3H, s, H-19), 0.67 (3H, s, H-18). 13C RMN [125.76 MHz, CDCl3] (δ, ppm): 172.7 (C-24, NH–CO), 159.8 (C-2′, CO), 152.7 (C-8a′), 149.4 (C-7′), 128.7 (C-5′), 125.8 (C-4′), 119.1 (C-3′), 109.7 (C-6′), 108.4 (C-4a′), 97.4 (C-8′), 73.3 (C-12), 71.9 (C-3), 48.3 (C-14), 47.3 (C-17), 46.6 (C-13), 44.8 (C-9′), 42.2 (C-5), 36.5 (C-4), 36.1 (C-8), 35.3 (C-1), 34.7 (C-10), 34.2 (C-23), 33.7 (C-9 y C-20), 31.5 (C-2), 30.5 (C-22), 28.7 (C-11), 27.6 (C-6), 27.2 (C-7), 26.2 (C-16), 23.8 (C-15), 23.2 (C-19), 17.5 (C-21), 12.9 (C-18), 12.5 (C-10′). MS (ESI), calcd for [(C37H54N2O5) + H+]: 607.40. Found: 607.5. Elemental analysis found: C, 73.03; H, 9.31; N, 4.47. Required for C37H52N2O5: C, 73.23; H, 8.97; N, 4.62.
O coumarin), 1701 (CO ester), 1662 (CO ketone), 1596 (CO amide), 1173 (C–O ester). 1H NMR [400 MHz, CDCl3] (δ, ppm): 8.57 (1H, s, H-4′), 8.06 (1H, s, NH), 7.28 (1H, d, J = 8.8 Hz, H-5′), 6.62 (1H, dd, J = 2.4, 8.8 Hz, H-6′), 6.51 (1H, d, J = 2.4 Hz, H-8′), 4.79–4.71 (1H, m, H-3), 3.41 (4H, q, J = 7.1 Hz, H-9′), 2.71 (4H, s, H-23 and H-24) 2.53 (1H, t, J = 8.9 Hz, H-17), 2.12 (3H, s, H-21) 1.21 (6H, t, J = 7.1 Hz, H-10′), 0.82 (3H, s, H-19), 0.61 (3H, s, H-18). 13C-NMR [100.5 MHz, CDCl3] (δ, ppm): 209.7 (C-20), 172.0 (C-22), 170.4 (C-25), 159.5 (C-2′), 152.6 (C-8ª′), 149.4 (C-7′), 128.6 (C-4′), 125.6 (C-5′), 118.9 (C-3′), 109.6 (C-6′), 108.3 (C-4a′), 97.4 (C-8′), 74.2 (C-3), 63.8 (C-17), 56.6 (C-14), 54.1 (C-9), 44.7 (C-9′), 44.6 (C-5), 44.2(C-13), 39.0 (C-4), 36.7 (C-1), 35.5 (C-10), 35.4 (C-8), 33.9 (C-12), 32.1 (C-2), 31.9 (C-24b), 31.5 (C-21), 29.7 (C-7), 28.4 (C-23b), 27.4 (C-6), 24.4 (C-15), 22.8 (C-16), 21.2 (C-11), 13.4 (C-18), 12.5 (C-10′), 12.2 (C-19). (ESI-TOF) calcd for [(C38H52N2O6) + H+]: 633.3898. Found: 633.3898 error 0.09. bInterchangeable signals. Elemental analysis found: C, 71.88; H, 8.46; N, 4.69. Required for C38H52N2O6: C, 72.12; H, 8.28; N, 4.43.
:3 hexane:ethyl acetate mixtures). The product was purified over silica gel using hexane:AcOEt 9:1, to give 0.066 g of a yellow solid in 43% yield, mp = 218–220 °C. [α]20D +10.201 (c 0.333, CHCl3). FTIR-ATR (ν, cm−1): 3313 (NH), 1734 (CO coumarin), 1701 (CO ester), 1662 (CO ketone), 1596 (CO amide), 1128 (C–O ester). 1H-NMR [500 MHz, CDCl3] (δ, ppm): 8.55 (1H, s, H-4′), 8.02 (1H, s, NH), 7.25 (1H, d, J = 8.8 Hz, H-5′), 6.60 (1H, dd, J = 8.8, 2.5 Hz, H-6′), 6.49 (1H, d, J = 2.4 Hz, H-8′), 5.36 (1H, d, J = 5.2, H-6) 4.67–4.62 (1H, m, H-3), 3.39 (4H, q, J = 7.1 Hz, H-9′), 2.70 (4H, s, H-23 and H-24), 2.52 (1H, t, J = 8.9, H-17), 2.11 (3H, s, H-21), 1.19 (2CH3, t, J = 7.1 Hz, H-10′), 1.00 (3H, s, H-19), 0.61 (3H, s, H-18). 13C-NMR [125.76 MHz, CDCl3] (δ, ppm): 209.8 (C-20), 172.0 (C-22), 170.4 (C-25), 159.7 (C-2′), 152.7 (C-8a′), 149.5 (C-7′), 139.7 (C-5), 128.7 (C-4′), 126.8 (C-5′), 122.5 (C-6), 118.9 (C-3′), 109.7 (C-6′), 108.3 (C-4a′), 97.5 (C-8′), 74.5 (C-3), 63.8 (C-17), 56.9 (C-14), 49.9 (C-9), 44.8 (C-9′), 44.1 (C-13), 38.9 (C-12), 38.1 (C-4), 37.1 (C-1), 36.7 (C-10), 32.2 (C-7), 31.9 (C-8), 31.8 (C-24a), 31.7 (C-21), 29.7 (C-23a), 27.8 (C-2), 24.6 (C-16), 22.9 (C-15), 21.1 (C-11), 19.4 (C-19), 13.3 (C-18), 12.5 (C-10′). MS (ESI) calcd for [(C38H50N2O6) + H+]: 631.37. Found: 631.4. Elemental analysis found: C, 72.08; H, 8.13; N, 4.87. Required for C38H50N2O6: C, 72.35; H, 7.99; N, 4.44.
:5 hexane:ethyl acetate mixtures). The product was purified over silica gel using hexane:AcOEt 6:4, to give 0.261 g of a yellow solid in 73% yield. Mp = 150–151 °C. FTIR-ATR (ν, cm−1): 3330 (NH), 1720 (CO ketone), 1680 (CO coumarin), 1604 (CO amide), 1163 (C–O ester). 1H-NMR [500 MHz, CDCl3] (δ, ppm): 8.54 (1H, s, H-4′), 8.52 (1H, s, H-4′′), 8.06 (1H, s, NH), 8.02 (1H, s, NH′), 7.24 (2H, d, J = 4.7 Hz, H-5′ and H-5′′), 6.60 (2H, d, J = 8.6 Hz, H-6′ and H-6′′), 6.48 (2H, brs, H-8′, H-8′′), 5.61 (1H, d, J = 2.4 Hz, H-6), 4.66–4.60 (1H, m, H-3), 4.54 (1H, d, J = 12.4 Hz, H-19a) and 4.00 (1H, J = 12.1 Hz, H-19b), 3.38 (8H, q, J = 7.1 Hz, H-9′ and H-9′′), 2.68 (8H, d, J = 7.1 Hz, H-21, H-21′, H-22 y H-22′), 1.17 (12H, t, J = 7.8, H-10′ and H-10′′), 0.89 (3H, s, H-18). 13C-NMR [125.76 MHz, CDCl3] (δ, ppm): 220.9 (C-17), 172.3 (C-20a), 172.0 (C-20′a), 171.9 (C-23b), 171.7 (C-23′b), 159.6 (C-2′ and C-2′′), 152.7 (C-8a′ and C-8a′′), 149.5 (C-7′ and 7′′), 134.8 (C-5), 128.7 (C-5′ y C-5′′), 126.2 (C-6, C-4′ y C-4′′), 125.8 (C-3′ y C-3′′), 118.9 (C-4a′ y C-4a′′), 109.8 (C-6′ y C-6′′), 97.5 (C-8′ y C-8′′), 73.7 (C-3), 64.6 (C-19), 52.3 (C-14), 50.2 (C-9), 47.7 (C-13), 44.9 (C-9′ y C-9′′), 40.0 (C-10), 38.1 (C-4), 35.8 (C-16), 33.3 (C-1), 32.5 (C-8), 32.1 (C-7), 31.9 (C-22c), 31.6 (C-22′c), 30.3 (C-12), 29.6 (C-21d), 29.3 (C-21′d), 27.8 (C-2), 21.9 (C-11), 21.1 (C-15), 13.8 (C-18), 12.5 (C-10′ y C-10′′). MS (ESI) calcd for [(C53H64N4O11) + H+]: 933.46. Found: 933.4. a,b,c,dInterchangeable signals. Elemental analysis found: C, 68.04; H, 7.1; N, 6.15. Required for C53H64N4O11: C, 68.22; H, 6.91; N, 6.00.
:5 hexane:ethyl acetate mixtures). The product was purified over silica gel using first hexane:AcOEt 1:1 to remove impurities and then ethyl acetate to obtain the product, to give 0.068 g of a yellow solid in 53% yield, mp. = 144–145 °C. FTIR-ATR (ν, cm−1): 3482 (OH), 3311 (NH), 1703 (CO ester), 1675 (CO coumarin), 1600 (CO amide), 1165 (C–O ester). 1H-NMR [500 MHz, CDCl3] (δ, ppm): 8.56 (1H, s, H-4′), 8.53 (1H, s, H-4′′), 8.10 (1H, s, NH), 7.93 (1H, s, NH′), 7.24 (1H, d, J = 1.3 Hz, H-5′), 7.23 (1H, d, J = 1.3 Hz, H-5′′), 6.58 (2H, dd, J = 8.8, 1.5 Hz H-6′, H-6′′), 6.46 (2H, dd, J = 7.1, 2.4 Hz, H-8′, H-8′′), 4.63–4.58 (1H, m, H-3), 3.97 (1H, s, H-12), 3.78 (1H, s, H-7), 3.37 (8H, c, J = 7.1 Hz, H-9′, H-9′′), 1.17 (12H, t, J = 7.1, H-10′, H-10′′), 1.04 (3H, d, J = 6.0 Hz, H-21), 0.86 (3H, s, H-19), 0.68 (3H, s, H-18). 13C-NMR [125.76 MHz, CDCl3] (δ, ppm): 172.7 (C-24, CO), 171.6 (C-25a, NH–CO), 170.8 (C-28a, CO), 159.8 and 159.7 (C-2′, C-2′′, CO), 152.7 and 152.6 (C-8a′ and C-8a′′), 149.5 and 149.4 (C-7′ and C-7′′), 128.8 and 128.7 (C-5′ and C-5′′), 126.1 and 125.7 (C-4′ and C-4′′), 119.1 and 118.9 (C-3′ and C-3′′), 109.7 and 109.6 (C-6′ and C-6′′), 108.4 and 108.3 (C-4a′ and C-4a′′), 97.4 and 97.3 (C-8′ and C-8′′), 75.5 (C-3), 73.0 (C-12), 68.2 (C-7), 47.2 (C-17), 46.7 (C-13), 44.8 (C-9′ y C-9′′), 42.0 (C-14), 41.2 (C-5), 39.6 (C-8), 35.5 (C-20), 35.1(C-1), 34.9, 34.8 and 34.7 (C-4, C-6 and C-10), 34.4 and 32.6 (C-22 and C-23), 31.5 and 30.3 (C-27 and C-26), 28.4 (C-2), 27.7 (C-11), 26.8 and 26.6 (C-9 and C-16), 23.3 (C-15), 22.5 (C-19), 17.5 (C-21), 12.7 (C-18), 12.6 and 12.5 (C-10′ and C-10′′). MS (ESI) calcd for [(C54H72N4O10) + H+]: 937.52. Found 937.5. aInterchangeable signals. Elemental analysis found: C, 66.49; H, 7.93; N, 4.94. Required for C54H72N4O10 + 2H2O: C, 66.64; H, 7.87; N, 5.76.
:3 hexane:ethyl acetate mixtures). The product was purified over silica gel using hexane:AcOEt 7:3, to give 0.028 g of a yellow solid in 18% yield, mp. = 215–217 °C. FTIR-ATR (ν, cm−1): 3325 (NH), 2928, 1737 (CO ester), 1666 (CO coumarin), 1597 (CO amide), 1127 (C–O ester). 1H-NMR [500 MHz, CDCl3] (δ, ppm): 8.57 (1H, s, H-4′), 7.99 (1H, s, NH), 7.26 (2H, d, J = 1.7 Hz, H-5′ y H-1), 6.87 (1H, dd, J = 8.5, 2.6 Hz, H-2), 6.84 (1H, d, J = 2.6 Hz, H-4), 6.61 (1H, dd, J = 8.8, 2.5 Hz H-6′), 6.49 (1H, d, J = 2.4 Hz, H-8′), 3.39 (4H, q, J = 7.1 Hz, H-9′), 2.97 (2H, t, J = 6.7 Hz, H-20 or H-21), 2.98–2.88 (2H, m, H-6), 2.81 (2H, t, J = 6.7 Hz, H-20 or H-21), 2.50 (1H, dd, J = 19.1, 8.4 Hz, H-16), 2.18–2.09 (1H, m, H-16) 1.19 (6H, t, J = 7.1, H-10′), 0.89 (3H, s, H-18). 13C-NMR [125.77 MHz, CDCl3] (δ, ppm): 221.0 (CO), 171.5 (C-19, CO), 170.0 (C-22, NH–CO), 159.6 (C-2′, CO), 152.8 (C-8a′), 149.5 (C-7′), 148.6 (C-3), 138.1 (C-10), 137.5 (C-5) 128.8 (C-5′), 126.5 (C-1), 125.9 (C-4′), 121.6 (C-4), 118.9 (C-3′), 118.8 (C-2), 109.7 (C-6′), 108.3 (C-4a′), 97.5 (C-8′), 50.5 (C-14), 48.0 (C-13), 44.8 (C-9′), 44.2 (C-9), 38.1 (C-8), 36.0 (C-16), 32.0 (C-6), 31.6 (C-12), 29.5 (C-20*), 29.4 (C-21*), 26.4 (C-2), 25.8 (C-11), 21.7 (C-15), 13.9 (C-18), 12.5 (C-10′). MS (ESI) calcd for [C35H40N2O6 + H+]: 585.3. Found 585.4. *Interchangeable signals. Elemental analysis found: C, 71.73; H, 7.04; N, 4.62. Required for C35H40N2O6: C, 71.90; H, 6.90; N, 4.79.
:ethyl acetate 5:5). The product was purified over silica gel using hexane:AcOEt 1:1, to give 0.595 g of a yellow solid in 64% yield, mp. = 264–266 °C. FTIR-ATR (ν, cm−1): 3448 (OH), 3279 (NH), 1711 (CO coumarin), 1600 (CO amide). 1H-NMR [400 MHz, CDCl3] (δ, ppm): 8.60 (1H, s, H-4′), 7.95 (1H, brs, NH), 7.28 (1H, d, J = 8.9 Hz, H-5′), 6.63 (1H, dd, J = 2.5, 8.9 Hz, H-6′), 6.51 (1H, d, J = 2.5 Hz, H-8′), 4.01 (1H, brs, H-12), 3.88 (1H, bs, H-7), 3.50–3.44 (1H, m, H-3), 3.42 (2CH2, q, J = 7.1 Hz H-9′), 1.22 (1 H, t, J = 7.1 Hz, H-10′), 1.05 (1H, d, J = 5.8 Hz, H-21), 0.91 (3H, s, H-19), 0.71 (3H, s, H-18). 13C-NMR [100.5 MHz, CDCl3] (δ, ppm): 172.6 (C-24, NH–CO), 159.7 (C-2′, CO), 152.6 (C-8a′), 149.4 (C-7′), 128.6 (C-5′), 125.6 (C-4′), 119.0 (C-3′), 109.6 (C-6′), 108.3 (C-4a′), 97.4 (C-8′), 73.0 (C-12), 72.0 (C-3), 68.4 (C-7), 47.0 (C-17), 46.5 (C-13), 44.7 (C-9′), 41.8 (C-14), 41.5 (C-5), 39.7 (C-4), 39.6 (C-8), 35.3, 35.2, 34.7, 34.6 and 34.5 (C-6, C-23, C-10, C-1, C-20), 31.4 (C-2), 30.5 (C-22), 28.3 (C-11), 27.6 (C-16), 26.5 (C-9), 23.3 (C-15), 22.5 (C-19), 17.5 (C-21), 12.6 (C-18), 12.5 (C-10′). HRMS (ESI-TOF) calcd for [(C37H54N2O6) + H+]: 623.4054. Found 623.4056. Elemental analysis found: C, 69.44; H, 8.94; N, 4.17. Required for C37H54N2O6 + H2O: C, 69.33; H, 8.43; N, 4.37.
:5 hexane:ethyl acetate mixtures). The product was purified over silica gel using hexane:AcOEt 1:1, to give 0.595 g of a yellow solid in 64% yield, mp = 248–251 °C. FTIR-ATR (ν, cm−1): 3440 (OH), 3317 (NH), 1707 (CO ester), 1603 (CO amide). 1H NMR [500 MHz, CDCl3](δ, ppm): 8.57 (1H, s, H-4′), 7.94 (1H, s, NH), 7.26 (1H, d, J = 8.8 Hz, H-5′), 6.60 (1H, dd, J = 2.5, 8.8 Hz, H-6′), 6.48 (1H, d, J = 2.5 Hz, H-8′), 4.64 (1H, sa, OH), 3.98 (1H, s, H-12), 3.62–3.58 (1H, m, H-3), 3.38 (2CH2, q, J = 7.1 Hz H-9′), 1.18 (2CH3, t, J = 7.1 Hz, H-10′), 1.00 (1H, d, J = 6.1 Hz, H-21), 0.89 (3H, s, H-19), 0.67 (3H, s, H-18). 13C RMN [125.76 MHz, CDCl3] (δ, ppm): 172.7 (C-24, NH–CO), 159.8 (C-2′, CO), 152.7 (C-8a′), 149.4 (C-7′), 128.7 (C-5′), 125.8 (C-4′), 119.1 (C-3′), 109.7 (C-6′), 108.4 (C-4a′), 97.4 (C-8′), 73.3 (C-12), 71.9 (C-3), 48.3 (C-14), 47.3 (C-17), 46.6 (C-13), 44.8 (C-9′), 42.2 (C-5), 36.5 (C-4), 36.1 (C-8), 35.3 (C-1), 34.7 (C-10), 34.2 (C-23), 33.7 (C-9 y C-20), 31.5 (C-2), 30.5 (C-22), 28.7 (C-11), 27.6 (C-6), 27.2 (C-7), 26.2 (C-16), 23.8 (C-15), 23.2 (C-19), 17.5 (C-21), 12.9 (C-18), 12.5 (C-10′). MS (ESI), calcd for [(C37H54N2O5) + H+]: 607.40. Found: 607.5. Elemental analysis found: C, 73.03; H, 9.31; N, 4.47. Required for C37H52N2O5: C, 73.23; H, 8.97; N, 4.62.
General method for determining the partition coefficient (logP)
LogP values were determined in octanol–water, using a modification of the reported methodology.62 To Eppendorf tubes, aliquots of 300 μL of steroid–coumarin conjugates 1b (6 mM), 2b (6.5 mM), 4b (10 mM), 5b (10 mM), 6a (5 mM) and 7a (4 mM) in DMSO were added, then 300 μL of water and 300 μL of octanol were added and the mixtures were centrifuged for approximately 2 min. Then, 50 μL of samples were taken from each phase and placed in wells of culture plates, diluting with 200 μL of a 3:1 mixture of methanol:water for the samples of the octanol phase and 200 μL of a 3:1 mixture of methanol:octanol for the samples of the aqueous phase. The initial solutions were diluted 4 times, taking a sample of 100 μL from the initial wells and completing the volume of each dilution with another 100 μL of a 3:1:1 mixture of methanol:octanol:water. Absorbances were then read in a multi-modal reader using the maximum absorption wavelength for 7-(N,N-diethylamino)-3-aminocoumarin (380 nm) at a temperature of 21.8 °C. Finally, logP was calculated using eqn (1) | (1) |
Author contributions
Claudia M. Ramírez-Lozano: Investigation, writing – original draft, methodology and data analysis. Ma Eugenia Ochoa: Methodology. Pablo Labra-Vázquez: Formal analysis, writing – review. Arturo Jiménez-Sánchez: Conceptualization, writing –review and editing. Norberto Farfán: Supervision, conceptualization, writing – review and editing. Rosa Santillan: Supervision, conceptualization, writing – review and editing.Conflicts of interest
The authors have no conflicts to declare.Acknowledgements
The authors thank staff at CINVESTAV-IPN, Marco A. Leyva-Ramírez for acquiring X-ray diffraction data, Ma. Teresa Cortez-Picasso and Víctor M. González-Díaz for their support in acquiring NMR spectra, as well as Geiser Cuellar for his support in MS analyses. Claudia M. Ramírez-Lozano thanks CONAHCYT for her doctoral scholarship (No. CVU 957375). Financial support from CONAHCYT, A1-S-7642 PAIP, PAPIIT (IN200422) is acknowledged.References
- K. S. Schanze, Organic Molecular Photochemistry, CRC Press, 2020 Search PubMed.
- G. M. Whitesides and M. Boncheva, Proc. Natl. Acad. Sci. U. S. A., 2002, 99, 4769–4774 CrossRef CAS PubMed.
- X. Liu, J. M. Cole, P. C. Y. Chow, L. Zhang, Y. Tan and T. Zhao, J. Phys. Chem. C, 2014, 118, 13042–13051 CrossRef CAS.
- G. V. Bünau, Ber. Bunsen-Ges. Phys. Chem., 1970, 74, 1294–1295 CrossRef.
- Y. Hong, J. W. Y. Lam and B. Z. Tang, Chem. Commun., 2009, 4332 RSC.
- X. Li, D. Wang, Y. Zhang, W. Lu, S. Yang, G. Hou, Z. Zhao, H. Qin, Y. Zhang, M. Li and G. Qing, Chem. Sci., 2021, 12, 12437–12444 RSC.
- X. Wang, H. Wang, Y. Niu, Y. Wang and L. Feng, Spectrochim. Acta, Part A, 2020, 226, 117650 CrossRef CAS PubMed.
- L. Yan, R. Li, W. Shen and Z. Qi, J. Lumin., 2018, 194, 151–155 CrossRef CAS.
- Y. Wang, X. Hao, L. Liang, L. Gao, X. Ren, Y. Wu and H. Zhao, RSC Adv., 2020, 10, 6109–6113 RSC.
- R. Qian, H. Tong, C. Huang, J. Li, Y. Tang, R. Wang, K. Lou and W. Wang, Org. Biomol. Chem., 2016, 14, 5007–5011 RSC.
- L. Q. Yan, Z. N. Kong, Y. Xia and Z. J. Qi, New J. Chem., 2016, 40, 7061–7067 RSC.
- J. H. Lee, K. Y. Kim, H. Jin, Y. E. Baek, Y. Choi, S. H. Jung, S. S. Lee, J. Bae and J. H. Jung, ACS Appl. Mater. Interfaces, 2018, 10, 3380–3391 CrossRef CAS PubMed.
- D. Cao, Z. Liu, P. Verwilst, S. Koo, P. Jangjili, J. S. Kim and W. Lin, Chem. Rev., 2019, 119, 10403–10519 CrossRef CAS PubMed.
- B. Wagner, Molecules, 2009, 14, 210–237 CrossRef CAS PubMed.
- S. R. Trenor, A. R. Shultz, B. J. Love and T. E. Long, Chem. Rev., 2004, 104, 3059–3078 CrossRef CAS PubMed.
- S. Nad, M. Kumbhakar and H. Pal, J. Phys. Chem. A, 2003, 107, 4808–4816 CrossRef CAS.
- P. Dahiya, M. Kumbhakar, T. Mukherjee and H. Pal, Chem. Phys. Lett., 2005, 414, 148–154 CrossRef CAS.
- S. Nad and H. Pal, J. Phys. Chem. A, 2001, 105, 1097–1106 CrossRef CAS.
- A. Barik, M. Kumbhakar, S. Nath and H. Pal, Chem. Phys., 2005, 315, 277–285 CrossRef CAS.
- X. Liu, J. M. Cole and K. S. Low, J. Phys. Chem. C, 2013, 117, 14723–14730 CrossRef CAS.
- X. Liu, J. M. Cole, P. G. Waddell, T.-C. Lin and S. McKechnie, J. Phys. Chem. C, 2013, 117, 14130–14141 CrossRef CAS.
- X. Liu, J. M. Cole, P. C. Y. Chow, L. Zhang, Y. Tan and T. Zhao, J. Phys. Chem. C, 2014, 118, 13042–13051 CrossRef CAS.
- P. Verma and H. Pal, J. Phys. Chem. A, 2012, 116, 4473–4484 CrossRef CAS PubMed.
- P. Verma and H. Pal, J. Phys. Chem. A, 2013, 117, 12409–12418 CrossRef CAS PubMed.
- P. Verma and H. Pal, J. Phys. Chem. A, 2014, 118, 6950–6964 CrossRef CAS PubMed.
- M. Cigáň, J. Donovalová, V. Szöcs, J. Gašpar, K. Jakusová and A. Gáplovský, J. Phys. Chem. A, 2013, 117, 4870–4883 CrossRef PubMed.
- P. Xing, H. Chen, L. Bai and Y. Zhao, Chem. Commun., 2015, 51, 9309–9312 RSC.
- V. Palakollu and S. Kanvah, RSC Adv., 2015, 5, 33049–33057 RSC.
- D. S. Agarwal, R. Prakash Singh, P. N. Jha and R. Sakhuja, Steroids, 2020, 160, 108659 CrossRef CAS PubMed.
- M. Zhang, X. Yin, T. Tian, Y. Liang, W. Li, Y. Lan, J. Li, M. Zhou, Y. Ju and G. Li, Chem. Commun., 2015, 51, 10210–10213 RSC.
- M. Gomez-Mendoza, M. L. Marin and M. A. Miranda, J. Phys. Chem. Lett., 2011, 2, 782–785 CrossRef CAS.
- M. Gomez-Mendoza, M. L. Marin and M. A. Miranda, J. Phys. Chem. B, 2012, 116, 14776–14780 CrossRef CAS PubMed.
- H. S. P. Rao, A. Desai, I. Sarkar, M. Mohapatra and A. K. Mishra, Phys. Chem. Chem. Phys., 2014, 16, 1247–1256 RSC.
- S. S. Mishra, S. Mohanty, J. Mishra and U. Subuddhi, Langmuir, 2019, 35, 16555–16567 CrossRef CAS PubMed.
- D. W. Fawcett, An Atlas of Fine Structure: The Cell, Its Organelles and Inclusions, 1966 Search PubMed.
- K. Tauchi-Sato, S. Ozeki, T. Houjou, R. Taguchi and T. Fujimoto, J. Biol. Chem., 2002, 277, 44507–44512 CrossRef CAS PubMed.
- F. Wilfling, H. Wang, J. T. Haas, N. Krahmer, T. J. Gould, A. Uchida, J.-X. Cheng, M. Graham, R. Christiano, F. Fröhlich, X. Liu, K. K. Buhman, R. A. Coleman, J. Bewersdorf, R. V. Farese and T. C. Walther, Dev. Cell, 2013, 24, 384–399 CrossRef CAS PubMed.
- A. W. Czarnik, Supramolecular Chemistry, Fluorescence, and Sensing, 1993, pp. 1–9 Search PubMed.
- Y. Zhang, S. Li, H. Zhang and H. Xu, Bioconjugate Chem., 2021, 32, 4–24 CrossRef CAS PubMed.
- C. A. Knudtson and J. R. Dias, Steroids, 2019, 151, 108442 CrossRef CAS PubMed.
- R. A. Bissell, A. P. de Silva, H. Q. N. Gunaratne, P. L. M. Lynch, G. E. M. Maguire and K. R. A. S. Sandanayake, Chem. Soc. Rev., 1992, 21, 187–195 RSC.
- C. Iliopoulos-Tsoutsouvas, R. N. Kulkarni, A. Makriyannis and S. P. Nikas, Expert Opin. Drug Discovery, 2018, 13, 933–947 CrossRef CAS PubMed.
- C. M. Ramírez-Lozano, M. E. Ochoa, P. Labra-Vázquez, N. Farfán and R. Santillan, J. Mol. Struct., 2023, 1272, 606–631 CrossRef.
- J. Li, C.-F. Zhang, S.-H. Yang, W.-C. Yang and G.-F. Yang, Anal. Chem., 2014, 86, 3037–3042 CrossRef CAS PubMed.
- S. A. A. Gawad and M. A. S. Sakr, J. Mol. Struct., 2022, 1248, 131413 CrossRef CAS.
- X. Liu, J. M. Cole, P. G. Waddell, T.-C. Lin, J. Radia and A. Zeidler, J. Phys. Chem. A, 2012, 116, 727–737 CrossRef CAS PubMed.
- S. Ma, S. Du, G. Pan, S. Dai, B. Xu and W. Tian, Aggregate, 2021, 2, e96 CrossRef CAS.
- K. Li, X. Duan, Z. Jiang, D. Ding, Y. Chen, G.-Q. Zhang and Z. Liu, Nat. Commun., 2021, 12, 2376 CrossRef CAS PubMed.
- J. Gierschner and S. Y. Park, J. Mater. Chem. C, 2013, 1, 5818 RSC.
- D. Madenci and S. U. Egelhaaf, Curr. Opin. Colloid Interface Sci., 2010, 15, 109–115 CrossRef CAS.
- R. Arcos-Ramos, M. Maldonado-Domínguez, J. Ordóñez-Hernández, M. Romero-Ávila, N. Farfán and M. del P. Carreón-Castro, J. Mol. Struct., 2017, 1130, 914–921 CrossRef CAS.
- H. Zhang, T. Yu, Y. Zhao, D. Fan, L. Chen, Y. Qiu, L. Qian, K. Zhang and C. Yang, Spectrochim. Acta, Part A, 2008, 69, 1136–1139 CrossRef PubMed.
- T. Steiner, Crystallogr. Rev., 1996, 6, 1–51 CrossRef CAS.
- K. Atkovska, J. Klingler, J. Oberwinkler, S. Keller and J. S. Hub, ACS Cent. Sci., 2018, 4, 1155–1165 CrossRef CAS PubMed.
- H. Tian, A. C. Sedgwick, H.-H. Han, S. Sen, G.-R. Chen, Y. Zang, J. L. Sessler, T. D. James, J. Li and X.-P. He, Coord. Chem. Rev., 2021, 427, 213577 CrossRef CAS.
- C. Hernández-Juárez, G. Morales-Villafaña, F. López-Casillas and A. Jiménez-Sánchez, ACS Sens., 2023, 8, 3076–3085 CrossRef PubMed.
- G. M. Sheldrick, Acta Crystallogr., Sect. A: Found. Crystallogr., 2008, 64, 112–122 CrossRef CAS PubMed.
- C. B. Hübschle, G. M. Sheldrick and B. Dittrich, J. Appl. Crystallogr., 2011, 44, 1281–1284 CrossRef PubMed.
- C. F. Macrae, I. Sovago, S. J. Cottrell, P. T. A. Galek, P. McCabe, E. Pidcock, M. Platings, G. P. Shields, J. S. Stevens, M. Towler and P. A. Wood, J. Appl. Crystallogr., 2020, 53, 226–235 CrossRef CAS PubMed.
- L. J. Farrugia, J. Appl. Crystallogr., 1997, 30, 565–565 CrossRef CAS.
- K. Sivakumar, F. Xie, B. M. Cash, S. Long, H. N. Barnhill and Q. Wang, Org. Lett., 2004, 6, 4603–4606 CrossRef CAS PubMed.
- L. F. Yousif, K. M. Stewart, K. L. Horton and S. O. Kelley, ChemBioChem, 2009, 10, 2081–2088 CrossRef CAS PubMed.
Footnote |
| † Electronic supplementary information (ESI) available: NMR spectra, absorption and fluorescence spectra, crystal data and confocal microscopy images. CCDC 2325000–2325003. For ESI and crystallographic data in CIF or other electronic formats see DOI: https://doi.org/10.1039/d4ob00192c |
| This journal is © The Royal Society of Chemistry 2024 |