
 Open Access Article
 This Open Access Article is licensed under a Creative Commons Attribution-Non Commercial 3.0 Unported Licence
Investigation of the temperature effect on the formation of a two-dimensional self-assembled network at the liquid/solid interface†
Tamara
Rinkovec
 a,
Eveline
Croket
a,
Hai
Cao
b,
Jeremy N.
Harvey
*a and
Steven
De Feyter
*a
a,
Eveline
Croket
a,
Hai
Cao
b,
Jeremy N.
Harvey
*a and
Steven
De Feyter
*a
aDepartement of Chemistry, KU Leuven, Celestijnenlaan 200F, B-3001 Leuven, Belgium. E-mail: steven.defeyter@kuleuven.be; jeremy.harvey@kuleuven.be
bState Key Laboratory of Materials-Oriented Chemical Engineering, College of Chemical Engineering, Nanjing Tech University, Nanjing 211816, China
First published on 29th October 2024
Abstract
In this work, we investigate the temperature effect on the formation of self-assembled molecular networks (SAMNs) at the liquid/solid interface, focusing on an alkylated achiral glycine derivative at the 1-phenyloctane/HOPG interface. Using STM with an in situ heating stage, we comprehensively examine the concentration-temperature phase space for 2D network formation. This study allows us to determine the enthalpic and entropic contributions to the Gibbs free energy (ΔG) of monolayer formation, revealing that the process is enthalpically driven. Moreover, we further develop our previously established Ising code by incorporating temperature dependence, which provides valuable insights into the interplay of enthalpic and entropic factors. Our findings, supported by both experimental and theoretical analyses, demonstrate a strong agreement in thermodynamic parameters, validating our model as a proof of concept for studying temperature effects in SAMN formation. This research underscores the importance of understanding enthalpic and entropic contributions for the successful utilization of 2D molecular self-assembly.
Introduction
Utilizing self-assembled molecular networks (SAMNs) formed at the liquid–solid interface for bottom-up fabrication of nanomaterials or functional devices is a hot topic. SAMNs are networks of molecules, often at the monolayer level and crystalline, that are spontaneously formed, typically on surfaces that are flat at the atomic level. The current state-of-the-art explores various possibilities by studying diverse systems, including metal–organic frameworks (MOFs)1–4 with a range of molecular symmetries and non-covalent interactions, as well as stimuli-responsive systems with varying degrees of responsiveness and structural complexity.5–7 However, while the development of novel nanomaterials remains important, the fundamental understanding of the driving forces for supramolecular self-assembly on surfaces, which lies at the heart of those methodologies, is critical to reaching technological relevance.To assess the forces driving the supramolecular self-assembly, one needs to consider all the enthalpic and entropic contributions to the Gibbs free energy difference between the final state, the adsorbed molecules forming an ordered network on the surface, and the initial state, molecules dissolved in solution. At the liquid–solid interface, this is a nontrivial issue as different experimental variables play a role in the observed molecular behaviour, including solution concentration, type of substrate, choice of solvent and temperature.8–10 It is important to note that not all SAMN structures represent thermodynamic minima, and kinetic factors can also have a significant impact on self-assembly. Therefore, to understand the forces driving the assembly, it is crucial to consider both the kinetics and the thermodynamics of the system.
Lately, the influence of solution concentration on the formation of self-assembled molecular networks (SAMNs) has attracted some research attention.11–13 As the solution concentration determines the chemical potential of the system, a slight variation in its value can cause drastic changes to the on-surface assembly, as observed from the change in the average value of surface coverage. Other literature reports demonstrate that in more complex systems, solution concentration causes the emergence of different phases, and its control is necessary for the appropriate polymorph selection.14–17 As a result, in the mentioned works, studying the effect of concentration allows for a thermodynamic assessment in terms of Gibbs free energy. However, to investigate the separate contributions to the free energy of SAMN formation, a temperature-dependent study is needed.
The detailed thermodynamic assessment of the self-assembly system on surfaces is experimentally possible in several ways. An ideal approach includes a direct measurement of heat exchanged upon molecular adsorption and assembly, such as by utilizing calorimetry techniques.18,19 Alternatively, a Born–Haber cycle was established that allows for indirect quantification of thermodynamic parameters by assessing both the enthalpic and entropic contributions.19–21 The Born–Haber cycle includes independent determinations of the sublimation, solubility and desorption enthalpies for a single choice of a system consisting of the assembling solute, substrate and solvent. While offering the understanding of the subtle balance between different system components, this method was applied only to several systems and has not been widely used due to the complexity and variety of the measurements required.
Some of the first direct measurements of thermodynamic properties from temperature-dependent STM measurements focused on the assessment of structural phase transition processes at the liquid/solid interface, such as the work done by Bellec et al.,14 Gutzler et al.9,22 and Blunt et al.15 But, in general, temperature-dependent STM measurements at a solid–liquid interface are quite rare because of the difficulty in controlling experimental parameters, including solvent evaporation, stability of STM during prolonged temperature exposure or systems being kinetically controlled.8,23,24 To better control the experimental conditions, a novel immersion type of STM (I-STM) was designed to be suitable for long-term experiments at elevated temperatures, characterized by the elimination of solvent evaporation due to an airtight enclosure with a low drift and high resolution.24 Utilizing this machine, the authors studied the solvent-induced polymorphism of trimesic acid (TMA) monolayers on graphite using a series of fatty acids as solvents, quantified the ultra-slow desorption kinetics of 2,6-naphthalene dicarboxylic acid (NDA) monolayers at nonanoic acid–graphite interfaces and analysed the thermodynamics of molecule–substrate interactions by comparing the HOPG to the newly developed substrate, passivated Au(111) with a chemisorbed monolayer of iodine atoms.25–27 Recently, an experimental approach was developed by Gurdumov et al. that utilizes a flow cell connected to a mechanical pump to allow a flux of the solution through the cell.28,29 In this way, the molecules are continuously replenished so the solution concentration remains constant, and does not change due to adsorption and depletion of molecules. This setup was used to examine and quantify the nucleation and growth kinetics of different polymorph formation for Co(II) Octaethylporphyrin (CoOEP) in varying solvents, additionally offering a comparison between two substrates, Au(111) and HOPG.28,29
An alternative method for understanding the thermodynamics of SAMN formation is molecular thermal desorption analysis (MTDA), a method that has been developed using atomic force microscopy to quantify the disassembly enthalpy of the on-surface monolayers by following surface coverage as a function of (annealing) temperature.30 Using MTDA, the disassembly enthalpy change was elaborated using trimesic acid (TMA) and benzene-1,3,5-tricarboxaldehyde, showing that the difference in molecule–molecule interactions in their respective assemblies could be directly quantified from the disassembly enthalpy.
Current research predominantly centres on designing specialized instrumentation with a focus on regulating various variables for studying the SAMNs. While these sophisticated setups enable meticulous and controlled examinations of the thermodynamics of SAMN formation, they remain infrequent due to their complexity. However, a quick literature search shows that many published works in this field call for a thermodynamic assessment, as these studies are crucial for gaining profound insights into the systems under investigation. Given the significance of these investigations, there is a need for a framework that evaluates the thermodynamics of SAMN formation without solely relying on specialized equipment. Instead, a relatively straightforward experimental setup could prove invaluable in bridging the gap and making such studies more accessible and widespread. Here, we propose a simpler and less experimentally challenging way of determining the net enthalpic and entropic contributions to the Gibbs free energy of SAMN formation through temperature-dependent STM measurements. Compared to the Born–Haber cycle or I-STM, this method offers less resolution regarding different contributions to ΔG. However, it offers a more accessible alternative that can provide a solid foundational understanding of self-assembled monolayer formation thermodynamics. When combined with theoretical analysis, this approach can be especially effective, providing a broader perspective on the results and deeper insights into the underlying mechanisms. This proposed method not only helps bridge the gap between complex setups and simpler experimental techniques but also lays the groundwork for further thermodynamic studies in the field.
Therefore, we report a reversible desorption case study of a single component molecular system consisting of an achiral glycine derivative (FGC18, Fig. 1, (9H-fluoren-9-yl)methyl (2-(octadecylamino)-2-oxoethyl)carbamate31), physisorbed at the liquid/solid interface between 1-phenyloctane (1-PO) and highly oriented pyrolytic graphite (HOPG). STM, equipped with an in situ heating stage, was used to collect images at a liquid/solid interface which were used for a comprehensive investigation of the concentration-temperature phase space for the formation of a 2D self-assembled network. STM results were analysed using a relatively straightforward thermodynamic model in order to determine net enthalpic and entropic contributions to the Gibbs free energy associated with the SAMN formation. To gain a comprehensive understanding of these contributions in terms of molecule–molecule and molecule–surface interactions, we aimed to develop a statistical thermodynamic model. This approach was crucial for interpreting the underlying interactions and included reproducing the desorption behaviour using a temperature-dependent Ising model. This model allowed us to evaluate molecular behaviour in terms of contributions from molecular adsorption and intermolecular interactions. The comparison between experimental results and theoretical predictions showed reasonable agreement in both thermodynamic parameters, enabling a meaningful interpretation of the experimental results in the context of intermolecular interactions.
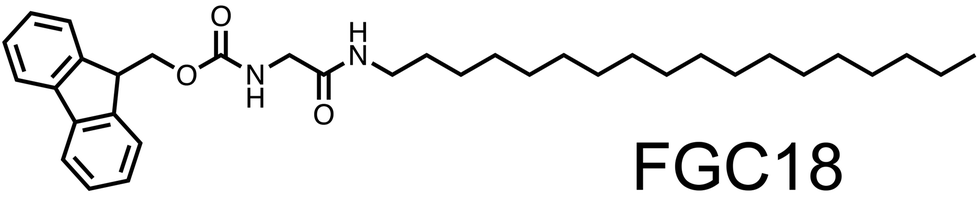 | ||
| Fig. 1 Molecular structure of the studied molecule. | ||
A simple model system was used to serve as a proof of concept, showcasing principles and methodologies for studying the temperature effect in the SAMN formation that can be generally applied to a broad range of molecular systems. These future investigations are important for the successful utilization of 2D molecular self-assembly as they emphasize the relationship between the enthalpic and entropic contributions to the ΔG.
Results and discussion
Choice of the system
The experimental STM setup used for the measurements presented here consists of an in situ temperature control stage. In those STM experiments, the HOPG sample is mounted with a solution cell onto the stage, which consists of a copper base plate with an inbuilt resistive heating element and thermocouple, and the temperature of the heating stage is controlled via a feedback loop using a separate temperature controller. Choosing a suitable molecular model system is crucial for a straightforward thermodynamic assessment.In this work, we chose an achiral glycine derivative at the 1-phenyloctane/HOPG interface as a suitable model system, given its ability to form stable supramolecular networks across a range of concentrations and temperatures.31 This makes it ideal for a variety of STM experiments, allowing for extensive self-assembly studies under varying conditions. Additionally, the use of 1-phenyloctane offers practical advantages aligned with the technical requirements of our experimental setup, particularly at elevated temperatures. For further information, please refer to the ESI.†
Self-assembly of FGC18 at 1-PO/HOPG interface
Self-assembly of FGC18 has previously been studied using STM at the liquid/solid interface,31 and a representation of the SAMN network formed at the 1-PO/HOPG interface is shown in Fig. 2 and reflects a near-rectangular arrangement. In the molecular structure of FGC18, a long (octadecyl) alkyl chain was introduced as an amide at the C-terminus of glycine. From the high-resolution STM images (Fig. 2), it can be observed that on HOPG, the long alkyl chains (dark, striped features) of FGC18 adsorb in an extended geometry and interact with other chains through van der Waals interactions by close packing. The N-terminus of FGC18 that bears a fluorenyl-methyloxy-carbonyl (Fmoc) group stabilizes the self-assembled structure by partaking in π–π interactions through “head”–“head” interactions. The central glycine part of the molecule contains several hydrogen bonding moieties that can additionally stabilize the assembly. However, the details of those interactions are difficult to resolve purely from STM images due to a lack of sub-molecular resolution as the heads of the molecules in the STM images appear as bright features (Fig. 2a and b). | ||
| Fig. 2 (a–f) High-resolution STM images of molecular self-assembly for FGC18 at the 1-phenyloctane/HOPG interface and room temperature (22–23 °C). Imaging parameters: Vbias = −0.800 V, Iset = 80–100 pA. (g and h) Tentative molecular models for type 1 (h) and type 2 (g) packing based on the STM data. | ||
On a larger scale (Fig. 2e and f), the self-assembly of FGC18 exists in two different packing types. In both, the FGC18 molecules self-assemble into columnar structures, with the assembly being stabilized by the close-packing of the alkyl chains and interactions of Fmoc-protected headgroups. In this way, the columns can grow quite large, reaching length scales even up to 300 nm. The interaction of the columns is what differentiates the two types of packing. The more commonly observed is the formation of double rows where two columns interact in a “tail”–“tail” orientation so that the alkyl chain of the two columns interact (type 1, Fig. 2a and c). The second type of packing corresponds to a “head” to “tail” orientation of the columns, where the alkyl chains of one column interact with the Fmoc-protected headgroups of another column (type 2, Fig. 2c and d). Tentative molecular models based on STM data for both packing types are provided in Fig. 2g and h.
The occurrence of both types of packing persists at all the concentrations and temperatures studied in this work. The ratio of single to double rows in the self-assembly of FGC18 remains nearly constant across a range of concentrations (ESI, Fig. S2†), with a slight decrease at higher concentrations, indicating no strong preference for either packing motif. At elevated temperatures, single rows desorb more rapidly than double rows, likely due to their smaller surface area and greater number of domain boundaries (ESI, Fig. S3†). After cooling from a temperature where full desorption occurred, the double-row formation increased slightly, but the total surface coverage showed minimal differences, suggesting these variations are within the margin of error due to the local nature of STM measurements (vide infra, no hysteresis observed).32 Furthermore, analysis of the time evolution of total surface coverage at high concentrations (Fig. S6 in the ESI,†c = 4.0 × 10⁻⁴ mol dm−3) showed no significant changes during STM imaging, indicating a lack of kinetic processes. Overall, these findings support the appropriateness of the thermodynamic assessment, with surface coverage values used for the analysis referring to total surface coverage.
Concentration dependence
To be able to study the temperature dependence of the self-assembly of FGC18, the effect of FGC18 solution concentration on the adsorption behaviour, focusing on the surface coverage, was first evaluated using scanning tunnelling microscopy. Fig. S1 (see ESI†) shows a set of representative STM images for a concentration-dependent series where, for each measurement, an FGC18 solution (50 μL) was deposited at 22 °C (295 K), and the concentration varied in the range from 1.00 × 10⁻⁵ mol dm−3 to 4.00 × 10⁻⁴ mol dm−3. As expected, a decrease in solution concentration leads to a decrease in overall surface coverage.Analysis of STM images yielded a coverage vs. concentration plot, as seen in Fig. 3, and shows a sigmoidal trend which is characteristic of processes with positive cooperativity.33 Defining the critical concentration for the formation of SAMNs on surfaces as the concentration at which the surface coverage is 0.5, the rough estimate of the value of this threshold for FGC18, as determined by a numerical derivation of the experimental dataset, amounts to c1/2 = 5.7 × 10⁻⁵ mol dm−3.11 As previously established,11,12 the dataset of the concentration dependence of the surface coverage of FGC18 was analysed by nonlinear regression using analytical thermodynamic models, including the Langmuir and the Hill model. The main difference between the two adsorption isotherms is the introduction of a molecule–molecule interaction term, a cooperativity factor n (Hill constant), in the Hill model in contrast to the Langmuir model, which assumes noninteracting molecules.33–37 Curves of the best fit for both models are presented as lines in Fig. 3 while the parameters of the Hill fit, including the value of equilibrium constant K representing solution concentration that produces half saturation and the Hill constant, are presented in Table 1. Based on the value of the equilibrium constant K, the Gibbs free energy for the SAMN formation was calculated at 25 °C (298 K) and is presented in Table 1. As expected, the formation of the monolayer for the case of FGC18 is a cooperative and exergonic process, much better described using the Hill model.
 | ||
| Fig. 3 Concentration dependence of the surface coverage of FGC18 studied at the 1-phenyloctane/HOPG interface and room temperature (22–23 °C). ■ experimental data points, —the curves of best fit by the Langmuir adsorption model (blue) and cooperative Hill model (red). Error bars represent standard error of the mean (SEM). | ||
| Molecule | K (mol dm−3) ± SD | n ± SD | ΔSAMG° (kJ mol−1) ± SD |
|---|---|---|---|
| FGC18 | (6.5 ± 0.3) × 10−5 | 2.46 ± 0.01 | −23.87 ± 0.02 |
Regarding the precision of the calculated adsorption parameters, instead of using the standard error of the mean in surface coverage as an error estimate, which can be challenging to assess, we performed a numerical error analysis (see ESI†). Table 1 demonstrates that the value of K and, consequently, the Gibbs free energy exhibit low uncertainty. This can be attributed to the relative ease and precision attained in determining the concentration at half saturation.
Temperature dependence
The main aim of this work is to study the effect of temperature change on SAMN formation. Therefore, three solution concentrations corresponding to a relatively high (or full) coverage at room temperature were chosen for controlled and systematic temperature-dependent measurements. Fig. 4 shows a set of typical STM images for a temperature-dependent series where an FGC18 solution (for c = 4.0 × 10⁻⁴ mol dm−3) was deposited at 22 °C (295 K), and the temperature was increased in steps up to 55 °C (328 K) and then allowed to cool to 30 °C (303 K). | ||
| Fig. 4 (a–f) Representative large-scale STM images for the self-assembly of the FGC18 at the 1-phenyloctane/HOPG interface at different temperatures, as indicated in the panels, and c = 4.00 × 10⁻⁴ mol dm−3. Imaging parameters: Vbias = −0.800 V, Iset = 80–100 pA. For the sake of clarity, empty areas are highlighted in purple. | ||
At 22 °C (295 K), the structure of the networks and the average surface coverage correspond to those observed in the concentration-dependent studies. It can be observed that for samples at higher concentrations and 22 °C, the on-surface structure features smaller domains, a higher density of packing defects and an increased number of domain boundaries (Fig. 4a compared to Fig. S4a and S5a†). On heating to 35 °C (328 K) (Fig. 4c), the average coverage decreases, and the average domain size has, on average, slightly increased for all three concentrations studied. The domain size usually observed at room temperature for FGC18 is around 50 to 100 nm, while upon heating to 35 °C, as observed from the STM images (see Fig. S7 in the ESI†), domains increase in size up to 200 nm. The domain coarsening results from both the changes in solution concentration and the temperature, and as can be seen from the figures, it occurs to a different extent for each of the concentrations studied. As discussed in several works, the growth of the domains indicates that systems try to minimize the number of energetically unfavourable domain boundaries, also known as the 2D Ostwald ripening process.15,38–40
Continuing sequential heating to 45 °C (338 K) leads to a further decrease in surface coverage. For the system at c = 2.0 × 10⁻⁴ mol dm−3 almost full desorption is observed, while for a sample with c = 1.2 × 10⁻⁴ mol dm−3 at this temperature, complete desorption is observed (Fig. S5e†). The average domain size for the system with c = 4.0 × 10⁻⁴ mol dm−3 at 45 °C decreases and the on-surface assembly is observed as smaller, molecular island-type domains (see Fig. S8†). Further heating of the samples to 55 °C (348 K) leads to full desorption for all the concentrations.
Once full desorption occurred, the samples were subjected to a controlled cooling sequence to 30 °C in two steps. Firstly, the two systems of higher concentration were equilibrated to 40 °C (313 K), which permitted molecular re-adsorption and the reformation of the SAMNs to a varying degree of surface coverage. In this case, the assembly is no longer observed by the formation of smaller domains, but rather through the formation of larger, well-ordered domains (Fig. S9†) that can expand over 200 nm–350 nm.
Decreasing the temperature to 30 °C (303 K) led to a further increase in surface coverage for all three concentrations. On average, this was also followed by an additional increase in the domain size (Fig. S10,† >350 nm) maintaining fewer domain boundaries. Still, interestingly the formation of a larger number of smaller domains separated by domain boundaries with a degree of packing defects was also observed (see Fig. S10j–l†).
As can be seen from the STM images presented in this work, upon desorption and while imaging at elevated temperatures, on occasion an unresolved structure appears to form on the surface (for example Fig. S4,b–d, Fig. S7–S10†). The origin of these features remains unclear at this point, but their observation seems to be dependent on the quality of the STM tip. The formation of the features may be attributed to a contamination in the system (originating either from solute or solvent) as well as to dynamic and mobile molecules close to the surface.
The analysis of STM images collected from the temperature-dependent measurements yielded coverage vs. temperature curves, as seen in Fig. 5, with each concentration represented by a different colour and each value of the coverage represented as an average between all images collected for the two samples measured. In the figure, a distinction is made between data points collected upon in situ heating (molecular desorption) and cooling (re-adsorption). The discrepancy in the surface coverage of those data points is relatively low and can be mainly attributed to experimental error due to the local nature of STM measurements. There is no indication of a significant hysteresis that could be attributed to any other process apart from the desorption happening at the interface upon the exposure of the studied system to a temperature modulation.8,15,32 This is of high importance as it signifies the appropriateness of the assumption that thermodynamic equilibrium is maintained for the studied system.
 | ||
| Fig. 5 Temperature dependence of the surface coverage of FGC18 molecules studied for different solution concentrations at 1-phenyloctane/HOPG interface. ■ experimental data points upon in situ desorption, ● experimental data points upon in situ adsorption. Error bars represent standard error of the mean (SEM). | ||
There are several key features of the trends observed in Fig. 5. Firstly, the average surface coverage decreases with an increase in temperature significantly for all studied concentrations, confirming that the molecule-surface and intermolecular interactions stabilizing the SAMN of FGC18 are not particularly strong. Even for the highest measured concentration, increasing the temperature up to 55 °C already leads to full monolayer desorption. Additionally, as seen from Fig. 5, the desorption temperature depends on the solution concentration, i.e. for higher solution concentrations, a higher temperature is needed for this transition. It is important to note that despite the assembly desorbing at relatively low temperatures, the scanning and STM tip motion were not observed to play a role in inducing adsorption/desorption dynamics. Importantly, despite the data exhibiting a higher degree of noise as compared to the concentration-dependent dataset, the trends observed in temperature-dependent surface coverage, as presented in Fig. 5, are sigmoidal in nature, indicative of the cooperative nature of SAMN formation.
The variation in reported surface coverages can be significantly influenced by the substrate, particularly in the sub-monolayer regime. HOPG was selected for all experiments due to its suitability for STM studies of self-assembly, being an extremely flat form of graphite. However, surface defects, such as graphitic terraces, occasionally play a prominent role in SAMN formation. We previously noted these defects’ impact, as they sometimes create reduced surface areas, stabilizing smaller SAMN domains.11,12 Additionally, “empty” areas may contain adsorbed molecules not detectable by STM due to diffusion, so experimental coverage more accurately reflects total molecular island coverage.
For a simple thermodynamic evaluation of the studied systems, a transition temperature is defined as the temperature at which the overall surface coverage equals a fractional coverage of 0.5. Conceptually following the models developed by Bellec et al. and Blunt et al.,14,15 the transition occurs at the point corresponding to (c0, T0), where the change in free energy (ΔG) equals zero. This allows for the description of the equilibrium according to eqn (1):
| ΔG = ΔH0 − T0ΔS = 0 | (1) |
![[thin space (1/6-em)]](https://www.rsc.org/images/entities/char_2009.gif) c0) associated with the release of FGC18 molecules into the solution. The first term (ΔS0) also accounts for any potential desorption of solvent molecules. While the entropy of desorption into solution generally cannot be easily separated into desorption and mixing terms, using the simplified mixing entropy is valid here, given the low concentration regime (c < 10−3 mol dm−3) of the experiments. Altogether, this gives the following modified expression of the van't Hoff equation:
c0) associated with the release of FGC18 molecules into the solution. The first term (ΔS0) also accounts for any potential desorption of solvent molecules. While the entropy of desorption into solution generally cannot be easily separated into desorption and mixing terms, using the simplified mixing entropy is valid here, given the low concentration regime (c < 10−3 mol dm−3) of the experiments. Altogether, this gives the following modified expression of the van't Hoff equation: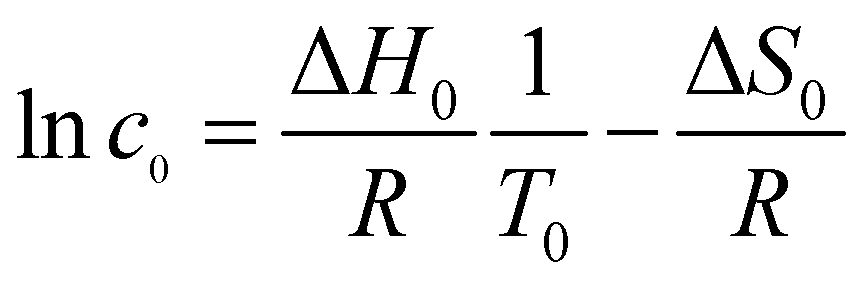 | (2) |
From eqn (2), a plot of lnc0 against 1/T0, where c0 is the solution concentration and T0 the transition temperature, should produce a straight line.
The values for T0 were graphically evaluated from the FGC18 sequential temperature experiments at various concentrations (Fig. 5) as the temperature at which the coverage equals the value of 0.5. For the highest concentration c = 4.0 × 10⁻⁴ mol dm−3 the value of T0 was evaluated to 41 °C (314 K), for c = 2.0 × 10⁻⁴ mol dm−3 to 35 °C (308 K) and for c = 1.2 × 10⁻⁴ mol dm−3 to 28 °C (301 K). Error bars were determined as ±2 °C for the temperature values.
A plot of lnc0 against 1/T0 for the measured data points is presented in Fig. 6. The gradient and intercept of a linear regression fit to these data, employing an errors-in-variables model that accounts for the error in determining T0, were obtained and multiplied by the universal gas constant (R = 8.314 J K−1 mol−1) to give net enthalpy and entropy contributions to the Gibbs free energy of SAMN formation for FGC18 monolayer at the 1-phenyloctane/HOPG interface; these values are presented in Table 2.
 | ||
| Fig. 6 Van't Hoff plot for the self-assembly of FGC18 molecules at 1-phenyloctane/HOPG interface. ● experimental data points, —linear fit. | ||
| ΔHnet ± SE / kJ mol−1 | ΔSnet ± SE / J K−1 mol−1 | −TΔSnet ± SE / kJ mol−1 |
|---|---|---|
| −72 ± 21 | −164 ± 69 | 48 ± 20 |
According to eqn (2) and Fig. 6, the trend observed from the van't Hoff plot follows a straight line of a negative slope showing that the SAMN network formation for FGC18 is an exothermic process. As evaluated, the net enthalpic contribution, ΔHnet, amounts to −72 ± 21 kJ mol−1, while the overall entropic contribution calculated at 25 °C, −TΔSnet amounts to 48 ± 20 kJ mol−1. A comparison of those values demonstrates that for FGC18 the entropic penalty does not exceed the enthalpic gain upon network formation, therefore making it an enthalpically driven process. The overall Gibbs free energy for the process at 25 °C is estimated to be ΔG = −23 ± 29 kJ mol−1.
Although the STM data seem to give a good estimate of the thermodynamic parameters as supported by the value of coefficient of determination in the van't Hoff plot, it should be noted that these absolute values of the parameters should be used as qualitative prediction only. The enthalpic contribution is evaluated from a slope of the van't Hoff plot as shown in eqn (2) and so to obtain an accurate value of the enthalpic contribution, a precise determination of T0 is required. However, due to the noise and quality of data presented in Fig. 5, the experimental estimate for the enthalpic contribution does not allow for a more precise estimation of error. Given this uncertainty in the value of ΔHnet and the enthalpy–entropy compensation (eqn (2)), the corresponding entropic contribution is also fairly uncertain, falling within the range of −164 ± 69 J K−1 mol−1.
In order to assess the accuracy of the method used in our work as well as to provide context for the expected thermodynamic parameter values, we conducted an extensive literature review and highlighted the most relevant studies.19–21,28,30,41–47 Gurdumov et al. conducted STM experiments on self-assembled cobalt(II) octaethylporphrins polymorphs, estimating the Gibbs free energy of adsorption for the near-rectangular polymorph at approximately −29.7 kJ mol−1.28 Similarly, a study on DNA fragment adsorption reported Gibbs free energy values spanning from −13 to −53 kJ mol−1.41 Moreover, investigations into enthalpic and entropic contributions to ΔG have revealed significant variability depending on the molecular system studied. For instance, adsorption of n-dotriacontane (C32H66) on different graphitic substrates yielded Gibbs free energy values from −23.9 kJ mol−1 to −27.2 kJ mol−1, with associated enthalpies ranging from −59 kJ mol−1 to −71.6 kJ mol−1 and entropies from −126 J K−1 mol−1 to −142 J K−1 mol−1.42 Further studies, such as those focused on the desorption of a benzene-1,3,5-tricarboxaldehyde monolayer, estimated enthalpy values of 104 kJ mol−1 with an entropy of approximately 160 J K−1 mol−1.30 Additionally, contributions to ΔG for monolayer formation have been calculated using various approaches, showcasing the importance of solvent effects in the formation of SAMNs.48,49
Overall, these findings align well with our thermodynamic approach, with the net enthalpy gain of −72 kJ mol−1 for FGC18 being comparable to previously studied systems. As seen from the literature reports, the enthalpic contribution depends on a plethora of parameters, including intermolecular interactions, molecule–substrate interactions as well as solvent–substrate and molecule–solvent interactions. A different balance between those factors is reflected in a relatively large range of values for the enthalpic contribution. The net entropy cost (TΔS0) of ∼49 kJ mol−1 derived from our work, accounts for the overall entropy change for the network formation, thus including the solvation processes, which is similar to the previous studies using different methodologies.15,19–21,24,30 Our estimate of the entropy change associated with monolayer formation is thereby −164 J K−1 mol−1, though with large uncertainty. A rule of thumb known from quantum chemistry,50,51 approximates −TΔS change for gas–phase molecules to about 10 kcal mol−1 (∼42 kJ mol−1) at room temperature for changing molecularity by one. This corresponds to a ΔS value of about −140 J K−1 mol−1 and is due to the loss of the molecule's translational and rotational degrees of freedom. In the case of FGC18, since the process happens in solution, the entropy also has contributions arising from the desolvation of the surface and the solute. However, by comparing the two values, it seems that the process of desolvation likely does not make a major contribution to the entropy of SAMN formation.
So far, we have demonstrated that a relatively simple experimental STM setup can be used for a thorough and fundamental assessment of the net enthalpic and entropic contributions to the Gibbs free energy of SAMN. This assessment can be carried out effectively when studying molecular systems that are well-known and while maintaining precise control over solution concentration and solvent evaporation. The advantages of this approach include its relative ease and speed of measurements, enabling the study of a wide range of molecular systems. However, for investigating specific aspects of the temperature effect, such as kinetics in the early stages of SAMN formation, slow processes of SAMN formation, polymorph transitions, or systems where solvent evaporation is a concern, alternative experimental setups become necessary and more suitable.23–26,28,29
Numerical modelling of the temperature dependence using the Ising model
The experimental STM approach enabled the determination of net thermodynamic contributions to the Gibbs free energy for the system under study. Yet, to fully grasp the implications of these numerical results, a more detailed analysis is warranted. A comprehensive method for achieving this understanding is to develop a statistical thermodynamics model, which involves precisely defining the interactions between parts of the system. By comparing the predictions of this model with the experimental data, we can elucidate the underlying molecular interactions and their respective contributions. This comparative analysis allows for a more nuanced interpretation of the thermodynamic values, providing deeper insights into the mechanisms governing the observed molecular self-assembly.In our previous work, a 2D Ising model was developed to describe molecular self-assembly on surfaces, where a rectangular 2D lattice represents the ideal (defect-free) surface filled with molecules, and the model characterises isotropic nearest-neighbour interactions.12 The model, as shown by eqn (3), has two parameters, the free energy of molecule binding to a site with no neighbours (μ°) and the free energy gain associated with nearest-neighbour interactions (J). To further evaluate the overall temperature dependence of the Ising model, the temperature dependence of those free energy terms must also be considered. This is done by assigning an enthalpic and entropic (eqn (4) and (5)) contribution to each parameter, which are then recalculated at each temperature.
To study the temperature dependence of the Ising model, the previously developed, in-house Monte Carlo (MC) code was slightly adapted. For this, the adsorption energy term, μ°, was expanded according to eqn (4) into an enthalpy term  , encompassing contributions associated with molecule–substrate, molecule–solvent and solvent–substrate interactions, and an entropy term
  , with the latter associated with changes in translational and rotational entropy of the molecule (vibrational and conformational entropy effects may also intervene to some extent), as well as of the solvent molecules. The molecule–molecule interaction term, J, (in the nearest-neighbour approach) can be further evaluated into enthalpic and entropic terms, according to eqn (5). In a first approximation, which is necessary due to limited and imperfect data, the entropy change resulting from molecule–molecule interactions has been assumed here to be negligible. As a result, this parameter is approximated to contribute only to the enthalpy term (JH), while any entropy associated with molecule–molecule interactions is accounted for, at least approximately, in the entropy term for molecule adsorption. Thus,
  includes all the contributions to the entropy, including interactions between all the different components of the system, including solvent, substrate, and the assembling molecules.
 | (3) |
 | (4) |
| J = JH − TJS = JH | (5) |
Using the modified MC code, the effect of temperature change on the coverage vs. concentration curves was simulated for the range of temperatures between 298.15 K and 313.15 K to parallel the temperatures used in experimental STM measurements. The increase in the temperature causes a significant increase in the critical concentration, which is reflected as a shift of the curve to the right, as seen in Fig. 7. This trend is expected as, due to the increase in temperature, the system has more thermal energy available, changing the rates of molecular adsorption and desorption processes at the interface, thereby shifting the equilibrium to the higher concentration regimes. As can be seen from Fig. 7, the coverage vs. concentration curves when the molecule–molecule interaction term is set to JH = 4.0 kJ mol−1 produce a sigmoidal curve with a sharp transition from ‘empty’ to ‘full’ surface. Simulations of the MC code were also done for lower values of JH and are presented in Fig. S15 in the ESI.† Notably, decreasing the value of molecule–molecule interactions makes the transition from ‘empty’ to ‘full’ surface more gradual, even more pronounced at higher temperatures.
 | ||
Fig. 7 Coverage vs. concentration curves obtained by Monte Carlo simulations of the 2D Ising model adopted for self-assembly on surfaces as a function of temperature (d = 10, JH = 4.0 kJ mol−1, 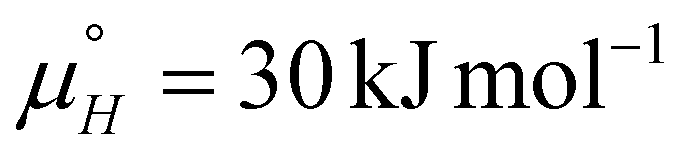 , ,  ). All the simulations were produced using the same number of equilibration and production MC sweeps (Neq = 10000, Nprod = 8000). ). All the simulations were produced using the same number of equilibration and production MC sweeps (Neq = 10000, Nprod = 8000). | ||
Finally, the MC code was modified into a global optimization problem to find the best-fit Ising parameters that minimise the squared sum of residuals for all the experimental dataset simultaneously, including temperature and concentration dependent results. The values of the Ising parameters that represent the global fit are given in Table 3 and have been used to calculate the curves in Fig. 8. We note that the experimental uncertainties mentioned above inevitably restrict the accuracy of this fitting process, and also note that a broad range of rather different values of the parameters JH,  and
and  lead to qualitatively similar agreement with the experimental data points.
 | ||
| Fig. 8 Global best-fit curves obtained by Monte Carlo simulations of the 2D Ising model adopted for surface self-assembly (d = 20): (a) coverage vs. temperature dataset, (b) coverage vs. concentration dataset. All the simulations were produced using the same number of equilibration and production MC sweeps (Neq = 12000, Nprod = 8000). | ||
| Global fit |
|
|
|
J H /kJ mol−1 |
|---|---|---|---|---|
| −38.0 | −52.3 | 15.5 | 2.798 |


Despite the numerical challenges associated with obtaining highly accurate values, even using the present simple approach, the 2D Ising model does shows that SAMN formation is an enthalpically driven process. The enthalpy of adsorption of a single molecule, on a lattice position with no near-neighbours, is estimated to be −38.0 kJ mol−1. For the monolayer formation, additional enthalpic stabilization arises from the molecule–molecule interaction and is maximal when all four neighbours are present. In that case, the maximal enthalpic contribution (= 4JH) from the near-neighbour interactions as obtained from the fitting is about −11 kJ mol−1. In total, the overall enthalpic contribution from the molecular adsorption and near-neighbour interactions sums to −49 kJ mol−1. The values of entropic contributions to the overall Gibbs free energy of SAMN formation are found to be close to −52 J K−1 mol−1. Evaluated at 25 °C, the entropic contribution to the free energy of single molecule adsorption is around 15.5 kJ mol−1.
Despite potential concerns about the quality of the Ising fit to the experimental datasets, the extracted best estimates clearly affirm the favourable enthalpic and unfavourable entropic contributions to the free energy of monolayer formation. Given the uncertainties in the experimental data, the Ising fit (Table 3) is completely consistent with the parameters extracted from van't Hoff plot (Table 2). Moreover, the Ising fit additionally reveals that the molecule–molecule interaction in monolayer formation amounts to the order of several kJ mol−1.
The calculated values for the Ising parameters provide a robust representation of the experimentally observed trends when assessing enthalpic and entropic contributions to the overall Gibbs free energy of SAMN formation. This holds significant importance as it provides invaluable insights into the intricate interplay between molecule–substrate and molecule–molecule interactions. Consequently, at this point, the Ising code emerges as a robust and indispensable tool for the comprehensive thermodynamic evaluation of processes unfolding at the liquid/solid interface.
Conclusions
In conclusion, an investigation of the influence of concentration and temperature on the formation of a self-assembled network of FGC18 molecules at the 1-phenyloctane/HOPG interface was performed. The analysis of the concentration-dependent results, using different adsorption isotherms, confirmed the process of SAMN formation for FGC18 to be cooperative. Additionally, evaluating the temperature effect in the formation of the SAMN resulted in determining the enthalpy and entropy change associated with the network formation. These results highlight that a relatively simple experimental STM setup can be utilised to estimate the thermodynamic factors at play in the 2D self-assembly at the liquid/solid interface, provided that the control over solution concentration and solvent evaporation is established. However, for a more detailed thermodynamic assessment the use of more suitable experimental setups is recommended.Additionally, the temperature dependence was evaluated by expanding the previously developed 2D Ising model to allow additional insights into the temperature dependence of the contributions to the Gibbs free energy arising from the molecule–surface and molecule–molecule interactions. A comparison between the experimental results and the model shows a very good agreement even in the most basic approach.
The methods presented here present a widely applicable technique for a complete thermodynamic characterization of molecular self-assembly in 2D. This work is expected to serve as a proof of concept and a foundation for further studies expanding the knowledge of fundamental thermodynamic insights at the liquid/solid interface.
Data availability
The data supporting this article have been included as part of the ESI.† Additional data for this article, including concentration and temperature dependent STM imaging are available at KU Leuven RDR at https://doi.org/10.48804/HWIQSX. The Ising code for can be found at gitlab.kuleuven.be: https://gitlab.kuleuven.be/u0127422/2d-ising-model-surface-self-assembly.git.Conflicts of interest
There are no conflicts to declare.Acknowledgements
Funding from KU Leuven – Internal funds (C14/23/090) and Research Foundation Flanders (FWO) (G0H2122N via EOS 40007495) is acknowledged. T. R. also acknowledges FWO for a PhD fellowship for fundamental research (fellowship number: 11F2422N).References
- B. S. Pilgrim and N. R. Champness, Metal–Organic Frameworks and Metal–Organic Cages – A Perspective, ChemPlusChem, 2020, 85(8), 1842–1856, DOI:10.1002/cplu.202000408.
- S. L. Griffin and N. R. Champness, A Periodic Table of Metal-Organic Frameworks, Coord. Chem. Rev., 2020, 414, 213295, DOI:10.1016/j.ccr.2020.213295.
- G. Chakraborty, I.-H. Park, R. Medishetty and J. J. Vittal, Two-Dimensional Metal-Organic Framework Materials: Synthesis, Structures, Properties and Applications, Chem. Rev., 2021, 121(7), 3751–3891, DOI:10.1021/acs.chemrev.0c01049.
- J.-H. Dou, M. Q. Arguilla, Y. Luo, J. Li, W. Zhang, L. Sun, J. L. Mancuso, L. Yang, T. Chen, L. R. Parent, G. Skorupskii, N. J. Libretto, C. Sun, M. C. Yang, P. V. Dip, E. J. Brignole, J. T. Miller, J. Kong, C. H. Hendon, J. Sun and M. Dincă, Atomically Precise Single-Crystal Structures of Electrically Conducting 2D Metal–Organic Frameworks, Nat. Mater., 2021, 20(2), 222–228, DOI:10.1038/s41563-020-00847-7.
- G. Velpula, J. Teyssandier, S. De Feyter and K. S. Mali, Nanoscale Control over the Mixing Behavior of Surface-Confined Bicomponent Supramolecular Networks Using an Oriented External Electric Field, ACS Nano, 2017, 11(11), 10903–10913, DOI:10.1021/acsnano.7b04610.
- S. Shaik, D. Mandal and R. Ramanan, Oriented Electric Fields as Future Smart Reagents in Chemistry, Nat. Chem., 2016, 8(12), 1091–1098, DOI:10.1038/nchem.2651.
- S. D. Fried and S. G. Boxer, Electric Fields and Enzyme Catalysis, Annu. Rev. Biochem., 2017, 86(1), 387–415, DOI:10.1146/annurev-biochem-061516-044432.
- U. Mazur and K. W. Hipps, Kinetic and Thermodynamic Processes of Organic Species at the Solution-Solid Interface: The View through an STM, Chem. Commun., 2015, 51(23), 4737–4749, 10.1039/c4cc09840d.
- R. Gutzler, L. Cardenas and F. Rosei, Kinetics and Thermodynamics in Surface-Confined Molecular Self-Assembly, Chem. Sci., 2011, 2(12), 2290–2300, 10.1039/c1sc00531f.
- D. Cui, J. M. Macleod and F. Rosei, Probing Functional Self-Assembled Molecular Architectures with Solution/Solid Scanning Tunnelling Microscopy, Chem. Commun., 2018, 54(75), 10527–10539, 10.1039/c8cc04341h.
- T. Rinkovec, D. Kalebic, M. Van der Auweraer, W. Dehaen, J. N. Harvey and S. De Feyter, Quantifying the Cooperative Process of Molecular Self-Assembly on Surfaces: A Case Study of Isophthalic Acids, J. Phys. Chem. C, 2023, 127(4), 2025–2034, DOI:10.1021/acs.jpcc.2c07560.
- T. Rinkovec, D. Kalebic, W. Dehaen, S. Whitelam, J. Harvey and S. De Feyter, On, the Origin of Cooperativity Effects in the Formation of Self-Assembled Molecular Networks at the Liquid/Solid Interface, Chem. Sci., 2024, 15, 6076–6087, 10.1039/D4SC00284A.
- Z. Tessari, T. Rinkovec and S. De Feyter, Chiral, Induction in Substrate-Supported Self-Assembled Molecular Networks under Nanoconfinement Conditions, Nanoscale Adv., 2024, 6(3), 892–901 RSC.
- A. Bellec, C. Arrigoni, G. Schull, L. Douillard, C. Fiorini-Debuisschert, F. Mathevet, D. Kreher, A. J. Attias and F. Charra, Solution-Growth Kinetics and Thermodynamics of Nanoporous Self-Assembled Molecular Monolayers, J. Chem. Phys., 2011, 134(12), 1–7, DOI:10.1063/1.3569132.
- M. O. Blunt, J. Adisoejoso, K. Tahara, K. Katayama, M. Van der Auweraer, Y. Tobe and S. De Feyter, Temperature-Induced Structural Phase Transitions in a Two-Dimensional Self-Assembled Network, J. Am. Chem. Soc., 2013, 135(32), 12068–12075, DOI:10.1021/ja405585s.
- K.-W. Park, J. Adisoejoso, J. Plas, J. Hong, K. Müllen and S. De Feyter, Self-Assembly, Behavior of Alkylated Isophthalic Acids Revisited: Concentration in Control and Guest-Induced Phase Transformation, Langmuir, 2014, 30(50), 15206–15211, DOI:10.1021/la5040849.
- R. Gatti, J. M. MacLeod, J. A. Lipton-Duffin, A. G. Moiseev, D. F. Perepichka and F. Rosei, Substrate, Molecular Structure, and, Solvent Effects in 2D Self-Assembly via Hydrogen and Halogen Bonding, J. Phys. Chem. C, 2014, 118(44), 25505–25516, DOI:10.1021/jp507729w.
- R. A. Barnard and A. J. Matzger, Functional Group Effects on the Enthalpy of Adsorption for Self-Assembly at the Solution/Graphite Interface, Langmuir, 2014, 30(25), 7388–7394, DOI:10.1021/la5004287.
- W. Song, N. Martsinovich, W. M. Heckl and M. Lackinger, Born–Haber Cycle for Monolayer Self-Assembly at the Liquid–Solid Interface: Assessing the Enthalpic Driving Force, J. Am. Chem. Soc., 2013, 135(39), 14854–14862, DOI:10.1021/ja407698t.
- W. Song, N. Martsinovich, W. M. Heckl and M. Lackinger, Thermodynamics of Halogen Bonded Monolayer Self-Assembly at the Liquid-Solid Interface, Chem. Commun., 2014, 50(88), 13465–13468, 10.1039/c4cc06251e.
- W. Song, N. Martsinovich, W. M. Heckl and M. Lackinger, Thermodynamics of 4,4′-Stilbenedicarboxylic Acid Monolayer Self-Assembly at the Nonanoic Acid-Graphite Interface, Phys. Chem. Chem. Phys., 2014, 16(26), 13239–13247, 10.1039/c4cp01147c.
- R. Gutzler, T. Sirtl, J. F. Dienstmaier, K. Mahata, W. M. Heckl, M. Schmittel and M. Lackinger, Reversible Phase Transitions in Self-Assembled Monolayers at the Liquid−Solid Interface: Temperature-Controlled Opening and Closing of Nanopores, J. Am. Chem. Soc., 2010, 132(14), 5084–5090, DOI:10.1021/ja908919r.
- A. Jahanbekam, U. Mazur and K. W. Hipps, A New Variable Temperature Solution-Solid Interface Scanning Tunneling Microscope, Rev. Sci. Instrum., 2014, 85(10), 103701, DOI:10.1063/1.4896475.
- O. Ochs, W. M. Heckl and M. Lackinger, Immersion-Scanning-Tunneling-Microscope for Long-Term Variable-Temperature Experiments at Liquid-Solid Interfaces, Rev. Sci. Instrum., 2018, 89(5), 053707, DOI:10.1063/1.5030407.
- O. Ochs, M. Hocke, S. Spitzer, W. M. Heckl, N. Martsinovich and M. Lackinger, Origin of Solvent-Induced Polymorphism in Self-Assembly of Trimesic Acid Monolayers at Solid–Liquid Interfaces, Chem. Mater., 2020, 32(12), 5057–5065, DOI:10.1021/acs.chemmater.0c00827.
- O. Ochs, N. Martsinovich, W. M. Heckl and M. Lackinger, Quantifying the Ultraslow Desorption Kinetics of 2,6-Naphthalenedicarboxylic Acid Monolayers at Liquid–Solid Interfaces, J. Phys. Chem. Lett., 2020, 11(17), 7320–7326, DOI:10.1021/acs.jpclett.0c01882.
- A. Badami-Behjat, P. S. Deimel, F. Allegretti, E. Ringel, K. Mahata, M. Schmittel, J. V. Barth, W. M. Heckl and M. Lackinger, Versatile Role of Molecule-Surface Interactions for Monolayer Self-Assembly at Liquid-Solid Interfaces: Substrate-Induced Polymorphism, Thermodynamic Stability, and New Polymorphs, Chem. Mater., 2022, 34(19), 8876–8884, DOI:10.1021/acs.chemmater.2c02177.
- K. Gurdumov, U. Mazur and K. W. Hipps, Self-Assembly Dynamics and Stability through Concentration Control at the Solution/HOPG Interface, J. Phys. Chem. C, 2022, 126(30), 12916–12927, DOI:10.1021/acs.jpcc.2c03766.
- K. Gurdumov, U. Mazur and K. W. Hipps, Influences on the Dynamics and Stability of Self-Assembly: Solvent, Substrate, and Concentration, J. Phys. Chem. C, 2022, 126(46), 19904–19915, DOI:10.1021/acs.jpcc.2c06013.
- V. Mishra, P. Saha and T. G. Gopakumar, Measuring the Intermolecular Interactions in Molecular Patterns on Surfaces Using Microscopy, J. Phys. Chem. C, 2021, 125(1), 602–609, DOI:10.1021/acs.jpcc.0c09787.
- H. Cao and S. De Feyter, Amplification, of Chirality in Surface-Confined Supramolecular Bilayers, Nat. Commun., 2018, 9(1), 3416, DOI:10.1038/s41467-018-05962-3.
- C. Kulkarni, E. W. Meijer and A. R. A. Palmans, Cooperativity Scale: A Structure–Mechanism Correlation in the Self-Assembly of Benzene-1,3,5-Tricarboxamides, Acc. Chem. Res., 2017, 50(8), 1928–1936, DOI:10.1021/acs.accounts.7b00176.
- D. I. Cattoni, O. Chara, S. B. Kaufman and F. L. González Flecha, Cooperativity, in Binding Processes: New Insights from Phenomenological Modeling, PLoS One, 2015, 10(12), e0146043, DOI:10.1371/journal.pone.0146043.
- H. Swenson and N. P. Stadie, Langmuir's Theory of Adsorption: A Centennial Review, Langmuir, 2019, 35(16), 5409–5426, 10.1039/C7CC06110B.
- C. A. Hunter and H. L. Anderson, What Is Cooperativity?, Angew. Chem., Int. Ed., 2009, 48(41), 7488–7499, DOI:10.1002/anie.200902490.
- L. K. S. von Krbek, C. A. Schalley and P. Thordarson, Assessing Cooperativity in Supramolecular Systems, Chem. Soc. Rev., 2017, 46(9), 2622–2637, 10.1039/C7CS00063D.
- Y. B. Torkia, M. Khalfaoui and A. B. Lamine, On the Use of the Hill's Model as Local Isotherm in the Interpretation of the Behaviour of the Adsorption Energy Distributions, IOSR J. Appl. Phys., 2014, 6(3), 62–73, DOI:10.9790/4861-06316273.
- J. J. De Yoreo, Principles of Crystal Nucleation and Growth, Rev. Mineral. Geochem., 2003, 54(1), 57–93, DOI:10.2113/0540057.
- D. Erdemir, A. Y. Lee and A. S. Myerson, Nucleation of Crystals from Solution: Classical and Two-Step Models, Acc. Chem. Res., 2009, 42(5), 621–629, DOI:10.1021/ar800217x.
- S. Karthika, T. K. Radhakrishnan and P. Kalaichelvi, A Review of Classical and Nonclassical Nucleation Theories, Cryst. Growth Des., 2016, 16(11), 6663–6681, DOI:10.1021/acs.cgd.6b00794.
- Z. E. Hughes, G. Wei, K. L. M. Drew, L. Colombi Ciacchi and T. R. Walsh, Adsorption of DNA Fragments at Aqueous Graphite and Au(111) via Integration of Experiment and Simulation, Langmuir, 2017, 33(39), 10193–10204, DOI:10.1021/acs.langmuir.7b02480.
- A. J. Groszek, Selective Adsorption at Graphite/Hydrocarbon Interfaces, Proc. R. Soc. London, Ser. A, 1970, 314(1519), 473–498, DOI:10.1098/rspa.1970.0019.
- A. Bhattarai, K. Marchbanks-Owens, U. Mazur and K. W. Hipps, Influence of the Central Metal Ion on the Desorption Kinetics of a Porphyrin from the Solution/HOPG Interface, J. Phys. Chem. C, 2016, 120(32), 18140–18150, DOI:10.1021/acs.jpcc.6b05964.
- K. N. Johnson, K. W. Hipps and U. Mazur, Quantifying Reversible Nitrogenous Ligand Binding to Co(II) Porphyrin Receptors at the Solution/Solid Interface and in Solution, Phys. Chem. Chem. Phys., 2020, 22(42), 24226–24235, 10.1039/D0CP04109B.
- J. D. Thrower, E. E. Friis, A. L. Skov, L. Nilsson, M. Andersen, L. Ferrighi, B. Jørgensen, S. Baouche, R. Balog, B. Hammer and L. Hornekær, Interaction between Coronene and Graphite from Temperature-Programmed Desorption and DFT-VdW Calculations: Importance of Entropic Effects and Insights into Graphite Interlayer Binding, J. Phys. Chem. C, 2013, 117(26), 13520–13529, DOI:10.1021/jp404240h.
- M. Roos, A. Breitruck, H. E. Hoster and R. J. Behm, Entropic Stabilization of Large Adsorbates on Weakly Binding Substrates—a Thermal Desorption and Scanning Tunneling Microscopy Study, Phys. Chem. Chem. Phys., 2010, 12(4), 818–822, 10.1039/B920481D.
- N. Singh, U. Sanyal, J. L. Fulton, O. Y. Gutiérrez, J. A. Lercher and C. T. Campbell, Quantifying Adsorption of Organic Molecules on Platinum in Aqueous Phase by Hydrogen Site Blocking and in Situ X-Ray Absorption Spectroscopy, ACS Catal., 2019, 9(8), 6869–6881, DOI:10.1021/acscatal.9b01415.
- A. Della Pia, D. Luo, R. Blackwell, G. Costantini and N. Martsinovich, Molecular Self-Assembly of Substituted Terephthalic Acids at the Liquid/Solid Interface: Investigating the Effect of Solvent, Faraday Discuss., 2017, 204, 191–213, 10.1039/C7FD00112F.
- A. Budi, S. L. S. Stipp and M. P. Andersson, Calculation of Entropy of Adsorption for Small Molecules on Mineral Surfaces, J. Phys. Chem. C, 2018, 122(15), 8236–8243, DOI:10.1021/acs.jpcc.7b11860.
- L. Watson and O. Eisenstein, Entropy Explained: The Origin of Some Simple Trends, J. Chem. Educ., 2002, 79(10), 1269, DOI:10.1021/ed079p1269.
- J. N. Harvey, F. Himo, F. Maseras and L. Perrin, Scope and Challenge of Computational Methods for Studying Mechanism and Reactivity in Homogeneous Catalysis, ACS Catal., 2019, 9(8), 6803–6813, DOI:10.1021/acscatal.9b01537.
Footnote |
| † Electronic supplementary information (ESI) available. See DOI: https://doi.org/10.1039/d4nr02600d |
| This journal is © The Royal Society of Chemistry 2024 |