 Open Access Article
Creative Commons Attribution 3.0 Unported Licence
“Clicking” trimeric peptides onto hybrid T8POSS nanocages and identifying synthesis limitations†
Lewis R.
Anderson
 ae,
Ann P.
Hunter
 b,
Matthew J.
Kershaw
 c,
Sergey Y.
Bylikin
c,
James
Bowen
c,
Sergey Y.
Bylikin
c,
James
Bowen
 d,
Peter G.
Taylor
 c,
Martin A.
Birchall
a and
Nazia
Mehrban
 *e
*e
aUniversity College London, Ear Institute, 332 Grays Inn Rd, London WC1X 8EE, UK
bNMSF, Swansea University Medical School, Singleton Park, Swansea, SA2 8PP, UK
cThe Open University, School of Life, Health & Chemical Sciences, Walton Hall, Kents Hill, Milton Keynes MK7 6AA, UK
dThe Open University, School of Engineering & Innovation, Walton Hall, Kents Hill, Milton Keynes MK7 6AA, UK
eUniversity of Bath, Department of Life Sciences, Claverton Down, Bath BA2 7AX, UK. E-mail: nm2051@bath.ac.uk
First published on 11th July 2024
Abstract
Macromolecule branching upon polyhedral oligomeric silsesquioxanes (POSS) via “click” chemistry has previously been reported for promoting natural biological responses in vitro, particularly when regarding their demonstrated biocompatibility and structural robustness as potential macromolecule anchoring points. However, “clicking” of large molecules around POSS structures uncovers two main challenges: (1) a synthetic challenge encompassing multi-covalent attachment of macromolecules to a single nanoscale-central position, and (2) purification and separation of fully adorned nanocages from those that are incomplete due to their similar physical characteristics. Here we present peptide decoration to a T8POSS nanocage through the attachment of azido-modified trimers. Triglycine- and trialanine-methyl esters “clicked” to 97% and 92% completion, respectively, resulting in 84% and 68% yields of the fully-adorned octamers. The “clicks” halt within 27-h of the reaction time, and efforts to further increase the octamer yield were of negligible benefit. Exploration of reaction conditions reveals multiple factors preventing full octa-arm modification to all available POSS nanocages, and offers insights into macromolecule attachment between both peptides and small inorganic-organic structures, all of which require consideration for future work of this nature.
1. Introduction
Symmetrical three-dimensional structures of polyhedral oligomeric silsesquioxanes (POSS) have the empirical formula (R-SiO1.5), and consist of six (T6) to twelve (T12) silica junctions which may be functionally modified at each vertex.1–5 These inorganic–organic hybrid materials of cage-like structure have attracted significant attention due to their unique nanoscale architecture and multi-functionality which offers promise for a wide range of scientific and engineering applications.6–8 In particular, their biocompatibility, molecular stability, and relative ease of modification render POSS suitable for use in nanomedicine, tissue engineering, and drug delivery systems.9,10In drug delivery applications, demonstration of POSS nanocage transportation through transmembrane and vascular pores offers prospects for their cellular and tissue uptake,11 whilst their thermal resistance, oxidation stability, and surface hardening properties demonstrate suitability for delivering drug loads when integrated into polymeric matrices.12 This has led to their utilisation as core–shell POSS-poly(ethylene glycol) nanoparticles for encapsulating insulin,13 and development of POSS-peptide dendrimer nanoparticles, with dual targeting and pH-sensitive capabilities, for anticancer therapy.14
POSS nanocages have also been successfully integrated into nanocomposites for tissue engineering applications,15–17 as scaffolds within chitosan/Si-doped-nanohydroxyapatite-particles/zein/POSS bilayers for osteochondral tissue regeneration,18 and POSS-polysaccharide-polyphosphate hybrid hydrogels for cartilage regeneration.19 Furthermore, the distinct features of POSS nanocages have been incorporatedin biological applications including; photodynamic treatment, bioimaging, and contrast agent administration, all owing to their tailorable functionality.20–22
One possible strategy for functionalising POSS is through the introduction of outreaching alkynes at each of their Si vertices to facilitate “click” reactions with azide-modified secondary structures.23 The Cu(I)-catalysed azide–alkyne cycloaddition (CuAAC) reaction, or “click” chemistry, has drawn substantial attention due to its high efficiency and consistent ability to join molecular building blocks.24–26 The capacity of alkyne-modified POSS to undergo efficient and selective reactions with azide-functionalised molecules makes it an attractive candidate for the construction of large hybrid molecules through “click” chemistry, thereby allowing attachment of a range of functional groups to create complex and versatile materials.27,28 Jafari et al. (2023) used this strategy to synthesise a hyperbranched dendrimer of polyglycerol with cholesterol termini while using T8[N-propyl-hex-5-ynamide]8 (“POSS-alkyne”) as the central building block (“POSS-HPG@Chol”).29 This dendrimer was designed to hold eight HPG@Chol macromolecules, creating a large hybrid molecule for low toxicity antimycotic drug development. However, a challenge was highlighted in attaining a complete reaction with all eight HPG@Chol macromolecules, resulting in a hexamer POSS-HPG@Chol rather than the desired octamer, as indicated through the product's molecular weight. This presents a particular challenge if the POSS nanocages are used to synthesise large molecules for biological characterisation studies and when full octa-branching is necessary for product functionality/efficacy.
Common issues for any reaction between POSS nanocages and large molecules include impurities and side reactions, which are amplified when adding the arms to the nanocage due to combinatorial affects. For example, if the overall completed “click” attachment of the macromolecule onto the T8POSS nanocage is of 97% yield, the 3% impurity leads to circa. 84% of the fully-adorned octamer (8-mer), leaving 12.5% of the octamer with one unmodified arm (7-mer), and 3.5% of the octamer with two unmodified arms (6-mer), and so on. It is often difficult to identify such impurities since they are masked by the vast number of “clicked” arms, and, in general, the only reliable method of assessing purity is matrix-assisted laser desorption/ionization time-of-flight mass spectrometry (MALDI-TOF MS) to detect the high molecular weights of the multi-mer mixture. Separating octamers from partially-“clicked” counterparts can be difficult due to their similar properties, especially when there are no distinguishable net charges, functional groups, or discernible physicochemical properties between the macromolecules for effective purification.
Here we investigate the “click” chemistry of model trimer-peptides to T8POSS to evaluate octamer yield. Specifically, the “click” chemistry of alkyne-functionalised T8POSS nanocages (T8[N-propyl-hex-5-ynamide]8) with azide-functionalised triglycine- and trialanine-methyl ester is assessed to determine the constraints of “clicking” trimer peptides around a central POSS nanocage. We also examine methods of residual Cu catalyst removal to reduce toxicity effects for future in vitro cell studies.
2. Results and discussion
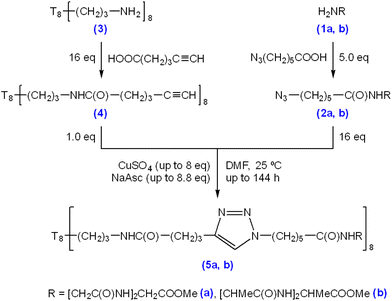
Triglycine and trialanine were chosen as trimer peptide species for experimentation because they have the lowest masses of consecutive amino acid repeats (Mr = 189.07 and 231.12, respectively), have no distinguishable net charge or functional groups, and are suitable progressions from single amino acid decoration, as previously demonstrated by El Aziz et al. (2017).23 6-Azidohexanoic acid was used for N-terminus modification of triglycine methyl ester hydrochloride (Scheme 1 (1a)) and trialanine methyl ester hydroacetate (Scheme 1 (1b)) via solution phase peptide synthesis coupling (Scheme 1 (2a/b)). Following purification and characterisation, the azido-modified triglycine/trialanine-methyl esters were “clicked” with T8[N-propyl-hex-5-ynamide]8 (Scheme 1 (4)) through CuAAC conditions to produce T8POSS-[triglycine/trialanine methyl ester]8 (Scheme 1, (5a) and (5b)).The synthesis and characterisation of the precursor materials outlined in Scheme 1 can be found in the ESI (S1–S32),† which confirms successful azido-modification of both triglycine/trialanine methyl ester N-termini (ESI S1–S16†) and confirms synthesis of T8[N-propyl-hex-5-ynamide]8 (4) (ESI S17–S24†).
The following results and discussion systematically explores the effect of varying “click” reaction conditions on the connection of the 6-azidohexanoyl-triglycine methyl ester (2a) to the alkyne moieties on the T8[N-propyl-hex-5-ynamide]8 (4). Firstly, the effect of catalyst concentration was evaluated, followed by examination of the impact of temperature, time, and multi-stage “clicks” on the reaction outcomes. This was followed by an evaluation of “clicking” 6-azidohexanoyl-trialanine methyl ester (2b) and (4). The results presented also reveal inadvertent reactions induced by the Cu catalyst, including peptide hydrolysis and positional isomerisation of alkynes.
2.1 Effect of CuSO4 concentration on CuAAC “click” reactions between (2a) and (4)
Previous studies have shown varying product yields when performing CuAAC “click” reactions between peptides where CuSO4 concentrations at ≥4.0 eq., in relation to reactant equivalents, yield >95%. This is in contrast to curtailed yields when using lower catalyst concentrations.30Table 1 details the Cu concentrations investigated in this study to assess the efficacy of “clicking” between (2a) and (4). Condition A leads to a majority of octamer (8-mer) formation after 72-h, as shown through MALDI-TOF MS analysis (Fig. 1a), with its identified [8-mer + 2Na]2+, Na]+, and K]+ adducts (m/z 2209.0, 4395.9 and 4411.9, respectively). This is followed by a stepwise decrease in 7-/6-/5-/4-/3-/2-mers as reflected in the intensities of their corresponding [n-mer + Na]+ adduct ions‡ (m/z 4053.8, 3710.6, 3368.4, 3025.3, 2684.1 and 2342.0, respectively). The absence of m/z 1634.4, and analogous adducts, indicates the consumption of (4) through “clicks” with one or more of (2a). Suspected exhaustion of reduced Cu over the reaction time, through a visible reaction colour change from a yellow suspension to a clear blue solution, results in failure to “click” compound (2a) further, and therefore does not result in full 8-mer “clicks” of all available POSS nanocages.
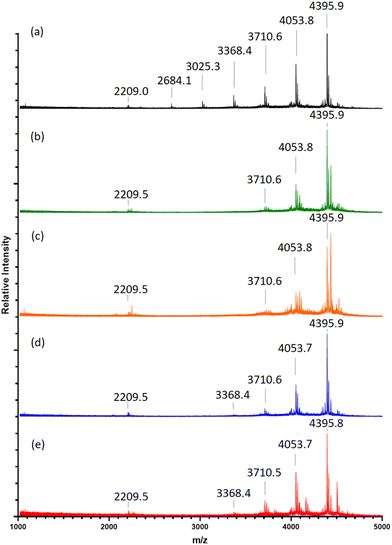 | ||
| Fig. 1 MALDI-TOF mass spectra at 72-h following “clicks” between (2a) with (4) in contrasting CuSO4 equivalents listed in Table 1 (A–E) (a–e), respectively. Full spectra shown in ESI S35–S39.† | ||
| Condition ID | Starting CuSO4 eqa | Additional CuSO4 eqa added at 48-h | 8-mer yield (%) | 7-mer yield (%) | 6-mer yield (%) |
|---|---|---|---|---|---|
| a CuSO4 mole eq. is relative to one equivalent of (4) (1.0 eq.). Each respective CuSO4 eq. was initially stirred with 1.1 × eq of Na ascorbate in H2O (3.0 mL), for Cu reduction, before addition of the suspension to pre-dissolved (2a) & (4) in N,N-dimethylformamide. | |||||
| A | 2 | 0 | 42 | 24 | 13 |
| B | 4 | 0 | 66 | 27 | 7 |
| C | 8 | 0 | 66 | 26 | 8 |
| D | 1 | 1 | 65 | 26 | 7 |
| E | 2 | 1 | 56 | 27 | 12 |
A 2-fold increase in the starting concentration of active catalyst (Table 1 (B) and Fig. 1b) demonstrates a shift towards “clicked” 8-mers, 7-mers and 6-mers ([n-mer + Na]+m/z 4395.9, 4053.8 and 3710.6) with no detection of the fewer-“clicked” species. An increase of [8-mer + Cu]+ adduct intensity (m/z 4435.9) within condition B, against that of condition A, alongside a higher intensity of the [8-mer + 2Cu]2+ adduct (m/z 2249.5), suggests the 2-fold catalyst increase also results in greater residual Cu(I) complexing within the triglycine methyl ester arms. This was also evidenced through an observable increase of dull-purple colouration to the final product solid collected from condition B to that of A.
Condition C (Fig. 1c) reveals a slight increase of intensity for both the single and doubly charged 8-mers and 7-mers. However, the 4-fold starting concentration of Cu leads to higher [n-mer + 2Cu]2+ and Cu]+ adduct intensities indicating a high degree of complexed Cu(I) residue within the product (m/z 2250.5 and 4436.0, 2079.9 and 4093.9 for 8-mers and 7-mers, respectively).
The addition of supplementary Cu after 48-h, conditions D and E (Fig. 1d and e), causes no increase in 8-mer formation. Instead, the 8-mers, 7-mers and 6-mers are observed alongside a reintroduction of the 5-mer, suggesting another factor is preventing full-“clicking” within 48-h.
In short, a starting Cu(I) concentration of 4.0 eq. (Table 1 B) promotes the greatest production of fully-“clicked” 8-mer, whilst maintaining lower Cu complexation in comparison to levels observed for higher Cu concentration conditions. Simply increasing the catalyst concentration or adding supplementary Cu during the “click” reaction, does not increase 8-mer yield.
2.2 Effect of temperature on CuAAC “click” reactions between (2a) and (4) with product formation over time
MALDI-TOF MS analysis of timed aliquots at 25 °C (Fig. 2a) shows that the “click” between compound (2a) and (4) is a fast process. Initially, Fig. 2a reveals only a small amount of unreacted compound (4) within 2-h ([(4) + Na]+m/z 1656.7), together with similar intensities of the 1-mer to 7-mer intermediates (identified between [1-mer + Na]+m/z 1999.0 and [7-mer + K]+m/z 4071.0). The 8-mer represents 59% of the total Na adduct intensity ([8-mer + Na]+m/z 4395.2), illustrating its quick formation. At 5-h, the spectrum shows a greater number of higher-“clicked” species; the 8-mer ([8-mer + Na]+m/z 4395.2), 7-mer ([7-mer + K]+m/z 4071.0) and 6-mer ([6-mer + Na]+m/z 3710.7), at 69.89, 12.68 and 3.24% overall Na adduct intensities, respectively. An increase of 8-mer is observed at 21-h with a 79.01% [8-mer + Na]+ intensity, alongside a small increase of 7-mer from 12.68% to 17.38%. Equivalent MALDI-TOF mass spectra captured at 52-h and 144-h show no significant increase of 8-mer formation beyond 21-h.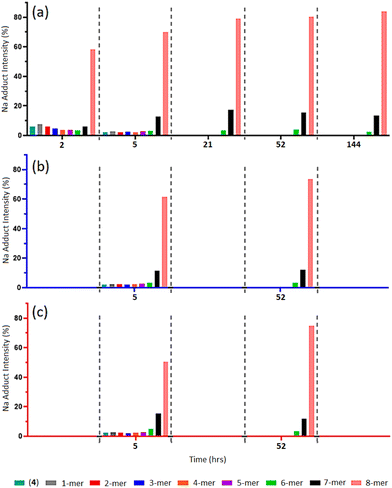 | ||
| Fig. 2 (a–c) MALDI-ToF mass spectra of multi-mer species [n-mer + Na]+ adduct intensities (relative percentages (%)) of timed “clicks” between (2a) and (4) using CuSO4 (4.0 eq.) and Na ascorbate (4.4 eq.) at different temperatures: 25 °C aliquots at 2-, 5-, 21-, 52- and 144-h (a), 15 °C aliquots at 5- and 52-h (b), and 35 °C aliquots at 5- and 52-h (c) (full spectra shown in ESI S40–S51†). | ||
When reacted at 15 °C, rapid “clicks” between (2a) and (4) are again observed within 5-h (Fig. 2b), where the 8-mers, 7-mers and 6-mers are present in comparable intensities to the same timepoint at 25 °C, with a similar pattern again obtained after 52-h. Likewise, the “click” reaction performed at 35 °C presents 8-mers, 7-mers and 6-mers at both 5-h and 52-h comparable to the 15 °C and 25 °C reaction conditions (Fig. 2c), demonstrating no enhancement of 8-mer production when “clicking” at a higher temperature.
When observing the full MALDI-TOF mass spectra (ESI S40–S51†), and through the magnification of the 7-mer m/z region (Fig. 3), unexpected peaks of significant intensity are located at m/z 3937 ([n-mer + H]+), 3959 ([n-mer + Na]+), and 4002 ([n-mer + Cu]+), which can be attributed to the mass of 7-mer nanocages with a sole aminopropyl group at the 8th vertex (“7-APG”). Similarly, adducts of identifiable intensity are located at m/z circa. 3500, 3523 and 3540, matching that of 6-mer nanocages with an aminopropyl group at their 7th and 8th vertex (ESI S40–S51†). The initial analysis of T8[N-propyl-hex-5-ynamide]8 (4) indicates high purity through ESI-MS, FTIR, and NMR (ESI S20–S24†). It is therefore unlikely that such by-products originated from impurities of the starting material (4) and more likely that their presence indicates degradation of the 8-mers and 7-mers and/or the loss of 5-hexynoic acid(s) from (4) through Cu-assisted hydrolysis during the “click” reaction, or possibly through fragmentation during the MALDI-TOF MS process.
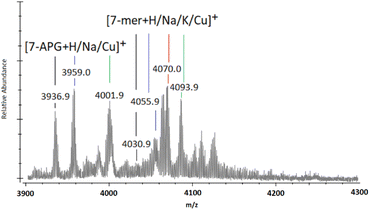 | ||
| Fig. 3 MALDI-ToF mass spectra between m/z 3900 and 4300 showing multi-mer species following 72-h of “clicking” between (2a) and (4), using CuSO4 (4.0 eq.) and Na (4.4 eq.) (the full spectra of the example shown in this figure is presented in ESI S46†). | ||
As previously reported, hydrolysis of glycylglycine, a glycine dimer, can occur when added to solutions of Cu(II),31 so a control of CuSO4 (4 eq.) was stirred in N,N-dimethylformamide (DMF) over 12-h with addition of only compound (2a). ESI-TOF MS shows a peak introduction at m/z 147.07, relating to the mass of diglycine methyl ester, and suggests hydrolysis may also be degrading the trimeric glycine arms (ESI S52†).
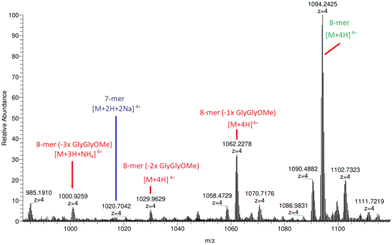
Additionally, HRAM nanoESI MS analysis of (5a) (Fig. 4 and ESI S53–S55†) reveals species corresponding to 8-mers with missing 1, 2 and 3 × diglycine methyl esters located at m/z 1062.23 ([n-mer + 4H]4+), 1029.96 ([n-mer + 4H]4+) and 1000.93 ([n-mer + 3H + NH4]4+), respectively. The parent species of these broken structures are identifiable under close inspection of the previously illustrated MALDI-TOF mass spectra in Fig. 1, particularly for those “clicked” with greater Cu concentrations, further supporting the theory that hydrolysis is, to some extent, breaking down the trimeric peptide constituent of compound (2a). Although there is evidence of arm degradation, the species in question are at relatively low concentrations and implies that there is another reason for the apparent 84% yield limit on 8-mer production.
2.3 Effect of secondary and tertiary “click” reactions on (5a)
To account for possible Cu(I) exhaustion post-27-h, the crude product (5a) was cleared of residual Cu (as detailed in section 2.6) and dried before secondary and tertiary “clicks” within the same Cu and Na ascorbate equivalents, and with addition of fresh (2a) (16.0 eq.). No improvement was made in the quantity of 8-mer produced, nor was there a reduction of either the 7-mers or 6-mers (ESI S56 and S57†). The addition of fresh Cu for each “click” reaction seemingly catalysed the peptide hydrolysis rather than increase the triazole formation at the remaining alkyne terminals of the 7-mers and 6-mers as intended. This is evidenced by the increasing intensities of lower molecular weight species at m/z < 1945.0 for both samples which were “clicked” two or three times.2.4 Individual control “click” reactions using (5a) and (4)
To overcome possible steric hindrance from the bulky trimer arms obstructing the last terminal alkyne positions of the 7-mers and 6-mers, secondary “click” reactions were performed with the addition of 1-azidohexane (16.0 eq.) to a sample of pre-“clicked” (5a). This was tested to see whether the remaining alkynes could be accessed using a smaller, and less bulky, azido-compound.24-h into the reaction MALDI-TOF MS analysis indicates the presence of 6-mers with their 7th and 8th positions adorned with hexyltriazole (“6-HEX”) through a slight shoulder located either side of the previously identified [7-APG + Na]+ peak (m/z 3959.0, Fig. 5a) with [6-HEX + H]+ and Na]+ at m/z 3949.9 and 3965.9 (Fig. 5b and ESI S59†). 7-mers adorned with hexyltriazole at their 8th position (“7-HEX”) can be identified through [7-HEX + H]+, Na]+, and Cu]+ at m/z 4154.9, 4180.9 and 4221.9, respectively, which are not observed in the starting material (Fig. 5a). At 144-h no significant increase of these species is measured and the majority of 7-mers and 6-mers remain unchanged (Fig. 5c and ESI S62†). This experiment demonstrates the steric hindrance of the triglycine methyl esters can be overcome, however, the completion of full octa-“clicking” to 16% of the nanocages remains limited.
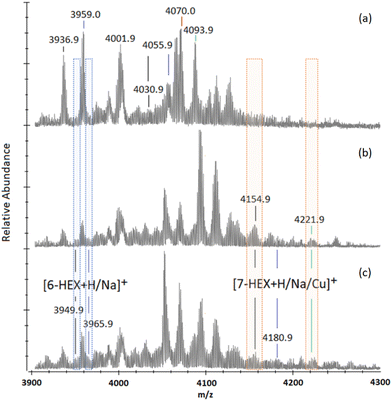 | ||
| Fig. 5 MALDI-ToF mass spectra between m/z 3900 and 4300 showing multi-mer species following 72-h of “clicking” between (2a) and (4), using 4.0 eq. CuSO4 and 4.4 eq. Na (a). After washing, the sample was “clicked” again with an addition of 1-azidohexane (16 eq.) in substitute of (2a), to assess final alkyne accessibility. MALDI-ToF mass spectra are presented of reactions taken at 24-h into this secondary “click” between crude (5a) with 1-azidohexane (b), and 144-h into secondary “clicks” between crude (5a) with 1-azidohexane (c). (The full spectra of the examples shown in this figure are presented in ESI S58–S62.†). | ||
Transition metals such as Rh, Pd, and the “coinage metals” Cu, Ag and Au, have previously been reported to facilitate alkyne isomerisation into dienes and metal-vinylidenes in numerous reaction systems.32–37 To examine the catalyst's effect on the terminal alkyne arms of the T8POSS-[alkyne]8, samples of (4) were individually stirred in DMF containing either unreduced CuSO4, or reduced Cu(I) (through addition of Na ascorbate). In both cases, the 1H NMR spectrum reveals the addition of a singlet at 1.24 ppm (ESI S63†), and 13C NMR shows a peak appearance at 15.64 ppm (ESI S64†), which may indicate methyl formation from catalyst-induced positional alkyne isomerisation, alongside a peak appearance at 65.39 ppm also suggesting possible positional relocation of the terminal alkyne.
ESI-QTOF MS analysis of (4) following addition of either Cu(II) or Cu(I) shows no additional masses attributable to the parent molecule and its related adducts, suggesting no degradation of the alkynes has occurred through either semi- or full-hydrogenation (ESI S66(b and c)†). The presence of Cu(I) and oxidised ascorbate at the start of the “click” reaction may facilitate similar isomerisation to that reported in literature,32–37 and render a small proportion of the T8POSS-[alkyne]8 arms unreactive or unavailable for “click” reactions. This also possibly links to the observations found in sections 2.2 and 2.3, where supplementary Cu, secondary clicks and tertiary clicks were unable to increase 8-mer production, particularly when long “clicking” durations may be enabling increasing alkyne isomerisation.
2.5 CuAAC “click” reactions between (2b) and (4)
As a complementary investigation, trialanine methyl ester was selected as a suitable trimer for inducing greater steric hindrance, through the introduction of three methyl constituents to the trimer backbone. As illustrated in Scheme 1, trialanine methyl ester acetate (1b) was N-terminus azido-modified using 6-azidohexanoic acid, to produce 6-azidohexanoyl-trialanine methyl ester (2b).MALDI-TOF MS analysis reveals the “clicking” of (2b) with (4) is a slower process compared to that of (2a) with (4) (Fig. 6b and ESI S67–S71†). The “click” at 2-h shows the predominant species is unreacted (4) through its [(4) + Na]+ and Cu]+ adducts (m/z = 1656.8 and 1702.7). Similar 1-mer and 2-mer intensities are observed against the 7-mer and 8-mers, with a dip in 4-mer to 6-mer intensities. This 2-h timepoint suggests the 8-mer has formed in greater quantity than the 7-mer which, in turn, has formed in greater quantity than the 6-mer, and so on. However, through the ToF process, the ease of flight for the lower mass species ((4), 1-mer and 2-mer) produce higher intensities to that of the higher mass species (6-mer, 7-mer and 8-mer).38–41 The higher concentrations of 6-mer, 7-mer and 8-mer versus the higher intensities of lower molecular weight species results in two competing trends and thereby leads to the observed inverted bell curve of the relative MALDI-TOF mass spectra at 2-h and 5-h (Fig. 6b and ESI S67 and S68†).
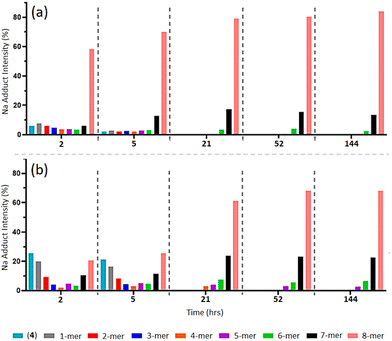 | ||
| Fig. 6 MALDI-ToF mass spectra of multi-mer species [n-mer + Na]+ adduct intensities (relative percentages (%)) of timed “clicks” using 4.0 eq. CuSO4 and 4.4 eq. Na ascorbate at at 2, 5, 21, 52 and 144 h between (2a) and (4) (a) (full spectra shown in ESI S40–S47†), and between (2b) and (4) (b). (Full spectra shown in ESI S67–S71.†) | ||
The “clicks” between (2a) and (4) were effectively halted at 21-h for the 6-mer to 8-mer products (Fig. 6a), however, “clicks” between (2b) and (4) were hated at the later 52-h timepoint and includes a small percentage of 5-mer species (Fig. 6b and ESI S70†).
This indicates that increased steric hindrance through the additional methyl groups of (2b) slows the “click” reaction between the trimer and POSS nanocage, such that the catalyst-induced alkyne isomerisation/diene formation has more time to act, giving rise to more of the 5-mer, 6-mer and 7-mer in the final mixture. Additionally, the difference in the final profile of (5b) compared to (5a) confirms that this does not result from the presence of impure (4).
To assess if octamer yields might be further increased whilst maintaining reduced Cu(I) conditions, a serial “click” reaction was explored where reduced Cu (4.0 eq.) was initially added alongside an increased amount of Na ascorbate (8.0 eq.) to pre-“clicked” individual samples of (5a) (with addition of fresh (2a) (16.0 eq.)), and (5b) (with addition of fresh (2b) (16.0 eq.)). Residual Cu from both pre-“clicked” samples had been removed, as described in section 2.6, prior to the experiment. Sequential additions of Na ascorbate (8.0 eq.), or reduced Cu (4.0 eq.) + Na ascorbate (8.0 eq.), were then introduced to the reaction solutions every 24-h over the course of several days.
Similar to the observations detailed within sections 2.2 to 2.4, the resulting MALDI-TOF MS analysis shows negligible increases of 8-mer intensities in both “clicks” of (2a) with (5a), and (2b), with (5b) (ESI S72 and S73,† respectively), indicating an 8-mer formation limit was reached during the initial “click” reactions of the samples. Furthermore, degradation of all multi-mer species was increasingly observed between both “clicks” post 24-h, which is a likely consequence of peptide hydrolysis facilitated by the supplemented Cu (ESI S74 and S75†).
These control experiments indicate CuAAC “clicking” of multiple trimer macromolecules on to T8POSS encounters multi-faceted inhibition. Steric hindrance to the 7th and 8th vertices slows down their final “clicks”, whilst providing time for induced alkyne isomerisation/diene formation to inhibit the “click” positions further. Such time frames have shown to allow for the previously "clicked" trimers to undergo hydrolysis, with the potential for further hydrolysis of the POSS-propyl-hexamide-R arm constituents resulting in 3-aminopropyl moieties at the Si vertices.
2.6 Removal of Cu from compounds (5a) and (5b)
Regulatory body guidelines (The European Medicines Agency and Committee for Medical Products for Human Use) stipulate daily oral and parenteral Cu exposures of less than 250.0 ppm and 25.0 ppm, respectively, to avoid toxicity issues related to Cu poisoning, such as acute kidney injury and gastrointestinal ulceration.42,43 In the case of biomaterials this threshold is further limited to 3.0 ppm to avoid overexposure to free residual Cu and a buildup of cytotoxicity in vivo.44Following the production of (5a) and (5b), it is evident that residual Cu is retained within the crude products either as a Cu-trimer complex or in Cu salt form. This was confirmed through EDS analysis with identifiable Cu peaks measured for CuLα, CuKα and CuKβ at circa. 0.94, 8.04 and 8.91 keV, respectively, (ESI Tables S1 and S2†). Therefore, crude samples of (5a) and (5b) were individually processed through ethylenediaminetetraacetic acid (EDTA)-modified Amberlite® columns to assess Cu removal.
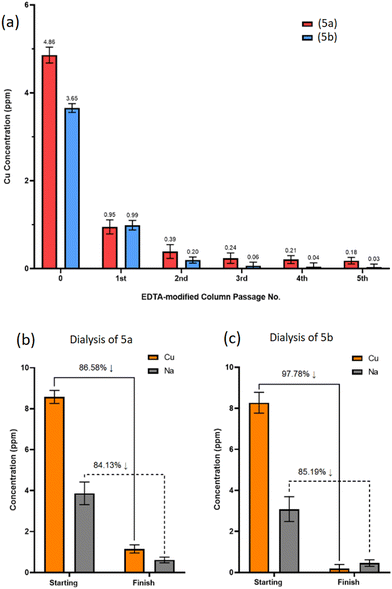
Five sequential passages through the columns resulted in 96% and 99% total removal of residual Cu from (5a) and (5b), respectively, leaving sub-ppm Cu levels below the 3.0 ppm threshold (Fig. 7a).
Ion-exchange EDTA-modified Amberlite® columns exchange EDTA-complexed Na cations with Cu cations from the POSS-trimer, resulting in Na-loaded POSS-trimer products. Following the 5th sequential purification through the EDTA column, ICP-OES revealed Na concentrations were approaching that of the initial Cu concentrations prior to EDTA column passage for both (5a) and (5b), at Na = 5.19 ppm and 4.03 ppm, respectively (ESI S76†). To remove both Na and Cu cations, SnakeSkin™ dialysis tubing (3.5K molecular weight cut-off (MWCO), Thermo Scientific™, UK) was used instead for (5a) and (5b) which included several dissolution medium changes.
ICP-OES analysis found 86% and 84% of residual Cu and Na, respectively, was removed from product (5a) (Fig. 7b), whereas 97% and 85% of residual Cu and Na was removed from product (5b) (Fig. 7c), demonstrating dialysis as an effective method, albeit a procedure requiring additional steps and longer time frames for the removal of multiple cationic species from the product.
3. Conclusion
The attachment of azido-modified triglycine methyl ester peptide through CuAAC “clicks” onto a central POSS nanocage is a relatively fast reaction, with most T8POSS-[triglycine methyl ester]8 formation observed in the initial hours of the reaction. However, it becomes increasingly difficult to surpass 84% of 8-mer production post 27 hours, with decreasing catalytic efficacy, steric hindrance and catalyst-induced alkyne isomerisation being possible competing influences. The study has further shown increased Cu catalyst concentration and longer reaction times alone fail to advance 8-mer production beyond the 84% value, but rather increase the possibility of hydrolysis to the existing arms. Future work will focus on speeding up the click reaction such that isomerisation and hydrolysis are no longer competing side reactions. Reduction of residual Cu from the crude product was achieved to sub-ppm levels by combining EDTA-column filtration and dialysis, thereby providing viable purification methods for post-click catalyst removal. The decorated POSS assembly route described in this work offers new ways for promoting peptide-nanocage attachment and demonstrates possibilities for synthesising larger macromolecules with similar architectures.Further to the studies detailed here, we are already “clicking” longer peptide sequences of 9 to 12 amino acids in length, which are known to elicit biological responses, and which show promise for therapeutic application. The formation of these structures during their “clicking” with T8POSS closely resembles that found with triglycine- and trialanine methyl ester trimers. However, these compounds exhibit a diverse array of intriguing characteristics, namely through the different amino acid side chains offering possibilities for separation and purification, which will be the focus of subsequent research.
4. Experimental
4.1 Materials
All chemicals, unless stated otherwise, were purchased from Alfa Aesar (MA, USA), Bachem AG (Bubendorf, Switzerland), Sigma Aldrich (MO, USA) and Thermo Fisher Scientific (MA, USA). All chemicals were used without further purification. All H2O used was deionised and ultrapure (ultra-purified to BS EN ISO 3696 Grade 1 through SUEZ Select Neptune Ultimate, SUEZ Water Technologies & Solutions (PA, USA)).4.2 Measurements
NMR spectra were recorded as solutions in dimethyl sulfoxide-d6 (DMSO-d6) and/or 1,1,1,3,3,3-hexafluoro-2-propanol (HFIP) on a Bruker Ascend™ 400 (J values are given in Hz). MALDI-TOF mass spectra from NMSF were performed on a Bruker ultrafleXtreme MALDI-TOF/TOF using alpha-cyano hydroxycinnamic acid (CHCA) as a matrix and HFIP![[thin space (1/6-em)]](https://www.rsc.org/images/entities/char_2009.gif) :
:![[thin space (1/6-em)]](https://www.rsc.org/images/entities/char_2009.gif) DCM (3
DCM (3![[thin space (1/6-em)]](https://www.rsc.org/images/entities/char_2009.gif) :
:![[thin space (1/6-em)]](https://www.rsc.org/images/entities/char_2009.gif) 7) as the solvent. ESI-MS was performed on a Thermo Scientific LTQ XL using H2O
7) as the solvent. ESI-MS was performed on a Thermo Scientific LTQ XL using H2O![[thin space (1/6-em)]](https://www.rsc.org/images/entities/char_2009.gif) :
:![[thin space (1/6-em)]](https://www.rsc.org/images/entities/char_2009.gif) MeCN (4
MeCN (4![[thin space (1/6-em)]](https://www.rsc.org/images/entities/char_2009.gif) :
:![[thin space (1/6-em)]](https://www.rsc.org/images/entities/char_2009.gif) 1) as a sample solvent and a H2O
1) as a sample solvent and a H2O![[thin space (1/6-em)]](https://www.rsc.org/images/entities/char_2009.gif) :
:![[thin space (1/6-em)]](https://www.rsc.org/images/entities/char_2009.gif) MeCN (90
MeCN (90![[thin space (1/6-em)]](https://www.rsc.org/images/entities/char_2009.gif) :
:![[thin space (1/6-em)]](https://www.rsc.org/images/entities/char_2009.gif) 10) mobile phase. QTOF MS was performed on an Agilent 6545 QTOF using H2O
10) mobile phase. QTOF MS was performed on an Agilent 6545 QTOF using H2O![[thin space (1/6-em)]](https://www.rsc.org/images/entities/char_2009.gif) :
:![[thin space (1/6-em)]](https://www.rsc.org/images/entities/char_2009.gif) MeCN (4
MeCN (4![[thin space (1/6-em)]](https://www.rsc.org/images/entities/char_2009.gif) :
:![[thin space (1/6-em)]](https://www.rsc.org/images/entities/char_2009.gif) 1) as a sample solvent and a H2O
1) as a sample solvent and a H2O![[thin space (1/6-em)]](https://www.rsc.org/images/entities/char_2009.gif) :
:![[thin space (1/6-em)]](https://www.rsc.org/images/entities/char_2009.gif) MeCN (90
MeCN (90![[thin space (1/6-em)]](https://www.rsc.org/images/entities/char_2009.gif) :
:![[thin space (1/6-em)]](https://www.rsc.org/images/entities/char_2009.gif) 10) mobile phase. The HRAM nano-ESI-MS data from NMSF was carried out on an Advion Triversa NanoMate with Thermo Scientific LTQ Orbitrap XL; each sample was solvated in HFIP, then an aliquot of 1.0 μl taken and diluted 1
10) mobile phase. The HRAM nano-ESI-MS data from NMSF was carried out on an Advion Triversa NanoMate with Thermo Scientific LTQ Orbitrap XL; each sample was solvated in HFIP, then an aliquot of 1.0 μl taken and diluted 1![[thin space (1/6-em)]](https://www.rsc.org/images/entities/char_2009.gif) :
:![[thin space (1/6-em)]](https://www.rsc.org/images/entities/char_2009.gif) 1000 in MeOH with 30 mM NH4OAc for analysis. FTIR spectra were recorded using a Thermo Nicolet Nexus 670 spectrometer and a Specac® Golden Gate diamond ATR. Inductively coupled plasma-optical emission spectra (ICP-OES) were obtained using an Agilent 5110 ICP-OES with ICP calibrations to ppb and ppm levels in different runs using synthetic, matrix matched standards. EDS measurements were made using a ZEISS Crossbeam FIB-SEM with an Oxford Instrument Ultim® Max EDS detector. Data processing was performed within Microsoft Excel. All MALDI-TOF MS data was normalised when comparing relative intensities. Graphical figures were produced using GraphPad Prism9.
1000 in MeOH with 30 mM NH4OAc for analysis. FTIR spectra were recorded using a Thermo Nicolet Nexus 670 spectrometer and a Specac® Golden Gate diamond ATR. Inductively coupled plasma-optical emission spectra (ICP-OES) were obtained using an Agilent 5110 ICP-OES with ICP calibrations to ppb and ppm levels in different runs using synthetic, matrix matched standards. EDS measurements were made using a ZEISS Crossbeam FIB-SEM with an Oxford Instrument Ultim® Max EDS detector. Data processing was performed within Microsoft Excel. All MALDI-TOF MS data was normalised when comparing relative intensities. Graphical figures were produced using GraphPad Prism9.
4.3 Synthesis of triglycine methyl ester (1a)
Esterification of triglycine was achieved by adapting the method of Li and Sha (2008).45 Triglycine (53.0 mmol, 1.0 g) was added to anhydrous MeOH (5.5 mL) in a round bottom flask (RBF) and gently stirred. Chlorotrimethylsilane (10.6 mmol, 1.15 g) was then added dropwise to the suspension and the resulting mixture was stirred at 25 °C for 24-h until esterification was seen as complete via ESI-MS monitoring (m/z 204.08). The reaction mixture was then concentrated on a rotary evaporator to afford the dry product of triglycine methyl ester hydrochloride (1a), as a white solid. Chemical characterisation is detailed in ESI S1–S4.†4.4 Synthesis of 6-azidohexanoyl-triglycine methyl ester (2a) and 6-azidohexanoyl-trialanine methyl ester (2b)
Stock solutions of 6-azidohexanoic acid (0.2 M), O-(7-aza-1H-benzotriazol-1-yl)-N,N,N′,N′-tetramethyluronium hexafluorophosphate (HATU) (0.2 M) and N,N-diisopropylethylamine (DIPEA) (2.0 M) were individually prepared in anhydrous DMF before adding to a RBF in a 5.26![[thin space (1/6-em)]](https://www.rsc.org/images/entities/char_2009.gif) :
:![[thin space (1/6-em)]](https://www.rsc.org/images/entities/char_2009.gif) 5
5![[thin space (1/6-em)]](https://www.rsc.org/images/entities/char_2009.gif) :
:![[thin space (1/6-em)]](https://www.rsc.org/images/entities/char_2009.gif) 1 ratio, resulting in a 93.46 mM 6-azidohexanoic acid solution, and stirred for 5 minutes at 25 °C. Upon addition of the DIPEA solution, the mixture turned from clear to a translucent dull yellow. After 5 minutes of stirring, the translucent yellow colour of the mixture lightened to a transparent bright yellow. Triglycine methyl ester hydrochloride (1a), or trialanine methyl ester acetate (1b), (18.69 mM each – compound (1a) to synthesise compound (2a), or compound (1b) to synthesise compound (2b)) was then added to the coupling mixture and left to stir for 24-h at 25 °C.
1 ratio, resulting in a 93.46 mM 6-azidohexanoic acid solution, and stirred for 5 minutes at 25 °C. Upon addition of the DIPEA solution, the mixture turned from clear to a translucent dull yellow. After 5 minutes of stirring, the translucent yellow colour of the mixture lightened to a transparent bright yellow. Triglycine methyl ester hydrochloride (1a), or trialanine methyl ester acetate (1b), (18.69 mM each – compound (1a) to synthesise compound (2a), or compound (1b) to synthesise compound (2b)) was then added to the coupling mixture and left to stir for 24-h at 25 °C.
Completion of the reaction was confirmed by ESI-MS (m/z = 343.17 (2a), 385.21 (2b)) and 1H NMR after 24-h. No visible changes were observed during the reaction time.
Ice cold diethyl ether (8.0 eq. by volume) was then added to precipitate the product and the suspension was slowly stirred for 5 minutes over an ice bath. The suspension was then filtered to remove DMF filtrate containing unreacted reagents. The solid yellow residue was then re-suspended in clean DMF and fully dissolved before a second precipitation with ice cold diethyl ether (8.0 eq. by volume) and filtration. The white product was then washed with hexane (10.0 mL) and EtOH (10.0 mL), three times each, before concentration on a rotary evaporator to afford the desired dry product (5a) or (5b), both as white solids.
(5a) – yield: 87%, ESI-MS: calculated (M + H)/z: 343.36, found: (M + H)/z: 343.17, anal. calcd for C13H22N6O5: C, 45.61; N, 24.55, found C, 45.55; N, 24.05 (ESI S5–S10†).
(5b) – yield: 76%, ESI-MS: calculated (M + H)/z: 385.44, found: (M + H)/z: 385.17, anal. calcd for C16H28N6O5: C, 49.99; N, 21.86, found C, 50.16; N, 22.31 (ESI S11–S16†).
4.5 Synthesis of T8[3-aminopropyl]8
T8[3-aminopropyl]8 was prepared as previously detailed by Szafert and Janeta (2017).46 Yield: 87%. Chemical characterisation is detailed in ESI S17–S20.†4.6 Synthesis of T8[N-propyl-hex-5-ynamide]8 (4)
T8[N-propyl-hex-5-ynamide]8 was prepared as previously detailed by El Aziz et al. (2017).23 Yield: 84%. Chemical characterisation is detailed in ESI S21–S24.†4.7 Synthesis of POSS-triglycine/trialanine methyl ester nanocages through CuAAC click reaction (5a)/(5b)
Compounds (2a), or (2b), (2.52 mmol, 16.0 eq., Mr = 342.36/384.21) and compound (4) (257.8 mg, 0.16 mmol, 1 eq., Mr = 1634.4) were individually dissolved in 100.0 and 150.0 mL, respectively, of DMF The two solutions were combined ((2a) with (4), or (2b) with (4)), and the mixture purged with N2 for 30 minutes whilst stirring.A solution of CuSO4 (159.8 mg, 0.64 mmol, 4 eq., Mr = 249.68) was prepared in deionised H2O (3.0 mL) resulting in a deep blue colour. Na ascorbate (139.5 mg, 0.70 mmol, 4.4 eq., Mr = 198.11) was added to the CuSO4 stock solution as a reducing agent, turning the solution into a milky suspension of light brown colour. 3.0 ml of the suspension was then added to the N2 purged trimer/POSS mixture. The reaction mixture was sealed and left stirring for 72-h, at 25 °C and under N2. The reaction was stopped by precipitation in ice cold Et2O (8 × excess by volume). The precipitate was then filtered and washed with Et2O, acetone and MeOH (3 × washes each). The resulting product was concentrated from acetone using a rotary evaporator to afford a dry crystalline solid. N.B. The experiments of varying Cu catalyst concentrations detailed in this article resulted in different product colourations. Compound (5a) was a brown crystalline solid when precipitated from click reactions of low Cu concentration but progressively turned dull-purple at higher Cu concentrations (this was also true for experiments where supplementary Cu was added to the reaction mixture). Compound (5b) was a turquoise crystalline solid at low Cu concentrations but progressively darker emerald green at higher Cu concentrations.
(5a) – yield: 84% of 8-mer structures, 97% of overall click reactions. Chemical characterisation is detailed in ESI S25–S28.†
(5b) – yield: 68% of 8-mer structures, 92% of overall click reactions. Chemical characterisation is detailed in ESI S29–S32.†
4.8 Synthesis of 1-azidohexane
The synthesis of 1-azidohexane was carried out as reported by Brown et al. (1957).47 Yield: 86%. Chemical characterisation is detailed in ESI S33 and S34.†4.9 EDTA-modified Aberlite® column
The EDTA-modified Aberlite® column was produced as per Ali et al. (2013), with the following modifications.48 Amberlite® IRA-400 resin (Cl form) (5.0 g) was placed in a 500 mL disodium EDTA solution (0.05 M), at pH 6.0, and slowly stirred for 24-h. The resin was then loaded into a solid phase extraction column (25.0 mL capacity), excess reagent was removed by washing the resin with deionised H2O and finally the resin was dried under N2. Crude samples of (5a) and (5b) were individually dissolved in 25.0 mL HFIP (6.0 mg mL−1) and passed through the EDTA column. The collected eluent was then passed through the EDTA column four more times (five passages total) before collection and evaporation of the solvent using a rotary evaporator. The resulting dry compound (5a) was an off-white powder, and the resulting dry product of compound (5b) was a very pale green powder.4.10 Dialysis of (5a) and (5b) for Cu and Na cation removal
Crude samples of (5a) and (5b) were individually suspended in deionised H2O (0.18 mg mL−1, 10 mL), the suspensions then being inserted into the centre of individual SnakeSkin™ dialysis tubes (30 cm length), ensuring the dialysis tubing was securely tied at each end to trap the suspension within. The loaded dialysis tubing was then submersed into a one-litre bottle containing deionised H2O (1.0 L) ensuring the sections of dialysis tubing housing the sample suspensions were fully submerged. The dialysis tubing was submerged for 12-h in deionised H2O before decanting of the dissolution medium and replacing with fresh deionised water. Six subsequent deionised water changes were made every 12-h thereafter (seven submersions in total). After the 7th submersion, the dialysis tubing was removed and cut open to collect the internal sample suspension which was then dried under high vacuum to remove the water to afford a dry compound (5a), as an off-white powder, or dry compound (5b), as a very pale green powder. The samples were then analysed for Cu and Na concentrations via ICP-OES and ICP-MS.Author contributions
Dr Lewis Anderson, Dr Nazia Mehrban, Dr James Bowen and Prof. Peter Taylor applied equal contribution to project conceptualisation, investigation, methodology, formal analysis, administration, original publication drafting and publication editing. Dr Ann Hunter, Dr Matthew Kershaw and Dr Sergey Bylikin equally contributed to methodology, formal analysis and publication editing. Dr Nazia Mehrban and Prof Martin Birchall equally contributed to funding acquisition and supervision.Data availability
The MALDI-TOF MS raw data obtained during this research is openly available from the University of Bath Research Data Archive at https://doi.org/10.15125/BATH-01390.49Conflicts of interest
There are no conflicts to declare.Acknowledgements
This study was made possible through EPRSC funding (Grant No. EP/R02961X/1). The authors thank; NMSF, Swansea University Medical School, UK, for MALDI-TOF MS acquisition and processing; Mr Timothy Barton and Dr Samantha Hammond at the School of Environment, Earth and Ecosystem Sciences, The Open University, UK, for ICP-OES, ICP-MS and Chemical Analysis acquisition; Dr Zeeshan Mughal for technical assistance at the Electron Microscopy Suite, STEM, The Open University, UK, for EDX acquisition; Laboratory Management and Technicians at the School of Life, Health and Chemical Sciences, The Open University, UK, for laboratory and equipment access; Dr Simon Collinson at the School of Life, Health and Chemical Sciences, The Open University, UK, for visiting academic sponsorship; Ms Marie Caldiero at ESCOM Chimie, France, and Dr Erol Hasan of the National Physical Laboratory, UK, for their preliminary research contributions during the conceptualisation of this study.References
- K. Tanaka and Y. Chujo, Bull. Chem. Soc. Jpn., 2013, 86(11), 1231–1239 CrossRef CAS.
- J. Wu and P. T. Mather, Polym. Rev., 2009, 49(1), 25–63 CrossRef CAS.
- A. Fina, D. Tabuani, F. Carniato, A. Frache, E. Boccaleri and G. Camino, Thermochim. Acta, 2006, 440(1), 36–42 CrossRef CAS.
- Y. Komagata, T. Iimura, N. Shima and T. Kudo, Int. J. Polym. Sci., 2012, 2012, 391325 Search PubMed.
- R. Hany, R. Hartmann, C. Böhlen, S. Brandenberger, J. Kawada, C. Löwe, M. Zinn, B. Witholt and R. H. Marchessault, Polymer, 2005, 46(14), 5025–5031 CrossRef CAS.
- H. Xu, S. Kuo, J.-S. Lee and F. Chang, Macromolecules, 2002, 35(23), 8788–8793 CrossRef CAS.
- L. Zhang, H. Abbenhuis, Q. Yang, Y.-M. Wang, Y.-M. P. Magusin, B. Mezari, R. van Santen and C. Li, Angew. Chem., Int. Ed., 2007, 46, 5003–5006 CrossRef CAS.
- H. Xu, B. Yang, X. Gao, C. Li and S. Guang, J. Appl. Polym. Sci., 2006, 101, 3730–3735 CrossRef CAS.
- Q. Yang, L. Li, W. Sun, Z. Zhou and Y. Huang, ACS Appl. Mater. Interfaces, 2016, 8(21), 13251–13261 CrossRef CAS.
- R. Singh, P. Yadav, H. Naveena A and D. Bhatia, Nanoscale, 2023, 15(3), 1099–1108 RSC.
- H. Ghanbari, B. G. Cousins and A. M. Seifalian, Macromol. Rapid Commun., 2011, 32(14), 1032–1046 CrossRef CAS PubMed.
- E. Carbonell, L. A. Bivona, L. Fusaro and C. Aprile, Inorg. Chem., 2017, 56(11), 6393–6403 CrossRef CAS PubMed.
- K.-O. Kim, B. Kim and I. Kim, J. Biomater. Nanobiotechnol., 2011, 2(3), 201–206 CrossRef CAS.
- Y. Pu, L. Zhang, B. He and Z. Gu, Macromol. Biosci., 2013, 14(2), 1616–5187 Search PubMed.
- R. Y. Kannan, H. J. Salacinski, J. De Groot, I. Clatworthy, L. Bozec, M. Horton, P. E. Butler and A. M. Seifalian, Biomacromolecules, 2006, 7(1), 215–223 CrossRef CAS.
- J. Raghunath, H. Zhang, M. Edirisinghe, A. Darbyshire, P. E. M. Butler and A. M. Seifalian, Biotechnol. Appl. Biochem., 2009, 52(1), 1–8 CrossRef CAS.
- Y. Chun, S. W. Crowder, S. C. Mehl, X. Wang, H. Bae and H. Sung, Biotechnol. J., 2013, 7, e201304005 Search PubMed.
- S. Tamburacı, B. Çeçen, O. Ustun, B. U. Ergur, H. Havıtçıoğlu and F. Tıhmınlıoğlu, ACS Appl. Bio Mater., 2019, 2(4), 1440–1455 CrossRef PubMed.
- L. Cui, Z. Yang, J. Hong, Z. Zhu, Z. Wang, Z. Liu, W. Zheng, Y. Hao, J. He, P. Ni and G. Cheng, ACS Appl. Mater. Interfaces, 2023, 15(17), 20625–20637 CrossRef CAS.
- P. Loman-Cortes, T. B. Huq and J. L. Vivero-Escoto, Molecules, 2021, 26(21), 6453 CrossRef CAS PubMed.
- J. Liu, G. Feng, D. Ding and B. Liu, Polym. Chem., 2013, 4(16), 4326–4334 RSC.
- Z. Zhou, Z. Han and L. Z. Lu, Biomaterials, 2016, 85, 168–179 CrossRef CAS PubMed.
- Y. El Aziz, N. Mehrban, P. G. Taylor, M. A. Birchall, J. Bowen, A. R. Bassindale, M. B. Pitak and S. J. Coles, RSC Adv., 2017, 7(59), 37474–37477 RSC.
- V. Castro, H. Rodríguez and F. Albericio, ACS Comb. Sci., 2016, 18(1), 1–14 CrossRef CAS PubMed.
- K. Porte, M. Riomet, C. Figliola, D. Audisio and F. Taran, Chem. Rev., 2021, 121(12), 6718–6743 CrossRef CAS PubMed.
- Y. Cheng, G. Li, C. J. Smedley, M.-C. Giel, S. Kitamura, J. L. Woehl, G. Bianco, S. Forli, J. A. Homer, J. R. Cappiello, D. W. Wolan, J. E. Moses and K. B. Sharpless, Proc. Natl. Acad. Sci. U. S. A., 2022, 119(37), e2208540119 CrossRef.
- D. Perrone, E. Marchesi, L. Preti and M. L. Navacchia, Molecules, 2021, 26(11), 3100 CrossRef CAS PubMed.
- E. Halay and Y. Açıkbaş, Appl. Chem. Eng., 2023, 6, 1 CrossRef.
- M. Jafari, S. S. Abolmaali, S. Borandeh, H. Najafi, Z. Zareshahrabadi, O. Koohi-Hosseinabadi, N. Azarpira, K. Zomorodian and A. M. Tamaddon, Nanoscale, 2023, 15(39), 16163–16177 RSC.
- L. Iddon, J. Leyton, B. Indrevoll, M. Glaser, E. G. Robins, A. J. T. George, A. Cuthbertson, S. K. Luthra and E. O. Aboagye, Bioorg. Med. Chem. Lett., 2011, 21(10), 3122–3127 CrossRef CAS PubMed.
- I. J. Grant and R. W. Hay, Aust. J. Chem., 1965, 18, 1189–1195 CrossRef CAS.
- S. Shah, B. G. Das and V. K. Singh, Tetrahedron, 2021, 93, 132238 CrossRef CAS.
- G. Fang and X. Bi, Chem. Soc. Rev., 2015, 44(22), 8124–8173 RSC.
- C. C. Chintawar, A. K. Yadav, A. Kumar, S. P. Sancheti and N. T. Patil, Chem. Rev., 2021, 121(14), 8478–8558 CrossRef CAS PubMed.
- R. Shintani, W.-L. Duan, S. Park and T. Hayashi, Chem. Commun., 2006, 34, 3646–3647 RSC.
- G. Cera, M. Lanzi, F. Bigi, R. Maggi, M. Malacria and G. Maestri, Chem. Commun., 2018, 54, 14021–14024 RSC.
- S. W. Roh, K. Choi and C. Lee, Chem. Rev., 2019, 119(6), 4293–4356 CrossRef CAS.
- K. Shimada, R. Nagahata, S. I. Kawabata, S. Matsuyama, T. Saito and S. Kinugasa, J. Mass Spectrom., 2003, 38, 948–954 CrossRef CAS.
- W. Yan, J. A. Gardella and T. D. Wood, J. Am. Soc. Mass Spectrom., 2002, 13(8), 914–920 CrossRef CAS PubMed.
- D. Yu, N. Vladimirov and J. M. J. Fréchet, Macromolecules, 1999, 32(16), 5186–5192 CrossRef CAS.
- T. Bonk, A. Humeny, J. Gebert, C. Sutter, M. K. Doeberitz and C.-M. L. Becker, Clin. Chem., 2003, 49(4), 552–561 CrossRef CAS.
- European Medicines Agency, ‘Committee for Medical Products for Human Use (CHMP): Guideline on the Specification Limits for Residues of Metal Catalysts or Metal Reagent’, (Doc. Ref. EMEA/CHMP/SWP/4446/2000)., London, 2008, [Accessed 06.03.24].
- K. S. Park, J. H. Kwon, S. H. Park, W. Ha, J. Lee, H. C. An and Y. Kim, Am. J. Ind. Med., 2018, 61, 783–788 CrossRef.
- J. Bejarano, P. Caviedes and H. Palza, Biomed. Mater., 2015, 10, 025001 CrossRef.
- J. Li and Y. Sha, Molecules, 2008, 13(5), 1111–1119 CrossRef CAS.
- M. Janeta and S. Szafert, J. Organomet. Chem., 2017, 847, 173–183 CrossRef CAS.
- O. L. I. Brown, H. E. Cary, G. S. Skinner and E. J. Wright, J. Phys. Chem., 1957, 61(1), 103–104 CrossRef CAS.
- M. A. Ali, M. A. Rahman and A. M. S. Alam, Anal. Chem. Lett., 2013, 3(3), 199–207 CrossRef CAS.
- L. R. Anderson, N. Mehrban, A. P. Hunter, J. Bowen, P. G. Taylor and M. A. Birchall, Dataset for ““Clicking” trimeric peptides onto hybrid T8POSS nanocages and identifying synthesis limitations” (MALDI-TOF MS Raw Data), 2024, University of Bath Research Data Archive, Bath. DOI:10.15125/BATH-01390.
Footnotes |
| † Electronic supplementary information (ESI) available. See DOI: https://doi.org/10.1039/d4nr01685h |
| ‡ The MALDI-TOF MS m/z data discussed in this section states the generalised [M + nX]n adduct ion for species identification, where; M = proposed molecular formula; and X = proposed adduct, however, m/z for multiple species are discussed throughout. Therefore, adduct ion identifications of “[n-mer + nX]n” relate to the proposed molecular formulae of the corresponding multi-mer species under description at the time of m/z identification. |
| This journal is © The Royal Society of Chemistry 2024 |

