
 Open Access Article
 This Open Access Article is licensed under a Creative Commons Attribution-Non Commercial 3.0 Unported Licence
Exploring ssDNA translocation through α-hemolysin using coarse-grained steered molecular dynamics†
Cagla
Okyay
 ,
Delphine
Dessaux‡
,
Rosa
Ramirez§
,
Jérôme
Mathé
and
Nathalie
Basdevant
*
,
Delphine
Dessaux‡
,
Rosa
Ramirez§
,
Jérôme
Mathé
and
Nathalie
Basdevant
*
Université Paris-Saclay, Univ Evry, CY Cergy Paris Université, CNRS, LAMBE, 91025, Évry-Courcouronnes, France. E-mail: nathalie.basdevant@univ-evry.fr
First published on 23rd July 2024
Abstract
Protein nanopores have proven to be effective for single-molecule studies, particularly for single-stranded DNA (ssDNA) translocation. Previous experiments demonstrated their ability to distinguish differences in purine and pyrimidine bases and in the orientation of the ssDNA molecule inside nanopores. Unfortunately, the microscopic details of ssDNA translocation over experimental time scales, which are not accessible through all-atom molecular dynamics (MD), have yet to be examined. However, coarse-grained (CG) MD simulations enable systems to be simulated over longer characteristic times closer to experiments than all-atom MD. This paper studies ssDNA translocation through α-hemolysin nanopores exploiting steered MD using the MARTINI CG force field. The impacts of the sequence length, orientation inside the nanopore and DNA charges on translocation dynamics as well as the conformational dynamics of ssDNA during the translocation are explored. Our results highlight the efficacy of CG molecular dynamics in capturing the experimental properties of ssDNA translocation, including a wide distribution in translocation times per base. In particular, the phosphate charges of the DNA molecule are crucial in the translocation dynamics and impact the translocation rate. Additionally, the influence of the ssDNA molecule orientation on the translocation rate is explained by the conformational differences of ssDNA inside the nanopore during its translocation. Our study emphasizes the significance of obtaining sufficient statistics via CG MD, which can elucidate the great variety of translocation processes.
1 Introduction
Translocation of bio-polymers through nanopores is a common biological process and vital for cellular function. Nanoscale pores have become leading candidates for the study of single molecules owing to their inherent detection capabilities.1 Inspired by nature, nanopore technology has been the preferred approach for single molecule sensing since the early 2000s. This technology allows for a fast, low-cost, label-free, and precise analysis,2 among which DNA transport has received great interest and has been proven to be successful for single-stranded DNA (ssDNA) sequencing.3–6The nanopores employed in this technology can be biological,1,2,7 solid-state,8–11 or hybrid.12,13 Biological nanopores are inserted into a lipid bilayer, creating a separation between two chambers containing an ionic solution.2 Conversely, solid-state nanopores do not rely on a lipid bilayer; instead, they are integrated into a solid insulating layer, forming the nanopore via different methods.14 Applying a voltage across the nanopore induces ionic current through the aperture. When a charged analyte of interest is present in the ionic solution, it translocates through the nanopore in the presence of the applied voltage. This translocation event leads to temporary obstruction of the nanopore, which can be directly observed in the measured ionic current as temporary current reductions. These ionic current blockages are essential for identifying differences at the single-molecule level, allowing nanopore detection to achieve the precision required for single-molecule studies. While nanopore sensing can be used for detecting and analyzing various biomolecules, its significance in DNA sequencing is particularly noteworthy due to the unprecedented rate and accuracy of the readout.2
All types of nanopores have been utilized for DNA transport.1 Among them, the α-hemolysin (αHL) nanopore, a pore-forming toxin from Staphylococcus aureus, has been widely studied and used in the research community.2,15–23 α-hemolysin is a large heptameric protein (240 kDa) composed of two main parts: a 14 stranded transmembrane β-barrel and a large extramembranous cap.24 The pore constriction, approximately 1.5 nm in diameter, plays a crucial role in influencing single-molecule translocation dynamics and enables DNA bases to be distinguished.18,20–22
However, the conformational dynamics of the ssDNA molecule during translocation has yet to be explored in detail and requires an extensive study. Unveiling the physical mechanisms and dynamics of this transport process is essential to find ways of slowing translocation, to correlate ionic current changes with DNA sequences at the single base level, and to develop next-generation single-molecule detection devices. This analytical methodology necessitates a combined approach of experimental, theoretical, and computational studies.
Numerous experimental studies have delved into the translocation process of biological polymers, including DNA or RNA,2,15–17,21,22,25 peptides,26–28 proteins,23,29 and more recently, polysaccharides.30 Early investigations predominantly employed αHL pores, while contemporary studies increasingly employed diverse pore-forming toxins and their mutants, such as MspA,31,32 aerolysin28,33 and, lately, CsgG:CsgF.34 Experimental studies have conclusively demonstrated that the translocation process is influenced by factors such as the chemical composition2,15,17,25 or conformation of the translocating molecule,35–37 salt concentration,38,39 orientation of the molecule inside the pore,37,40 pH,41,42 the charge ratio of the nanopore amino acids,20–22,25,43 temperature,17 and the applied voltage.16 While these studies have provided valuable insights, the broad distribution of measured translocation times emphasizes the need for robust statistical analyses to appropriately characterize the process.
Alongside the aforementioned experimental studies, theoretical approaches aimed at simplifying the complexities of channel systems are becoming popular and are widely used to study the dynamic behaviour of charged particles at a low computational cost. By implementing a stochastic approach, Brownian or Langevin dynamics44–46 methods monitor the ion motion. Among continuum theory approaches, the Poisson–Nernst–Planck (PNP)44 and Poisson–Boltzmann and Nernst–Planck (PBNP) models47 have been proposed for describing ionic transport in channel systems. However, representing the bulk–protein interface, ion–ion interactions, and steric hindrance remains the main challenge in these approaches.45,48
Molecular dynamics (MD) simulations offer a means for such representations, as they serve as a valuable tool for understanding the dynamics of DNA translocation through nanopores at the microscopic level. DNA–nanopore systems have been computationally investigated since the beginning of the 2000s by using all-atom (AA) and, later, coarse-grained (CG) MD simulations. Aksimentiev et al. demonstrated that AA-MD simulations of electric field-driven transport through α-hemolysin19 or synthetic nanopores49,50 offer a qualitative and quantitative understanding of the translocation phenomenon, reproducing numerous experimental properties. Because of the inherent limitations of AA models for which the accessible time scales are far from experimental time scales, certain approximations must be applied. For instance, the translocation process may be accelerated by employing constrained or simplified protein nanopores, as well as by applying electric voltages at magnitudes exceeding experimental voltages by factors ranging from 10 to 100. Other computational studies have employed non-equilibrium MD simulation techniques, such as Steered Molecular Dynamics (SMD).19,33,51–55 SMD involves applying an external force to one or more atoms of a molecule, mimicking the electric field-driven force applied experimentally to guide DNA through a nanopore. SMD studies have proven efficient in capturing the dynamics of DNA translocation through confined geometries, including the effect of orientation on translocation dynamics,19 the key role of the K147 ring at the constriction part,51,54,55 and differences between translocating sequences.15
In contrast to AA models, CG models simplify complex systems by regrouping atoms and then smoothing the energy landscape. They significantly increase the computational efficiency and allow the simulation time scales of large biological systems to be closer to the experimental time scales.56 Consequently, CG MD simulations are an interesting option to study biomolecule translocation through nanopores. Among the various CG force fields available, the MARTINI force field,57 with its average four-to-one mapping, is one of the most widely adopted, especially for modelling membrane proteins in lipid environments.58 Stachiewicz et al. applied a MARTINI-like force-field in their study concerning DNA unzipping through solid nanopores under an electric voltage, using a variant CG model for DNA59–61 and adapting a protocol initially proposed by Comer et al.62 Their CG model facilitated the analysis of various translocation and unzipping parameters as a function of pore size,59,60 hairpin length, and sequence,61 with results aligning with experimental findings and previous AA simulations. However, they concluded that their CG DNA model is unsuitable for studying unzipping in nanopores with a diameter smaller than 1.6 nm and is, therefore, inadequate for αHL. Similarly, our group previously used the MARTINI CG force field to study the ionic transport through αHL inserted in a lipid membrane in the presence of an electric field.63 We successfully identified several specific features of this protein nanopore, including current asymmetry and anion selectivity, in accordance with previous computational studies and experimental findings. We also pinpointed the charged amino acids responsible for these current behaviours.64 These first results were very encouraging for further studies on αHL using the same validated protocol.
This article leverages the benefits and advances in CG MD simulation; in particular, we explore the translocation dynamics of ssDNA through the αHL nanopore by performing non-equilibrium MD simulations. To our knowledge, this is the first CG study to investigate ssDNA translocation using a full-length wild-type αHL, which is inserted in a DPPC lipid bilayer, while employing the MARTINI force field. Utilizing constant-force steered molecular dynamics (cf-SMD) simulations, we delve into the molecular details of ssDNA translocation dynamics. Our investigation encompasses the influence of the ssDNA length, molecule orientation at the pore entrance, and DNA phosphate charges on the translocation process. First, the translocation time per base and molecule is computed and compared with the experimental data. The molecular interactions between the ssDNA molecule and the αHL nanopore during the translocation events are then examined using contact maps. The detailed conformational dynamics of ssDNA molecules during translocation is studied by calculating the tilt angles of ssDNA bases and inter-base distances to explain the observed differences in translocation times between molecules. In addition to our CG MD simulations, we also performed single-channel recording experiments with the αHL nanopore in order to compare the simulation results with the experimental ones.
2 Results and discussion
The previously studied wild-type αHL nanopore system63,64 is used to investigate the ssDNA translocation exploiting cf-SMD by using the MARTINI CG force field. Applying an external electric field to mimic the experimentally applied voltage, as done in our previous ionic current studies, was not sufficient to guide the ssDNA through the pore. The DNA molecule remained stuck at the entrance to the pore, as shown in Fig. S2.† For this reason, steered molecular dynamics had to be used. Due to the use of the SMD method and unlike the two previous studies, this article will not focus on ionic currents through the pore.In each simulation, a poly(dA) ssDNA molecule in an elongated conformation is positioned at the entrance of the αHL, from either the 3′ or 5′ end, and its first nucleotide is pulled using a constant force of 400 kJ mol−1 nm−1 (see Methods, section 4.2.3 for details). This value corresponds to an applied force of 660 pN, which is much greater than the experimental forces estimated to be around 20 pN,10,16,17,65 yet consistent with other AA SMD simulations.19,54,55 An example of the starting conformation of the system can be seen in Fig. 1a. Table 1 summarizes all the MD simulations conducted in this paper, along with their denomination. Two replicas of twelve independent MD simulations are performed for 1 μs each: ten MD systems with different ssDNA nucleotide lengths pulled on the 3′ end, one MD system pulled on the 5′ end, and one MD system with a neutralized ssDNA, adding up to a total of 24 μs MD simulations (see Methods, section 4.2 for details). Section 2.1 presents the results of translocation time per base calculations for both orientations and compares them to the experimental data to assess the agreement between simulations and empirical observations. Additionally, the results of MD simulations with a neutral ssDNA molecule are presented, comparing the translocation times of ssDNA and neutral ssDNA molecules. Section 2.2 elucidates the interactions between the ssDNA molecule and the inner surface of the pore with the analysis of contact maps. The translocation angle of the ssDNA molecule is investigated in section 2.3 to provide insights into the effect of ssDNA orientation on translocation. Lastly, section 2.4 analyses the conformational dynamics of the ssDNA molecule within the αHL nanopore, notably the inter-base distance during the translocation. Whenever possible, experimental results of ssDNA translocations through αHL (presented in the ESI†) are used for comparison with the simulations. The details of the experimental procedure are presented in Methods, section 4.1.
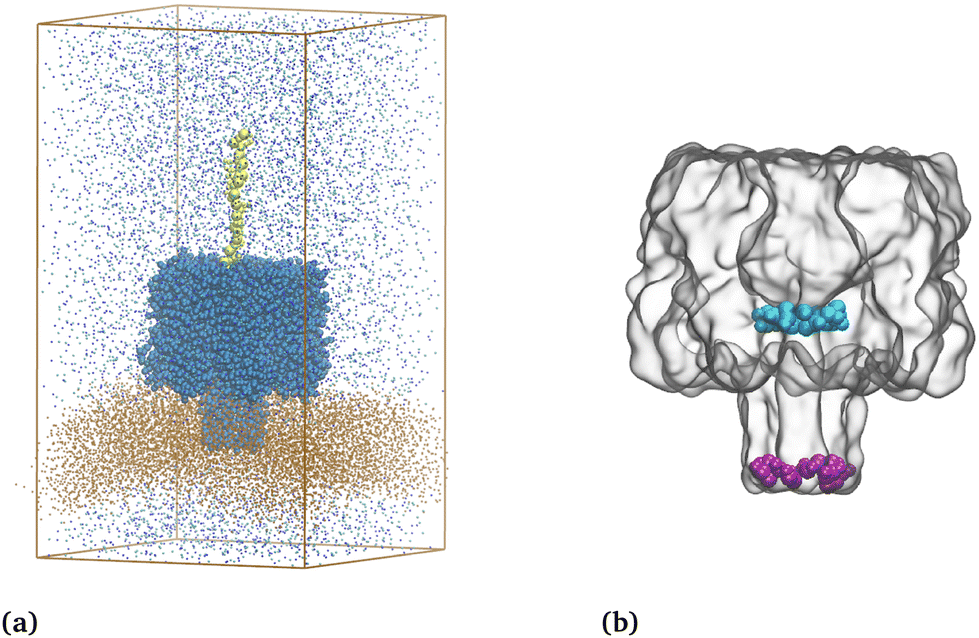 | ||
| Fig. 1 (a) Coarse-grained representation of the system at its initial conformation with a 10-nucleotide poly(dA) molecule. The DPPC lipid bilayer is depicted with brown points, ions with cyan and purple points, poly(dA) in yellow beads, and the α-hemolysin nanopores in blue beads. Water is not shown. (b) Surface representation of the coarse-grained αHL nanopore. Residues of the central constriction (E111/K147) and bottom (D127/K131) are shown in cyan and purple, respectively. | ||
| System name | Number of nucleotides | Orientation | Number of total strand translocations per μs | Total number of bases translocated per μs | ||
|---|---|---|---|---|---|---|
| Sim. #1 | Sim. #2 | Sim. #1 | Sim. #2 | |||
| a With neutralized phosphate groups. b Partial translocation. | ||||||
| Replica simulations are mentioned as system name-simulation # (e.g., 3′-A16-1 and 3′-A16-2). | ||||||
| 3′-A10 | 10 | 3′ | 10 | 8 | 102 | 85 |
| 3′-A11 | 11 | 3′ | 8 | 9 | 92 | 99 |
| 3′-A12 | 12 | 3′ | 5 | 5 | 61 | 62 |
| 3′-A13 | 13 | 3′ | 1 | 2 | 13 | 26 |
| 3′-A14 | 14 | 3′ | 3 | 2 | 44 | 29 |
| 3′-A15 | 15 | 3′ | 0b | 4 | 3 | 60 |
| 3′-A16 | 16 | 3′ | 3 | 2 | 52 | 35 |
| 3′-A16N | 16a | 3′ | 3 | 5 | 51 | 87 |
| 5′-A16 | 16 | 5′ | 0b | 1 | 6 | 16 |
| 3′-A17 | 17 | 3′ | 2 | 1 | 39 | 19 |
| 3′-A18 | 18 | 3′ | 0b | 0b | 4 | 4 |
| 3′-A19 | 19 | 3′ | 1 | 0b | 23 | 12 |
2.1 ssDNA translocation time per base
The translocation of ssDNA molecules is investigated across various systems, considering factors such as ssDNA length, orientation at the pore entrance, and charges present on the ssDNA molecules. The position of each base is tracked during translocation. A complete translocation time is calculated between the moments when a single base enters the constriction (E111/K147) and when it passes through the centre of mass of the bottom (D127/K131) of the αHL nanopore without going back (see Fig. 1b and Methods, section 4.3.1 for details). A total of 1024 bases are translocated during our 24 μs CG MD simulations. | ||
| Fig. 2 Distribution of translocation times per base of the ensemble of all CG cf-SMD simulations of charged ssDNA pulled from the 3′ end, on a logarithmic time scale. The average translocation time per base is shown with a red dashed line. | ||
Non-constant translocation times through the αHL nanopore were previously observed in AA MD simulations.19,66 While some AA studies report shorter translocation times of the order of a few nanoseconds19,66 compared to our CG-SMD results, a direct comparison between AA and CG simulations utilizing different methods remains challenging. Despite the observation of shorter translocation times,19,66 AA studies do not analyze the distribution of translocation times, likely due to the computational cost constraints of performing longer simulations.
On the other hand, the wide distribution of translation times observed in our simulations aligns with previous CG Langevin dynamics simulations46 and experimental studies.16,37 To accurately construct a translocation time per base histogram, experimental studies typically require at least 2000 translocation events as a rule of thumb.
Fig. S3† illustrates the translocation time per molecule as a function of the number of nucleotides of the translocating ssDNA molecule. The analysis of translocation times across different ssDNA lengths indicates a tendency for increased translocation time per molecule with longer ssDNA lengths. This observation is consistent with prior findings from experimental10,16,17 and theoretical67 studies, emphasizing the importance of the ssDNA length in the translocation dynamics. However, the absence of complete translocation events for 18-nucleotide poly(dA) and the variability observed in different replicas, especially the lack of translocation events for 15-nucleotide poly(dA) in one replica (see Table 1), highlight the complexity of factors influencing translocation events. This lack of translocation events for 18- or 15-nucleotide poly(dA) molecules is likely due to the ssDNA being “halted” during the simulation. This phenomenon is also seen experimentally. Halted ssDNA molecules contribute to the tail of the translocation time distribution. Longer simulations might eventually capture translocation events due to the broad distribution of translocation times, reflecting similar experimental observations. Additionally, differences and variability in translocation time per base between replicas of the same systems (see Table 1), which have also been observed in previous experimental studies,2,15,16,68 emphasize the importance of conducting multiple MD simulations to ensure robust statistical analysis. This need is effectively addressed by CG simulations compared to previous AA simulations, as explained in the Introduction.
![[thin space (1/6-em)]](https://www.rsc.org/images/entities/char_2009.gif) 000 events recorded (see Fig. S1†) and Muzard et al.37 found a ratio of 2.07, both of which are very close to our simulation results. Previous AA MD simulations by Wells et al.19 reported a ratio of 1.16 for the translocation time of identical molecules oriented at the 5′ or 3′ ends, which diverges more significantly from experimental findings and also from our CG results.
000 events recorded (see Fig. S1†) and Muzard et al.37 found a ratio of 2.07, both of which are very close to our simulation results. Previous AA MD simulations by Wells et al.19 reported a ratio of 1.16 for the translocation time of identical molecules oriented at the 5′ or 3′ ends, which diverges more significantly from experimental findings and also from our CG results.
These results demonstrate the capability of the MARTINI CG model to accurately reproduce the effect of ssDNA orientation on translocation time. The influence of the initial orientation of the molecule on the translocation dynamics will be further explored in section 2.3.
In summary, our CG cf-SMD simulations of charged ssDNA translocation through the α-hemolysin nanopore provide several significant insights and are in qualitative agreement with previous experimental,2,15,16,37,40 theoretical,46 and computational studies,19,40,66 with regard to translocation times. Moreover, simulations with a neutral ssDNA highlighted the influence of electrostatic interactions on translocation times. The following sections offer structural analyses that present a deeper understanding of the differences observed in the translocation time across different systems.
2.2 DNA–nanopore interactions during translocation
To gain additional understanding regarding these differences in translocation times between the charged ssDNA and the neutral ssDNA, this section describes the analysis of interactions between the DNA strand and the inner wall of the stem. αHL features two important lysine residues on each of the seven chains at both extremities of the stem: the K147 ring at the central pore constriction and the K131 ring at the pore bottom. Experimental21,22,69,70 and computational51,54,55,66,71 studies have demonstrated that these two positively charged lysine rings are responsible for attractive electrostatic interactions with the negatively charged ssDNA molecule. The rest of the inner stem is composed of neutral residues, which are hypothesized to have less interactions with the DNA. In this section, the DNA–pore interactions are quantified using contact maps between the ssDNA molecule and the amino acids pointing inside the stem. These contact maps depict the interactions between all the CG DNA beads and those present on the inner surface of the stem over time throughout the MD simulations. A contact is taken into account if the centres of mass of the beads are within 6 Å of each other.Fig. 3 presents the contact map for one of the 3′-A16 simulations as a function of time, each row representing an inner wall ring inside the stem. The dashed lines indicate the completion of the ssDNA molecule's translocation. During a complete translocation event, the number of contacts between each base of the ssDNA molecule and the central constriction exceeds the number of contacts with any other ring of the stem. The large number of contacts at the constriction can be explained by the structural characteristics of the αHL nanopore as the central constriction is the narrowest part of this nanopore. Numerous contacts are also observed at the charged bottom part, even though the radius of the bottom is the widest in the stem (the mean radius of the bottom is provided in Fig. S6 and Table S1†). Contact maps serve as a valuable tool for identifying instances when the ssDNA translocation is halted, as indicated by numerous contacts, especially at the constriction level over a certain period. Additionally, this large number of contacts, first at the constriction and then at the bottom of the pore, illustrates a translocation event.
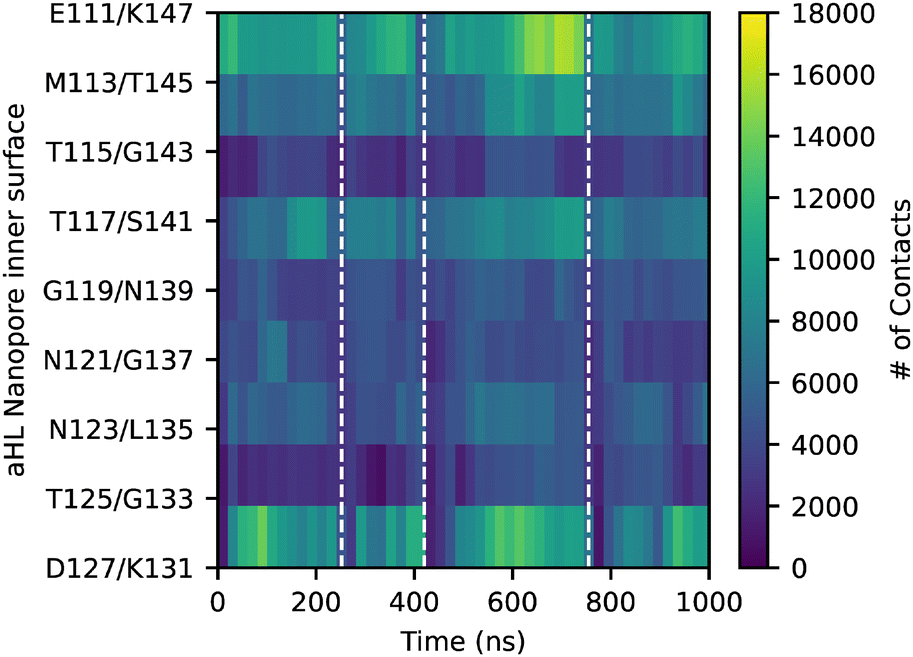 | ||
| Fig. 3 Contact map of 3′-A16-1 with each ring in the stem during 1 μs MD simulation. Dashed lines show the end of each translocation event. | ||
Contact maps can also be employed to explore the role of electrostatic interactions between charged phosphate groups and charged residues of the stem. Fig. 4 displays the contact map for one of the 3′-A16N simulations (contact maps from the other simulations are represented in Fig. S7†) and shows that, despite the ssDNA translocation being halted from time to time, the neutralized ssDNA molecule forms fewer contacts with the inner wall of the stem compared to the charged ssDNA molecule. As with the charged ssDNA simulations, there are also a large number of contacts with the constriction and the bottom rings of the stem, albeit in a much lower magnitude, as detailed in Table S2.† The higher frequency of translocation events with the neutral DNA (see Table 1) proves that the electrostatic interactions between the DNA and the inner wall of the stem are responsible for slowing down the passage of DNA. This observation aligns with previous experimental studies demonstrating that mutations of neutral residues to positively charged ones within the pore stem reduce the ssDNA translocation speed.20,43 These findings confirm the significant role of electrostatic interactions in ssDNA translocation. Nonetheless, it is important to acknowledge that the size limitations of the constriction region of the αHL nanopore remain a hindering factor to translocation, as evidenced by some instances where the neutral ssDNA molecule's translocation is halted. Although the electrostatic interactions are greatly simplified with the CG model (only +1 and −1 charged residues), the model can still capture the important electrostatic features of the ssDNA translocation phenomenon.
 | ||
| Fig. 4 Contact map of 3′-A16N-2 with each ring in the stem during 1 μs MD simulation. Dashed lines show the end of each translocation event. | ||
2.3 DNA tilting angles during translocation: 3′ vs. 5′
In section 2.1.2, differences in translocation times were observed between the 3′ and 5′ ssDNA molecule orientations. Specifically, the 3′ oriented molecule passes through the pore faster than the 5′ oriented molecule. This observation agrees with our experimental data (see Fig. S1†), as well as previous experimental37,40 and MD simulation studies.19 An experimental and theoretical study by Mathé et al.40 explained this difference by analyzing the tilt angle of a ssDNA molecule confined in a narrow cylinder with AA simulations and showed that the bases naturally tilt towards the 5′ end as the cylinder diameter decreases. This observation led the authors to conclude that the translocation of 3′ oriented molecules is facilitated by the upward tilt of the bases inside the narrower part of the pore, in contrast to the downward tilt observed for 5′ oriented molecules. However, the study by Mathé et al. focused only on the conformation of the ssDNA molecule inside the pore and not on the dynamics during the translocation process. A subsequent AA study using grid-SMD19 confirmed the influence of the base tilting on the 5′/3′ translocation velocity difference, by observing DNA conformations during translocation in both orientations, although without analyzing the bases’ tilt angle values throughout the simulation.To further explain the orientation-dependent tilting of the bases, we calculate the tilt angles between the ssDNA bases and the backbone as a function of the base position inside the pore (see Methods for details). Fig. 5 shows the evolution of this tilt angle for 3′-A16 and 5′-A16 systems as an average over bases and translocation events from the two replica simulations. The angle is defined so that it decreases as the base tilts towards the 5′ end, as represented in Fig. S8.† The tilt angles for 3′-A16 and 5′-A16 molecules have similar values before the pore entrance (respectively on average 94.6° for 3′ and 96.6° for 5′) and after the pore exit (82.7° for 3′ and 82.5° for 5′). The value of the tilting angle before the pore entry is very similar to the average value that we computed for a ssDNA molecule in solvent without any constraints (96.8°, see Fig. S9†), showing that the force is much weaker on the DNA bases located before the pore entrance.
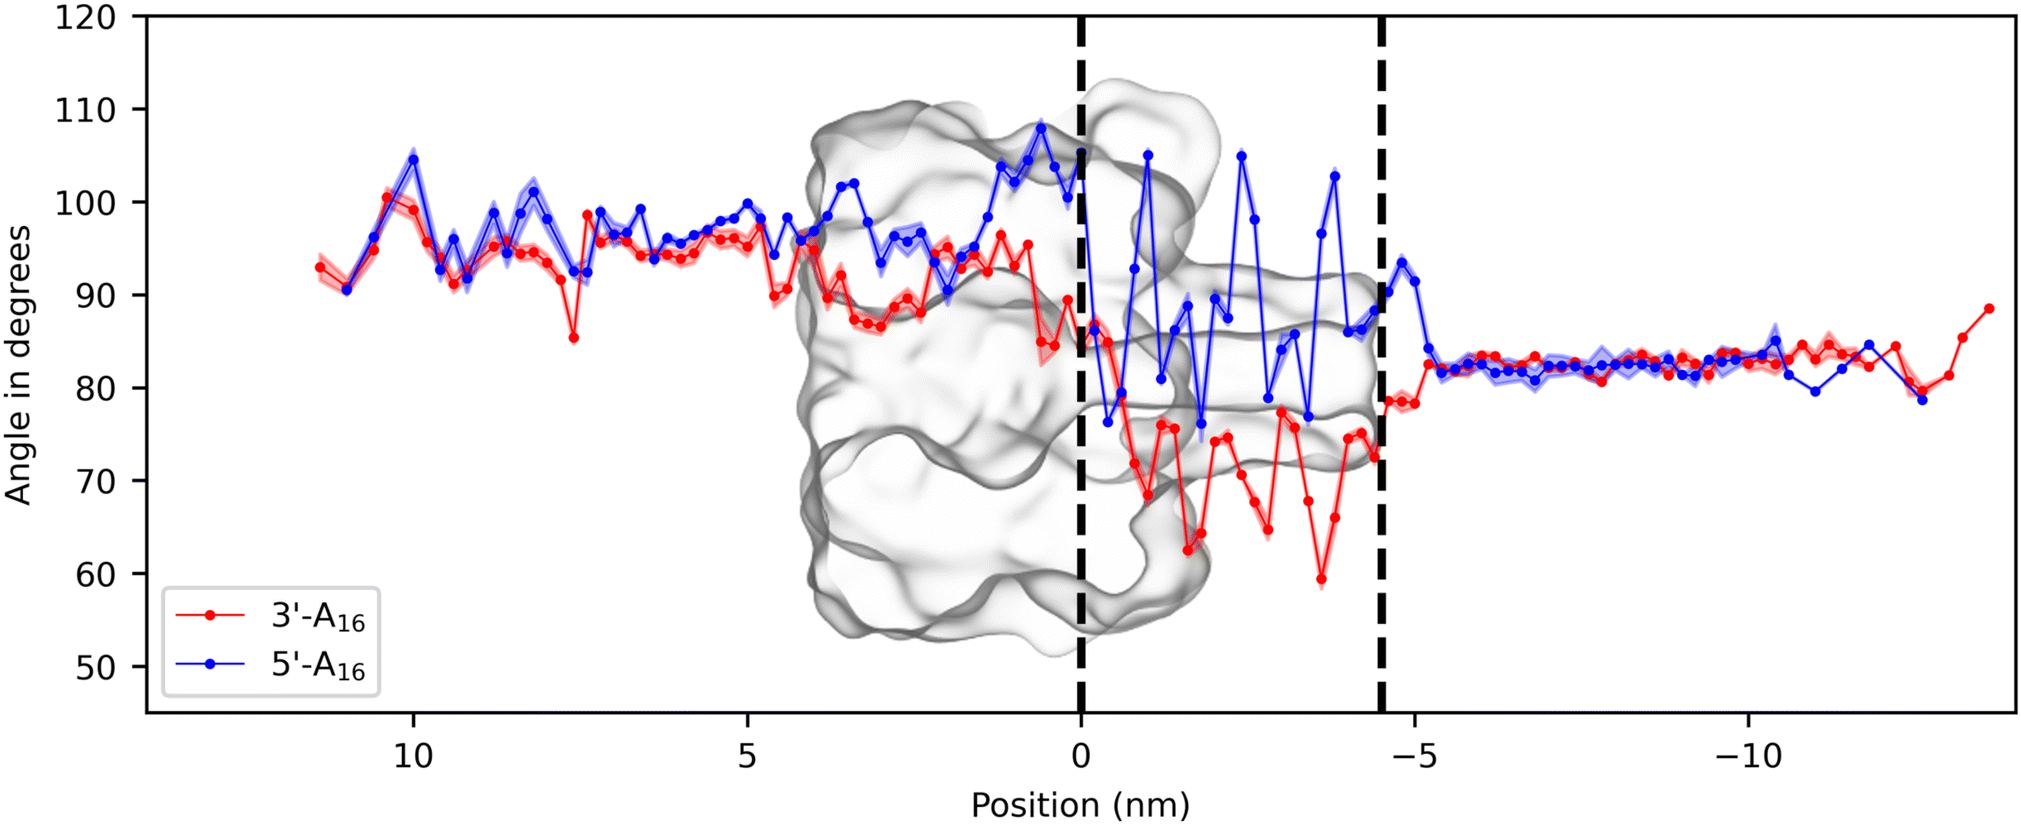 | ||
| Fig. 5 Effect of ssDNA orientation at the pore entrance on tilt angles during translocation. Average tilt angles of DNA bases relative to the backbone for 3′ end and 5′ end oriented 16-nucleotide poly(dA) molecules are given as red and blue circles, as a function of positions in the z-direction inside the simulation box. The displayed values represent the mean tilt angle for the 14 bases (excluding bases at both extremities) across all translocation events in the two simulation replicas, accompanied by their standard error. The black dashed lines denote the constriction and bottom of the stem. | ||
At the exit of the pore, the angle value is very close to the average value of 83.3°, which was observed for a ssDNA molecule pulled by the 3′-end without a nanopore (see Fig. S10†), whereas the average angle value for the DNA alone pulled by the 5′-end is about 93.3° (see Fig. S11†).
It is important to note the distinct nature of the pulling in the absence of the pore and pulling for translocation. During translocation, the nanopore confinement slows down the ssDNA molecule, potentially influencing the exiting tilt angle compared to the pulling in the absence of the pore. Similar effects on the conformational behaviour at the exit of the nanopore, as described in section 2.4, were observed on the ssDNA molecule stretching.
Upon exiting the nanopore, the ssDNA bases are mainly governed by the pulling force, as their interactions with the nanopore cease. There are fewer oscillations after the pore exit, since the pulling force is stronger on the first bases when other bases are still residing in the stem. In contrast, as illustrated in Fig. 5, the tilt angles inside the nanopore, especially in the stem, exhibit significant variation according to the orientation of the ssDNA molecule.
The tilt angle starts to differ in the vestibule of the pore where the molecule is moderately confined, slightly decreasing for 3′-A16 and increasing for 5′-A16. Inside the stem, for the 3′-A16 molecule, the tilt angle decreases drastically and oscillates, going down to a minimum value of about 60°, in order to pass through the narrower part of the pore. The angle exhibits larger oscillations for the 5′-A16 molecule, increasing to almost 110° but not reaching the value of 120°, the complementary value of the minimum tilt angle for the 3′-A16 molecule. In addition, the tilt angle repeatedly returns to around 85°, which is unfavourable for translocation since the bases are almost orthogonal to the backbone. To ensure that this observation is independent of the length of the DNA sequence, we further supported our findings by analyzing the tilt angle in 3′-A19 and 5′-A19 simulations (see Methods for details). As demonstrated in Fig. S12,† we observed the same phenomenon, since the effect of orientation is also visible in these additional simulations. In conclusion, in accordance with previous simulations,19,40 our results indicate that the tilt angle variation plays a critical role in the observed slower translocation in 5′ end oriented ssDNA. The base tilting necessary to pass through the narrowest part of the pore is not favourable in this orientation. These findings provide valuable insights into how the molecular orientation influences the translocation dynamics of ssDNA through the α-hemolysin nanopore.
2.4 Conformations of ssDNA inside the α-hemolysin nanopore during translocation
Pulling on the ssDNA by one end should elongate the molecule to facilitate the entry and eventually stretch the base links if the translocation is halted and the ssDNA molecule is held in the pore. Therefore, the stretching of the chain is a good indicator of the part of the chain interacting with the pore and halting its translocation.To study the conformations adopted by ssDNA during its translocation, the base positions in the z-direction as well as the inter-base distance of the ssDNA molecule are monitored and analysed throughout the MD simulations. Fig. 6 shows the position of the ssDNA bases along the z-axis for the 3′-A16-1 simulation (position graphs from other simulations are represented in Fig. S13†). As the ssDNA is pulled through the nanopore using cf-SMD, the molecule is first dragged in the solvent and elongated. The sharp transition at the stem entrance clearly shows that the first 3 to 4 bases of the 3′-end enter quickly the pore stem. The rest of the molecule adopts a less elongated conformation while waiting to cross the pore constriction, as depicted in the inset of Fig. 6, where the base position curves cross each other. On the other hand, the position curves evolve in parallel, highlighting that the nucleotides align with the pore axis (z-axis). This alignment happens when the nucleotides are inside the stem and remain in this aligned state even after exiting the pore, as long as some bases are still inside the stem. After the ssDNA has fully exited the pore, it is subsequently drawn through the solvent again until the next translocation event occurs.
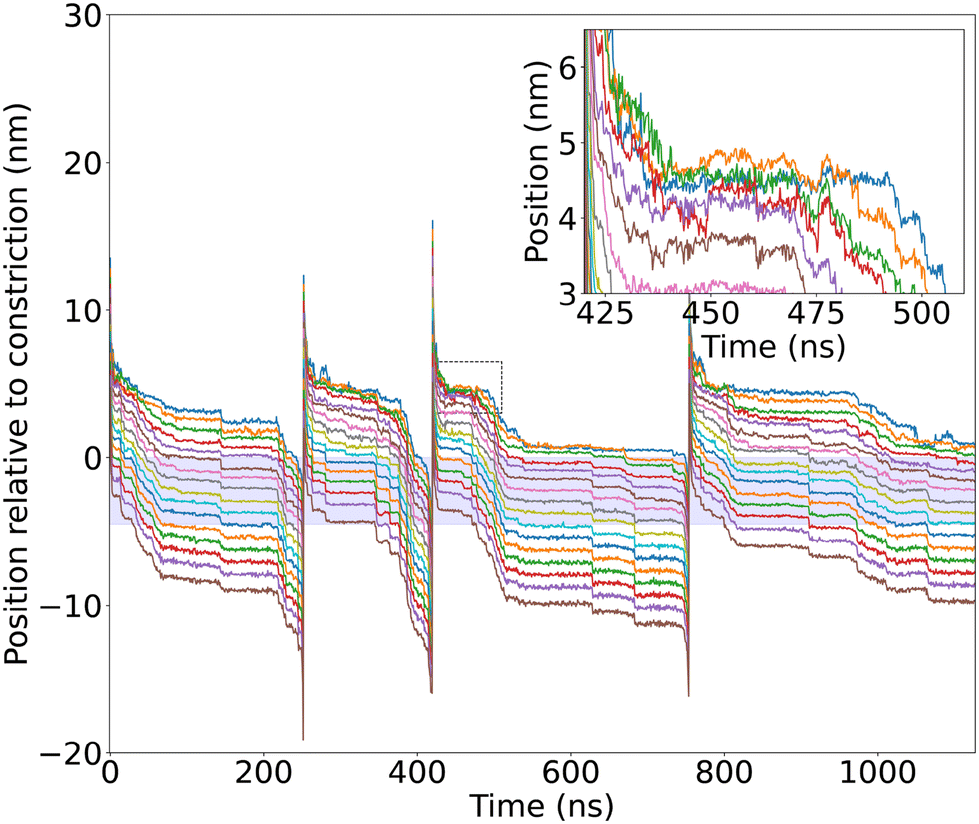 | ||
| Fig. 6 Base positions of 3′-A16-1 in the z-direction. The stem is depicted as a blue-filled region, with 0 on the z-axis corresponding to the pore constriction (E111/K147). The inset shows the positions of bases in the z-direction at the entrance of the nanopore before the constriction ring during the third translocation event. | ||
To understand the characteristics of the ssDNA extension during the translocation process, the inter-base distances are calculated along the molecule for each pair of consecutive bases. This measurement was first performed on free DNA (in the absence of the αHL nanopore and no force exerted on the ssDNA molecule) to have a reference for comparison (see Fig. S14†). The inter-base distances display three main values appearing with almost the same probability: 0.50 ± 0.08 nm, 0.71 ± 0.08 nm and 0.91 ± 0.12 nm. The inter-base distances for translocating ssDNA in our simulations are represented in Fig. 7 as a 2D-histogram vs. the position along the pore axis, with the stem region represented in red. On each side of this 2D histogram, the inter-base distance probability density is represented before entering (left panel) and after exiting (right panel) the stem. The first inter-base distance includes the base on which the SMD pulling force is applied and was thus not included in the calculation, as it is always more stretched than the rest of the molecule (the base 1–2 inter-base distance histogram is represented in the ESI in Fig. S15,† with a mean inter-base distance of 1.16 ± 0.05 nm). The last inter-base distance is also excluded for consistency between both orientations.
 | ||
| Fig. 7 Inter-base distances for 3′-A16 simulations. The distance between two successive bases (inter-base distance) for all pairs except the first and last ones is represented as a probability density. Central panel: probability density of inter-base distance as a function of the position along the pore axis. The stem is depicted as a red-filled region, with 0 representing the pore constriction ring (E111/K147). Left panel: probability density of inter-base distances before the entry of the DNA into the stem. It is the integration of the central panel over the position above the stem (z > zconstriction = 0 nm). Right panel: probability density of inter-base distances after the exit of the DNA from the stem. It is the integration of the central panel over the position below the stem (z < zbottom ≃ −4.5 nm). | ||
The inter-base distance clearly shows two main populations before the ssDNA enters the pore at 0.55 ± 0.10 nm and 0.89 ± 0.12 nm, very close to the first and third states of the free ssDNA molecule and to the two states observed on the ssDNA pulled in solution (Fig. S14a and b† respectively). It indicates that one of the free ssDNA inter-base states is no longer accessible for the ssDNA bases when the molecule is pulled during the translocation. On the other hand, the inter-base distance shows only one population after the pore exit, at 0.93 ± 0.06 nm, corresponding to the most stretched conformation observed on the free ssDNA and the ssDNA pulled in solution from the 3′ end. The insertion and the pulling of the ssDNA through the pore influence the equilibrium between the accessible states, favouring the more stretched conformation when the molecule is extended out of the pore, as expected. Equivalent findings are obtained with the 5′-A16 simulations and are presented in Fig. S16.†
Experimental measurements of the mean inter-base distance of a loaded ssDNA were previously published using a 10 pN force applied with optical tweezers72 or a 160 mV voltage using the nanopore technique.73 In these studies, the mean distance was found to be 0.42 nm, corresponding to the lowest value observed in our simulations, although we applied a much larger force. Previous AA-MD simulations reported a mean inter-base distance of about 0.6 nm with an applied voltage of 300 mV.66
Our observations on inter-base distances are similar to those concerning the tilt angles described in section 2.3. The ssDNA has more freedom to fluctuate before entering the stem compared to after the pore exit with two possible configurations for the part of the molecule waiting to enter the stem. In the first configuration, the applied SMD force guides the ssDNA into the stem, stretching it into an elongated conformation with the bases aligned along the pore's axis. Conversely, in the alternative configuration, the ssDNA molecule experiences no force and freely moves within or outside the vestibule.
This phenomenon arises from the preceding bases which are trapped in the pore, leading to less stretched pairs of bases in the vestibule and, consequently, a more folded conformation of that part of the molecule. Upon exiting the pore, the ssDNA must experience the applied force, thereby adopting a straight conformation characterized by a unique stretched inter-base distance. This behaviour was not reported in experimental studies due to the challenging nature of probing such fluctuations experimentally. However, conformational fluctuations were observed in nanopores under different conditions in an experimental study where a DNA hairpin fluctuated at the pore entrance while a ssDNA overhang was threaded in the pore, thus experiencing a less effective pulling force.37
3 Conclusions
This study demonstrates the suitability of the MARTINI CG model for investigating macromolecule translocation processes through nanopores. Using constant force SMD, our simulations qualitatively reproduce experimental observations, particularly the broad distribution of translocation time per base, which closely resembles the experimental distribution. To obtain such a distribution, a significant number of translocation events were simulated, and the large number of simulations needed were made feasible by the CG approximation. Our simulations also reproduced specific features, such as the influence of 3′/5′ DNA orientation on the translocation time, which is attributable to the observed preferential tilting angle of the DNA bases. The role of electrostatic interactions between DNA and αHL is also highlighted, as is the detailed conformation of the DNA molecule during translocation with inter-base distance calculations. Our results are thus consistent with previous experimental findings and simulations, offering novel phenomenological insights into the DNA translocation process through αHL.In our CG simulations, the properties of translocation events exhibit a wide range of variations. Each translocation event manifests distinct features, and this observation highlights the importance of analyzing multiple events. Relying solely on the analysis of a unique DNA translocation process may therefore yield misleading conclusions. This study thus underscores the importance of having sufficient statistics of these events in both experimental and theoretical approaches. Therefore, our work validates the value of coarse-grained simulations compared to AA simulations.
Our CG modelling procedure can now be extended to investigate further aspects of DNA translocation, including the influence of the DNA sequence on the translocation process. To better compare our simulations with experiments, the calculation of ionic currents during translocation can be carried out, using the recent steric exclusion method.74,75
Additionally, our approach can be applied to study the translocation dynamics of other biomolecules and explore various protein nanopores beyond αHL.
4 Methods
4.1 Single-channel recording experiments
An in-house made Teflon device68 was used for nanopore experiments. Ag/AgCl electrodes (1.0 mm diameter, Aldrich, Milwaukee, WI, USA) were installed in cis and trans chambers, which were filled with 100 μL of buffer containing 1 M KCl and 10 mM Tris at pH 8.0 to record the ionic current. A lipid bilayer using a film of 1,2-diphytanoyl-sn-glycero-3-phosphocholine (Avanti Polar Lipids, Alabaster, AL, USA) was formed across a conical aperture of 20–30 μm in diameter, separating the cis and trans chambers of the Teflon device. α-hemolysin proteins (Sigma-Aldrich, St Louis, MO, USA) were diluted in buffer (0.04 μg of α-hemolysin in 100 μL). Then, 1 μL of this solution was added to the cis side and a single α-hemolysin channel insertion was monitored using a 120 mV potential. poly(dA)50 polymers, purchased from Eurogentec, Belgium, were added to the cis side of the nanopore at a concentration of 1 μM. The current signals were amplified and measured with an Axon 700B patch clamp amplifier. The data acquisition and measurement automation were performed using an in-house developed program coded with LabView (National Instruments). Signal analysis, event finding and graph generation were performed using a Python 3 code.30 The translocation time histograms for 3′ and 5′ translocations were separated due to their characteristic times and blocked current using a Monte Carlo algorithm (see Fig. S1†).37,404.2 Molecular modelling and simulations
All MD simulations are performed using GROMACS software version 2020.1, with the MARTINI 2.2p (polarizable) force field.57 A temperature of 320 K is maintained with a v-rescale thermostat. The Berendsen barostat is used to keep the pressure at 1 bar. Electrostatic interactions are treated with the particle-mesh Ewald (PME) method,76,77 with a 2 Å Fourier grid spacing and a direct space cutoff radius of 13 Å. Periodic boundary conditions are applied.000 PW water molecules and then subjected to 50000 steps of minimization using the steepest descent algorithm and a step-wise equilibration procedure for 50 ns with the aim of gradually increasing the time step from 2 fs to 10 fs. 1M NaCl MARTINI ions are added using the genion option of GROMACS and the system underwent another minimization and is then equilibrated in the NPT ensemble for 20 ns with positional restraints using a force constant of 1000 kJ mol−1 nm−2 on the DNA backbone.
A neutralized poly(dA) ssDNA molecule comprising 16 nucleotides is generated by modifying the MARTINI force field parameters for DNA. Specifically, the charged Q0 type BB1 beads, which represent the phosphate groups, are replaced by neutral N0 type BB1 beads to mimic a neutral state for the ssDNA molecule. Otherwise, the same procedure was applied for preparing the neutral ssDNA molecule as described above.
000 PW-type water molecules. The water molecules that are inserted inside the lipid membrane are deleted using a script adapted from water_deletor.pl, available in the GROMACS tutorial.80
The system is minimized through 100000 minimization steps using the steepest descent algorithm and is then equilibrated, first in the NVT ensemble for 20 ns and then in the NPT ensemble for 30 ns, by maintaining constraints on the backbone of DNA and protein and using a time step of 10 fs. 1 M NaCl MARTINI ions are added to the system using the genion option of GROMACS and the resulting system is minimized for another 100000 steps using the steepest descent algorithm and equilibrated for another 50 ns using a similar protocol to that employed for the system without ions.
4.3 Analyses
Our study focuses on a detailed analysis of ssDNA translocation through the α-hemolysin nanopore. In-house written Python and C scripts are employed to perform all the analyses described below.The position of an inter-base was simply the mean position of the two constituting bases. To calculate the 2D-histograms, the z-axis is split into 0.2 nm intervals in which the distribution of the inter-base distances is computed with a bin size of 0.02 nm of the inter-base distance axis. All these distributions are then concatenated to obtain a 2D histogram after proper normalisation to get the probability density. The probability densities before and after the stem are obtained by integrating the 2D probability densities for z < 0 and z > zbottom, respectively.
Author contributions
C. O. and D. D. performed the simulations and all authors analysed the results. J. M. set up the experimental system and conducted the single-channel recording experiments. All authors participated in writing and reviewed the manuscript.Data availability
The data supporting the findings of the article “Exploring ssDNA translocation through α-hemolysin using Coarse-Grained Steered Molecular Dynamics” by Cagla Okyay, Delphine Dessaux, Rosa Ramirez, Jérôme Mathé and Nathalie Basdevant have been deposited in the Zenodo Database under https://doi.org/10.5281/zenodo.11580456.The data used to create plots and figures are provided, along with Gromacs files for one of the SMD CG trajectories (3′-A16-1 without water and ions).
Conflicts of interest
There are no conflicts to declare.Acknowledgements
This work is dedicated to the memory of Rosa Ramirez (1968–2023), who sadly passed away on December 23, 2023. We would like to express our sincere gratitude for her invaluable contribution to this research project. Rosa's enthusiasm, positivity, humor, and insightful contributions greatly enriched our collaborative working environment. While she is no longer with us, her positive influence continues to inspire us, and her presence is deeply missed. We are profoundly grateful for the opportunity to have worked alongside her.This work was granted access to the HPC resources of IDRIS under the allocation 2021, 2022 and 2023-[AD010707139R2] made by GENCI (Grand Equipement National De Calcul Intensif).
References
- B. M. Venkatesan and R. Bashir, Nat. Nanotechnol., 2011, 6, 615–624 CrossRef CAS PubMed.
- J. J. Kasianowicz, E. Brandin, D. Branton and D. W. Deamer, Proc. Natl. Acad. Sci. U. S. A., 1996, 93, 13770–13773 CrossRef CAS PubMed.
- Y. Wang, Q. Yang and Z. Wang, Front. Genet., 2015, 5, 449 Search PubMed.
- G. Celaya, J. Perales-Calvo, A. Muga, F. Moro and D. Rodriguez-Larrea, ACS Nano, 2017, 11, 5815–5825 CrossRef CAS PubMed.
- S. Bhattacharya, J. Yoo and A. Aksimentiev, ACS Nano, 2016, 10, 4644–4651 CrossRef CAS PubMed.
- A. H. Laszlo, I. M. Derrington, B. C. Ross, H. Brinkerhoff, A. Adey, I. C. Nova, J. M. Craig, K. W. Langford, J. M. Samson, R. Daza, K. Doering, J. Shendure and J. H. Gundlach, Nat. Biotechnol., 2014, 32, 829–833 CrossRef CAS PubMed.
- O. Braha, B. Walker, S. Cheley, J. J. Kasianowicz, L. Song, J. E. Gouaux and H. Bayley, Chem. Biol., 1997, 4, 497–505 CrossRef CAS PubMed.
- P. Chen, J. Gu, E. Brandin, Y.-R. Kim, Q. Wang and D. Branton, Nano Lett., 2004, 4, 2293–2298 CrossRef CAS PubMed.
- B. M. Venkatesan, B. Dorvel, S. Yemenicioglu, N. Watkins, I. Petrov and R. Bashir, Adv. Mater., 2009, 21, 2771 CrossRef CAS PubMed.
- J. Li and D. S. Talaga, J. Phys.: Condens.Matter, 2010, 22, 454129 CrossRef PubMed.
- S. Garaj, W. Hubbard, A. Reina, J. Kong, D. Branton and J. A. Golovchenko, Nature, 2010, 467, 190–193 CrossRef CAS PubMed.
- M. Wanunu and A. Meller, Nano Lett., 2007, 7, 1580–1585 CrossRef CAS PubMed.
- A. R. Hall, A. Scott, D. Rotem, K. K. Mehta, H. Bayley and C. Dekker, Nat. Nanotechnol., 2010, 5, 874–877 CrossRef CAS PubMed.
- C. Dekker, Nat. Nanotechnol., 2007, 2, 209–215 CrossRef CAS PubMed.
- A. Meller, L. Nivon, E. Brandin, J. Golovchenko and D. Branton, Proc. Natl. Acad. Sci. U. S. A., 2000, 97, 1079–1084 CrossRef CAS PubMed.
- A. Meller, L. Nivon and D. Branton, Phys. Rev. Lett., 2001, 86, 3435–3438 CrossRef CAS PubMed.
- D. W. Deamer and D. Branton, Acc. Chem. Res., 2002, 35, 817–825 CrossRef CAS PubMed.
- A. Aksimentiev and K. Schulten, Biophys. J., 2005, 88, 3745–3761 CrossRef CAS PubMed.
- D. B. Wells, V. Abramkina and A. Aksimentiev, J. Chem. Phys., 2007, 127, 125101 CrossRef PubMed.
- G. Maglia, M. R. Restrepo, E. Mikhailova and H. Bayley, Proc. Natl. Acad. Sci. U. S. A., 2008, 105, 19720–19725 CrossRef CAS PubMed.
- D. Stoddart, A. J. Heron, E. Mikhailova, G. Maglia and H. Bayley, Proc. Natl. Acad. Sci. U. S. A., 2009, 106, 7702–7707 CrossRef CAS PubMed.
- D. Stoddart, A. J. Heron, J. Klingelhoefer, E. Mikhailova, G. Maglia and H. Bayley, Nano Lett., 2010, 10, 3633–3637 CrossRef CAS PubMed.
- L. Restrepo-Pérez, C. Joo and C. Dekker, Nat. Nanotechnol., 2018, 13, 786–796 CrossRef PubMed.
- L. Song, M. R. Hobaugh, C. Shustak, S. Cheley, H. Bayley and J. E. Gouaux, Science, 1996, 274, 1859–1866 CrossRef CAS PubMed.
- J. Clarke, H.-C. Wu, L. Jayasinghe, A. Patel, S. Reid and H. Bayley, Nat. Nanotechnol., 2009, 4, 265–270 CrossRef CAS PubMed.
- A. E. Chavis, K. T. Brady, G. A. Hatmaker, C. E. Angevine, N. Kothalawala, A. Dass, J. W. F. Robertson and J. E. Reiner, ACS Sens., 2017, 2, 1319–1328 CrossRef CAS PubMed.
- F. Piguet, H. Ouldali, M. Pastoriza-Gallego, P. Manivet, J. Pelta and A. Oukhaled, Nat. Commun., 2018, 9, 966 CrossRef PubMed.
- C. Cao, N. Cirauqui, M. J. Marcaida, E. Buglakova, A. Duperrex, A. Radenovic and M. Dal Peraro, Nat. Commun., 2019, 10, 4918 CrossRef PubMed.
- V. Van Meervelt, M. Soskine, S. Singh, G. K. Schuurman-Wolters, H. J. Wijma, B. Poolman and G. Maglia, J. Am. Chem. Soc., 2017, 139, 18640–18646 CrossRef CAS PubMed.
- P. Bayat, C. Rambaud, B. Priem, M. Bourderioux, M. Bilong, S. Poyer, M. Pastoriza-Gallego, A. Oukhaled, J. Mathé and R. Daniel, Nat. Commun., 2022, 13, 5113 CrossRef CAS PubMed.
- M. Faller, M. Niederweis and G. E. Schulz, Science, 2004, 303, 1189–1192 CrossRef CAS PubMed.
- I. M. Derrington, T. Z. Butler, M. D. Collins, E. Manrao, M. Pavlenok, M. Niederweis and J. H. Gundlach, Proc. Natl. Acad. Sci. U. S. A., 2010, 107, 16060–16065 CrossRef PubMed.
- C. Cao, M.-Y. Li, N. Cirauqui, Y.-Q. Wang, M. Dal Peraro, H. Tian and Y.-T. Long, Nat. Commun., 2018, 9, 2823 CrossRef PubMed.
- S. E. Van der Verren, N. Van Gerven, W. Jonckheere, R. Hambley, P. Singh, J. Kilgour, M. Jordan, E. J. Wallace, L. Jayasinghe and H. Remaut, Nat. Biotechnol., 2020, 38, 1415–1420 CrossRef CAS PubMed.
- W. Vercoutere, S. Winters-Hilt, H. Olsen, D. Deamer, D. Haussler and M. Akeson, Nat. Biotechnol., 2001, 19, 248–252 CrossRef CAS PubMed.
- J. Mathe, H. Visram, V. Viasnoff, Y. Rabin and A. Meller, Biophys. J., 2004, 87, 3205–3212 CrossRef CAS PubMed.
- J. Muzard, M. Martinho, J. Mathé, U. Bockelmann and V. Viasnoff, Biophys. J., 2010, 98, 2170–2178 CrossRef CAS PubMed.
- Y. He, M. Tsutsui, R. H. Scheicher, C. Fan, M. Taniguchi and T. Kawai, Biophys. J., 2013, 105, 776–782 CrossRef CAS PubMed.
- I. C. Nova, I. M. Derrington, J. M. Craig, M. T. Noakes, B. I. Tickman, K. Doering, H. Higinbotham, A. H. Laszlo and J. H. Gundlach, PLoS One, 2017, 12, e0181599 CrossRef PubMed.
- J. Mathé, A. Aksimentiev, D. R. Nelson, K. Schulten and A. Meller, Proc. Natl. Acad. Sci. U. S. A., 2005, 102, 12377–12382 CrossRef PubMed.
- R. S. S. de Zoysa, D. M. M. Krishantha, Q. Zhao, J. Gupta and X. Guan, Electrophoresis, 2011, 32, 3034–3041 CrossRef CAS PubMed.
- L. Mereuta, A. Asandei, I. Andricioaei, J. Park, Y. Park and T. Luchian, Nanoscale, 2023, 15, 14754–14763 RSC.
- M. Rincon-Restrepo, E. Mikhailova, H. Bayley and G. Maglia, Nano Lett., 2011, 11, 746–750 CrossRef CAS PubMed.
- S. Y. Noskov, W. Im and B. Roux, Biophys. J., 2004, 87, 2299–2309 CrossRef CAS PubMed.
- B. Roux, T. Allen, S. Bernèche and W. Im, Q. Rev. Biophys., 2004, 37, 15–103 CrossRef CAS PubMed.
- I. Jou and M. Muthukumar, Biophys. J., 2017, 113, 1664–1672 CrossRef CAS PubMed.
- Q. Zheng and G.-W. Wei, J. Chem. Phys., 2011, 134, 194101 CrossRef PubMed.
- D. G. Levitt, Annu. Rev. Biophys. Biophys. Chem., 1986, 15, 29–57 CrossRef CAS PubMed.
- A. Aksimentiev, J. B. Heng, G. Timp and K. Schulten, Biophys. J., 2004, 87, 2086–2097 CrossRef CAS PubMed.
- A. Aksimentiev, Nanoscale, 2010, 2, 468–483 RSC.
- R. M. A. Manara, A. T. Guy, E. J. Wallace and S. Khalid, J. Chem. Theory Comput., 2015, 11, 810–816 CrossRef CAS PubMed.
- R. M. Manara, E. J. Wallace and S. Khalid, Sci. Rep., 2015, 5, 12783 CrossRef CAS PubMed.
- P. Rattu, F. Glencross, S. L. Mader, C.-K. Skylaris, S. J. Matthews, S. L. Rouse and S. Khalid, Comput. Struct. Biotechnol. J., 2021, 19, 6417–6430 CrossRef CAS PubMed.
- H. S. C. Martin, S. Jha, S. Howorka and P. V. Coveney, J. Chem. Theory Comput., 2009, 5, 2135–2148 CrossRef CAS PubMed.
- H. S. C. Martin, S. Jha and P. V. Coveney, J. Comput. Chem., 2014, 35, 692–702 CrossRef CAS PubMed.
- H. I. Ingólfsson, C. A. Lopez, J. J. Uusitalo, D. H. de Jong, S. M. Gopal, X. Periole and S. J. Marrink, Wiley Interdiscip. Rev.: Comput. Mol. Sci., 2014, 4, 225–248 Search PubMed.
- S. J. Marrink, H. J. Risselada, S. Yefimov, D. P. Tieleman and A. H. de Vries, J. Phys. Chem. B, 2007, 111, 7812–7824 CrossRef CAS PubMed.
- S. Kmiecik, D. Gront, M. Kolinski, L. Wieteska, A. E. Dawid and A. Kolinski, Chem. Rev., 2016, 116, 7898–7936 CrossRef CAS PubMed.
- A. Stachiewicz and A. Molski, J. Comput. Chem., 2015, 36, 947–956 CrossRef CAS PubMed.
- A. Stachiewicz and A. Molski, J. Comput. Chem., 2016, 37, 467–476 CrossRef CAS PubMed.
- A. Stachiewicz and A. Molski, J. Phys. Chem. B, 2019, 123, 3199–3209 CrossRef CAS PubMed.
- J. Comer, V. Dimitrov, Q. Zhao, G. Timp and A. Aksimentiev, Biophys. J., 2009, 96, 593–608 CrossRef CAS PubMed.
- N. Basdevant, D. Dessaux and R. Ramirez, Sci. Rep., 2019, 9, 15740 CrossRef PubMed.
- D. Dessaux, J. Mathé, R. Ramirez and N. Basdevant, J. Phys. Chem. B, 2022, 126, 4189–4199 CrossRef CAS PubMed.
- U. F. Keyser, B. N. Koeleman, S. van Dorp, D. Krapf, R. M. M. Smeets, S. G. Lemay, N. H. Dekker and C. Dekker, Nat. Phys., 2006, 2, 473–477 Search PubMed.
- A. T. Guy, T. J. Piggot and S. Khalid, Biophys. J., 2012, 103, 1028–1036 CrossRef CAS PubMed.
- D. K. Lubensky and D. R. Nelson, Biophys. J., 1999, 77, 1824–1838 CrossRef CAS PubMed.
- M. Akeson, D. Branton, J. J. Kasianowicz, E. Brandin and D. W. Deamer, Biophys. J., 1999, 77, 3227–3233 CrossRef CAS PubMed.
- R. F. Purnell and J. J. Schmidt, ACS Nano, 2009, 3, 2533–2538 CrossRef CAS PubMed.
- P. M. De Biase, E. N. Ervin, P. Pal, O. Samoylova, S. Markosyan, M. G. Keehan, G. A. Barrall and S. Y. Noskov, Nanoscale, 2016, 8, 11571–11579 RSC.
- P. J. Bond, A. T. Guy, A. J. Heron, H. Bayley and S. Khalid, Biochemistry, 2011, 50, 3777–3783 CrossRef CAS PubMed.
- C. Bustamante, S. B. Smith, J. Liphardt and D. Smith, Curr. Opin. Struct. Biol., 2000, 10, 279–285 CrossRef CAS PubMed.
- D. Stoddart, L. Franceschini, A. Heron, H. Bayley and G. Maglia, Nanotechnology, 2015, 26, 084002 CrossRef CAS PubMed.
- J. Wilson, K. Sarthak, W. Si, L. Gao and A. Aksimentiev, ACS Sens., 2019, 4, 634–644 CrossRef CAS PubMed.
- A. Choudhary, C. Maffeo and A. Aksimentiev, Phys. Chem. Chem. Phys., 2022, 24, 2706–2716 RSC.
- T. Darden, D. York and L. Pedersen, J. Chem. Phys., 1993, 98, 10089–10092 CrossRef CAS.
- U. Essmann, L. Perera, M. L. Berkowitz, T. Darden, H. Lee and L. G. Pedersen, J. Chem. Phys., 1995, 103, 8577–8593 CrossRef CAS.
- L. Schrödinger, The PyMOL Molecular Graphics System, Version 2.3, 2019, https://pymol.org/ Search PubMed.
- J. J. Uusitalo, H. I. Ingólfsson, P. Akhshi, D. P. Tieleman and S. J. Marrink, J. Chem. Theory Comput., 2015, 11, 3932–3945 CrossRef CAS PubMed.
- water_deletor.pl, https://www.mdtutorials.com/gmx/membrane_protein/Files/water_deletor.pl.
Footnotes |
| † Electronic supplementary information (ESI) available. See DOI: https://doi.org/10.1039/d4nr01581a |
| ‡ Present address: TBI, Université de Toulouse, CNRS, INRAE, INSA, Toulouse, France. |
| § Deceased. |
| This journal is © The Royal Society of Chemistry 2024 |