
 Open Access Article
 This Open Access Article is licensed under a Creative Commons Attribution-Non Commercial 3.0 Unported Licence
Nanoscale visualization of phase separation in binary supported lipid monolayer using tip-enhanced Raman spectroscopy†
Yashashwa
Pandey
,
Andrea
Ingold
,
Naresh
Kumar
 * and
Renato
Zenobi
*
* and
Renato
Zenobi
*
Department of Chemistry and Applied Biosciences, ETH Zurich, Vladimir-Prelog-Weg 3, 8093 Zurich, Switzerland. E-mail: naresh.kumar@org.chem.ethz.ch; zenobi@org.chem.ethz.ch
First published on 6th May 2024
Abstract
Supported lipid membranes are an important model system to study the phase separation behavior at the nanoscale. However, the conventional nanoanalytical tools often fail to provide reliable chemical characterization of the phase separated domains in a non-destructive and label-free manner. This study demonstrates the application of scanning tunneling microscopy-based tip-enhanced Raman spectroscopy (TERS) to study the nanoscale phase separation in supported d62-DPPC![[thin space (1/6-em)]](https://www.rsc.org/images/entities/char_2009.gif) :DOPC lipid monolayers. Hyperspectral TERS imaging successfully revealed a clear segregation of the d62-DPPC-rich and DOPC-rich domains. Interestingly, nanoscale deposits of d62-DPPC were observed inside the DOPC-rich domains and vice versa. High-resolution TERS imaging also revealed the presence of a 40–120 nm wide interfacial region between the d62-DPPC-rich and DOPC-rich domains signifying a smooth transition rather than a sharp boundary between them. The novel insights obtained in this study demonstrate the effectiveness of TERS in studying binary lipid monolayers at the nanoscale.
:DOPC lipid monolayers. Hyperspectral TERS imaging successfully revealed a clear segregation of the d62-DPPC-rich and DOPC-rich domains. Interestingly, nanoscale deposits of d62-DPPC were observed inside the DOPC-rich domains and vice versa. High-resolution TERS imaging also revealed the presence of a 40–120 nm wide interfacial region between the d62-DPPC-rich and DOPC-rich domains signifying a smooth transition rather than a sharp boundary between them. The novel insights obtained in this study demonstrate the effectiveness of TERS in studying binary lipid monolayers at the nanoscale.
1. Introduction
Phase segregation of lipids is an important process that leads to the formation of lipid rafts, which play a central role in sorting cell membrane proteins and determining membrane fluidity.1–5 The size of the phase-separated domains in cell membranes can vary from tens of nanometers to several microns.6–9 However, their direct observation in the complex cellular environment is challenging. As a result, supported lipid monolayers and bilayers6,10,11 with a defined chemical composition are used as model systems to study the properties of phase-separated domains. Furthermore, supported lipid membranes also offer promising applications in the development of advanced technologies including sensitive detection systems, drug and gene delivery systems, vaccine development, and biocompatible electronic interfaces.12–21Supported lipid monolayers in particular, are a valuable model system to study membrane biophysics.22 Since a monolayer is half of a bilayer, it can be effectively used to explore various interfacial processes, such as interactions between proteins and membranes,10 drugs and membranes,23 as well as enzymatic reactions.24 Furthermore, they are an excellent biomimicking systems for studying pulmonary surfactant monolayer in the alveoli of lungs.25 Studying phase segregation of supported lipid monolayers at the nanoscale is crucial for the understanding of biological processes as well as for potential technological applications.16,26–33 However, the inherently heterogeneous nature of lipid domains and the limitations of the current analytical tools present significant challenges. Super-resolution fluorescence microscopy, nanoscale infrared spectroscopy, and nanoscale secondary ion mass spectrometry are techniques that in principle have the necessary capabilities. However, they suffer from serious limitations such as altering the native behavior of lipids due to the need for fluorophore labelling,34,35 insufficient sensitivity,36 or lack of detailed chemical information due to severe molecular fragmentation.37
On the contrary, tip-enhanced Raman spectroscopy (TERS) offers several advantages over other techniques for studying phase separation of lipid monolayers at the nanoscale level. TERS combines the high spatial resolution of scanning probe microscopy with the molecular specificity and sensitivity of surface-enhanced Raman spectroscopy, enabling the acquisition of chemically specific information with nanoscale spatial resolution.38–40 Importantly, TERS does not require fluorescent probes, thus allowing for a label-free analysis, and eliminating potential perturbations in the system.41 Hyperspectral TERS imaging has been successfully used to probe phospholipid species.7,42–44 For example, in our previous work, we demonstrated reproducibility of the hyperspectral TERS imaging on supported DPPC monolayers.42 Furthermore, high-resolution TERS imaging revealed differences in the ordering of DPPC molecules at the nanoscale level.
The outer leaflet of cell membranes has a surface pressure of ca. 30 mN m−1.45 At such surface pressures, formation of stable nanometer-sized phase-separated domains has been observed in supported lipid monolayers.46–48 However, phase separation behavior of these nanometer-sized domains is not well understood, primarily due to the lack of sensitivity and spatial resolution of the current analytical methods. Herein, TERS imaging was employed to study the phase separation behavior of the nanometer-sized domains in d62-1,2-dipalmitoyl-sn-glycero-3-phosphocholine: 1,2-dioleoyl-sn-glycero-3-phosphocholine (d62-DPPC:DOPC) lipid monolayers supported on Au(111) transferred at a high surface pressure of 30 mN m−1 using Langmuir–Blodgett (LB) method. Hyperspectral TERS imaging successfully revealed the phase separation of d62-DPPC-rich and DOPC-rich domains. Interestingly, nanoscale deposits of d62-DPPC were observed in the DOPC-rich domains and vice versa. High-resolution TERS imaging also revealed the presence of a 50–100 nm wide interfacial region between the d62-DPPC-rich and DOPC-rich domains in supported d62-DPPC:DOPC monolayer signifying a smooth transition rather than a sharp boundary between them. This study demonstrates the potential of STM-TERS as a non-invasive, label-free analytical tool for imaging biomimetic phase-separated lipid systems at the nanoscale level.
2. Results and discussion
A schematic diagram of the STM-TERS setup used to investigate the phase separation behavior in d62-DPPC:DOPC (1:1) monolayer is shown in Fig. 1. The experimental details are presented in the ESI.† The Langmuir isotherm of the d62-DPPC:DOPC monolayer transferred on Au(111) shown in Fig. S1† confirmed a successful transfer with an area of 0.19 nm2 per lipid chain. In supported d62-DPPC:DOPC monolayers, formation of phase-separated domains is expected due to the distinct phase transition temperatures of d62-DPPC (Tm = 36.7 °C)49 and DOPC (Tm = −16.5 °C).50,51 To differentiate between the DPPC and DOPC domains, deuterated DPPC was used, since the C–D signal lies in the silent region (2000–2200 cm−1) of the Raman spectrum and can be easily distinguished from the C–H signal of DOPC. Furthermore, deuteration causes minimal perturbation of the physical and chemical properties of DPPC, thereby enabling a reliable investigation of the phase separation behavior.49
 | ||
| Fig. 1 Schematic diagram of the top-illumination STM-TERS setup used to investigate nanoscale phase separation in supported lipid monolayers in this work. | ||
The presence of the lipid monolayer on Au(111) surface was first verified using atomic force microscopy (AFM). Fig. S2† shows an AFM topography image of a d62-DPPC:DOPC monolayer on a Au(111) surface, where numerous lipid patches are visible. The height of the transferred monolayer was found to be 2.5 ± 0.2 nm, which is in good agreement with previous reports.52,53
Simultaneous STM and hyperspectral TERS imaging of the supported d62-DPPC:DOPC monolayer is shown in Fig. 2. Fig. 2a displays the STM topography image of the sample measured with the TERS image with a step size of 40 nm, where “high” and “low” refer to the relative height. It is well known that STM height can be influenced by the local electronic properties of the sample and the applied bias.54,55 Therefore, the absolute values may not represent the true height and only provide a qualitative description of the sample surface. The dark features visible in Fig. 2a represent a more disordered arrangement of lipid molecules (see discussion of Fig. 3d). Notably, even though the thickness of lipid monolayer is ca. 2.6 nm (Fig. S2†), electron tunneling between the STM tip and the sample surface still works effectively. The tunneling of electrons through lipids/alkanethiols has also been demonstrated in previous studies,54,56 although its precise mechanism is not entirely clear yet. Some studies indicate that the tunneling process could be facilitated by interfacial water57,58 and/or electron hopping through the lipid chains.8,45,54,56,59
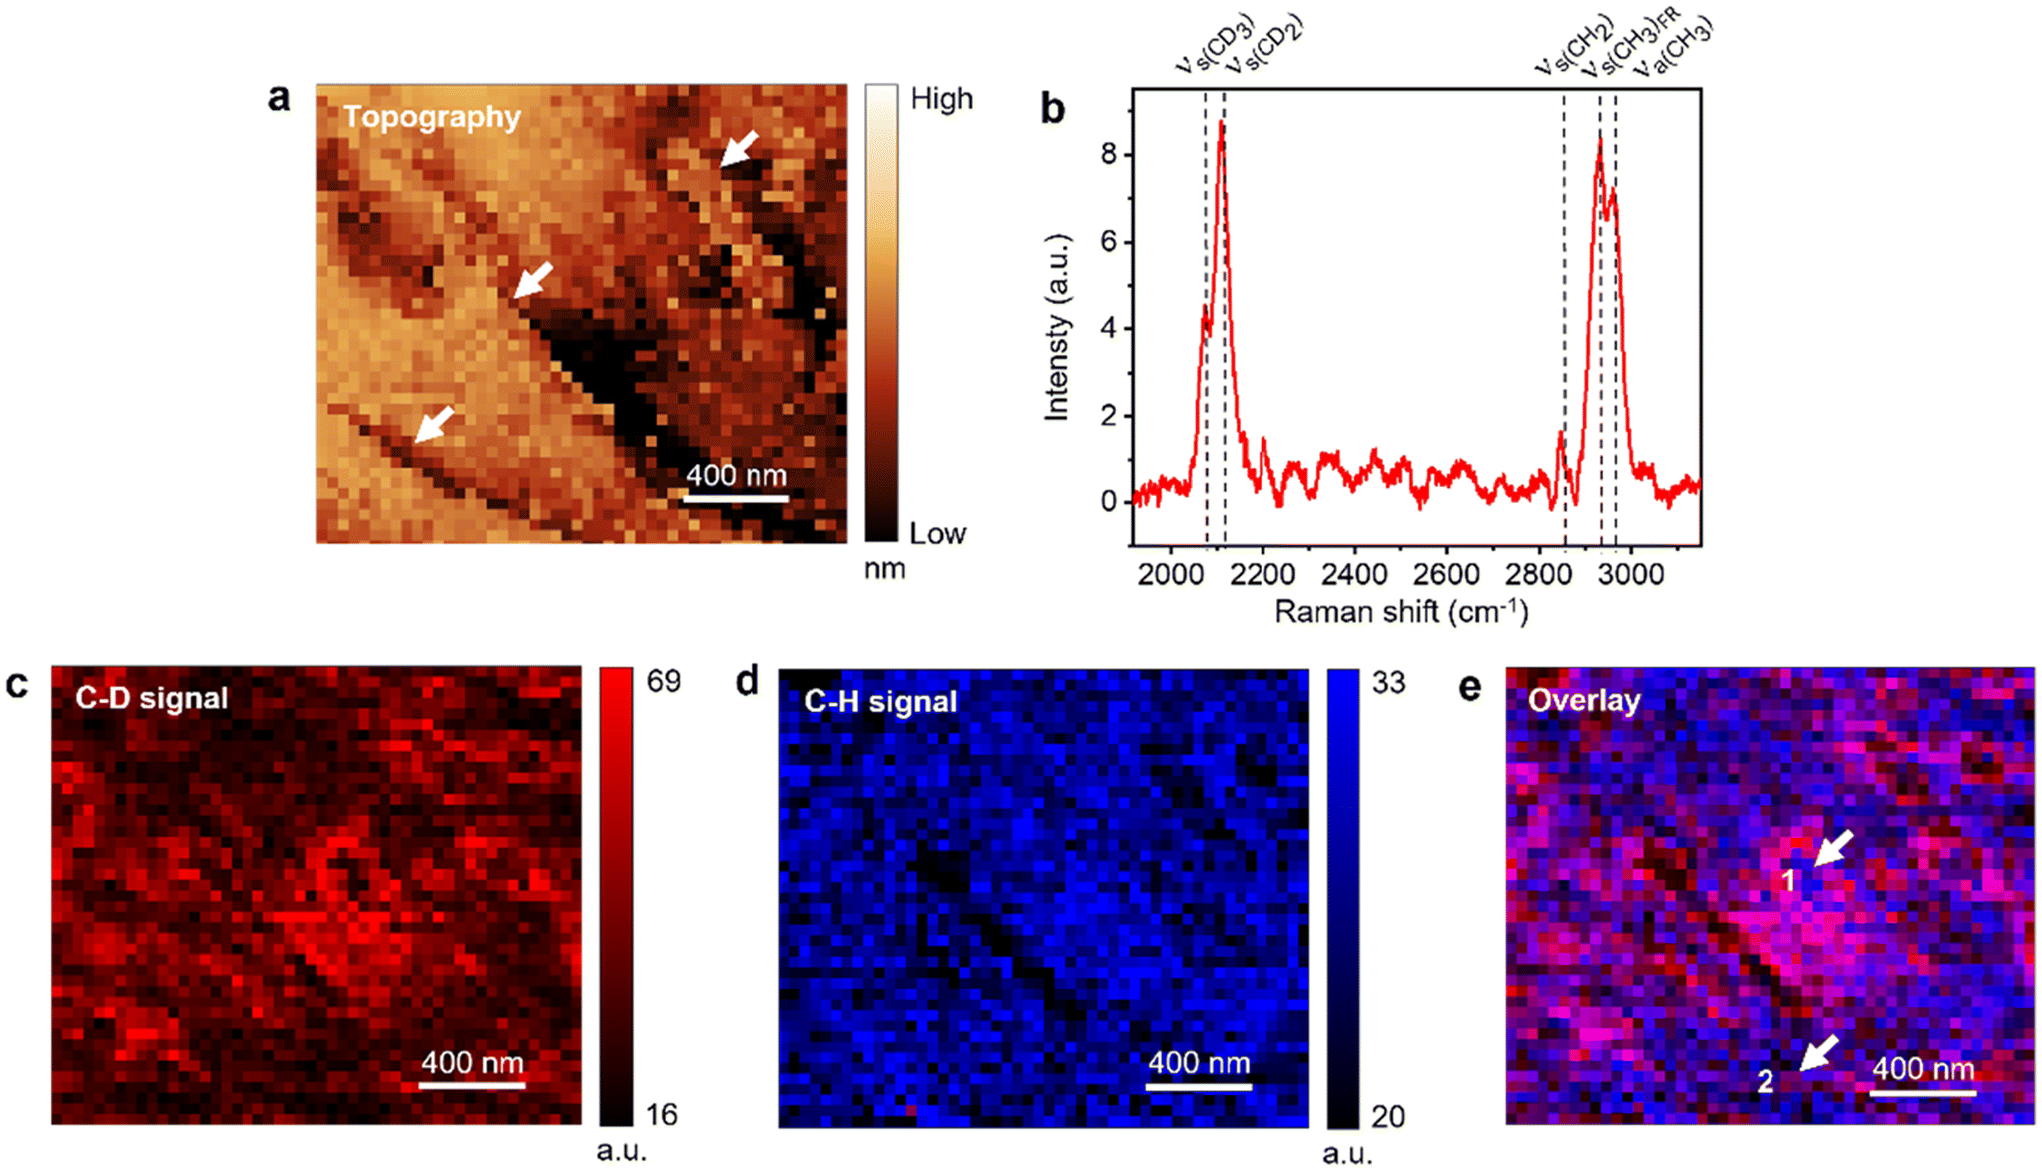 | ||
| Fig. 2 (a) STM topography image of d62-DPPC:DOPC (1:1) monolayer supported on Au(111) measured simultaneously with the hyperspectral TERS image. Step size: 40 nm. The step edges of the Au(111) surface are highlighted with white arrows. (b) Averaged TERS spectrum and TERS images of the (c) C–D signal (2000–2200 cm−1) and (d) C–H signal (2800–3200 cm−1) measured in the d62-DPPC:DOPC monolayer region shown in panel a. Step size: 40 nm. The averaged spectrum in panel b represents mean of the 2150 spectra measured in the TERS image. (e) Overlay of the TERS images of C–D and C–H signals shown in panels c and d, respectively. White arrows indicate the presence of nanoscale d62-DPPC pockets inside DOPC-rich domains and vice versa. | ||
 | ||
| Fig. 3 (a) t-SNE dimension plot of the first five PCs obtained from the hyperspectral TERS image of d62-DPPC:DOPC monolayer presented in Fig. 2. (b) TERS spectra corresponding to the clusters 0 (purple), 1 (light green) and 2 (dark green) in panel a. (c) TERS intensity image of the clusters 0 (purple), 1 (light green) and 2 (dark green). (d) TERS image of the I2960/I2850 ratio. | ||
The averaged spectrum of the hyperspectral TERS image showing the C–D and the C–H stretching regions is presented in Fig. 2b. The C–D stretching signal originates from the d62-DPPC, whereas the C–H stretching signal is dominated by the DOPC molecules as shown by the comparison of reference Raman spectra in Fig. S3.† A detailed assignment of the TERS bands is presented in Table S1.†Fig. 2c shows TERS image of the C–D signal where a heterogenous distribution of the d62-DPPC molecules is observed with a large d62-DPPC-rich domain located in the center surrounded by smaller domains. TERS image of the C–D and C–H signals ratio (IC–D/IC–H) presented in Fig. S4† confirms aggregation of the d62-DPPC molecules into distinct phase-separated domains.
Fig. 2d shows the TERS image of the C–H signal, which also shows a non-uniform distribution of DOPC molecules including a few regions of very low TERS signal. It should be noted that the TERS tip does not penetrate the lipid monolayer since several features observed in the TERS images in Fig. 2c and d correlate very well with the sample topography. This would not be the case if the TERS tip was penetrating the lipid monolayer. Furthermore, we can also rule out the possibility of the TERS tip being contaminated with lipid molecules and generating a SERS signal since a contaminated tip would give a very similar intensity of Raman signal throughout the TERS image. Notably, while the STM topography image provides no chemical information, the TERS image provides a detailed chemical characterization of the sample.
Further insight into the distribution of d62-DPPC and DOPC molecules is gained from the overlay of C–D and C–H signal TERS images in Fig. 2e. Notably, the separation of domains is quite apparent in the overlay image, where the blue areas represent a relatively higher concentration of DOPC and the red and pink areas represent a relatively higher concentration of d62-DPPC. Interestingly, it is found that the d62-DPPC-rich and DOPC-rich domains are not 100% “pure”. Instead, they exhibit a significant heterogeneity with the presence of several nanoscale d62-DPPC pockets inside the DOPC-rich domains and vice versa as highlighted by the arrows in Fig. 2e. For example, the TERS spectra measured at positions 1 and 2 marked in Fig. 2e are displayed in Fig. S5.† Position 1 shows a relatively higher C–H signal, whereas position 2 shows a relatively higher C–D signal indicating the predominance of DOPC and d62-DPPC at these locations, respectively. It should be noted that the previous AFM studies have reported submicron-size phase-separated lipid domains at 30 mN m−1 surface pressure based on the sample topography.46,60,61 However, no chemical information regarding the segregated lipid domains could be obtained in these studies.
Note that the spatial resolution of the TERS images in Fig. 2d and e is limited by the step size of hyperspectral imaging, which was set to 40 nm. In several areas of Fig. 2c, a strong C–D signal is observed in isolated single pixels or along a line of single pixels. If we define spatial resolution as the smallest feature distinguished in the sample, then the spatial resolution of the TERS imaging in Fig. 2 is estimated to be ≈40 nm.
To further analyze the phase separation in the d62-DPPC:DOPC monolayer, principal component analysis (PCA), t-distributed stochastic neighbor embedding (t-SNE) and hierarchical clustering analysis (HCA) of the hyperspectral data measured in the TERS image was performed. t-SNE analysis was performed on the first five principal components (PCs) obtained from PCA and the reduced dimensions obtained from t-SNE were grouped using HCA, which showed that the TERS spectra clustered into three distinct groups (0, 1 and 2) as depicted in Fig. 3a. The number of clustering groups was selected after comparing the average spectra of several clusters and finding the minimum number of clusters which gave unique TERS spectra. Average TERS spectra corresponding to the three distinct clusters in Fig. 3a are shown in Fig. 3b, where cluster ‘0’ has a relatively higher C–D signal and therefore is assigned to the d62-DPPC-rich domains, cluster ‘2’ has a relatively high C–H signal and is assigned to the DOPC-rich domains, and cluster ‘1’ has similar C–D and C–H signals and is assigned to domains with an “intermediate” (neither high nor low) concentration of the d62-DPPC and DOPC molecules. An image created using the three cluster labels is presented in Fig. 3c, where the d62-DPPC-rich (purple) and DOPC-rich (dark green) domains are clearly distinguished from each other. The DOPC-rich, d62-DPPC-rich and the intermediate regions occupy 47%, 24% and 28% of the surface area, respectively. Interestingly, in most areas of the image, there is no sharp boundary between the d62-DPPC-rich and DOPC-rich domains. Instead, the transition from the d62-DPPC-rich to the DOPC-rich domains occurs via an “intermediate” region, which has a width of 40–120 nm. It should be noted that such subtle variations in the composition of segregated lipid domains cannot be visualized using conventional optical microscopy such as confocal Raman or infrared imaging due to their diffraction-limited spatial resolution and low sensitivity.
In supported lipid monolayers, the ordering of the acyl chains can be analyzed using the ratio of 2960 and 2850 cm−1 signals (I2960/I2850 ratio). The 2850 cm−1 signal is assigned to the CH2 symmetric while the 2960 cm−1 signal is assigned the Fermi resonance associated with the terminal CH3 symmetric stretch and C–H bending mode. The I2960/I2850 ratio represents intermolecular chain coupling in the DPPC monolayer, whereby a relatively higher I2960/I2850 ratio indicates a more disordered arrangement of the acyl chains.42,62 To visualize the ordering of DOPC molecules in the d62-DPPC:DOPC monolayer, a TERS image of the I2960/I2850 ratio is presented in Fig. 3d. Notably, the DOPC-rich areas display a relatively low I2960/I2850 ratio (average I2960/I2850 = 0.9), whereas the average I2960/I2850 in the d62-DPPC-rich areas is found to be 9 times higher (average I2960/I2850 = 8.1). This signifies that in the d62-DPPC-rich areas, the DOPC molecules adopt a significantly more disordered arrangement compared to the DOPC-rich areas. We also performed TERS measurements in another area of the sample where a clear segregation of the lipid monolayer into the DPPC-rich, DOPC-rich, and intermediate regions was observed again (like Fig. 2 and 3), although the width of the Intermediate region was found to be ca. 2× larger.
3. Conclusions
In this work, we applied hyperspectral TERS imaging to probe nanoscale phase separation in supported d62-DPPC:DOPC lipid monolayer. Our findings demonstrate that in these supported binary lipid monolayers, even though micrometer-sized phase-separated domains may disappear at high surface pressures as reported previously,48 nanometer-sized domains continue to exist. Furthermore, hyperspectral TERS imaging provided a wealth of information regarding the phase separation behavior in the supported d62-DPPC:DOPC monolayer and the phase-separation of the d62-DPPC and DOPC domains could be clearly visualized with nanoscale resolution. Interestingly, the phase-separated domains were found to be not 100% pure but contained nanoscale deposits of d62-DPPC inside the DOPC-rich domains and vice versa. The high-quality spectral information also allowed visualization of molecular ordering in the phase-separated domains. Interestingly, the DOPC molecules were found to be present in a significantly more disordered state inside the d62-DPPC-rich domains compared to the DOPC-rich domains. A particularly notable finding of this study is the revelation of an interfacial region of 40–120 nm width between the d62-DPPC-rich and DOPC rich domains, which has not been reported before. These results enlighten the complexity of phase separation behavior in binary lipid membranes at the nanoscale level and demonstrate that hyperspectral STM-TERS imaging can be an effective tool to study model lipid membranes of biological significance.
Data availability statement
The original data used in this publication are made available in a curated data archive at ETH Zurich (https://www.research-collection.ethz.ch/handle/20.500.11850/610918) under the https://doi.org/10.3929/ethz-b-000610918.Conflicts of interest
The authors declare no conflict of interest.Acknowledgements
Financial support from the European Union is acknowledged through ERC grant no. 741431 (2D Nano-Spec). Dr Zhenfeng Cai and Dr Dusan Mrdenovic from ETH Zurich are thanked for fruitful scientific discussions.References
- M. Leslie, Science, 2011, 334, 1046–1047 CrossRef CAS PubMed.
- A. S. Shaw, Nat. Immunol., 2006, 7, 1139–1142 CrossRef CAS PubMed.
- D. Lingwood and K. Simons, Science, 2010, 327, 46–50 CrossRef CAS PubMed.
- S. Kai and I. Elina, Nature, 1997, 387, 569–572 CrossRef PubMed.
- A. Kusumi, T. K. Fujiwara, R. Chadda, M. Xie, T. A. Tsunoyama, Z. Kalay, R. S. Kasai and K. G. Suzuki, Annu. Rev. Cell Dev. Biol., 2012, 28, 215–250 CrossRef CAS PubMed.
- L. J. Johnston, Langmuir, 2007, 23, 5886–5895 CrossRef CAS PubMed.
- L. Opilik, T. Bauer, T. Schmid, J. Stadler and R. Zenobi, Phys. Chem. Chem. Phys., 2011, 13, 9978–9981 RSC.
- D. Ahmadi, K. C. Thompson, V. G. Sakai, R. Schweins, M. Moulin, M. Haertlein, G. A. Strohmeier, H. Pichler, V. T. Forsyth, D. J. Barlow, M. J. Lawrence and F. Foglia, Front. Phys., 2022, 10, 326 Search PubMed.
- J. K. Hannestad, F. Höök and P. Sjövall, Biointerphases, 2018, 13, 03B408 CrossRef PubMed.
- H. Brockman, Curr. Opin. Struct. Biol., 1999, 9, 438–443 CrossRef CAS PubMed.
- A. Ianoul, P. Burgos, Z. Lu, R. S. Taylor and L. J. Johnston, Langmuir, 2003, 19, 9246–9254 CrossRef CAS.
- C. Nicolini, Biosens. Bioelectron., 1995, 10, 105–127 CrossRef CAS PubMed.
- M. De Rosa, A. Morana, A. Riccio, A. Gambacorta, A. Trincone and O. Incani, Biosens. Bioelectron., 1994, 9, 669–675 CrossRef CAS.
- W. Zhou and P. J. Burke, ACS Appl. Mater. Interfaces, 2017, 9, 14618–14632 CrossRef CAS PubMed.
- R. Naumann, E. K. Schmidt, A. Jonczyk, K. Fendler, B. Kadenbach, T. Liebermann, A. Offenhäusser and W. Knoll, Biosens. Bioelectron., 1999, 14, 651–662 CrossRef CAS.
- C. Peetla, A. Stine and V. Labhasetwar, Mol. Pharm., 2009, 6, 1264–1276 CrossRef CAS PubMed.
- M. Ö. Öztürk-Öncel, B. Garipcan and F. Inci, in Biomimetic Lipid Membranes: Fundamentals, Applications, and Commercialization, Springer International Publishing, 2019, ch. 8, pp. 193–212 Search PubMed.
- S. J. Mattingly, M. G. O'Toole, K. T. James, G. J. Clark and M. H. Nantz, Langmuir, 2015, 31, 3326–3332 CrossRef CAS PubMed.
- K. S. Butler, P. N. Durfee, C. Theron, C. E. Ashley, E. C. Carnes and C. J. Brinker, Small, 2016, 12, 2173–2185 CrossRef CAS PubMed.
- B. Wicklein, M. A. M. del Burgo, M. Yuste, M. Darder, C. E. Llavata, P. Aranda, J. Ortin, G. del Real and E. Ruiz-Hitzky, Eur. J. Inorg. Chem., 2012, 2012, 5186–5191 CrossRef CAS.
- M. Kang, M. Tuteja, A. Centrone, D. Topgaard and C. Leal, Adv. Funct. Mater., 2018, 28, 1704356 CrossRef PubMed.
- V. M. Kaganer, H. Mohwald and P. Dutta, Rev. Mod. Phys., 1999, 71, 779–819 CrossRef CAS.
- M. Lucio, F. Bringezu, S. Reis, J. L. Lima and G. Brezesinski, Langmuir, 2008, 24, 4132–4139 CrossRef CAS PubMed.
- S. Ransac, M. Ivanova, I. Panaiotov and R. Verger, Methods Mol. Biol., 1999, 109, 279–302 CAS.
- R. K. Harishchandra, M. Saleem and H. J. Galla, J. R. Soc., Interface, 2010, 7(Suppl 1), S15–S26 CAS.
- A. Puri, K. Loomis, B. Smith, J. H. Lee, A. Yavlovich, E. Heldman and R. Blumenthal, Crit. Rev. Ther. Drug Carrier Syst., 2009, 26, 523–580 CrossRef CAS PubMed.
- V. P. Torchilin, Nat. Rev. Drug Discovery, 2005, 4, 145–160 CrossRef CAS PubMed.
- G. P. Nikoleli, C. G. Siontorou, M. T. Nikolelis, S. Bratakou and D. K. Bendos, Appl. Sci., 2019, 9, 1745 CrossRef CAS.
- E. Sackmann, Science, 1996, 271, 43–48 CrossRef CAS PubMed.
- P. Lenz, C. M. Ajo-Franklin and S. G. Boxer, Langmuir, 2004, 20, 11092–11099 CrossRef CAS PubMed.
- L. C. Kam, J. Struct. Biol., 2009, 168, 3–10 CrossRef CAS PubMed.
- Y. K. Lee, H. Lee and J.-M. Nam, NPG Asia Mater., 2013, 5, 48 CrossRef.
- M. Pedrosa, J. Maldonado-Valderrama and M. J. Galvez-Ruiz, Colloids Surf., B, 2022, 217, 112636 CrossRef CAS PubMed.
- A. Cruz, L. Vazquez, M. Velez and J. Perez-Gil, Langmuir, 2005, 21, 5349–5355 CrossRef CAS PubMed.
- C. Eggeling, K. I. Willig, S. J. Sahl and S. W. Hell, Q. Rev. Biophys., 2015, 48, 178–243 CrossRef CAS PubMed.
- A. Dazzi and C. B. Prater, Chem. Rev., 2017, 117, 5146–5173 CrossRef CAS PubMed.
- P. Hoppe, S. Cohen and A. Meibom, Geostand. Geoanal. Res., 2013, 37, 111–154 CrossRef CAS.
- R. M. Stöckle, Y. D. Suh, V. Deckert and R. Zenobi, Chem. Phys. Lett., 2000, 318, 131–136 CrossRef.
- P. Verma, Chem. Rev., 2017, 117, 6447–6466 CrossRef CAS PubMed.
- T.-A. Yano, P. Verma, Y. Saito, T. Ichimura and S. Kawata, Nat. Photonics, 2009, 3, 473–477 CrossRef CAS.
- N. Kumar, S. Mignuzzi, W. T. Su and D. Roy, EPJ Tech. Instrum., 2015, 2, 1–23 CrossRef PubMed.
- Y. Pandey, N. Kumar, G. Goubert and R. Zenobi, Angew. Chem., Int. Ed., 2021, 60, 19041–19046 CrossRef CAS PubMed.
- D. Mrdenovic, W. Ge, N. Kumar and R. Zenobi, Angew. Chem., Int. Ed., 2022, 61, e202210288 CrossRef PubMed.
- D. Mrdenovic, Z. X. Tang, Y. Pandey, W. Su, Y. Zhang, N. Kumar and R. Zenobi, Nano Lett., 2023, 23, 3939–3946 CrossRef PubMed.
- P. E. Milhiet, C. Domec, M. C. Giocondi, N. Van Mau, F. Heitz and C. Le Grimellec, Biophys. J., 2001, 81, 547–555 CrossRef CAS PubMed.
- O. Coban, J. Popov, M. Burger, D. Vobornik and L. J. Johnston, Biophys. J., 2007, 92, 2842–2853 CrossRef CAS PubMed.
- V. A. Frolov, Y. A. Chizmadzhev, F. S. Cohen and J. Zimmerberg, Biophys. J., 2006, 91, 189–205 CrossRef CAS PubMed.
- S. H. Donaldson Jr. and H. B. de Aguiar, J. Phys. Chem. Lett., 2018, 9, 1528–1533 CrossRef PubMed.
- G. Bryant, M. B. Taylor, T. A. Darwish, A. M. Krause-Heuer, B. Kent and C. J. Garvey, Colloids Surf., B, 2019, 177, 196–203 CrossRef CAS PubMed.
- J. Perez-Gil, Biochim. Biophys. Acta, 2008, 1778, 1676–1695 CrossRef CAS PubMed.
- J. R. Silvius, Biochim. Biophys. Acta, 2003, 1610, 174–183 CrossRef CAS PubMed.
- J. Kurniawan, N. N. Yin, G. Y. Liu and T. L. Kuhl, Langmuir, 2014, 30, 4997–5004 CrossRef CAS PubMed.
- M. Jurak, Chem. Phys. Lipids, 2012, 165, 302–310 CrossRef CAS PubMed.
- C. L. Claypool, F. Faglioni, W. A. Goddard, H. B. Gray, N. S. Lewis and R. A. Marcus, J. Phys. Chem. B, 1997, 101, 5978–5995 CrossRef CAS.
- F. R. Fan, J. Yang, L. Cai, D. W. Price Jr., S. M. Dirk, D. V. Kosynkin, Y. Yao, A. M. Rawlett, J. M. Tour and A. J. Bard, J. Am. Chem. Soc., 2002, 124, 5550–5560 CrossRef CAS PubMed.
- N. Patel, M. C. Davies, M. Lomas, C. J. Roberts, S. J. B. Tendler and P. M. Williams, J. Phys. Chem. B, 1997, 101, 5138–5142 CrossRef CAS.
- J. Freund, J. Halbritter and J. Hörber, Microsc. Res. Tech., 1999, 44, 327–338 CrossRef CAS PubMed.
- M. A. Ratner, B. Davis, M. Kemp, V. Mujica, A. Roitberg and S. Yaliraki, Molecular Electronics: Science and Technology, 1998, 852, 22–37 CAS.
- H. Mcconnell, J. Chem. Phys., 1961, 35, 508–515 CrossRef CAS.
- J. W. Park and D. J. Ahn, Colloids Surf., B, 2008, 62, 157–161 CrossRef CAS PubMed.
- L. Qiao, A. Ge, M. Osawa and S. Ye, Phys. Chem. Chem. Phys., 2013, 15, 17775–17785 RSC.
- M. Mori, S. Abe, T. Kondo and Y. Saito, Biomedical Vibrational Spectroscopy 2018: Advances in Research and Industry (SPIE), 2018, 10490, 85–93 Search PubMed.
Footnote |
| † Electronic supplementary information (ESI) available. See DOI: https://doi.org/10.1039/d4nr00816b |
| This journal is © The Royal Society of Chemistry 2024 |