
 Open Access Article
 This Open Access Article is licensed under a
 Creative Commons Attribution 3.0 Unported Licence
Understanding associative polymer self-assembly with shrinking gate fluorescence correlation spectroscopy†
Timothy J.
Murdoch
 a,
Baptiste
Quienne
b,
Julien
Pinaud
b,
Sylvain
Caillol
b and
Ignacio
Martín-Fabiani
*a
a,
Baptiste
Quienne
b,
Julien
Pinaud
b,
Sylvain
Caillol
b and
Ignacio
Martín-Fabiani
*a
aDepartment of Materials, Loughborough University, LE11 1RJ Loughborough, UK. E-mail: i.martin-fabiani@lboro.ac.uk
bICGM, Univ Montpellier, CNRS, ENSCM, Montpellier, France
First published on 4th June 2024
Abstract
The self-assembly of polymers is integral to their role in liquid formulations. In this study, we combine a dye whose lifetime is sensitive to the nanoviscosity of its local environment with shrinking gate fluorescence correlation spectroscopy (sgFCS) to study the self-assembly of a model telechelic polymer, hydrophobically modified ethoxylated urethane (HEUR). Fluorescence lifetime measurements show a monotonic increase in average lifetime with increasing HEUR concentration driven by a small fraction of dye (<1%) with long lifetimes strongly bound to HEUR. Despite this small fraction, sgFCS isolates the diffusional dynamics of the bound fraction with no a priori assumptions as to the distribution of lifetimes. Sensitivity is greatly enhanced compared to standard FCS, revealing micellar aggregates forming between 0.2 and 1 wt% followed by formation of a percolated network. This sgFCS approach, which we apply for the first time to polymers in this work, is readily extendable to any dye that changes lifetime on binding.
1. Introduction
Associative polymers are key components in a wide range of liquid formulations, as they impart non-Newtonian rheological behaviour to products such as paints1,2 and lubricants.3,4Their useful properties arise from the formation of concentration-dependent self-assembled structures,5 which have been studied by a range of techniques including dynamic6–8 and static6,7 light scattering, nuclear magnetic resonance,9 fluorescence spectroscopy,6,10,11 and rheology.5,6 Obtaining a full picture of the self-assembly process requires combining observations from multiple techniques.One of the newer approaches applied to this problem is the utilisation of dyes whose fluorescence lifetime (τ) depends on the viscosity of their nanoscale environment.12,13 These dyes, known as molecular rotors, have been used to monitor the self-assembly of tri-block associative polymers and determine the corresponding nanoscale viscosity within their aggregated structures.10,14 Another increasingly adopted approach in materials science is fluorescence correlation spectroscopy (FCS), which typically measures the dynamics of fluorophores within a confocal volume on the order of 1 femtolitre.15–18 While this often requires careful choice of dye to ensure strong binding to the polymer,19 the 3–4 orders of magnitude reduction in probe concentration compared to dynamic light scattering allows simultaneous detection of free dye, micelles and larger aggregates.15
FCS can be enhanced by time correlated single photon counting (TCSPC), as it provides a record of both the nanosecond-scale photon arrival time relative to the laser pulse (microtime) and the second-scale arrival time relative to the start of the experiment (macrotime). This allows species to be filtered by their fluorescence lifetime, even when they emit in the same spectral region.20 However, accurate extraction of lifetimes is not always possible due to the exponential nature of the fluorescence decays. This has been addressed recently through the introduction of shrinking gate fluorescence correlation spectroscopy (sgFCS), which was developed to distinguish lifetime changes from photophysical processes while making no prior assumptions about the distribution of lifetimes.21
In this article, we demonstrate for the first time the application of sgFCS to polymers. We combine a water soluble molecular rotor and sgFCS to study the self-assembly of a model telechelic polymer, hydrophobically modified ethoxylated urethane (HEUR).21 Notably, our approach only requires very small sample volumes (∼50 μL) and is able to isolate the signal from a small fraction of bound dye with minimal assumptions about dye–polymer interactions.
2. Experimental
2.1. Materials
All aqueous solutions were made with ultra-pure water (18.2 MΩ cm−1, Suez Select Fusion). Glycerol (≥99.0%) was purchased from Merck (Gillingham, UK). Poly(ethylene glycol) 10![[thin space (1/6-em)]](https://www.rsc.org/images/entities/char_2009.gif) 000 g mol−1 was purchased from Alfa Aesar (Kandel, Germany) and Fisher Scientific (Loughborough, UK) for HEUR synthesis and fluorescence measurements, respectively. Dibutyltin dilaurate (DBTDL), dodecyl isocyanate, toluene, and diethyl ether were purchased from Sigma-Aldrich Merck (Darmstadt, Germany). The NMR solvent CDCl3 was purchased from Eurisotop (Saint-Aubin, France). Sulfo-Cyanine3 (sCy3, Scheme 1) dye was purchased from Cambridge Bioscience (Cambridge, UK). Rhodamine 6G was purchased from Merck Life Science (Gillingham, UK). All materials were used as received.
000 g mol−1 was purchased from Alfa Aesar (Kandel, Germany) and Fisher Scientific (Loughborough, UK) for HEUR synthesis and fluorescence measurements, respectively. Dibutyltin dilaurate (DBTDL), dodecyl isocyanate, toluene, and diethyl ether were purchased from Sigma-Aldrich Merck (Darmstadt, Germany). The NMR solvent CDCl3 was purchased from Eurisotop (Saint-Aubin, France). Sulfo-Cyanine3 (sCy3, Scheme 1) dye was purchased from Cambridge Bioscience (Cambridge, UK). Rhodamine 6G was purchased from Merck Life Science (Gillingham, UK). All materials were used as received.
 | ||
| Scheme 1 Structure of sCy3 dye. | ||
2.2. HEUR synthesis
HEUR10kC12 was synthesized as per earlier work,22 except that the molar mass of poly(ethylene glycol) was 10000 g mol−1 and dodecyl isocyanate was used to create HEUR10kC12. Here, 7.5 g (1 eq.) of poly(ethylene glycol) 10000 g mol−1 and 0.016 g of DBTDL (0.2 wt% of the total mass) were solubilized in 15 mL of dried toluene. After azeotropic distillation and removal of the residual water traces, 0.333 g of dodecyl isocyanate (1.05 eq.) were added to the mixture at 80 °C under stirring and argon atmosphere. After 2 h of reaction, 10 mL of toluene was added, and the heating was stopped. Once the solution was back to room temperature, the polymer was precipitated in 300 mL of diethyl ether to remove the remaining isocyanates, urea traces and catalyst. The polymer obtained, HEUR10kC12, was then washed with diethyl ether before drying under vacuum. A white powder was finally obtained with a yield of 89%.
Proton nuclear magnetic resonance (1H NMR) analyses were performed in deuterated chloroform (CDCl3, 99.50% isotopic purity) using Bruker Advance 400 MHz NMR spectrometer at a temperature of 25 °C. The resulting spectra is provided in Fig. S1.†
2.3. Fluorescence lifetime spectroscopy and fluorescence correlation spectroscopy
Lifetime spectroscopy and FCS measurements were performed on a MT200 confocal microscope (PicoQuant, Berlin, Germany) integrated with an IX73 inverted microscope (Olympus, Hamburg, Germany). A picosecond 531 nm laser diode (LDH-D-TA-530B, PicoQuant, Germany), driven at a repetition rate of 40 MHz by a PDL-828 pulsed laser diode driver (PicoQuant, Germany), was used for excitation. Excitation light was passed through a dichroic mirror (NFD01-532, Semrock, Rochester, USA) and then coupled into a single-mode fibre. This light was focused through a UPlanSApo 60×/NA 1.20 water immersion lens (Olympus) onto the relevant well of a μ-Slide 18 well glass-bottom coverslip (Ibidi, Munich, Germany) containing 50 μL of sample with approximately 12.5 nM of the chosen dye. Fluorescence emission was collected using the same objective and was separated from the excitation light using a dichroic mirror (ZT532/640 rpc-UF3, Chroma, Bellows Falls, USA). The separated light then passed through a tube lens, 50 μm pinhole and 532 nm LP filter (Semrock) onto a hybrid photomultiplier detector (PMA-hybrid-40, PicoQuant). Time tagged data from the laser and detector were collected using a time correlated single photon counting (TCSPC) unit (MultiHarp 150, PicoQuant). The time-tagged data records both the macro and micro arrival times, corresponding to the arrival times relative to the start of the experiment and the laser pulse, respectively. An acquisition time of 30 min was used to improve the signal to noise ratio at low polymer and dye concentration, and longer micro-times. Note, 10 minutes of acquisition is sufficient in most cases. The instrument response function (IRF) was collected from backscattered light from the bottom of a clean coverslip. 1.25 μM sCy3 solutions in DI H2O were prepared by successive dilution of a 1.6 mM stock solution. 12.5 nM dye solutions were then prepared by combining 1 μL of 1.25 μM sCy3 with 99 μL of the polymer solution, mixed thoroughly, and allowed to equilibrate for at least 1 hour prior to measurement. Polymer concentrations higher than 0.63 wt% were equilibrated for at least 4 hours. Measurements were performed at 22 °C. | (1) |
 | (2) |
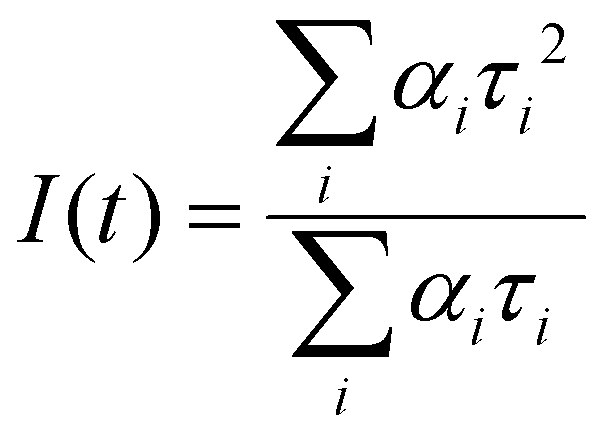
Intensity average lifetime was chosen for representation as it is intrinsic to the fluorescence decay and independent of model choice.27
An example workflow is provided in the ESI† or can be found at https://github.com/t-j-murdoch/sgFCS_PTU (https://doi.org/10.5281/zenodo.10533738) under a Creative Commons Attribution 4.0 International license.
 | (3) |
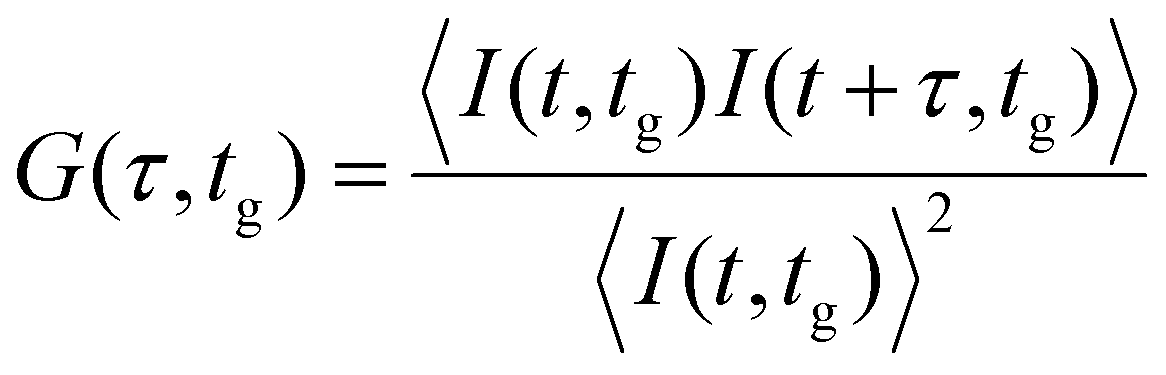
Our analysis takes advantage of an advanced time-tag-to-correlation algorithm to calculate G(τ).28 We utilize a modified version of the implementation of this algorithm found in the FoCuS-point Python package.29 The algorithm takes a list of macro arrival times and their corresponding weights as an input. Time-gating is performed by choosing a window of micro-times and excluding photons arriving outside this window from analysis. While any arbitrary window can be chosen, by convention we choose a window that starts at a gate time (tg) and extends up to the 5th to last photon bin. The last 5 bins are excluded to avoid histogram artefacts.
At high values of tg there is a significant contribution from uncorrelated background signal that needs to be corrected. While one could use an FLCS based approach to correct for this,30 we found that this introduced significant amounts of noise. Instead, we apply the following correction to the amplitude of the autocorrelation function:21
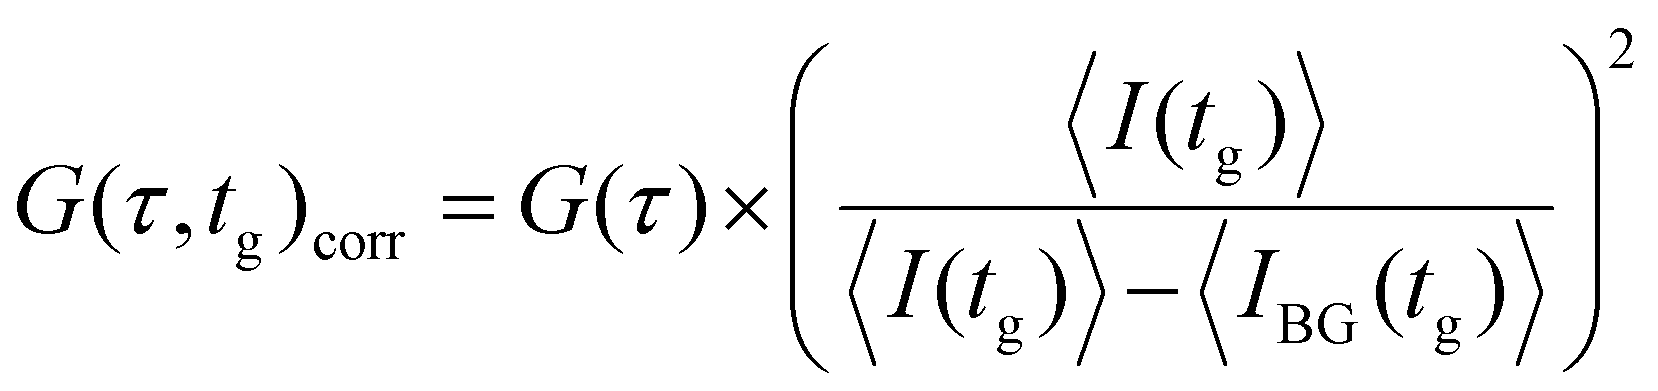 | (4) |
To estimate uncertainties we split the raw data into 10 even parts by macrotime and calculate the average and standard deviation of each calculated G(τ,tg).31 Note 5 parts were used for 5 wt% HEUR to ensure the slice length is 105 times longer than the characteristic diffusion time.32 We combine this approach with the algorithm of Ries et al. to exclude curves containing artifacts such as intensity spikes from the analysis.33
sgFCS is performed by calculating G(τ,tg)corr for a range of 10 linearly spaced values of tg. The workflow utilizes Python scripts to allow batch importing and processing of data. An example workflow is provided in the ESI† or can be found at https://github.com/t-j-murdoch/sgFCS_PTU (https://doi.org/10.5281/zenodo.10533738) under a Creative Commons Attribution 4.0 International license.
G(τ,tg)corr curves are analyzed using the equations described in the Results and discussion. Data fitting utilizes the LMFIT Python package.26 For each curve, an initial least-squares fit is performed to provide an initial guess for subsequent MCMC sampling.25
Rhodamine 6G solutions in DI H2O used for calibration of the diffusion coefficient were prepared by successive dilution of a ∼40 μM stock solution to a final concentration of ∼4 nM. A diffusion coefficient of 382 μM2 s−1 at 22 °C was determined by interpolation of values reported in the literature.15,34
3. Results and discussion
In this work HEUR consists of a hydrophilic 10000 g mol−1 poly(ethylene glycol) (PEG) backbone end-capped with hydrophobic C12 alkyl groups, i.e., HEUR10kC12 as a representative, well-studied associative polymer.6–8,11,35,36 Previous studies indicate the formation of flower-like micelles occurs over a wide concentration range (∼0.01–0.6 wt%). Further increasing the concentration leads to the formation of a dynamic network responsible for their non-Newtonian rheology at the critical percolation concentration (Cp). This concentration is commonly taken as the concentration at which the viscosity starts to increase sharply.37 Using linear rheology, we estimate Cp for our HEUR to be between 1 and 2 wt% (Fig. S2†). Here, the wide possible concentration range observed is a result of the slow change in viscosity around Cp as well surface tension effects when measuring viscosities close to water38 that make accurate measurements difficult.
To further investigate the self-assembly of our model HEUR, we use time-resolved fluorescence spectroscopy and introduce 12.5 nM of a commercially available water soluble sulfonated cyanine3 dye (sCy3), Fig. 1a. The resulting fluorescence decays are analysed with eqn (1) to extract the characteristic exponential decay lifetimes as well as their relative amplitude, Fig. 1b. These characteristic lifetimes are related to the rate of photoisomerization from an emissive trans isomer to a largely non-emissive cis isomer.39 Microenvironments with higher microviscosities and/or degrees of steric hinderance that restrict the isomerisation lead to correspondingly longer lifetimes. In the absence of HEUR a single exponential component with a lifetime of 0.18 ns is recovered and is consistent with literature values for unhindered isomerisation of sCy3.23,39–42
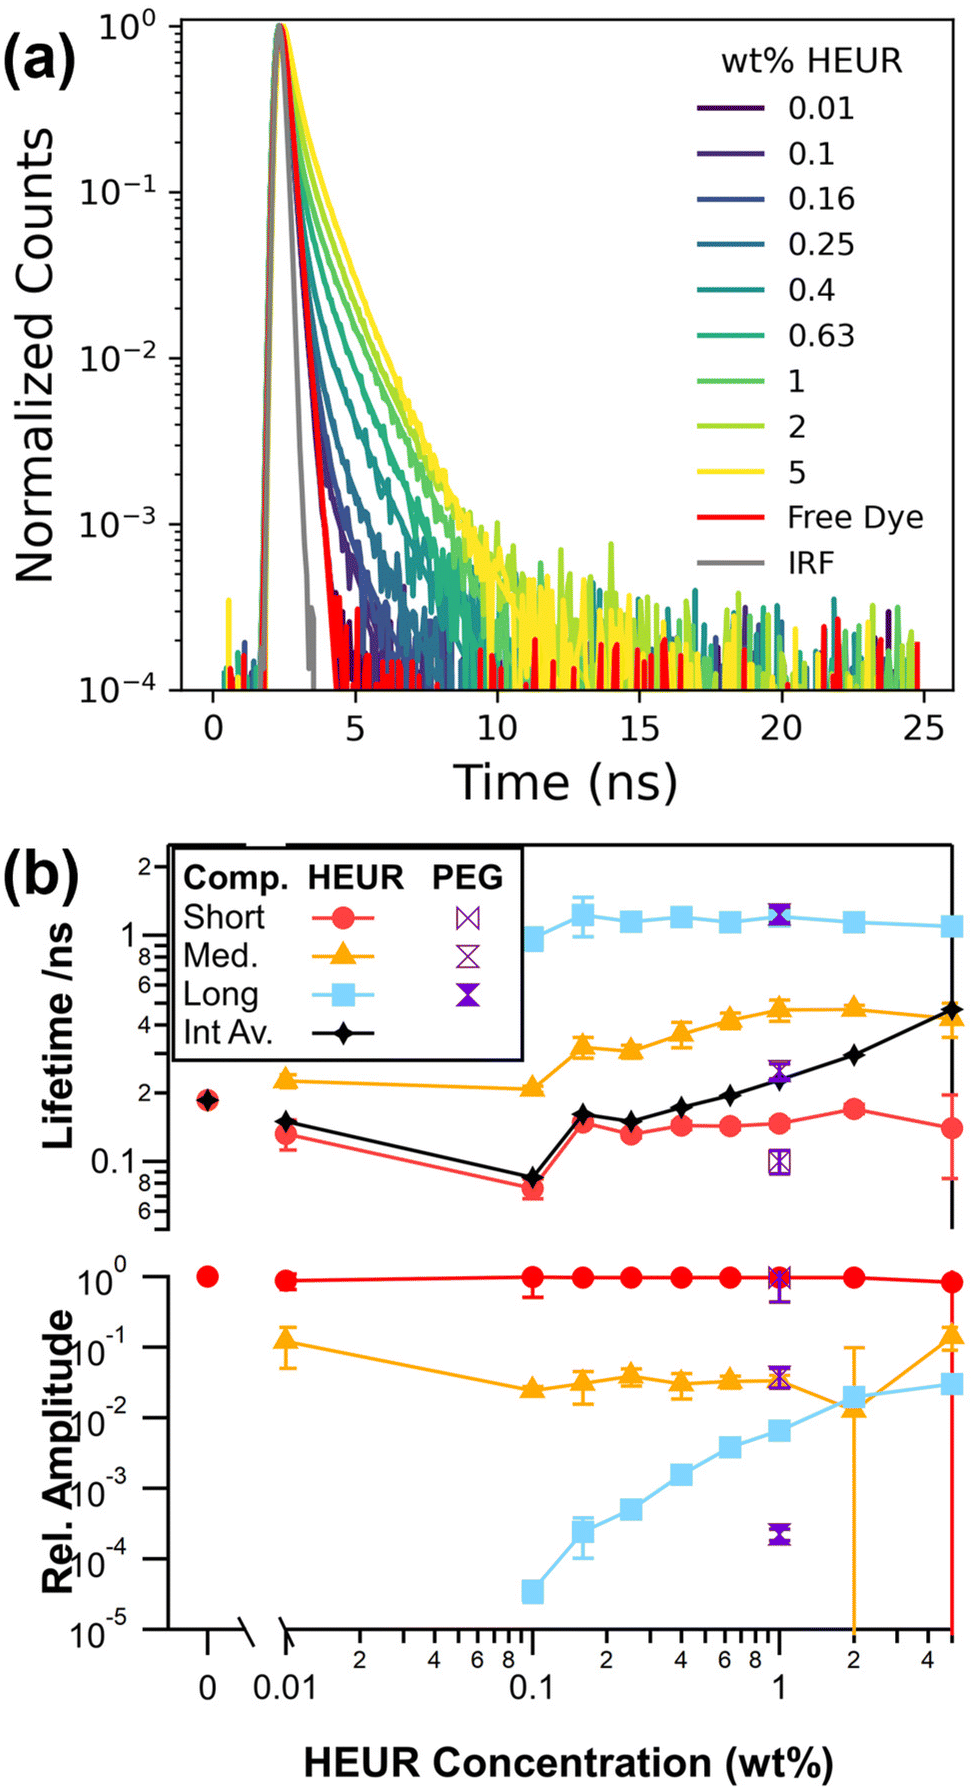 | ||
| Fig. 1 (a) Background corrected and normalized fluorescence decays as a function of HEUR concentration. (b) Lifetime components τi and corresponding relative amplitudes αi as a function of HEUR concentration. | ||
Solutions containing HEUR require 2 exponential components at 0.01 wt% HEUR and 3 exponential components at all other concentrations to maximise the agreement between our model and the experimental decays (Fig. S3†). Multiexponential decays are observed for Cy3 derivatives, and are associated with multiple local environments that restrict isomerisation to varying degrees.39,42 Regardless of the fitting approach, a short lifetime around 0.18 ns is required for all HEUR concentrations, which is consistent with a population of free dye in an unrestricted environment. This lack of change is expected as the nanometre-scale viscosity experienced by the rotor is significantly lower than the macroscopic viscosity.43–45
The two longer lifetimes range from 0.21 to 0.47 ns for the medium component and are consistently around 1.1 ns for the longest component. We can investigate what microenvironments these longer lifetimes may correspond to by utilising sCy3 as a viscosity probe. This is typically done by calibrating lifetimes in solutions of known viscosity.42,46 Here, we use water:glycerol solutions (Fig. S4†) to yield an apparent viscosity of 16 cP for the longest lifetime of around 1.1 ns. This value is lower than the 31.3 cP reported for the core of a C12E25 surfactant micelle.47 Therefore, instead of a viscosity effect, it is more likely that the medium and long lifetime components represent varying dye–polymer binding or stacking orientations, as has been observed in experiments and simulations of Cy3 derivatives linked to DNA.39,48 The middle lifetime may also reflect changes in polarity in the vicinity of the polymer.41,49 Given that the long lifetime is the same in 1 wt% PEG10k below its overlap concentration, c* = 4.2 wt%, it is most likely that the binding occurs along the PEG10k backbone.11
The relative amplitude of this long lifetime increases by several orders of magnitude with increasing HEUR concentration and is consistent with a greater proportion of bound dye. Combined with an increase in the magnitude of the medium lifetime, this leads to an increase in the intensity average lifetime of the sample. While care was taken to sample the available parameter space, the fits have a high degree of freedom and are sensitive to initial parameters. In fact, the two longer lifetimes can be substituted with a single stretched exponential (Fig. S5†).50 It is thus likely that there is a distribution of microenvironments corresponding to dye–polymer interactions. Therefore, we turn to an sgFCS approach which does not make a priori assumptions as to the distribution of lifetimes.
In FCS, the dynamics of dye molecules passing through the femtolitre focal point are contained in the autocorrelation function, G(τ). The primary contributions to G(τ) from sCy3 result from translational diffusion GD(τ) and a fast component related to photoisomerization Gfast(τ).39,51 Assuming equal brightness, we can describe the diffusion of n species through the Gaussian-shaped confocal volume by:
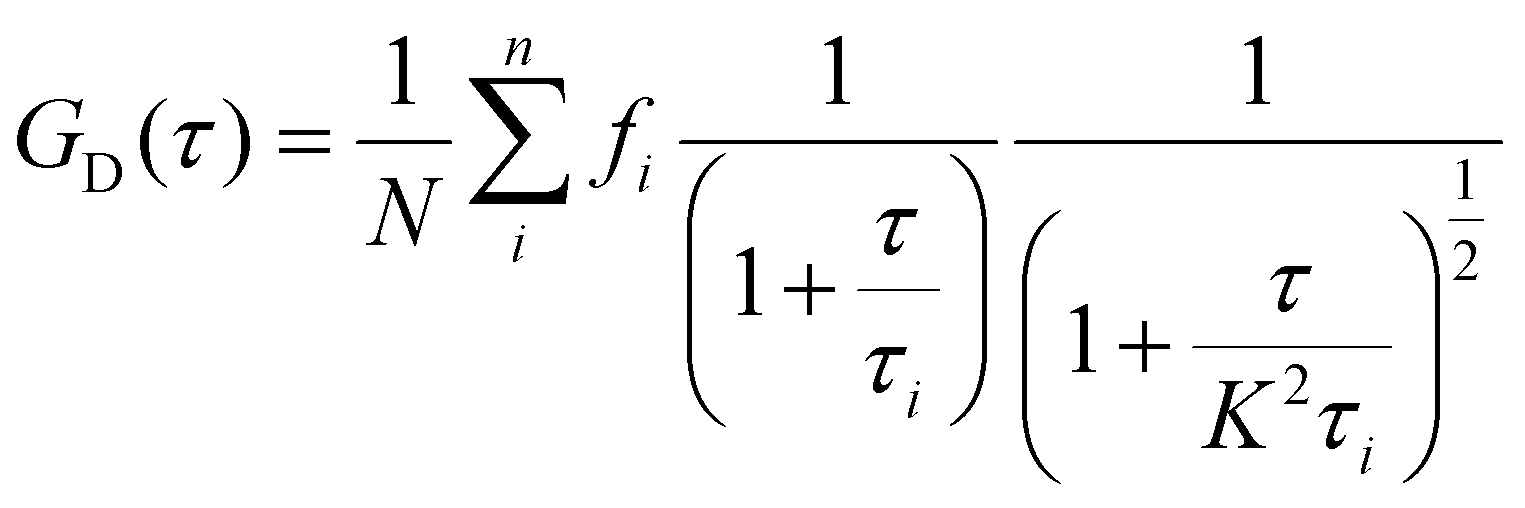 | (5) |
 | (6) |
As the two processes are well separated in time, the overall autocorrelation is then:
| G(τ) = Gfast(τ)GD(τ) | (7) |
 | ||
| Fig. 2 Autocorrelation curves as a function of HEUR concentration produced by (a) standard FCS and (b) sgFCS with tg = 2.7 ns and (c) tg = 5.3 ns. Note, τR6G is the characteristic diffusion time of Rhodamine 6G dye used to calibrate the system. Solid and dashed lines correspond to double and single diffusion fits, respectively. Inset: example fluorescence decays where the shaded region indicates the time gate used for analysis. | ||
Similar to the lifetime data, the FCS data in Fig. 2a largely overlaps up to HEUR concentrations of 0.16 wt%. Further increasing the concentration up to 1 wt% HEUR leads to a systematic shift to longer lag times, corresponding to lower apparent diffusion coefficients. In this concentration range fits are well described by a single diffusing species (i.e. n = 1 in eqn (5)). Further increasing the HEUR concentration leads to larger shifts in G(τ). While these larger shifts occur in the concentration range where the bulk viscosity begins to increase, it likely that they are affected by the increase of the relative contribution of the longer lifetime components to the fluorescence intensity above 10% (Fig. S6†). This higher contribution leads to fits assuming two diffusing species (i.e., n = 2 in eqn (5)) to produce statistically better fits than n = 1 (Fig. S9†). However, accurately separating the relative contribution of two species requires either accurate knowledge of the diffusion and photophysical properties of the individual species, or the relative mole fraction of the slower component to be greater than 0.6.53 Therefore, standard FCS is not sufficient to study the self-assembly of HEUR.
In order to improve sensitivity, the signal from the bound fraction of dye needs to be isolated. This may be achieved using sgFCS, which unlike fluorescence lifetime correlation spectroscopy, makes no prior assumptions as to the distribution and values of fluorescence lifetime for each species.21 In sgFCS, G(τ) is calculated for a shrinking subset of photons that start at a lag time tg relative to the laser pulse. This is enabled by TCSPC, as it provides a record of both the nanosecond-scale photon arrival time relative to the laser pulse (microtime) and the second-scale arrival time relative to the start of the experiment (macrotime). As tg is increased, G(τ) is increasingly weighted towards long lifetime components. Isolating the signal from dye in confined environments should improve our sensitivity to HEUR structure formation when compared to standard FCS analysis.
To demonstrate the improved sensitivity of sgFCS, we plot the resulting autocorrelation curves at an intermediate gate (tg = 2.7 ns) and a late gate (tg = 5.3 ns) in Fig. 2b and c, respectively. In contrast to standard FCS (Fig. 2a), G(τ) only overlaps up to 0.16 wt% HEUR, followed by a significant shift to later lag times at 0.25 wt%. Increasing the HEUR concentration leads to a systematic shift to longer lag times with consistently larger shifts compared to Fig. 2a. Note that at concentrations below 0.16 wt% there is a large increase in the uncertainty of the experimental data as the value of tg is increased. This results from the fact that at these concentrations, a significant proportion of the experimental time is spent waiting for a long lifetime molecule to enter the confocal volume as N ≪ 0.1. This leads to a corresponding decrease in the signal to noise ratio, which is known to be proportional to N for N ≪ 1.54
We further highlight the improved sensitivity using the three key scenarios outlined in Fig. 3. The first scenario at 1 wt% HEUR10kC12 corresponds to a concentration around the estimated Cp from rheology where we expect significant network formation (Fig. 3a). In Fig. 3aii we observe a monotonic increase in the amplitude of G(τ) with increasing tg. This increase results from the reducing contribution from sCy3 molecules in short lifetime environments as G(0) is proportional to 1/N. Notably, the fact that the amplitude does not approach a constant value is consistent with a continuum of dye environments. At intermediate gates (0.7 < tg < 3.3 ns) we observe a greater contribution of a fast process, i.e., G(τ)fast. In addition to photoisomerization dynamics in a single environment, there is likely an additional exponential process associated with binding dynamics as free and bound dye have different lifetimes.55 In principle this could be used to investigate dye–polymer binding kinetics. However, further discussion of G(τ)fast is beyond the scope of the current work. Normalizing G(τ) highlights the monotonic shift to longer lag times with increasing tg (Fig. 3aiii). In contrast to the amplitude, G(τ)norm converges for tg ≥ 2 ns. This suggests that the longer lifetime components have similar translational dynamics.
 | ||
| Fig. 3 Demonstration of shrinking gate FCS through 3 key systems: (a) 1 wt% HEUR (c > Cp), (b) 0.1 wt% HEUR (c < Cp), and (c) 1 wt% PEG10k. For each system (i) shows the fluorescence decay and corresponding start point of each gate, (ii) shows autocorrelation functions and estimate of the number of molecules N (Gdiff(0) ∼ 1/N) sampled as a function of tg, and (iii) presents the normalized autocorrelation functions. | ||
The second scenario, shown in Fig. 3b, is 0.1 wt% HEUR and corresponds to a concentration below the estimated Cp. Again, the amplitude increases monotonically albeit with a larger jump between small values of tg as on average there are fewer than 0.0001 molecules in long lifetime environments in the confocal volume. This can lead to larger uncertainties at higher values of tg but are minimized by using long acquisition times. Most importantly, G(τ)norm overlaps for all values of tg. Therefore, the shift observed at 1 wt% is not solely due to the presence of HEUR chains and is likely related to network formation.
The third scenario uses 1 wt% PEG as it matches the backbone chemistry of HEUR (Fig. 3c). However, PEG does not form networks at this concentration. The amplitude response shown in Fig. 3cii is intermediate between the two HEUR concentrations, with a large jump between early gates as per 0.1 wt% HEUR followed by a final amplitude similar to 1 wt% HEUR. Importantly, G(τ)norm shown in Fig. 3ciii overlaps for all gates, which suggests that the shifts in 1 wt% HEUR (Fig. 3aiii) are not solely associated with longer fluorescence lifetimes (Fig. 1b). Therefore, sCy3 combined with sgFCS can isolate signal from the bound dye, which allows the slower dynamic processes associated with the HEUR self-assembly to be isolated.
Having investigated the three key scenarios, we can quantify the results by fitting the autocorrelation curves with eqn (7). The extracted characteristic diffusion times are converted to diffusion coefficients via calibration with rhodamine 6G.15 To probe the overall trends we present the results of single diffusion fits in Fig. 4a as a function of tg and HEUR concentration. At early (tg = 0 ns) and late (tg ∼ 6 ns) relative lag times the single diffusion fit is found to be sufficient, but otherwise gives an indication of the average dynamics in the system. As expected, for 1 wt% PEG, and for HEUR concentrations up to 0.16 wt% the diffusion coefficient is largely invariant with increasing tg. The primary exception being 0.01 wt% HEUR, where the apparent diffusion coefficient decreases rapidly, with a corresponding increase its uncertainty, at higher values of tg. The rapid change is an artifact of the increasing uncertainty in the value of G(τ) as it becomes uncorrelated and can be considered a criterion for exclusion. In contrast, at all HEUR concentrations greater than 0.16 wt% there is a steep drop in the apparent diffusion coefficient for tg up to ∼2 ns, followed by a plateau. This lag time aligns with the value of tg where the short lifetime is almost completely decayed. Therefore, this observation supports the hypothesis that the translational dynamics of the medium and long lifetime species are similar.
 | ||
| Fig. 4 Summary of key fitting parameters as a function of time gate: (a) diffusion coefficient from single diffusion fits, (b) fraction of free dye from double diffusion fits, and (c) diffusion coefficient from double diffusion fits. | ||
Data in Fig. 2b and c are fit with the double (n = 2) diffusion model using eqn (7). While the single diffusion fits capture the overall trend, for HEUR concentrations above 0.1 wt% there is a systematic deviation of the residuals at values of tg between 0.7 and 3.3 ns (see Fig. S7a†). In this region, we expect both free and bound dye to be present. While deviations from single diffusive behaviour are often fit by an anomalous diffusion model, it has been demonstrated that a more appropriate model for systems containing polymer and free and bound dye is a double diffusion model (Fig. S7b†).52,56 We apply the latter by first determining τfree for the free dye using G(τ) derived data within 0.55 ns of the pulse chosen by a reverse-shrinking gate approach (see Fig. S8†). In contrast to sgFCS, this approach maximises the contribution of free dye and allows us to estimate and fix the value τfree as it changes with solution viscosity. sgFCS data are then analysed with eqn (7) (n = 2) allowing ffree and τbound to be determined.
The fraction of free dye is summarized in Fig. 4b. Again, we see a distinct change in behaviour between 0.16 and 0.25 wt% HEUR. Up to 0.16 wt% HEUR, ffree ∼1 for all gates, indicating a single fast diffusing species is sufficient (see also Fig. S9†). In contrast, at higher HEUR concentrations ffree ∼ 1 at tg = 0 ns, then decreases to a plateau around tg = 3 ns. ffree does not approach zero even at the highest values of tg. Assuming species in the plateau region have similar brightness, this suggests that a significant fraction of longer lifetime HEUR-bound dye is highly mobile as the signal from unbound dye is filtered out. However, in this plateau region the absence of free dye means that an anomalous diffusion model cannot be ruled out:57
 | (8) |
Here we observe anomalous diffusion exponents that are typically between 0.9 and 0.95 (Fig. S10†). However, this value drops to 0.85 for 2 wt% HEUR which is comparable to anomalous diffusion exponents reported for NMR self-diffusion experiments, attributed to the diffusion of heterogenous aggregates.35,36 We also observe a monotonic decrease in the anomalous diffusion coefficient with increasing concentration above 0.25 wt% HEUR for tg = 0 which reflects either an increasing contribution of bound dye or obstructed diffusion of the free dye.57 Regardless of model, the observations in the plateau region are consistent with experiments8,9 and simulations58 that show the intermediate hydrophobicity of C12 HEUR variants leads to a heterogeneous size distribution of self-assembled aggregates.
The presence of mobile species may also arise from dye binding and unbinding within the time it takes to traverse the confocal volume. However, if the average displacement of bound and free dye is smaller than the width of the confocal volume then G(τ) corresponds to the average diffusion of all species and the double diffusion mode would not be required.52 The diffusion coefficients of bound species as a function of tg are presented Fig. 4c. Compared to single diffusion values in Fig. 4a, the double diffusion coefficients plateau earlier at around tg ∼ 1 ns, which suggests that we are properly accounting for the free dye diffusion.
In Fig. 5a, we see that standard FCS (tg = 0) experiences a roughly monotonic decrease in D when increasing HEUR concentration above 0.16 wt%. The value of D extracted for the free dye is consistently higher than the equivalent standard FCS fits, which supports the use of the reverse-shrinking gate approach to determine τfree. In contrast, the increased sensitivity of sgFCS is highlighted by plotting the diffusion coefficient at the last gate (tg = 6 ns). At concentrations higher than 0.25 wt%, D decreases rapidly with increasing HEUR concentration due to the formation of self-assembled aggregates and networks. At concentrations below 0.25 wt% there are a relatively few dye molecules with long lifetimes, resulting in larger uncertainties in G(τ, 6 ns) and, consequently, the fitted value of D. Data from the double diffusion fits yield a consistently lower value of D for the slow component compared to the other approaches, with increased uncertainty at 0.25 wt% which has a higher fitted value for ffree.
 | ||
| Fig. 5 Summary of key concentration dependent results for standard FCS (circles, tg = 0) and sgFCS (tg = 6 ns) single (triangles) and double diffusion fits (squares). For double diffusion, the unfilled squares represent the fitted values for unbound dye. (a) Diffusion coefficients where the horizontal dashed line corresponds to the free dye, and (b) effective hydrodynamic radii for each condition. The lines labelled −0.5 and −0.75 in (a) represent possible power-law scaling exponents. | ||
To highlight the associative nature of HEUR, we compare it to the diffusion coefficients of its non-associative equivalent PEG10k in Fig. 5a. With both standard and sgFCS, the diffusion coefficient is roughly constant up to a concentration of 1 wt%, above which it begins to decrease. This decrease is likely due to the polymer the unentangled semi-dilute regime, where we expect the diffusion coefficient to scale with c−0.5.11 However, a significantly higher concentration would be needed to confirm this scaling. Note that, differences in diffusion coefficient using sgFCS were only apparent at PEG10k concentrations of 1 wt% and higher (Fig. S11†). In contrast, sgFCS for HEUR shows a scaling around c−0.75 at concentrations above 0.25 wt%, which is intermediate between unentangled and entangled semi-dilute (c−1.75). This large deviation from the behaviour of its non-associative equivalent at concentrations far below the expected overlap concentration is further evidence that we are detected self-assembly.
We now use the Stokes–Einstein equation to calculate the effective hydrodynamic radius of the self-assembled HEUR structures, RH,eff ∝ 1/D. This requires the assumption that the bulk viscosity is constant, which is the case at least up to 1 wt% HEUR (Fig. S2†) and 5 wt% PEG. The slow component of the double exponential fits yields a RH,eff around 4 nm below 1 wt% HEUR. At 1 wt% there is a marked increase in radius with increasing concentration, consistent with the onset of network formation. In contrast, the RH,eff from single exponential fits displays a smoother increase with increasing HEUR concentration as it includes contribution from dye bound to oligomers. For reference, dynamic light scattering measurements of similar HEUR that form weak aggregates show a range of effective radii between 3.9 and 20.7 nm.7 Remarkably, standard FCS of HEUR and PEG10k display almost no change in RH,eff.
4. Conclusions
In this work we have combined a dye sensitive to nanoscale viscosity with sgFCS to elucidate the self-assembly of a well-studied associative polymer. Fluorescence lifetime spectroscopy showed a systematic shift increase in the average lifetime with increasing HEUR concentration. However, the multi-exponential nature of the decay and high sensitivity to initial conditions when fitting prevented to reveal a full picture of HEUR self-assembly by the chosen molecular rotor. Similarly, conventional FCS showed systematic changes in the average diffusion coefficient of the dye-HEUR system. However, the sensitivity is relatively low due to the large contribution of free dye to the signal.In contrast, the application of sgFCS allowed the signal from the bound fraction of dye to be isolated. This greatly increased the sensitivity and revealed the appearance of small aggregates around 0.2–0.3 wt% HEUR. The apparent size of the aggregates increased steeply above 1 wt% HEUR, suggesting the formation of a percolated network. No significant change in size was observed for PEG10k that has the same backbone without associated end-groups.
While previous work has utilized molecular rotors to monitor the self-assembly of tri-block associative polymers,10,14 this approach does not yield RH,eff. FCS has also been used to monitor polymer self-assembly, but required insoluble dye to ensure a fully encapsulated probe.19 We have proven how sgFCS allows us to interrogate the nanoscale dynamics of both free and bound dye. Furthermore, this is done with minimal assumptions of the lifetime distribution of the dye and can be performed with low sample volumes. Our approach could be further improved by harnessing meso-phenyl substituted boron-dipyrrin (BODIPY) rotors which have monoexponential decays and well-characterized polarity and temperature responses.13 More importantly, this approach can be utilized with any dye that has a significant change in lifetime when bound.
Conflicts of interest
There are no conflicts to declare.Acknowledgements
The authors are grateful to Prof. Marina Kuimova (Imperial College London) and PicoQuant staff for helpful conversations on the world of molecular rotors and FCS. The sgFCS experiments have been performed on a microscope funded by a Strategic Equipment Grant (EP/T006412/1) from the Engineering and Physical Sciences Research Council. I. Martin-Fabiani is supported by a UK Research and Innovation Future Leaders Fellowship (MR/T02061X/1).References
- R. G. Larson, A. K. Van Dyk, T. Chatterjee and V. V. Ginzburg, Prog. Polym. Sci., 2022, 129, 101546 CrossRef CAS.
- T. J. Murdoch, B. Quienne, M. Argaiz, R. Tomovska, E. Espinosa, F. D'Agosto, M. Lansalot, J. Pinaud, S. Caillol and I. Martín-Fabiani, ACS Appl. Polym. Mater., 2023, 5, 6672–6684 CrossRef CAS PubMed.
- T. J. Murdoch, E. Pashkovski, R. Patterson, R. W. Carpick and D. Lee, ACS Appl. Polym. Mater., 2020, 2, 4062–4070 CrossRef CAS.
- A. Martini, U. S. Ramasamy and M. Len, Tribol. Lett., 2018, 66, 58 CrossRef.
- C. Chassenieux, T. Nicolai and L. Benyahia, Curr. Opin. Colloid Interface Sci., 2011, 16, 18–26 CrossRef CAS.
- C. Gourier, E. Beaudoin, M. Duval, D. Sarazin, S. Maître and J. François, J. Colloid Interface Sci., 2000, 230, 41–52 CrossRef CAS PubMed.
- C. Chassenieux, T. Nicolai and D. Durand, Macromolecules, 1997, 30, 4952–4958 CrossRef CAS.
- M. Kim, Y.-W. Choi, J.-H. Sim, J. Choo and D. Sohn, J. Phys. Chem. B, 2004, 108, 8269–8277 CrossRef CAS.
- J. Choi, D. Sohn, Y. Lee and C. Cheong, Macromol. Res., 2003, 11, 444–450 CrossRef CAS.
- Y. Shiraishi, T. Inoue and T. Hirai, Langmuir, 2010, 26, 17505–17512 CrossRef CAS PubMed.
- T. Cherdhirankorn, A. Best, K. Koynov, K. Peneva, K. Muellen and G. Fytas, J. Phys. Chem. B, 2009, 113, 3355 CrossRef CAS PubMed.
- M. K. Kuimova, Phys. Chem. Chem. Phys., 2012, 14, 12671–12686 RSC.
- M. Paez-Perez and M. K. Kuimova, Angew. Chem., 2024, e202311233 CAS.
- E. Lisitsyna, A. Efimov, C. Depresle, P. Cauchois, E. Vuorimaa-Laukkanen, T. Laaksonen and N. Durandin, Macromolecules, 2021, 54, 655–664 CrossRef CAS.
- D. Wöll, RSC Adv., 2014, 4, 2447–2465 RSC.
- C. M. Papadakis, P. Košovan, W. Richtering and D. Wöll, Colloid Polym. Sci., 2014, 292, 2399–2411 CrossRef CAS.
- K. Koynov and H. J. Butt, Curr. Opin. Colloid Interface Sci., 2012, 17, 377–387 CrossRef CAS.
- R. Raccis, A. Nikoubashman, M. Retsch, U. Jonas, K. Koynov, H.-J. Butt, C. N. Likos and G. Fytas, ACS Nano, 2011, 5, 4607–4616 CrossRef CAS PubMed.
- T. B. Bonné, C. M. Papadakis, K. Lüdtke and R. Jordan, Colloid Polym. Sci., 2007, 285, 491–497 CrossRef.
- A. Ghosh, N. Karedla, J. C. Thiele, I. Gregor and J. Enderlein, Methods, 2018, 140–141, 32–39 CrossRef CAS PubMed.
- T. Schröder, J. Bohlen, S. E. Ochmann, P. Schüler, S. Krause, D. C. Lamb and P. Tinnefeld, Proc. Natl. Acad. Sci. U. S. A., 2023, 120, e2211896120 CrossRef PubMed.
- B. Quienne, J. Pinaud and S. Caillol, Eur. Polym. J., 2022, 175, 111384 CrossRef CAS.
- F. D. Steffen, R. K. O. Sigel and R. Börner, Phys. Chem. Chem. Phys., 2016, 18, 29045–29055 RSC.
- Ž. Bajzer, T. M. Therneau, J. C. Sharp and F. G. Prendergast, Eur. Biophys. J., 1991, 20, 247–262 CrossRef.
- D. Foreman-Mackey, D. W. Hogg, D. Lang and J. Goodman, Publ. Astron. Soc. Pac., 2013, 125, 306–312 CrossRef.
- N. Matthew, et al., LMFIT: Non-Linear Least-Square Minimization and Curve-Fitting for Python, Zenodo, 2014, DOI:10.5281/zenodo.8145703.
- E. Fišerová and M. Kubala, J. Lumin., 2012, 132, 2059–2064 CrossRef.
- M. Wahl, I. Gregor, M. Patting and J. Enderlein, Opt. Express, 2003, 11, 3583 CrossRef PubMed.
- D. Waithe, M. P. Clausen, E. Sezgin and C. Eggeling, Bioinformatics, 2016, 32, 958–960 CrossRef CAS PubMed.
- S. Rüttinger, P. Kapusta, M. Patting, M. Wahl and R. Macdonald, J. Fluoresc., 2010, 20, 105–114 CrossRef PubMed.
- T. Wohland, S. Maiti and R. Macháň, An Introduction to Fluorescence Correlation Spectroscopy, IOP Publishing, 2020 Search PubMed.
- J. Ries, Z. Petrášek, A. J. García-Sáez and P. Schwille, New J. Phys., 2010, 12, 113009 CrossRef.
- J. Ries, M. Bayer, G. Csúcs, R. Dirkx, M. Solimena, H. Ewers and P. Schwille, Opt. Express, 2010, 18, 11073 CrossRef CAS PubMed.
- P. Kapusta and P. GmbH, Applicaton Note: Absolute Diffusion Coefficients: Compilation of Reference Data for FCS Calibration, https://www.picoquant.com/images/uploads/page/files/7353/appnote_diffusioncoefficients.pdf, (accessed January 1, 2022).
- K. Persson, G. Wang and G. Olofsson, J. Chem. Soc., Faraday Trans., 1994, 90, 3555 RSC.
- S. Abrahmsén-Alami, K. Persson, P. Stilbs and E. Alami, J. Phys. Chem., 1996, 100, 4598–4605 CrossRef.
- Z. Du, B. Ren, X. Chang, R. Dong, J. Peng and Z. Tong, Macromolecules, 2016, 49, 4978–4988 CrossRef CAS.
- M. T. Johnston and R. H. Ewoldt, J. Rheol., 2013, 57, 1515–1532 CrossRef CAS.
- E. M. S. Stennett, N. Ma, A. Van Der Vaart and M. Levitus, J. Phys. Chem. B, 2014, 118, 152–163 CrossRef CAS PubMed.
- M. E. Sanborn, B. K. Connolly, K. Gurunathan and M. Levitus, J. Phys. Chem. B, 2007, 111, 11064–11074 CrossRef CAS PubMed.
- J. Kang, S. M. Lhee, J. K. Lee, R. N. Zare and H. G. Nam, Sci. Rep., 2020, 10, 16859 CrossRef CAS PubMed.
- K. Ober, P. Volz-Rakebrand, J. Stellmacher, R. Brodwolf, K. Licha, R. Haag and U. Alexiev, Langmuir, 2019, 35, 11422–11434 CrossRef CAS PubMed.
- T. Kalwarczyk, K. Sozanski, A. Ochab-Marcinek, J. Szymanski, M. Tabaka, S. Hou and R. Holyst, Adv. Colloid Interface Sci., 2015, 223, 55–63 CrossRef CAS PubMed.
- R. Holyst, A. Bielejewska, J. Szymański, A. Wilk, A. Patkowski, J. Gapiński, A. Zywociński, T. Kalwarczyk, E. Kalwarczyk, M. Tabaka, N. Zibacz and S. A. Wieczorek, Phys. Chem. Chem. Phys., 2009, 11, 9025–9032 RSC.
- M. R. Bittermann, M. Grzelka, S. Woutersen, A. M. Brouwer and D. Bonn, J. Phys. Chem. Lett., 2021, 12, 3182–3186 CrossRef CAS PubMed.
- N. A. Hosny, C. Fitzgerald, C. Tong, M. Kalberer, M. K. Kuimova and F. D. Pope, Faraday Discuss., 2013, 165, 343–356 RSC.
- Y. Díaz-Fernández, S. Rodríguez-Calvo, A. Pérez-Gramatges, P. Pallavicini, S. Patroni and C. Mangano, J. Colloid Interface Sci., 2007, 313, 638–644 CrossRef PubMed.
- J. Spiriti, J. K. Binder, M. Levitus and A. Van Der Vaart, Biophys. J., 2011, 100, 1049–1057 CrossRef CAS PubMed.
- A. Boreham, J. Pikkemaat, P. Volz, R. Brodwolf, C. Kuehne, K. Licha, R. Haag, J. Dernedde and U. Alexiev, Molecules, 2015, 21, 22 CrossRef PubMed.
- K. C. Benny Lee, J. Siegel, S. E. D. Webb, S. Lévêque-Fort, M. J. Cole, R. Jones, K. Dowling, M. J. Lever and P. M. W. French, Biophys. J., 2001, 81, 1265–1274 CrossRef PubMed.
- J. Widengren and P. Schwille, Phys. Chem. A, 2000, 104, 6416–6428 CrossRef CAS.
- A. Vagias, R. Raccis, K. Koynov, U. Jonas, H. J. Butt, G. Fytas, P. Košovan, O. Lenz and C. Holm, Phys. Rev. Lett., 2013, 111, 088301 CrossRef PubMed.
- U. Meseth, T. Wohland, R. Rigler and H. Vogel, Biophys. J., 1999, 76, 1619–1631 CrossRef CAS PubMed.
- J. Wenger, D. Gérard, H. Rigneault, B. Lowder, S. Blair, E. Devaux and T. W. Ebbesen, Anal. Chem., 2009, 81, 834–839 CrossRef CAS PubMed.
- S. Mühle, M. Zhou, A. Ghosh and J. Enderlein, Phys. Rev. E, 2019, 100, 052405 CrossRef PubMed.
- P. Jia, Q. Yang, Y. Gong and J. Zhao, J. Chem. Phys., 2012, 136, 84904 CrossRef PubMed.
- M. D. N. Stolle and C. Fradin, Biophys. J., 2019, 116, 791–806 CrossRef CAS PubMed.
- S. Wang and R. G. Larson, Macromolecules, 2015, 48, 7709–7718 CrossRef CAS.
Footnote |
| † Electronic supplementary information (ESI) available. See DOI: https://doi.org/10.1039/d4nr00737a |
| This journal is © The Royal Society of Chemistry 2024 |