
 Open Access Article
 This Open Access Article is licensed under a Creative Commons Attribution-Non Commercial 3.0 Unported Licence
Salt-induced Fmoc-tripeptide supramolecular hydrogels: a combined experimental and computational study of the self-assembly†
Miryam
Criado-Gonzalez
 *ab,
Mario Iván
Peñas
ab,
Florent
Barbault
c,
Alejandro J.
Müller
bd,
Fouzia
Boulmedais
e and
Rebeca
Hernández
a
*ab,
Mario Iván
Peñas
ab,
Florent
Barbault
c,
Alejandro J.
Müller
bd,
Fouzia
Boulmedais
e and
Rebeca
Hernández
a
aInstituto de Ciencia y Tecnología de Polímeros (ICTP-CSIC), 28006 Madrid, Spain. E-mail: miryam.criado@ehu.es
bPOLYMAT and Department of Polymers and Advanced Materials: Physics, Chemistry and Technology, Faculty of Chemistry, University of the Basque Country UPV/EHU, 20018 Donostia-San Sebastián, Spain
cITODYS, Université de Paris, CNRS, F75006 Paris, France
dIkerbasque, Basque Foundation for Science, Plaza Euskadi 5, 48009 Bilbao, Spain
eUniversité de Strasbourg, CNRS, Institut Charles Sadron (UPR 22), 67034 Strasbourg, France
First published on 16th April 2024
Abstract
Delving into the mechanism behind the molecular interactions at the atomic level of short-sequence peptides plays a key role in the development of nanomaterials with specific structure–property–function relationships from a bottom-up perspective. Due to their poor water solubility, the self-assembly of Fmoc-bearing peptides is usually induced by dissolution in an organic solvent, followed by a dilution step in water, pH changes, and/or a heating–cooling process. Herein, we report a straightforward methodology for the gelation of Fmoc-FFpY (F: phenylalanine; Y: tyrosine; and p: PO42−), a negatively charged tripeptide, in NaCl solution. The electrostatic interactions between Fmoc-FFpY and Na+ ions give rise to different nanofibrillar hydrogels with rheological properties and nanofiber sizes modulated by the NaCl concentration in pure aqueous media. Initiated by the electrostatic interactions between the peptide phosphate groups and the Na+ ions, the peptide self-assembly is stabilized thanks to hydrogen bonds between the peptide backbones and the π–π stacking of aromatic Fmoc and phenyl units. The hydrogels showed self-healing and thermo-responsive properties for potential biomedical applications. Molecular dynamics simulations from systems devoid of prior training not only confirm the aggregation of peptides at a critical salt concentration and the different interactions involved, but also corroborate the secondary structure of the hydrogels at the microsecond timescale. It is worth highlighting the remarkable achievement of reproducing the morphological behavior of the hydrogels using atomistic simulations. To our knowledge, this study is the first to report such a correspondence.
Introduction
Sequence-defined peptides capable of self-assembly into supramolecular low-molecular-weight hydrogels (LMWH) with controlled nanostructures and stimuli-responsive properties have attracted considerable attention in several fields, including chemistry, physics, biology, materials science, and nanotechnology.1–5 Peptide sequences shorter than five amino acids are currently the focus of research due to their lower synthesis costs compared to longer polypeptides and relative ease of modulation compared to larger biomacromolecules.6,7 Formed by non-covalent interactions, i.e., hydrogen-bonding, hydrophobic, aromatic, and/or electrostatic interactions,8 supramolecular peptide self-assemblies are capable of retaining water within their structure while possessing shear-thinning and self-healing properties essential for minimally invasive injectability treatments and 3D printing.9 This type of supramolecular hydrogel with physical similarity to human tissues has excellent properties to be used in the biomedical field, i.e., bio-inks, drug delivery, catalysis, or tissue engineering, among others.10,11N-Fluorenyl-9-methoxycarbonyl (Fmoc), used as an amine-protecting group during the peptide synthesis, provides interesting self-assembly properties to the peptide chain by promoting hydrophobic and π–π stacking interactions of fluorenyl rings.6,12,13 Among the plethora of Fmoc-bearing peptides, those containing phenylalanine (F) amino acid in the peptide sequence have been extensively studied.14–16 Due to their poor solubility in water, the self-assembly of Fmoc-F-derived peptides is usually induced by dissolution in dimethyl sulfoxide (DMSO), followed by a dilution step in water, by pH changes, and/or by a heating–cooling process,17–20 which make the systems not fully biologically friendly, limiting their final applications. Gazit and coworkers studied the assembly of Fmoc-FF in conjunction with 4,4-bipyridine, resulting in a conformational change from a β-sheet to a helix structure to reduce amyloid-associated diseases.21 In addition, they studied the assembly of long polypeptide chains with more than 40 amino acids containing FF units in their structure, which were previously solubilized in DMSO in the presence of different monovalent, divalent, and trivalent metal ion salts, resulting in different self-assembled secondary structures, superhelices, β-sheets, and random coils, as a function of the coordination metal ion used.22
To mimic physiological self-assembly conditions, Xu and coworkers designed phosphorylated Fmoc-peptides through the incorporation of a tyrosine phosphate (pY) group, Fmoc-pY, which conferred solubility properties in a pure aqueous solution at room temperature and enabled its conversion into the LMWH (Fmoc-Y) in the presence of alkaline phosphatase (AP).23–25 The increase of aromatic side-chain moieties could confer higher self-assembly yields, thermal stability, and elasticity to Fmoc-peptide-based hydrogels;26 therefore the introduction of side-chain phenyl rings was later considered, leading to the tripeptide Fmoc-FFpY. The localized enzyme-assisted self-assembly (LEASA) of the Fmoc-FFpY tripeptide gave rise to supramolecular Fmoc-FFY hydrogels in a β-sheet fibrillar network with tunable mechanical and biological properties.27–31 Nevertheless, β-sheet-rich assemblies are associated with some amyloid degenerative diseases such as type 2 diabetes, Alzheimer's disease, and Parkinson's disease, which makes it necessary to regulate the structural arrangement to favor the formation of α-helix or random coil conformations.32,33 This was achieved by inducing Fmoc-FFpY self-assembly through electrostatic interactions with positively charged polymer nanoparticles, which led to the appearance of an α-helix structure with a reduction in β-sheet assemblies.34 The association with positively charged polymer chains led only to an increase in the random structure.35
Knowing that biological functions are based on molecular interactions, which in turn are a consequence of macromolecular structures, molecular dynamics (MD) simulations at biologically relevant simulation times are an effective route to understand LMWH self-assembly processes and structure–function relationships.36,37 Thus, delving into the mechanism behind the molecular interactions at the atomic level allows us to explore the dynamic reorganization and plasticity within the systems and plays a key role in the development of nanomaterials with specific structure–property–function relationships from a bottom-up perspective.38 While previous research works studied the peptide self-assembly of pre-organized configurations in the presence of salts using density functional theory (DFT) at the nanosecond scale,18,39–41 and a maximum peptide![[thin space (1/6-em)]](https://www.rsc.org/images/entities/char_2009.gif) :salt mixture molar ratio of 1:3,22,42,43 understanding what happens at the atomic scale and higher peptide:salt concentrations remains a challenge.
:salt mixture molar ratio of 1:3,22,42,43 understanding what happens at the atomic scale and higher peptide:salt concentrations remains a challenge.
We report herein a straightforward methodology for forming supramolecular Fmoc-FFpY self-assembly in pure aqueous media by ionotropic gelation with sodium chloride (Scheme 1), thus avoiding the use of organic solvents and polymer nanoparticles and resembling physiological mimicking assembly properties. Our experimental results show that the peptide self-assembly was initiated by the electrostatic interactions between the peptide phosphate groups and Na+ ions and stabilized thanks to hydrogen bonds between the peptide backbones and the π–π stacking of aromatic Fmoc and phenyl units. To obtain information at the atomic level, computational studies were performed from systems devoid of prior training to evaluate (i) the ability of the peptides to spontaneously aggregate, exploring the initial oligomerization and underlying mechanisms and (ii) the structural arrangement induced by the aggregation of Fmoc-FFpY peptides at the microsecond timescale, forming nanofibers and nanorods. Finally, the thermo-reversibility and rheological properties of the supramolecular peptide hydrogels were assessed as a function of the peptide and NaCl concentration. It opens a route for the prediction of peptide self-assembly at the atomic level, which is of paramount importance for the design and development of functional nanomaterials.
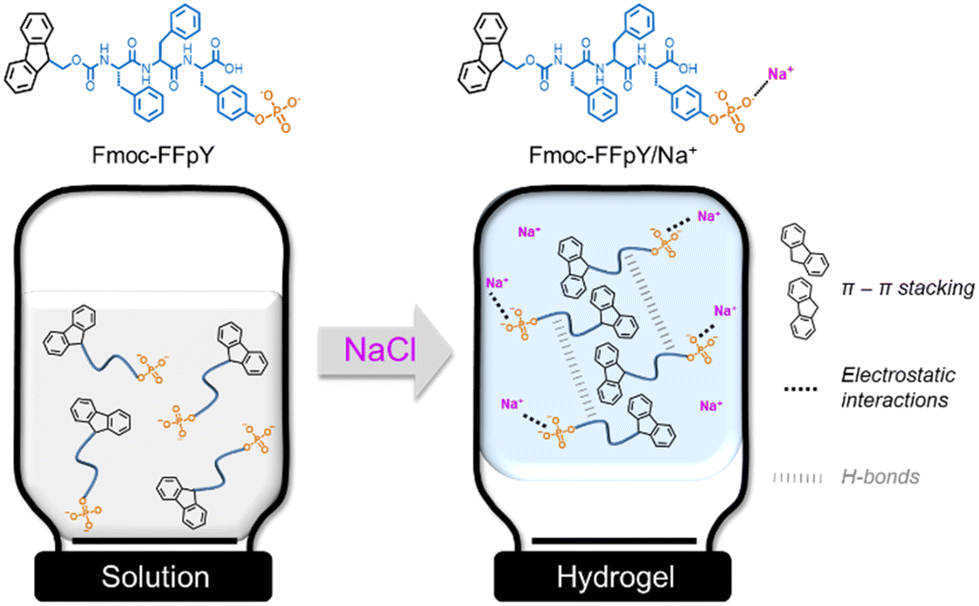 | ||
| Scheme 1 Schematic representation of Fmoc-FFpY self-assembly induced by electrostatic interaction with Na+ ions, leading to the formation of supramolecular hydrogels, Fmoc-FFpY/Na+. | ||
Materials and methods
Materials
Fmoc-FFpY ≥ 86.0% was provided by Pepmic (Suzhou, China) and characterized by high-performance liquid chromatography (HPLC) and mass spectrometry (MS) (Fig. S1, S2 and Table S1 in the ESI†). The impurity is an isomer that has the same chemical formula. Sodium tetraborate anhydrous (borax) was purchased from Sigma-Aldrich and sodium chloride was purchased from Fluka. All materials were used as received.Hydrogel formation induced by Na+ cations
Hydrogels were formed by mixing Fmoc-FFpY solutions (in 25 mM borax buffer at pH 9.5) with different concentrations of NaCl aqueous solutions at a ratio of 1:1 (v/v). A typical hydrogel formed at a concentration of 6.4 mM Fmoc-FFpY and 50 mM NaCl is named Fmoc-FFpY6.4/Na+50. The final hydrogel volume was 200 μL for inverted tube tests and 130 μL for rheological tests. The final pH of the hydrogels is 8.
Zeta potential
The zeta potential (ξ) was measured by Laser Doppler Electrophoresis (LDE) using a Malvern Nanosizer NanoZS instrument equipped with a 4 mW He–Ne laser (λ = 633 nm) at a scattering angle of 173° at 25 °C. Three measurements of 20 runs were performed for each sample.Morphological characterization
The morphology of the hydrogels was observed by Transmission Electron Microscopy (TEM) using a JEOL JEM-1230 electron microscope equipped with a digital camera CMOS TVIPS Tem-Cam 16 megapixel. Samples were observed under negative staining by incubating the Fmoc/Na+ hydrogels with a heavy metal salt solution, formed by using 1% uranyl acetate and 1% phosphotungstic acid, for 5 min, followed by 2 min of washing and brought in contact with a carbon-coated copper grid. Images were taken at 100000 V and a magnification of 10000.
Small-angle X-ray scattering (SAXS) and wide-angle X-ray scattering (WAXS)
SAXS and WAXS measurements were performed at BL 11 NCD-SWEET beamline at ALBA Synchrotron (Barcelona, Spain) using an X-ray wavelength of λ = 0.1 nm and an acquisition time of 20 s. For SAXS measurements, a PILATUS 1 M detector from Dectris was located at 6.70 m, and for WAXS measurements, a LX255-HS detector from Rayonix was located at 0.125 m from the sample position. SAXS and WAXS patterns show the scattering intensity vs. the scattering vector q and were analyzed using ATSAS software PRIMUS version 3.1 (SAS data analysis).44 The background corresponding to the capillaries containing the buffer solvent of the hydrogels was subtracted from the spectra.Spectroscopic characterization
Fluorescence spectra were recorded between 300 and 405 nm at an excitation wavelength of 290 nm using a PerkinElmer LS 55 fluorescence spectrometer at 25 °C. The sample was placed between two quartz slides, leading to a path length of about 0.1 mm. Infrared (IR) spectra were recorded between 850 and 1760 cm−1 in Attenuated Total Reflectance (ATR) mode using a PerkinElmer Spectrum Two FT-IR spectrometer at 25 °C. Samples were previously dried at room temperature to remove water. To decompose the amide I band, data processing was performed using OPUS 7.5 software (Bruker Optik GmbH). The spectra were smoothed using a twenty-five-point smoothing function, cut between 1550 and 1710 cm−1, and then normalized using a normalization “min–max” method. The baseline was then adjusted to calculate the second or the fourth derivative. The number and frequencies of different components, forming the amide I band, and the other peaks were determined using the second derivative of the Fourier smoothed spectrum using the minimum positions. The decomposed spectrum was fitted with Gaussian band profiles using local least squares, followed by Levenberg–Marquardt's method, starting with intensities of 0.1 and widths of 5. The quality of fitting was estimated by the residual RMS provided by the software. The relative contribution of each component of the amide I band was calculated from the ratio of the area of each peak over the area of the total amide I band. Circular dichroism (CD) spectra were recorded at 25 °C between 190 and 320 nm using a Jasco J-815 spectropolarimeter with a wavelength data pitch of 0.2 nm. Samples were placed between quartz slides, leading to a path length of about 0.1 mm.Computational details
The Fmoc residue was created using the Maestro software.45 The construction of the Fmoc-FFpY peptide was generated using a previously published method.46 System assemblies were performed using the Packmol software.47 Two series of systems were initiated. In the first series, which aimed to determine the influence of NaCl concentration on aggregation behavior, four systems were generated where nine peptide units were randomly placed within a cube with an edge length of 130 Å. It was ensured that each peptide was at a distance greater than 20 Å to avoid influencing the spontaneity of aggregation. These four systems were solvated using a TP3P water model,48 and three different NaCl concentrations of 50, 250, and 500 mM were generated. In the second series, aimed at studying peptide assembly, four systems consisting of 40 Fmoc-FFpY units were randomly placed within a simulation cube with an edge length of 70 Å. These dimensions have been chosen to place them under conditions similar to those of the work of Sasselli et al.,40 where the consideration of periodic conditions makes it possible to reproduce the structures in the image boxes and thus to take into account the possible formation of fibers.49 These four systems were solvated using the same water model and studied at two different concentrations: 250 and 500 mM.Molecular dynamics simulations (MD) were performed with the Amber software version 20.50,51 All simulations started with 40000 steps of energy minimization where the peptides remain constrained with harmonic restraints of 5 kcal mol−1 for the first 20000 steps and release for the 20000 other steps. Systems were then heated to 300 K for 100 ps in the NVT ensemble and then switched to NTP conditions. MD trajectories were engaged for 1 μs, for the first series of systems and 1.2 μs for the second series. Structural analyses were performed with the cpptraj module of AmberTools,52 while VMD software53 was employed to visualize MD trajectories and make figures. Secondary structures were assigned using backbone dihedral angle analysis. Two methods were used, one using MolProbity software54 and the other using the definitions given by Xiong and coworkers.55 As both methods give similar results, we have only included the results from MolProbity. Unless explicitly stated otherwise, the presented values are averaged across the 4 simulation replicas.
Rheological characterization
The rheological properties of the hydrogels were measured using an AR-G2 rheometer (TA Instruments) with an acrylic plate geometry of 40 mm diameter, a 58 μm gap, and a solvent trap. Samples were prepared directly on the plate by mixing 65 μL of Fmoc-FFpY and 65 μL of NaCl solution for 30 min at 20 °C until a plateau was reached. Strain measurements were carried out from 0.01% to 1 000% at 1 Hz and frequency sweeps from 100 to 0.01 Hz at 1% strain. Temperature sweeps were performed at 1% strain and 1 Hz. The self-recovery properties were evaluated through dynamic step strain amplitude tests by varying the strain between 1% and 1 000%.Micro-differential scanning calorimetry (micro DSC)
Micro-DSC experiments were carried out using a MicroCalvet VII microcalorimeter (Setaram) equipped with a double-stage temperature control with Peltier coolers. Hastelloy C276 vessels with an elastomer O-ring (NBR) were employed for the measurements. The sample cell was filled with the Fmoc-FFpY/Na+ hydrogel and the reference cell with a mixture (1:1%v/v) of borax buffer, and the corresponding salt concentration was tested in each case. The heating and cooling scans from 20 to 75 °C were recorded at heating and cooling rates of 0.1 °C min−1.
Results and discussion
Fmoc-FFpY/Na+ hydrogel formation and morphological characterization
Thanks to the tyrosine phosphate amino acid (pY), the Fmoc-FFpY tripeptide can be solubilized in water without organic solvents, such as DMSO. The Fmoc-FFpY solution (in 25 mM borax buffer at pH 9) does not form a gel even after several days. The hydrogelation of Fmoc-FFpY can be induced without dephosphorylation by the addition of NaCl. The inverted tube test, a commonly accepted method for screening whether a gel has been formed, was first performed at a fixed concentration of the peptide (6.4 mM) and different NaCl concentrations. The minimum NaCl concentration needed to form a hydrogel was 150 mM (molar ratio: Fmoc-FFpY:NaCl = 1:23) (Fig. 1a).
 | ||
| Fig. 1 (a) Inverted tube tests of supramolecular Fmoc-FFpY6.4/Na+ hydrogels formed after 24 h at a fixed Fmoc-FFpY concentration of 6.4 mM. (b) Phase diagram of Fmoc-FFpY/Na+ mixtures at molar concentration. (c) Zeta potential of Fmoc-FFpY6.4/Na+ hydrogels as a function of NaCl concentration. The dashed lines are a guide to the eye. (d) TEM micrographs of negatively stained Fmoc-FFpY6.4 hydrogels with different NaCl concentrations. The white arrows highlight the nanofiber's organization into a nanorod-like structure. | ||
A phase diagram was established as a function of peptide and salt concentrations (Fig. 1b). In all cases, the hydrogels obtained were transparent and colorless. As the peptide concentration decreases, a higher salt concentration is needed to form a gel. For 3.2 and 1.3 mM peptide concentrations, the required molar ratio of Fmoc-FFpY:NaCl increases up to 1:78 and 1:385, respectively (Fig. 1b and Fig. S3†). In the absence of NaCl, Fmoc-FFpY (in 25 mM borax buffer at pH 9) is negatively charged with a zeta potential of −36.0 ± 2.0 mV (Fig. 1c). At NaCl concentrations lower than 250 mM, the addition of NaCl does not significantly impact the peptide's zeta potential. For higher NaCl concentrations, above 250 mM, the zeta potential of the hydrogels decreases up to −18.6 ± 1.0 mV and −9.6 ± 1.0 mV for NaCl concentrations of 375 and 500 mM, respectively. This is indicative of the electrostatic interactions involved in the hydrogel formation between the negatively charged groups of the Fmoc-FFpY peptide and the positively charged Na+ ions.56
The microstructures of Fmoc-FFpY6.4/Na+ hydrogels prepared at different NaCl concentrations were investigated by TEM. Fmoc-FFpY in solution formed some nanodroplets (Fig. S4†), whereas in the presence of very low NaCl concentrations (50 mM), isolated nanofibers were observed (Fig. 1d). Increasing the NaCl concentration up to 150 mM led to a high density of intermingled thin nanofibers with an average diameter of ∼5 nm. As the NaCl concentration increases further, the nanofibers tended to be grouped and aligned, leading to the formation of bundles with average diameters of ∼29 and 46 nm for 375 and 500 mM NaCl, respectively, whereas the average diameter of every single nanofiber remains constant at ∼5 nm (Fig. S5†). Small-angle X-ray scattering (SAXS) curves supported the rod-like morphology of the nanofibrils as the scattering curves of the Fmoc-FFpY6.4/Na+ hydrogels formed in 150, 250, and 500 mM NaCl showed a q−1 relationship at low q, indicating elongated cylindrical structures at NaCl concentrations above 150 mM (Fig. S6a†).
To delve into the internal structure of the nanoobjects at the molecular scale, wide-angle X-ray scattering (WAXS) measurements were performed (Fig. S6b†). The WAXS spectra of Fmoc-FFpY6.4 in solution and Fmoc-FFpY6.4/Na+ hydrogels (Fig. S6b†) show three maxima at 1.86, 1.53, and 0.98 Å−1, corresponding to distances of 3.3, 4.1, and 6.4 Å, respectively, regardless of the NaCl concentration. They can be ascribed to the distance between hydrogen-bonded backbones in the β-sheets,57 as the peptide molecules tended to be aggregated between them, forming nanodroplets in solution (in borax buffer),58 which then evolved to nanofiber formation in the presence of Na+ ions by increasing the number of peptide molecules.
Secondary structure of Fmoc-FFpY/Na+ self-assembly
The stacking of the Fmoc moieties was verified after hydrogel formation by fluorescence spectroscopy (Fig. 2a and Fig. S7†). The fluorescence spectrum of 6.4 mM Fmoc-FFpY solution showed a peak at 315 nm, which is assigned to non-assembled fluorenyl moieties. The same peak appeared in the case of Fmoc-FFpY6.4/Na+50, where no entangled nanofiber network was observed by TEM (Fig. 1d). Increasing the NaCl concentration resulted in a red shift of the fluorescence band up to 332 nm for Fmoc-FFpY6.4/Na+500 due to fluorenyl excimer formation after the peptide assembly, as confirmed by the fibrillar entangled network visualized by TEM. These results are consistent with previous work on the self-assembly of Fmoc-FFpY through electrostatic interactions with positively charged polymers.35,59 To further investigate the assembly mechanism of Fmoc-FFpY/Na+, the secondary structure was first studied by ATR-FTIR spectroscopy (Fig. 2b). The ATR-FTIR spectrum of 6.4 mM Fmoc-FFpY in solution shows a peak at 1688 cm−1 corresponding to carbamates,60 the amide I band with two peaks at 1649 and 1640 cm−1 assigned to unstacked and β-sheet structures, and two peaks at 980 and 872 cm−1 assigned to phosphate groups.61 In the case of the Fmoc-FFpY6.4/Na+500 hydrogel, the intensity of the amide I band is located at 1644 cm−1 assigned to β-sheet structures. The presence of the phosphate peaks indicates that the peptide is not dephosphorylated. The appearance of a peak at 910 cm−1, characteristic of C–OH bending, could indicate electrostatic interactions between the carboxylic acids and the sodium cations.62 | ||
| Fig. 2 (a) Fluorescence spectra normalized to the peak at 315 nm, (b) ATR-FTIR spectra, and (c) CD spectra of Fmoc-FFpY in solution in the absence (dashed black curve) and in the presence of different NaCl concentrations: Fmoc-FFpY6.4/Na+50 (purple curve), Fmoc-FFpY6.4/Na+150 (green curve), Fmoc-FFpY6.4/Na+250 (red curve), Fmoc-FFpY6.4/Na+375 (blue curve), and Fmoc-FFpY6.4/Na+500 (pink curve). | ||
To gain further structural insight, the amide I band was decomposed to identify the contributions of the secondary structures adopted by the peptides in the hydrogels (Fig. S8†). The relative contributions of different secondary structures to the amide I band of the Fmoc-FFpY6.4/Na+500 hydrogel are shown in Fig. S9† and summarized in Table S2.† The Fmoc-FFpY6.4/Na+500 hydrogel contains 41% β-sheets (with 20% of antiparallel β-sheets), 30% random structures, and 29% α-helices. The structural arrangement was further characterized by circular dichroism (Fig. 2c and Fig. S10†). The CD spectra of Fmoc-FFpY in pure water or a low concentration of NaCl (50 mM) show no signal, which is consistent with the non-gel state (Fig. 1). In the presence of 150 to 500 mM NaCl, Fmoc-FFpY showed a positive peak at 194 nm together with two negative bands at 204 and 215 nm, which is the signature of α-helix conformations. The helical conformation of the tripeptide/metal ion could be attributed to metal coordination and intermolecular non-covalent interactions. The positive peak at 227 nm is attributed to the stacking interactions of the aromatic units of Fmoc-FFpY, while the negative band at 252 nm is a feature of offset face-to-face stacking of the Fmoc moieties. These results are in agreement with other works on the self-assembly of Fmoc-FF peptides induced by electrostatic interactions and metal ions.22,34 We can notice that the FTIR decomposition gave similar contributions from the β-sheet, α-helix, and random coil, which could explain the difference in the result with CD. It is noteworthy that higher concentrations of NaCl are required to obtain the α-helix signature when using lower Fmoc-FFpY concentrations, 250 mM and 500 mM NaCl for 3.2 and 1.3 mM Fmoc-FFpY, respectively (Fig. S11†).
Molecular dynamics simulations of Fmoc-FFpY/Na+ assembly
Computational studies were performed to obtain information at the atomic level that allowed the study of complex biomolecular systems with high precision and accuracy. Two distinct studies were performed, each addressing the specific aspects of peptide aggregation. The first study focused on the peptides’ ability to spontaneously aggregate and explored the underlying mechanisms that drive this process. To study this behavior, nine Fmoc-FFpY peptides were randomly distributed within large water boxes, ensuring that the initial distance between any two peptides was at least 20 Å to avoid any potential association due to proximity. Molecular dynamics (MD) simulations were performed at three different salt concentrations (50, 250, and 500 mM) for 1 μs and replicated four times to ensure statistical significance.MD simulations show that the Fmoc-FFpY peptide tends to self-assemble and varies significantly with the NaCl concentration (Fig. 3a). At 500 mM NaCl, peptide aggregates are denser and consist of all nine peptide units. At 250 mM NaCl, aggregates are looser and replicates show aggregates consisting of 7, 8, or 9 units. At 50 mM NaCl, aggregates include only a few peptides, while others remain isolated in the solution. To quantify this phenomenon, the number of non-native contacts was determined along the MD trajectories and plotted for each concentration (Fig. 3b). The number of non-native contacts along the trajectory quantifies the number of distances between atoms of less than 7 Å (one contact) from different peptides. A high value indicates strong and dense aggregation, while a low value indicates a less dense aggregate or one with fewer Fmoc-FFpY units. At 500 mM NaCl, aggregates form within the first 200 nanoseconds and remain stable. This is thus a spontaneous and rapid assembly. At 250 mM NaCl, peptides also self-assemble, but the aggregates take a much longer time, about 700 nanoseconds, and provide less dense aggregates. At 50 mM NaCl, the peptide assembly is incomplete and remains stable, demonstrating the inability of Fmoc-FFpY to fully aggregate at this salt concentration. This phenomenon is remarkably consistent with experimental observations. Sufficiently high ionic strength screens the negative charges of each Fmoc-FFpY peptide, thereby reducing electrostatic repulsion and allowing for the formation of new interactions at shorter distances.
 | ||
| Fig. 3 MD simulations of Fmoc-FFpY in the presence of different NaCl concentrations: (a) the protocol used and (b) the number of non-native contacts (distance less than 7 Å), along the MD trajectory, between atoms from different peptides. An interpolation using Bézier curves allows us to observe the trend. | ||
An alternative simulation strategy was employed to study the structural arrangement induced by the aggregation of Fmoc-FFpY peptides. To achieve this, more compact systems with a higher number of peptides were constructed. Specifically, 40 peptides were randomly placed in a confined space to promote their association, as shown in Fig. 4a. MD simulations were then performed for a duration of 1.2 μs at two different concentrations of NaCl, namely 250 and 500 mM. As before, the simulations were repeated four times to ensure the reproducibility of the results.
 | ||
| Fig. 4 (a) MD simulations, where 40 Fmoc-FFpY units were randomly arranged in the presence of 500 mM NaCl at t = 0 (left) and after 1.2 μs dynamics (right), where the 40 peptide units are assembled, leading to peptide fibers with this replicated cubic unit. Na+ ions are shown in light blue and H2O molecules are hidden for better clarity of the assembly visualization. (b) π–π stacking of aromatic Fmoc groups in the hydrophobic nucleus of the assembly. (c) Electrostatic interaction between the phosphate groups of 3 Fmoc-FFpY units and the Na+ ions in the outer part. (d) Ramachandran map of one Fmoc-FFpY assembled structure. (e) Conformational free energy landscape of Fmoc-FFpY/Na+ assemblies. (f) TEM micrograph of a negatively stained Fmoc-FFpY6.4/Na+500 hydrogel, where the arrows marked a helical twisting. The inset shows a zoom-in image to visualize the arrangement of fibers forming a nanorod and the helical structure. | ||
As expected, spontaneous and complete aggregation occurs during the first 400 ns and evolves slightly, as shown by the RMSD curve (Fig. S12†). Two different aggregation behaviors were observed at 250 and 500 mM NaCl. At 250 mM NaCl, three out of four simulations showed the collapse of all 40 Fmoc-FFpY units into a globular structure, while a single simulation showed a nanorod-like structure. In this last simulation, the peptides took advantage of periodic boundary conditions in one direction to organize into a nanorod-like conformation producing a 2D material. These structural organizations are shown in Fig. S13.† In contrast, at 500 mM NaCl, all simulations showed a nanorod-like organization by repeating the structural organization in a periodic direction. Fig. S14† shows these organizations for the 4 simulations. The variation observed in the concentration dependence is of considerable interest, as it effectively mirrors the results observed in the experimental TEM micrographs. Specifically, Fig. 1d shows that individual nanofibers are isolated at a concentration of 250 mM NaCl, whereas complete nanofiber formation is observed at 500 mM. It is worth highlighting the remarkable achievement of reproducing the morphological behavior of the hydrogel using atomistic simulations. To the best of our knowledge, this study is the first to report such a correspondence.
Since the structural incidence at 500 mM NaCl is the most interesting, complete structural analyses were performed at this concentration, focusing on the last 200 ns of the four simulations to provide meaningful information after the stabilization of the assembly. Three distinct structurally favorable interactions were highlighted: (i) π–π stacking of aromatic groups present in the peptide structure. There are many stacks in each structure, almost exclusively related to Fmoc and Phe groups. Phosphorylated tyrosine has a volume of 197 Å3 instead of 157 Å3, corresponding to 20% of the whole amino acid volume. The phosphate moiety is thus quite massive and not planar, disfavoring this way of approach of another aromatic nucleus. Stacks of two, three, and up to four peptide units are observed (Fig. 4b and c). These stacks, which occur at distances between 4 and 5 Å, are observed in the center of the cluster, highlighting the hydrophobic core of the cluster. (ii) Many electrostatic interactions involving sodium ions are identified. At the end of the simulation, 89% of the Na+ ions interact with the peptide (i.e., at a distance of less than 3 Å). In contrast to the aromatic stacks, the electrostatic interactions are localized on the surface of the array, as shown in Fig. 4d and Fig. S15.† Na+ ions strongly shield the negative charges of Fmoc-FFpY, allowing the approach of several peptide fragments on the side of the phosphorylated tyrosine. They are, therefore, an essential element in the organization of the assembly and occur at distances between 4.5 and 6.4 Å. (iii) Many hydrogen bonds are also present during the molecular dynamics, but only those with an attendance time of at least 20%, i.e., H-bonds that are observed for at least 40 ns within the 200 ns of the analyzed trajectory, were considered for a distance between 1.8 and 2 Å. The only hydrogen bond donor atoms are the NHs of the amides of the peptide backbone (three for each Fmoc-FFpY molecule). It is observed that H-bonds almost exclusively involve interactions with the peptide backbone. Therefore, H-bonds are the sign of “secondary structure” elements and are classified into two groups, intermolecular and intramolecular. Intermolecular H-bonds fairly identify β-sheet organizations (Fig. S15b, left†). For these β-sheets, up to 3 H-bonds are observed, which corresponds to the maximum for this peptide size, implying that the peptide backbone is sheet-like, i.e., more or less flat. On the other hand, if we focus on the intramolecular H-bonds, we observed that the peptide backbone shows wrinkling similar to that of an α-helix (Fig. S15b, right†). The single H-bond brings the tyrosine closer to the Fmoc fragment, forcing the peptide backbone to adopt a helical structure.
All these findings are supported by the Ramachandran map, which shows the phi and psi angles of the peptide backbone without taking into account hydrogen bonds (Fig. 4d). The phi/psi pairs confirm the presence of both β-sheet (57 ± 4%) and α-helix (43 ± 3%) structures within the assemblies. In comparison, the FTIR decomposition of the amide I band gave the β-sheet (∼41%) and α-helix (∼29%) of the total secondary structures. When the ratio is calculated on the total amount of β-sheet and α-helix structures only, we obtain the β-sheet (∼59%) and α-helix (∼41%), which is very close to the simulation results. The fact that we observed an almost identical ratio of secondary structures between the calculations and the experimental data strongly validates the MD simulations. Similarly, it can be observed that interactions promoting peptide assembly occur at three typical distance ranges: 1.8 to 2 Å for hydrogen bonds, 4 to 5 Å for the stacking of aromatic cores, and 4.5 to 6.4 Å for ionic bonds. These values correspond to the three values obtained from the WAXS spectra (3.3, 4.1, and 6.4 Å), which exhibit a similar trend.
To investigate the structural stability of the systems, an energy mapping was performed using Boltzmann statistics and by considering the elongation distance of the peptide as well as its overall dihedral angle as coordinates (Fig. 4e). On this energy map, two energy basins are highlighted, corresponding to the formation of α-helices and β-sheets. Another interesting finding is that the two minima (framed in Fig. 4e), which are a signature of the two secondary structures, are not isolated in the map, meaning that it is energetically economical to switch from the β-sheet to α-helix and vice versa. This is confirmed by the TEM micrograph (Fig. 4f), which shows the presence of both non-twisted nanofibers, which can be attributed to β-sheets and twisted nanofibers, which can be a feature of α-helix secondary structures, in the Fmoc-FFpY6.4/Na+500 hydrogel.
Macroscopic properties of Fmoc-FFpY/Na+ hydrogels: a study of rheological and thermo-responsive properties
Oscillatory rheological measurements were performed to determine the mechanical properties of the Fmoc-FFpY/Na+ hydrogels. Fig. 5a shows the evolution of the elastic modulus (G′) and the loss modulus (G′′) over time for the Fmoc-FFpY6.4/Na+ hydrogels formed at different NaCl concentrations. Time sweep experiments were performed within the viscoelastic regime (1% strain) at 1 Hz to provide information about the time needed to form a stable gel. Fmoc-FFpY6.4/Na+ hydrogel formation (G′ > G′′) is instantaneous for NaCl concentrations higher than 250 mM, which exhibited G′ and G′′ values that remained stable over the time in less than 300 s, whereas a longer gelation time (∼900 s) was required at 150 mM NaCl to reach a plateau of both G′ and G′′. The frequency sweep experiments confirmed that in all cases, G′ was higher than G′′ and the materials behaved as viscoelastic solids. G′ (respect to G′′) increases with the NaCl concentration reaching values of 2.7 ± 1.2 Pa (G′′ = 1.4 ± 0.5 Pa), 4.5 ± 2.2 Pa (G′′ = 2.1 ± 0.2 Pa), 24.2 ± 11.0 Pa (G′′ = 5.4 ± 2.4 Pa), and 53.3 ± 14.9 Pa (G′′ = 7.7 ± 1.3 Pa) for the hydrogels formed with 150, 250, 375, and 500 mM NaCl, respectively (Fig. 5b). With increasing NaCl concentration, G′ and G′′ become more independent of the frequency, indicating the strengthening of the hydrogel network. This is probably due to the increase in the number of fibers and the entanglements between them, as shown in the TEM images (Fig. 1d). By keeping the NaCl concentration fixed at 500 mM, the G′ of the Fmoc-FFpY/Na+ hydrogels increases with the peptide concentration from 3.9 ± 0.9 Pa (G′′ = 0.6 ± 0.1 Pa) to 17.9 ± 1.1 Pa (G′′ = 2.6 ± 0.4 Pa) and 53.3 ± 14.9 Pa (G′′ = 7.7 ± 1.3 Pa) when prepared with 1.3, 3.2, and 6.4 mM Fmoc-FFpY (Fig. S16†). The elastic modulus values of Fmoc-FFpY/Na+500 prepared at 6.4 mM in the peptide are in the range of those found in other Fmoc-based hydrogels such as Fmoc-FF (G′ ∼ 80 Pa)63 or Fmoc-GFFRGD (G′ ∼ 100 Pa).64 | ||
| Fig. 5 Rheological properties of Fmoc-FFpY6.4/Na+ hydrogels prepared at 150 mM, 250 mM, 375 mM, and 500 mM NaCl. Storage modulus (G′ – solid symbols) and loss modulus (G′′ – hollow symbols) as a function of (a) time (1 Hz, 1% strain), (b) frequency (0.01–10 Hz, 1% strain), (c) strain (0.01–1000%, 1 Hz), and (d) dynamic step strain amplitude tests (1% or 1 000% strain) at 20 °C. | ||
Strain sweeps were performed to determine the linear viscoelastic regime and the gel-to-sol transition for self-healing tests (Fig. 5c). At 1% strain, all Fmoc-FFpY6.4/Na+ hydrogels (G′ > G′′) prepared at different NaCl concentrations are in the linear viscoelastic region. As strain increases, a gel-to-sol transition occurs, and at 1000% strain, the Fmoc-FFpY6.4/Na+ gels are in the solution state (G′′ > G′). The self-healing hydrogels exhibit a recovery of their viscoelastic properties after being subjected to a shear force. To evaluate this property, dynamic step strain amplitude tests were performed by varying the strains between 1 and 1000% for short times, 200 s (Fig. 5d). At stage I (γ = 1%), the Fmoc-FFpY6.4/Na+ hydrogels exhibit a solid-like behavior (G′ > G′′). As the strain is increased in stage II (γ = 1000%), the elastic modulus rapidly decreases two orders of magnitude and well below that of G′′, reaching a fluid-like state (G′′ > G′) through the breaking of the weak physical interactions (electrostatic interactions, π–π stacking, and H-bonds) that form the gel structure.65 Interestingly, when the hydrogels are no longer subjected to large deformations (stage III, γ = 1%), the initial mechanical properties are recovered almost instantaneously, showing a solid-like behavior again (G′ > G′′), which proved the rapid self-healing behavior of the gels, which might be facilitated by the solvent that enhances the mobility and rearrangement of the molecules.66 Notably, this self-healing behavior is maintained after a second deformation (stage IV, γ = 1000%) and recovery (stage V, γ = 1%) cycle. However, slightly lower G′ values were observed after the first high–low strain cycle for the hydrogels formed with NaCl concentrations higher than 150 mM, which indicates that the gradual build-up of the gel structure to the equilibrium state would require longer periods of “rest” (low strain), a property typically observed for several low molecular weight gelators.67,68
The thermo-responsive properties of the Fmoc-FFpY/Na+ hydrogels were first evaluated by inverted tube tests under controlled thermal conditions in an oven (Fig. 6a). The peptide Fmoc-FFpY in solution (6.4 mM in borax buffer) has no gelling ability. The Fmoc-FFpY/Na+150 hydrogels exhibit a gel-to-sol transition (Tg–s) when heated up to 60 °C and a thermo-reversible sol-to-gel transition when cooled to 20 °C.
 | ||
| Fig. 6 (a) Inverted tube tests of Fmoc-FFpY6.4/Na+ hydrogels prepared at different NaCl concentrations at different temperatures. Dashed lines are a guide to the eye. Micro-DSC curves of Fmoc-FFpY 6.4 mM in the absence (black curve) and in the presence of different NaCl concentrations, Fmoc-FFpY6.4/Na+150 (green curve), Fmoc-FFpY6.4/Na+250 (red curve), Fmoc-FFpY6.4/Na+375 (blue curve), and Fmoc-FFpY6.4/Na+500 (pink curve): (b) 1st heating scan at 0.1 °C min−1, (c) 1st cooling scan at 0.1 °C min−1, (d) 2nd heating scan at 0.1 °C min−1, and (e) 2nd cooling scan at 0.1 °C min−1. | ||
A more detailed investigation was performed by micro-DSC, where the hydrogels were heated from 20 to 75 °C (Fig. 6b). Fmoc-FFpY in solution (6.4 mM in borax buffer) showed an endothermic peak at 62 °C, which can be attributed to the gel–sol transition of the nanodroplets of the peptide (Fig. S3†). This was confirmed by the X-ray diffractogram of Fmoc-FFpY in powder, which does not show any crystalline structure (Fig. S17†). A single broad diffraction band at 2θ = 18–20° remains stable during heating and subsequent cooling processes. This corresponds to a distance of 4.4 Å attributed to the inter-strand distance of Fmoc-F peptides.69 The hydrogels formed with a lower NaCl concentration, Fmoc-FFpY6.4/Na+150 and Fmoc-FFpY6.4/Na+250, show a single endothermic peak at 62 °C corresponding to the gel–sol transition temperature (Tg–s) of the hydrogels as determined by the inverted tests. Interestingly, at the intermediate NaCl concentration, Fmoc-FFpY6.4/Na+375, the endothermic signal is weak and shifted to lower temperatures with the appearance of two bands at 53 and 57 °C, which can be attributed to a transition state in gel formation from small nanofibers randomly distributed in the hydrogel network to a long bundle of nanofibers as observed by TEM (Fig. 1d). However, at a higher NaCl concentration, Fmoc-FFpY6.4/Na+500, the endothermic peak at 62 °C reappeared with higher intensity. This phenomenon can be explained as an effect of charge compensation by comparing the enthalpy (ΔHg–s) of each sample (Table S3†).
ΔHg–s decreases from 16.0 J g−1 to 5.9 J g−1 for Fmoc-FFpY and Fmoc-FFpY6.4/Na+250, respectively, and remains constant for Fmoc-FFpY6.4/Na+375. This may reflect the lowest energy state of this hydrogel as a result of the morphological change. Then, ΔHg–s increases up to 35.4 J g−1 for Fmoc-FFpY6.4/Na+500, where more stable nanorods are formed. These Fmoc-FFpY6.4/Na+ hydrogels show a recovery of the gel properties after cooling them back to 20 °C (Fig. 6c), with the presence of a single exothermic peak at 47 °C, attributed to the sol-to-gel transition (Ts–g). The enthalpy values (ΔHs–g) are similar to those obtained in the heating step (ΔHg–s). Thus, it demonstrates the thermo-reversible behavior of these supramolecular peptide hydrogels, which is maintained even after two repeated heating and cooling cycles (Fig. 6d and e), showing the same ΔHg–s and ΔHs–g values as in the first cycle (Table S3†).
Conclusions
Supramolecular hydrogels were formed by electrostatic interactions between the tripeptide Fmoc-FFpY and Na+ ions. The Fmoc-FFpY/Na+ hydrogels exhibited a nanofibrillar morphology with fiber diameters of ∼5 nm, which tended to bundle and align as the NaCl concentration increased, leading to nanorods of ∼46 nm diameter for the Fmoc-FFpY/Na+500 hydrogels. The secondary structure of the Fmoc-FFpY/Na+ assembly is formed by a combination of both β-sheets and α-helices. Molecular dynamics simulations allowed the confirmation of the aggregation of peptides and the secondary structure of the hydrogels, thus fully correlating with the experimental results obtained. Overall, the peculiar characteristics of the Fmoc-FFpY/Na+ hydrogels reported in this work, with the ability to assemble in the presence of physiological saline together with self-healing and thermo-responsive properties, pave the way for their employment as injectable materials for potential biomedical applications such as wound healing and tissue engineering (e.g. mucus and neural tissues).Author contributions
Miryam Criado-Gonzalez conceived the study. Miryam Criado-Gonzalez, Fouzia Boulmedais and Rebeca Hernández supervised and commented on the project. Miryam Criado-Gonzalez synthesized and characterized the hydrogels. Mario Iván Peñas carried out the micro-DSC experiments and analysis. Florent Barbault performed the computational studies and analysis. Alejandro J. Müller supervised the micro-DSC experiments and analysis. All authors discussed the experimental procedures and results and contributed to the writing of the original manuscript.Conflicts of interest
There are no conflicts to declare.Acknowledgements
Financial support from the Spanish Research Council (CSIC) and the French Research Council (CNRS) for the International Emerging Actions 2018 HYDROPRINT project is gratefully acknowledged. The authors also acknowledge the funding from the projects MAT2017-83014-C2-2-P and PID2020-113045GB-C22 by MCIN/AEI/10.13039/501100011033 and the ALBA Synchrotron (Proposal number 2021095380). R. H. is a member of the SUSPLAST+ platform of CSIC.The authors thank Dr Rafael Nuñez from CIB-CSIC for TEM and Cryo-TEM measurements and the technical and human support provided by SGIker (UPV/EHU/ERDF, EU). SAXS experiments were performed at the BL 11 NCD-SWEET beamline at ALBA Synchrotron with the collaboration of ALBA staff. ANR (Agence Nationale de la Recherche) and CGI (Commissariat à l'Investissement d'Avenir) are gratefully acknowledged for their financial support of this work through Labex SEAM (Science and Engineering for Advanced Materials and Devices) ANR 11 LABX 086, and ANR 11 IDEX 05 02. This work benefited from the access to the supercomputing facilities of the GENCI (Grand Equipement National pour le Calcul Informatique) and the access to the ITODYS P3MB facility (Université Paris Cité, CNRS UMR 7086, Paris, France).
References
- A. Levin, T. A. Hakala, L. Schnaider, G. J. L. Bernardes, E. Gazit and T. P. J. Knowles, Nat. Rev. Chem., 2020, 4, 615–634 CrossRef CAS.
- C. Yuan, S. Li, Q. Zou, Y. Ren and X. Yan, Phys. Chem. Chem. Phys., 2017, 19, 23614–23631 RSC.
- A. D. Martin and P. Thordarson, J. Mater. Chem. B, 2020, 8, 863–877 RSC.
- B. O. Okesola and A. Mata, Chem. Soc. Rev., 2018, 47, 3721–3736 RSC.
- F. Sheehan, D. Sementa, A. Jain, M. Kumar, M. Tayarani-Najjaran, D. Kroiss and R. V. Ulijn, Chem. Rev., 2021, 121, 13869–13914 CrossRef CAS PubMed.
- K. Tao, A. Levin, L. Adler-Abramovich and E. Gazit, Chem. Soc. Rev., 2016, 45, 3935–3953 RSC.
- X. Hu, M. Liao, H. Gong, L. Zhang, H. Cox, T. A. Waigh and J. R. Lu, Curr. Opin. Colloid Interface Sci., 2020, 45, 1–13 CrossRef CAS.
- S. Fleming and R. V. Ulijn, Chem. Soc. Rev., 2014, 43, 8150–8177 RSC.
- R. D. Murphy, R. V. Garcia, A. Heise and C. J. Hawker, Prog. Polym. Sci., 2022, 124, 101487 CrossRef CAS.
- S. Eskandari, T. Guerin, I. Toth and R. J. Stephenson, Adv. Drug Delivery Rev., 2017, 110–111, 169–187 CrossRef CAS PubMed.
- H. H. Susapto, D. Alhattab, S. Abdelrahman, Z. Khan, S. Alshehri, K. Kahin, R. Ge, M. Moretti, A.-H. Emwas and C. A. E. Hauser, Nano Lett., 2021, 21, 2719–2729 CrossRef CAS PubMed.
- Y. Kuang, Y. Gao, J. Shi, H.-C. Lin and B. Xu, Chem. Commun., 2011, 47, 8772–8774 RSC.
- A. M. Smith, R. J. Williams, C. Tang, P. Coppo, R. F. Collins, M. L. Turner, A. Saiani and R. V. Ulijn, Adv. Mater., 2008, 20, 37–41 CrossRef CAS.
- C. Diaferia, E. Rosa, G. Morelli and A. Accardo, Pharmaceuticals, 2022, 15, 1048 CrossRef CAS PubMed.
- S. Debnath, A. Shome, D. Das and P. K. Das, J. Phys. Chem. B, 2010, 114, 4407–4415 CrossRef CAS PubMed.
- X. Li, H. Zhang, L. Liu, C. Cao, P. Wei, X. Yi, Y. Zhou, Q. Lv, D. Zhou and T. Yi, J. Mater. Chem. B, 2021, 9, 8686–8693 RSC.
- P. Ren, J. Li, L. Zhao, A. Wang, M. Wang, J. Li, H. Jian, X. Li, X. Yan and S. Bai, ACS Appl. Mater. Interfaces, 2020, 12, 21433–21440 CrossRef CAS.
- R. Xing, C. Yuan, S. Li, J. Song, J. Li and X. Yan, Angew. Chem., Int. Ed., 2018, 57, 1537–1542 CrossRef CAS PubMed.
- K. Ryan, J. Beirne, G. Redmond, J. I. Kilpatrick, J. Guyonnet, N.-V. Buchete, A. L. Kholkin and B. J. Rodriguez, ACS Appl. Mater. Interfaces, 2015, 7, 12702–12707 CrossRef CAS PubMed.
- H. Arakawa, K. Takeda, S. L. Higashi, A. Shibata, Y. Kitamura and M. Ikeda, Polym. J., 2020, 52, 923–930 CrossRef CAS.
- W. Ji, C. Yuan, P. Chakraborty, S. Gilead, X. Yan and E. Gazit, Commun. Chem., 2019, 2, 65 CrossRef.
- W. Ji, C. Yuan, S. Zilberzwige-Tal, R. Xing, P. Chakraborty, K. Tao, S. Gilead, X. Yan and E. Gazit, ACS Nano, 2019, 13, 7300–7309 CrossRef CAS PubMed.
- Z. Yang and B. Xu, Adv. Mater., 2006, 18, 3043–3046 CrossRef CAS.
- B. J. Kim, D. Yang and B. Xu, Trends Chem., 2020, 2, 71–83 CrossRef CAS.
- Z. Yang, H. Gu, D. Fu, P. Gao, J. K. Lam and B. Xu, Adv. Mater., 2004, 16, 1440–1444 CrossRef CAS.
- R. Orbach, I. Mironi-Harpaz, L. Adler-Abramovich, E. Mossou, E. P. Mitchell, V. T. Forsyth, E. Gazit and D. Seliktar, Langmuir, 2012, 28, 2015–2022 CrossRef CAS PubMed.
- M. Criado-Gonzalez, J. R. Fores, A. Carvalho, C. Blanck, M. Schmutz, L. Kocgozlu, P. Schaaf, L. Jierry and F. Boulmedais, Langmuir, 2019, 35, 10838–10845 CrossRef CAS PubMed.
- M. Criado-Gonzalez, J. Rodon Fores, D. Wagner, A. P. Schröder, A. Carvalho, M. Schmutz, E. Harth, P. Schaaf, L. Jierry and F. Boulmedais, Chem. Commun., 2019, 55, 1156–1159 RSC.
- C. Vigier-Carrière, T. Garnier, D. Wagner, P. Lavalle, M. Rabineau, J. Hemmerlé, B. Senger, P. Schaaf, F. Boulmedais and L. Jierry, Angew. Chem., Int. Ed., 2015, 54, 10198–10201 CrossRef PubMed.
- M. Criado-Gonzalez, B. Loftin, J. Rodon Fores, D. Vautier, L. Kocgozlu, L. Jierry, P. Schaaf, F. Boulmedais and E. Harth, J. Mater. Chem. B, 2020, 8, 4419–4427 RSC.
- M. Criado-Gonzalez, M. H. Iqbal, A. Carvalho, M. Schmutz, L. Jierry, P. Schaaf and F. Boulmedais, Front. Bioeng. Biotechnol., 2020, 8, 938 CrossRef PubMed.
- M. Stefani and C. M. Dobson, J. Mol. Med., 2003, 81, 678–699 CrossRef CAS.
- T. P. J. Knowles, M. Vendruscolo and C. M. Dobson, Nat. Rev. Mol. Cell Biol., 2014, 15, 384–396 CrossRef CAS PubMed.
- M. Criado-Gonzalez, E. Espinosa-Cano, L. Rojo, F. Boulmedais, M. R. Aguilar and R. Hernández, ACS Appl. Mater. Interfaces, 2022, 14, 10068–10080 CrossRef CAS PubMed.
- M. Criado-Gonzalez, D. Wagner, J. Rodon Fores, C. Blanck, M. Schmutz, A. Chaumont, M. Rabineau, J. B. Schlenoff, G. Fleith, J. Combet, P. Schaaf, L. Jierry and F. Boulmedais, Chem. Mater., 2020, 32, 1946–1956 CrossRef CAS.
- A. Hospital, J. R. Goñi, M. Orozco and J. L. Gelpí, Adv. Appl. Bioinf. Chem., 2015, 8, 37–47 Search PubMed.
- M. Arnittali, A. N. Rissanou and V. Harmandaris, Procedia Comput. Sci., 2019, 156, 69–78 CrossRef.
- M. Cordova, P. Moutzouri, S. O. Nilsson Lill, A. Cousen, M. Kearns, S. T. Norberg, A. Svensk Ankarberg, J. McCabe, A. C. Pinon, S. Schantz and L. Emsley, Nat. Commun., 2023, 14, 5138 CrossRef CAS.
- K. M. Eckes, X. Mu, M. A. Ruehle, P. Ren and L. J. Suggs, Langmuir, 2014, 30, 5287–5296 CrossRef CAS.
- I. R. Sasselli, C. G. Pappas, E. Matthews, T. Wang, N. T. Hunt, R. V. Ulijn and T. Tuttle, Soft Matter, 2016, 12, 8307–8315 RSC.
- X. Mu, K. M. Eckes, M. M. Nguyen, L. J. Suggs and P. Ren, Biomacromolecules, 2012, 13, 3562–3571 CrossRef CAS PubMed.
- T. Schnitzer, E. Paenurk, N. Trapp, R. Gershoni-Poranne and H. Wennemers, J. Am. Chem. Soc., 2021, 143, 644–648 CrossRef CAS PubMed.
- J.-W. Shin, Eur. J. Mass Spectrom., 2019, 25, 445–450 CrossRef CAS PubMed.
- P. V. Konarev, V. V. Volkov, A. V. Sokolova, M. H. J. Koch and D. I. Svergun, J. Appl. Crystallogr., 2003, 36, 1277–1282 CrossRef CAS.
- L. Schrödinger, Maestro, 2023, https://www.schrodinger.com/ (access date: 2023).
- J. Touzeau, M. Seydou, F. Maurel, L. Tallet, A. Mutschler, P. Lavalle and F. Barbault, Langmuir, 2021, 37, 11374–11385 CrossRef CAS PubMed.
- L. Martínez, R. Andrade, E. G. Birgin and J. M. Martínez, J. Comput. Chem., 2009, 30, 2157–2164 CrossRef PubMed.
- D. Vassetti, M. Pagliai and P. Procacci, J. Chem. Theory Comput., 2019, 15, 1983–1995 CrossRef CAS PubMed.
- M. Ramakrishnan, A. van Teijlingen, T. Tuttle and R. V. Ulijn, Angew. Chem., Int. Ed., 2023, 62, e202218067 CrossRef CAS PubMed.
- D. A. Case, T. E. Cheatham III, T. Darden, H. Gohlke, R. Luo, K. M. Merz Jr., A. Onufriev, C. Simmerling, B. Wang and R. J. Woods, J. Comput. Chem., 2005, 26, 1668–1688 CrossRef CAS PubMed.
- D. A. B. Case, I. Y. Ben-Shalom, S. R. Brozell, D. S. Cerutti, T. E. Cheatham III, V. W. D. Cruzeiro, T. A. Darden, R. E. Duke, G. Giambasu, M. K. Gilson, H. Gohlke, A. W. Goetz, R. Harris, S. Izadi, S. A. Izmailov, K. Kasavajhala, A. Kovalenko, R. Krasny, T. Kurtzman, T. S. Lee, S. LeGrand, P. Li, C. Lin, J. Liu, T. Luchko, R. Luo, V. Man, K. M. Merz, Y. Miao, O. Mikhailovskii, G. Monard, H. Nguyen, A. Onufriev, F. Pan, S. Pantano, R. Qi, D. R. Roe, A. Roitberg, C. Sagui, S. Schott-Verdugo, J. Shen, C. L. Simmerling, N. R. Skrynnikov, J. Smith, J. Swails, R. C. Walker, J. Wang, L. Wilson, R. M. Wolf, X. Wu, Y. Xiong, Y. Xue, D. M. York and P. A. Kollman, AMBER 2020, https://ambermd.org/ (access date: 2023) Search PubMed.
- D. R. Roe and T. E. Cheatham III, J. Chem. Theory Comput., 2013, 9, 3084–3095 CrossRef CAS PubMed.
- W. Humphrey, A. Dalke and K. Schulten, J. Mol. Graphics, 1996, 14, 33–38 CrossRef CAS PubMed.
- V. B. Chen, W. B. Arendal III, J. J. Headd, D. A. Keedy, R. M. Immormino, G. J. Kapral, L. W. Murray, J. S. Richardson and D. C. Richardson, Acta Crystallogr., 2010, 66, 12–21 CrossRef CAS.
- Q. Xiong, Y. Jiang, X. Cai, F. Yang, Z. Li and W. Han, ACS Nano, 2019, 13, 4455–4468 CrossRef CAS PubMed.
- A. Pattammattel, M. Puglia, S. Chakraborty, I. K. Deshapriya, P. K. Dutta and C. V. Kumar, Langmuir, 2013, 29, 15643–15654 CrossRef CAS PubMed.
- F. Gobeaux and F. Wien, Langmuir, 2018, 34, 7180–7191 CrossRef CAS PubMed.
- H. Cui, M. J. Webber and S. I. Stupp, Biopolymers, 2010, 94, 1–18 CrossRef CAS PubMed.
- M. Criado-Gonzalez, D. Wagner, M. H. Iqbal, A. Ontani, A. Carvalho, M. Schmutz, J. B. Schlenoff, P. Schaaf, L. Jierry and F. Boulmedais, J. Colloid Interface Sci., 2021, 588, 580–588 CrossRef CAS.
- S. Fleming, P. W. J. M. Frederix, I. Ramos Sasselli, N. T. Hunt, R. V. Ulijn and T. Tuttle, Langmuir, 2013, 29, 9510–9515 CrossRef CAS.
- B. J. M. Rajkumar and V. Ramakrishnan, Spectrochim. Acta, Part A, 2001, 57, 247–254 CrossRef CAS PubMed.
- T. Barot, D. Rawtani and P. Kulkarni, Heliyon, 2020, 6, e03601 CrossRef CAS.
- R. Xing, S. Li, N. Zhang, G. Shen, H. Möhwald and X. Yan, Biomacromolecules, 2017, 18, 3514–3523 CrossRef CAS PubMed.
- E. Y. Du, F. Ziaee, L. Wang, R. E. Nordon and P. Thordarson, Polym. J., 2020, 52, 947–957 CrossRef CAS.
- V. Ajay Mallia and R. G. Weiss, Soft Matter, 2016, 12, 3665–3676 RSC.
- R. P. Wool, Soft Matter, 2008, 4, 400–418 RSC.
- Z. Özdemir, D. Šaman, K. Bertula, M. Lahtinen, L. Bednárová, M. Pazderková, L. Rárová, Nonappa and Z. Wimmer, Langmuir, 2021, 37, 2693–2706 CrossRef.
- L. Arnedo-Sánchez, Nonappa, S. Bhowmik, S. Hietala, R. Puttreddy, M. Lahtinen, L. De Cola and K. Rissanen, Dalton Trans., 2017, 46, 7309–7316 RSC.
- V. Singh, K. Snigdha, C. Singh, N. Sinha and A. K. Thakur, Soft Matter, 2015, 11, 5353–5364 RSC.
Footnote |
| † Electronic supplementary information (ESI) available. See DOI: https://doi.org/10.1039/d4nr00335g |
| This journal is © The Royal Society of Chemistry 2024 |