
 Open Access Article
 This Open Access Article is licensed under a
 Creative Commons Attribution 3.0 Unported Licence
Tuning the morphology and chemical distribution of Ag atoms in Au rich nanoparticles using electrochemical dealloying†
Alexandra
Dworzak
 ab,
Paul
Paciok
c,
Christoph
Mahr
de,
Marc
Heggen
c,
Carsten
Dosche
b,
Andreas
Rosenauer
de and
Mehtap
Oezaslan
*ab
ab,
Paul
Paciok
c,
Christoph
Mahr
de,
Marc
Heggen
c,
Carsten
Dosche
b,
Andreas
Rosenauer
de and
Mehtap
Oezaslan
*ab
aTechnical Electrocatalysis Laboratory, Institute of Technical Chemistry, Technische Universität Braunschweig, Franz-Liszt-Str. 35a, 38106 Braunschweig, Germany. E-mail: m.oezaslan@tu-braunschweig.de
bInstitute of Chemistry, Carl von Ossietzky University of Oldenburg, Carl-von-Ossietzky-Str. 9-11, 26129 Oldenburg, Germany
cErnst Ruska-Center, Jülich Research Centre, 52425 Jülich, Germany
dInstitute of Solid State Physics, University of Bremen, Otto-Hahn-Allee 1, 28359 Bremen, Germany
eMAPEX Center for Materials and Processes, University of Bremen, Bibliothekstr. 1, 28359 Bremen, Germany
First published on 22nd April 2024
Abstract
Dealloying of Ag–Au alloy nanoparticles (NPs) strongly differs from the corresponding bulk alloy materials. Here, we have investigated the effects of potentiodynamic and potentiostatic dealloying on structure and distribution of residual Ag atoms for Au rich NPs. Two different sizes of Ag rich alloy NPs, 77 ± 26 nm Ag77Au23 and 12 ± 5 nm Ag86Au14, were prepared. 77 nm Ag77Au23 NPs form a homogeneous alloy, while 12 nm Ag86Au14 NPs show an Ag rich shell–Au rich core arrangement. The two groups of as-prepared NPs were dealloyed either under potentiodynamic (0.2–1.3 VRHE) or potentiostatic (0.9, 1.2, and 1.6 VRHE) conditions in 0.1 M HClO4. For the initial 77 nm Ag77Au23 NPs, both dealloying protocols lead to pore evolution. Interestingly, instead of homogenous Ag distribution, numerous Ag rich regions form and locate near the pores and particle edges. The critical dealloying potential also differs by ∼500 mV depending on the dealloying method. The initial 12 nm Ag86Au14 NPs remain dense and solid, but Ag distribution and thickness of the Au passivation layer vary between both dealloying protocols. When the Au passivation layer is very thin, the residual Ag atoms tend to segregate to the particle surface after dealloying. Due to the size effect, small NPs are less electrochemically stable and show a lower critical dealloying potential. In this systematic study, we demonstrate that the mobility of Au surface atoms and dealloying conditions control the structure and residual Ag distribution within dealloyed NPs.
Introduction
Nanoporous gold (NPG) obtained by selective dissolution of a less noble metal from binary or ternary gold-based master alloys such as Ag–Au, Cu–Au and Ag–Pt–Au has often been studied as model system in corrosion and catalysis sciences.1–8 NPG can be prepared by chemical or electrochemical dealloying methods using a bulk master alloy,9–11 whereas the effects of dealloying parameters and conditions on the resulting structure, morphology and chemical distribution of the residual less noble metal have intensively been studied for bulk materials.12–18 Although reducing the particle size of precious metal-based materials down to the nanoscale is a well-known approach to increase the number of active sites due to higher surface-to-volume ratio, the dealloying effects on alloy nanoparticles (= NPs) remain mainly unexplored so far. For instance, gold NPs exhibit improved catalytic performance for methanol oxidation reaction compared to their bulk materials.19 Very interestingly, dealloyed NPs could yield superior activity for electrochemical reactions such as oxygen reduction reaction (ORR)20 and hydrogen evolution reaction (HOR).21The formation of porous NPs prepared by dealloying requires the following criteria: (i) the master alloy particles must be large enough to evolve pores that are several nanometers in size;20 (ii) the content of less noble metal in the master alloy must be above a critical threshold, which can be higher than 60 wt% of the less noble metal;20,22 (iii) the dealloying occurs above a critical potential (Ecrit), which is characterized by the sharp increase of anodic current.22,23 Below the Ecrit, a quick passivation takes place due to the accumulation of more noble metal surface atoms. Generally, the Ecrit depends on the interplay between the reduction of free energy during dissolution and the increase in energy attributed to higher roughness and surface area.24 For monometallic nano-materials, the dissolution potential is a function of 1/r, r being the particle radius. This relationship is based on the energy gain from dissolution as a function of surface curvature – the so called Gibbs–Thomson effect.25,26 Recently, Kinetic Monte Carlo (KMC) simulations reported by McCue et al.27 show that the Ecrit for alloy NPs is higher than for bulk and increases with 1/r. This can be explained not only by increased dissolution of less noble metal, but also an increased surface mobility of the remaining noble metal atoms for smaller NPs and is therefore based on kinetic effects. Principally, the dealloying process can continue if the fluctuations of the surface expose the underlying less noble metal atoms long enough for their dissolution.
One of the first systematic studies pointing out the particle size effects for highly active Co–Pt and Cu–Pt alloy NPs for ORR during electrochemical dealloying was reported in our previous works.28,29 The evolution of different dealloyed particle motifs such as core–shell and porous NPs is based on the differences in surface mobility of the remaining noble metal atoms. More preciously, the critical particle size for porosity of Cu–Pt and Co–Pt NPs is above 25–30 nm. In case of size effects on Ag–Au NPs, Sieradzki et al.20 investigated the dealloying behavior of initial 20–55 nm and 2–6 nm NPs under chronoamperometric conditions. Above the Ecrit, the large NPs show a pore network structure, while smaller NPs tend to form core–shell structure. Tschulik et al.21 studied the effect of rapid potentiodynamic conditions (0–1.25 VMSE) on the dealloyed structure for 30 ± 9 nm Ag80Au20 NPs. They show a relationship between cycle number and structure for the porous Au rich NPs. Despite the massive Ag loss in the first 100 cycles, the porosity evolution is further observed between 100 and 500 cycles, but with increasing cycle number particle agglomeration prevails. As another excellent work, Cha et al.30 performed Bragg coherent diffractive image studies to visualize local 3D morphology and strain distributions of porous NPs prepared by dealloying. They showed that the displacement field magnitudes and the lattice strain increase over the dealloying time. Very interestingly, Liu et al.31 carried out in situ liquid cell HAADF-STEM experiments to evaluate the dealloying kinetics of shape controlled AgAu NPs. Here, they observed that Ag–Au nanorods and nanocubes show a volume shrinkage of 43% and 39%, respectively, which is significantly higher than for bulk materials. Furthermore, quantitative three-dimensional (S)TEM tomography studies enable to establish structural information of NPG like pore size, porosity, specific surface area, and tortuosity. Very interestingly, the porosity characteristics of porous NPs prepared by dealloying strongly differ from bulk materials. More precisely, porous NPs with smaller ligaments show lower residual Ag content and vice versa. However, an opposite trend is observed for bulk NPG.32
Altogether, those studies have addressed the dealloying behaviors of Ag–Au NPs, showing the effects of particle size, dealloying dynamics, and structural evolution. However, only very little attention has been paid to the fine-structure and spatial distribution of the residual silver atoms within the dealloyed NPs at different size groups. This knowledge is very important to fundamentally understand the Ag distribution within these dealloyed NPs ranging from core–shell to porous and their mechanic, physicochemical and catalytic properties. Recently, a heterogeneous distribution of the residual Ag atoms has been reported for NPG. Based on high-resolution STEM-EDX data, the regions with high content of residual Ag atoms form within the ligament structure and might be the relics of the master alloy during the dealloying processes.15 This has not yet been explored in the case of porous Au rich NPs prepared by dealloying. In addition, the effect of the dealloying parameters on the structure and Ag distribution especially within dealloyed NPs at different sizes is poorly understood to date.
Therefore, this work shows a systematic study of two size groups of Ag rich Ag–Au NPs and uncovers the fine-structure and Ag distribution of dealloyed NPs in dependence of the dealloying parameters for the first time.
Experimental section
Synthesis of carbon supported 77 nm Ag rich AgxAu1−x master nanoparticles (NPs)
77 nm Ag rich AgxAu1−x NPs (0 ≤ x ≤ 1) deposited on carbon black (CB) were prepared by using an impregnation – freeze-drying – annealing route.33,34 All chemicals were used without further purification: 5 wt% Au NPs (15 ± 5 nm) supported on CB (STREM Chemicals, Inc.) and AgNO3 (≥99.9%, p.a., Ultra Quality; Carl Roth). 26 mg of AgNO3 were dissolved in 2 mL of highly purified water (0.055 μS cm−1 at 21 °C). 200 mg of CB supported Au NPs were then added into the aqueous AgNO3 solution (13 g L−1; 76.5 mM). The suspension was mixed and sonicated alternatively each for one minute and a total of five times. The last step of homogenization was the horn-sonication (Branson Digital Sonifier 250d, amplitude of 10%) for 5 minutes. Afterwards, the highly viscous black dispersion was frozen in liquid nitrogen for 15 minutes and freeze-dried (Dieter Piatkowski, Model P10-85) in vacuum (2 × 10⁻² mbar) for 2–3 days. The resulting dried catalyst powder was annealed under 5 vol% H2/95 vol% Ar atmosphere (Air Liquide, purity of 5.0) with a flow rate of 140 NmL min−1 using a three-zone tubular furnace (Carbolite, Model HZS). The temperature–time program consisted of two temperature steps: at 250 °C for 2 hours and at 800 °C for 8 hours each with a heating rate of 10 °C min−1. After 8 hours at 800 °C, the quick cooling procedure was initiated by opening the lid of the tubular furnace.Synthesis and immobilization of oleylamine capped 12 nm Ag rich AgxAu1−x master NPs
Oleylamine capped 12 nm Ag rich AgxAu1−x NPs (0 ≤ x ≤ 1) were synthesized using a one-pot synthetic route35 followed by a washing procedure.36 Chemicals like HAuCl4·3H2O (≥99.9%, trace metal basis; Sigma Aldrich), AgNO3 (≥99.9%, p.a., ultra quality; Carl Roth), oleylamine (technical grade; Sigma Aldrich), 1-octadecene (technical grade; Sigma Aldrich), methanol (HPLC grade, ≥99.8%), and ethanol (absolute, ≥99.8%) were used without additional purification. 680 mg of AgNO3 were dispersed in 20 mL of oleylamine and slowly heated to 100 °C under nitrogen atmosphere to obtain a complete solution. An orange solution of 79 mg HAuCl4 dissolved in a mixture of octadecene and oleylamine (5 mL![[thin space (1/6-em)]](https://www.rsc.org/images/entities/char_2009.gif) :1 mL) was added to the yellow dissolution of AgNO3 in oleylamine (34 g L−1; 200 mM). The color of reaction mixture changed from orange to dark red at 100 °C. The reaction solution was further heated to 120 °C and then stirred for 2 hours under reflux conditions. Afterwards, the heating plate was removed to quickly cool down the reaction solution. Afterwards, the viscous colloidal solution with dark purple, nearly black color was diluted by adding 20 mL of ethanol and centrifuged at 7800 revolutions per minutes (rpm) (7142 relative centrifugal force (rcf)) for 20 min at room temperature. After removing the supernatant solvent, the colloidal NPs were re-dispersed in 20 mL of ethanol and centrifuged at 7800 rpm again. This washing process was repeated twice before the colloidal Ag–Au NPs were re-dispersed in 15 mL of pure hexane and stored at 4 °C under exclusion of daily light.
:1 mL) was added to the yellow dissolution of AgNO3 in oleylamine (34 g L−1; 200 mM). The color of reaction mixture changed from orange to dark red at 100 °C. The reaction solution was further heated to 120 °C and then stirred for 2 hours under reflux conditions. Afterwards, the heating plate was removed to quickly cool down the reaction solution. Afterwards, the viscous colloidal solution with dark purple, nearly black color was diluted by adding 20 mL of ethanol and centrifuged at 7800 revolutions per minutes (rpm) (7142 relative centrifugal force (rcf)) for 20 min at room temperature. After removing the supernatant solvent, the colloidal NPs were re-dispersed in 20 mL of ethanol and centrifuged at 7800 rpm again. This washing process was repeated twice before the colloidal Ag–Au NPs were re-dispersed in 15 mL of pure hexane and stored at 4 °C under exclusion of daily light.
For the immobilization, 31 mg of commercially available carbon black, here Vulcan XC72, were dispersed in a mixture of 3 mL ethanol and 3 mL hexane and sonicated for 15 minutes. 2 mL of the colloidal dispersion in hexane was then added to the carbon dispersion and was sonicated for 2 hours using ultra-sonication bath. Afterwards, the dispersion was stirred at room temperature for around 3 days and subsequently dried in an oven at 80 °C overnight.
Electrochemical dealloying procedure using a thin-film rotating disc electrode (RDE)
All electrochemical experiments were performed in a self-made electrochemical three-compartment glass cell using a potentiostat (SP-300, BioLogic) and a rotator with a control unit (PINE Research Instruments). A three-electrode arrangement with a Pt mesh, a mercury–mercury sulfate (MMS) electrode and a commercial glassy carbon (GC) of a rotating disc electrode (RDE, PINE Research Instruments) was used as counter, reference and working electrode, respectively. The electrodes were spatially separated in the electrochemical glass cell by using glass frits between counter and working electrode. A Luggin–Haber capillary was used to position the reference electrode very close to the working electrode. The electrolyte solution was 0.1 M HClO4 (diluted from triple distillated 70% HClO4, 99.999% trace metal basis, VWR). Dealloying experiments were either performed using a potentiodynamic (cyclic voltammetry, CV) or potentiostatic (chronoamperometry, CA) method at room temperature. All given potentials were converted and are reported in the reversible hydrogen electrode (RHE) scale.5–8 mg of the carbon supported Ag–Au NPs were dispersed in 2 mL of a 1:1 mixture of purified water and 2-propanol (HPLC grade; VWR). After homogenization for 10 minutes, an aliquot of 10 μl of the suspension were dropped onto a GC surface of the RDE (outer diameter of 5 mm) and dried for 20 minutes at 40 °C in air. The calculated Au loading of the resulting homogeneous thin film was 9–14 μgAu cmgeo−2. The GC of the RDE was previously polished with 0.05 μm aluminum oxide powder (Buehler) using a Microcloth polishing cloth (Buehler) for 5 minutes and cleaned in purified water, and 2-propanol using an ultra-sonification bath.
Structural characterization techniques
:Ag ratio via EDX data (AuEDX and AgEDX) given by the eqn (I) and (II). | (I) |
| Agtotal[wt%] = MeTGA[wt%] − Autotal[wt%] | (II) |
Results
Morphology and structure of pristine Ag rich AgxAu1−x master alloy nanoparticles (NPs)
Carbon supported Ag rich AgxAu1−x (0 ≤ x ≤ 1) master alloy NPs with controlled size ranges of 8–12 and 50–80 nm were prepared via two different synthetic routes. Morphology, structure and elemental distribution of these NPs were comprehensively evaluated using high-resolution (S)TEM, EDX, XRD, and XPS techniques.First, we will focus on Ag rich NPs with larger sizes prepared by wet-impregnation – freeze-drying – annealing route. Fig. 1a and b display a TEM micrograph and the respective size distribution of well-dispersed Ag rich AgxAu1−x master alloy NPs supported on carbon. After analyzing more than 200 particles, the mean size was determined to be 77 ± 26 nm. In Fig. S1a of the ESI,† the XRD data shows peakes at 2Θ values of around 38°, 44°, 64°, 77°, and 82°, assigned to the lattice planes (111), (200), (220), (311), and (222) of a face-centered cubic (fcc) unit cell with a space group of Fm![[3 with combining macron]](https://www.rsc.org/images/entities/char_0033_0304.gif) m. Rietveld quantification analysis indicates the formation of a single fcc crystal phase with a crystallite size of 28 ± 1 nm, see Table S1.† Due to the very similar lattice parameters of pure silver and gold, the peak positions cannot be used to establish the composition of the disordered Ag–Au alloy phase according to the Vegard's law.40 Thus, high-resolution STEM-EDX measurements were carried out to obtain detailed information of the elemental distribution within the individual NPs. Fig. 1c displays high-resolution overlaid EDX maps of a representative NP, demonstrating a uniform distribution of both elements and therefore the formation of a homogeneous alloy. The chemical states of Au and Ag surface atoms were evaluated using XPS technique. In Fig. S2,† the deconvoluted Au 4f and Ag 3d XPS data imply the presence of single components. The binding energies (BEs) of 84.0 and 368.2 eV for the Au 4f7/2 and Ag 3d5/2 peaks are in excellent agreement with metallic gold and silver and confirmed by another work.41 No significant contribution of surface oxides is detected for these NPs. Based on the Au 4f7/2 and Ag 3d5/2 XPS data, the chemical composition is 84 at% Ag and 16 at% Au for the large NPs, being very similar to the overall atomic ratio (77 ± 3 at% Ag and 23 ± 3 at% Au via SEM-EDX). It is noted, that only components of the carbon support material were detected by XPS, indicating a surfactant-free surface of the uniform Ag rich master alloy NPs and therefore a complete decomposition of precursor salts after thermal annealing. Based on the composition and size obtained from EDX and TEM data, these large master NPs will be referred to as 77 nm Ag77Au23 NPs throughout the paper.
m. Rietveld quantification analysis indicates the formation of a single fcc crystal phase with a crystallite size of 28 ± 1 nm, see Table S1.† Due to the very similar lattice parameters of pure silver and gold, the peak positions cannot be used to establish the composition of the disordered Ag–Au alloy phase according to the Vegard's law.40 Thus, high-resolution STEM-EDX measurements were carried out to obtain detailed information of the elemental distribution within the individual NPs. Fig. 1c displays high-resolution overlaid EDX maps of a representative NP, demonstrating a uniform distribution of both elements and therefore the formation of a homogeneous alloy. The chemical states of Au and Ag surface atoms were evaluated using XPS technique. In Fig. S2,† the deconvoluted Au 4f and Ag 3d XPS data imply the presence of single components. The binding energies (BEs) of 84.0 and 368.2 eV for the Au 4f7/2 and Ag 3d5/2 peaks are in excellent agreement with metallic gold and silver and confirmed by another work.41 No significant contribution of surface oxides is detected for these NPs. Based on the Au 4f7/2 and Ag 3d5/2 XPS data, the chemical composition is 84 at% Ag and 16 at% Au for the large NPs, being very similar to the overall atomic ratio (77 ± 3 at% Ag and 23 ± 3 at% Au via SEM-EDX). It is noted, that only components of the carbon support material were detected by XPS, indicating a surfactant-free surface of the uniform Ag rich master alloy NPs and therefore a complete decomposition of precursor salts after thermal annealing. Based on the composition and size obtained from EDX and TEM data, these large master NPs will be referred to as 77 nm Ag77Au23 NPs throughout the paper.
 | ||
| Fig. 1 (a and d) Overview TEM images, (b and e) particle size distributions, and (c and f) elemental EDX maps of carbon supported Ag rich Ag–Au master nanoparticles (NPs) with mean sizes of (a–c) 77 ± 26 nm and (d–f) 12 ± 5 nm. | ||
The size distribution of Ag rich NPs prepared by a one-pot synthetic route were analyzed before (not shown) and after immobilization. After immobilization, the mean size of the NPs alters from 11 ± 2 nm (not shown) to 12 ± 5 nm (∼200 particles counted), see Fig. 1e. The broadening of the size distribution can be explained by the appearance of particle agglomeration (see bottom right of the TEM image in Fig. 1d). Fig. S1b† displays the XRD profile of the supported small NPs, implying the formation of a single disordered fcc alloy phase (space group of Fmm) with mean crystallite size of 10 ± 1 nm (Table S1†). Very interestingly, high-resolution STEM-EDX measurements uncover the formation of a core–shell arrangement of the pristine small NPs, as shown in Fig. 1f. Silver on the surface is clearly increased to form a particle shell, while the core of the NP mainly contains gold. Moreover, the Ag enrichment at the particle surface was also confirmed by XPS. In Fig. S2e,† the two silver components show BEs of 368.1 and 367.0 eV for Ag 3d5/2 peaks, which can be assigned to metallic (Ag0) and oxidized (Ag+) silver species reported in the literature.41 In Fig. S2d,† the Au 4f7/2 XPS spectrum shows only one component with a BE of 84.0 eV, which is attributed to metallic gold. The quantification of the Au 4f7/2 and Ag 3d5/2 XPS peaks yields an atomic Ag+:Ag0:Au0 ratio of 20:59:21, being similar to the overall composition of 14 ± 2 at% Au and 86 ± 2 at% Ag obtained from the SEM-EDX. Throughout the manuscript, the small NPs will be referred to as 12 nm Ag86Au14 NPs.
We can conclude, that the 12 nm Ag86Au14 NPs prepared by the one-pot synthetic route show a strong segregation tendency of silver, forming core–shell NPs with a Ag rich shell. In contrast, the wet-impregnation – freeze-drying – annealing route produces homogeneously distributed 77 nm Ag77Au23 NPs. The tendency of Ag segregation for small NPs will be discussed in detail later.
Electrochemical dealloying of carbon supported Ag rich AgxAu1−x nanoparticles (NPs) under potentiodynamic and potentiostatic conditions
Electrochemical dealloying of both size groups of Ag rich Ag–Au master NPs with different atomic arrangements (alloy and core–shell) was performed under either potentiodynamic (cyclic voltammetry, CV) or potentiostatic (chronoamperometry, CA) conditions in Ar-saturated 0.1 M HClO4 at room temperature.For the potentiodynamic dealloying, 16 potential cycles between 0.2 and 1.3 VRHE followed by 4 cycles from 0.2 to 1.6 VRHE at 20 mV s−1 were performed. The latest was used for qualitatively probing the electrochemical Au surface oxidation features of the dealloyed NPs. Low Au loading (29 ± 4 wt% from thermogravimetric analysis (TGA)), large particle size and high capacity of the carbon support material, however, makes it very difficult to establish the electrochemically active surface area (ECSA) of these dealloyed Au rich NPs. Therefore, the Au-OH reduction current peak could not be analyzed, as illustrated for polycrystalline Au surface in Fig. S3.†
Fig. 2a displays the first CV profile (red) of 77 nm Ag77Au23 master NPs, showing a very broad current peak at an onset potential of ∼0.6 VRHE followed by a sharp increase in the current density at ∼1.0 VRHE in the anodic direction. The last one is attributed to the strong dissolution of Ag atoms from the surface of master alloy NPs and is assigned to the critical dealloying potential, Ecrit. It is noted that the initial electrochemical dissolution of a clean silver surface occurs at ∼0.7 VRHE under the same conditions, as shown in Fig. S3.† The shift of the Ecrit to higher anodic values is caused by the alloy formation. No significant changes in the CV profiles during the second (blue), third (black), and 16th (not shown) cycle are observed, indicating that the dealloying process is already completed after the third cycle. The small anodic current peak starting from 1.0 VRHE is very likely related to carbon corrosion (compare the CV profile of pure carbon, see Fig. S4a†). As the potential cycling up to 1.2 VRHE does not expose the characteristic features of an Au rich surface, we increased the upper vertex potential up to 1.6 VRHE to probe the formation and reduction of Au–O monolayer. Fig. S5a† shows a small reduction current peak for the Au–O monolayer at ∼1.2 VRHE (filled with turquoise), signifying the formation of a passivation layer for the initial 77 nm dealloyed NPs. It is noted that the anodic current is much larger than the Au–O reduction peak due to the concomitant carbon corrosion in the same potential range.
 | ||
| Fig. 2 (a and c) Cyclic voltammetry (CV) and (b and d) chronoamperometry (CA) profiles of the as-prepared Ag rich (a and b) 77 ± 26 nm Ag77Au23 NPs and (c and d) 12 ± 5 nm Ag86Au14 NPs. The CV profiles were recorded between 0.2–1.3 VRHE at 20 mV s−1, while the CA experiments were carried out at 0.9, 1.2, and 1.6 VRHE each for 15 minutes in Ar-saturated 0.1 M HClO4 at room temperature. | ||
Under potentiostatic (chronoamperometry, CA) dealloying conditions, the current–time profiles for the pristine 77 nm Ag77Au23 master alloy NPs were recorded at three different potentials (0.9, 1.2, and 1.6 VRHE in blue, red and black line, respectively) and displayed in Fig. 2b. It is obvious that the Ag depletion from the 77 nm master alloy NPs is more pronounced with increasing potential during the CA experiments. Generally, the measured current is a result from a faradaic process which is occurring at the electrode–electrolyte interface as a function of time, namely the electrochemical Ag dissolution from the NP surface. Thus, the integrated current–time profiles reflect the electric charge for the Ag dissolution as a function of the applied potential. As a complementary method, the EDX data provides information about the Ag loss within the NPs. The results are summarized in Fig. S6 and Table S2.† The potential at 0.9 VRHE was selected because it is above the dissolution potential of pure silver and below the Ecrit for Ag rich Ag–Au master alloy NPs as recorded in the CV profile (Fig. 2a). After holding the potential at 0.9 VRHE for 15 minutes, the Ag content of the initial 77 nm NPs alters from 77 ± 3 at% to 66 ± 3 at%. The estimated Ag loss is 14 ± 7 at% from the EDX data and 7 ± 2 at% from the electric charge, as shown in Table S3 and Fig. S6.† Further potential increase up to 1.2 VRHE leads to a moderate loss of Ag atoms (28 ± 2 at% from the charge and 18 ± 14 at% from the EDX). We can point out that the applied potentials up to 1.2 VRHE cause a rather fast Au passivation layer to protect the 77 nm NPs against massive Ag dissolution.
It is noted, that the carbon corrosion associated with particle detachment cannot be excluded at high applied potentials. Based on this fact, the EDX results are more reliable, when the dealloying was performed above 1.0 VRHE. Fig. S6† illustrates the relative Ag loss of around 80% after applying a potential of 1.6 VRHE for 15 min, which is significantly higher than at 1.2 VRHE. Interestingly, only intermediate potentials higher than 1.5 VRHE show a strong Ag depletion for 77 nm NPs. Below this critical dealloying potential, the quick formation of the Au passivation layer clearly dominates. We can sum up that the potentiostatic dealloying requires higher anodic potentials to overcome the Au passivation layer than the potentiodynamic approach.
Fig. 2c and d display the electrochemical dealloying behaviors of 12 nm Ag86Au14 master NPs under steady-state and dynamic conditions in Ar-saturated 0.1 M HClO4 at room temperature. During the potentiodynamic experiment, the first CV profile (red line) exhibits multiple oxidation processes at ∼0.6, 0.9, and 1.1 VRHE which can be ascribed to pure Ag dissolution (compare with Fig. S3†), and alloyed Ag atoms incorporated in the Au lattice to different extents. The first increase of the anodic current at ∼0.6 VRHE is clearly related to the dissolution of Ag atoms in an Ag rich environment, e.g., from the particle shell. The subsequent peaks at 0.9 and 1.1 VRHE are more complex, because the Ag atoms are alloyed in an Au rich environment and thus their dissolution potential is strongly shifted due to electronic interactions of dissimilar atoms. The extent of the shift of the Ag dissolution potential depends on the concentration of the neighboring Au atoms, i.e., the more gold atoms neighboring silver atoms, the more the potential is shifted.
In the backward direction, a broad current peak is observed starting from 0.5 VRHE, which is very likely related to the Ag re-deposition from the electrolyte solution. The re-deposited Ag atoms are electrochemically re-dissolved between 0.7–0.8 VRHE in the anodic scan of the second cycle (blue line, Fig. 2c). The electric charges of the silver re-deposition (first cycle, in red) and dissolution (second cycle, in blue) are very similar (ca. 0.3 mA s). The dissolution/re-deposition of Ag surface atoms, however, becomes more and more irreversible and is already neglectable in the third scan (black line, Fig. 2c). Afterwards, the CV profiles are unchanged, resulting in a steady-state condition of the dealloying process. Fig. S5b† shows the enrichment of Au surface atoms by detecting the Au–O reduction peak (turquoise) of the CV profile. Again, the formation of Au–O at ∼1.3 VRHE is strongly superimposed with the carbon corrosion.
Fig. 2d displays the CA profiles of 12 nm Ag86Au14 master NPs at three different potentials, analog to the previous steady-state dealloying experiments for large NPs. It is noted that the first applied holding potential was clearly above the Ecrit of ∼0.6 VRHE detected from the first CV profile (red, Fig. 2c). The measured current over time at 0.9 VRHE is very small, which is attributed to a low Ag dissolution rate. This observation is also confirmed by the compositional analysis of the dealloyed NPs, listed in Table S2.† It is noted that the Ag loss was established from the STEM-EDX measurements of single dealloyed NPs. This method suffers from poor statistics and is therefore more prone to error. Such a method is limited with the information obtained, as it focuses on individual particles rather than averaging over a population. Despite the inherently poor statistics, a general trend can be seen, i.e., as the potential of the CA method increases, the content of Ag within the particles decreases. After dealloying at 0.9 VRHE for 15 min, the residual Ag content dropped from 86 ± 2 to 60 ± 7 at% obtained from EDX (Fig. S6b and Tables S2, S3†). We explained the discrepancy between the Ag loss calculated from EDX (31 ± 9 at%) and charge (12 ± 4 at%) by the fact, that the STEM-EDX measurements were conducted from dealloyed individual NPs and can locally differ from the overall composition. At 1.2 VRHE for 15 min (red, Fig. 2d), a decrease of the Ag content by 53 ± 21 at% (charge) and 43 ± 10 at% (EDX) is observed. The residual Ag content via STEM-EDX decreases to 19 ± 8 at% (loss of 78 ± 11 at%, Fig. S6†) at 1.6 VRHE. The measured charge from these CA experiments above 1.2 VRHE is not calculated due to the favored carbon corrosion. Altogether, we can sum up, that the Ag dissolution rate for smaller NPs is enhanced than for larger NPs at the same potential of the CA protocol, which will be discussed later.
Morphology and chemical state of 12 and 77 nm Ag rich master NPs dealloyed under dynamic and steady-state conditions
In Fig. S7a,† the overview TEM image of the 77 nm Ag77Au23 master alloy NPs shows no changes in the structure and size (20 NPs analyzed) after applying 0.9 VRHE for 15 min. At 1.2 VRHE, the majority of the dealloyed NPs are still dense and solid with the mean size of 73 ± 25 nm (100 NPs counted). Only few dealloyed NPs exhibit a pore evolution and size shrinkage from 77 ± 26 to 50 ± 10 nm, see Fig. S7b and c.† However, after dealloying at 1.6 VRHE for 15 minutes the TEM image shows porous NPs with a smaller size of 57 ± 17 nm (80 NPs counted), see Fig. S7d.† Obviously, the Au passivation layer at lower holding potentials protects the underlying Ag atoms from dissolution. More interestingly, the potentiodynamic dealloying experiment up to 1.3 VRHE leads to a majority of porous NPs with 60 ± 20 nm size (100 NPs analyzed), see Fig. S7f and g.†The effect of the dealloying protocol on the chemical state of both elements within the NP surface was also evaluated by XPS. In Fig. S8,† the analysis of either Au 4f or Ag 3d XPS spectra indicates the presence of a single component irrespective of the dealloying method. The BE of Au 4f7/2 was determined to be 83.8 eV for both potentiodynamically and potentiostatically dealloyed NPs, which is in excellent agreement with metallic gold.41 Only slightly lower BE values for Ag 3d5/2 (∼367.6 eV) were obtained compared to metallic silver,37 which is very likely attributed to the Au neighboring atoms. The quantification of the Au 4f7/2 and Ag 3d5/2 XPS peaks yields to Ag:Au ratio of 24:76 and is similar to the results from EDX in the respective error range (Table S2†). Moreover, the absence of Ag oxide species confirms the formation of Au passivation layer to protect the residual Ag atoms against dissolution and air-oxidation.
Fig. S9† illustrates the morphology and size distribution of initial 12 nm Ag rich Ag86Au14 master NPs after potentiodynamic and potentiostatic dealloying experiments. Independent of the dealloying method, the electrochemically treated NPs are still dense and solid and show a gradual shrinkage in size (from ∼12 to 9–10 nm, see Fig. S9†). In addition, particle coalescence is observed in several TEM images due to the carbon corrosion. We want to stress that an individual NP with ∼18 nm size dealloyed under potentiodynamic conditions shows the pore evolution, see Fig. S10.† This dealloyed Ag–Au NP is among the smallest, where the formation of stable pore(s) is observed in our study and have been even published in the literature.20,21
Due to the similar Ag losses (Table S2†), we now compare the composition and morphology of initial 12 nm Ag rich Ag86Au14 NPs after the potentiodynamic and potentiostatic (1.6 VRHE) protocols with each other. Fig. 3 shows the high-resolution Au 4f and Ag 3d XPS spectra of initial 12 nm Ag86Au14 NPs dealloyed via CV, indicating the appearance of only single Au and Ag components. The BEs were determined to be 83.6 eV for Au 4f7/2 and 367.5 eV for Ag 3d5/2, which can be ascribed to the corresponding metal compounds.41 The Au 4f7/2 and Ag 3d5/2 XPS peaks were used for quantification and yielded atomic Ag:Au ratio of 21:79, which is in very good agreement with the EDX data (Ag 17 ± 8 at% and Au 83 ± 8 at%). More importantly, the XPS data shows the absence of Ag oxide at the surface of the dealloyed NPs. This fact is opposite to the initial structure, namely core–shell NPs with Ag (oxide) particle shell, as demonstrated in Fig. 1f.
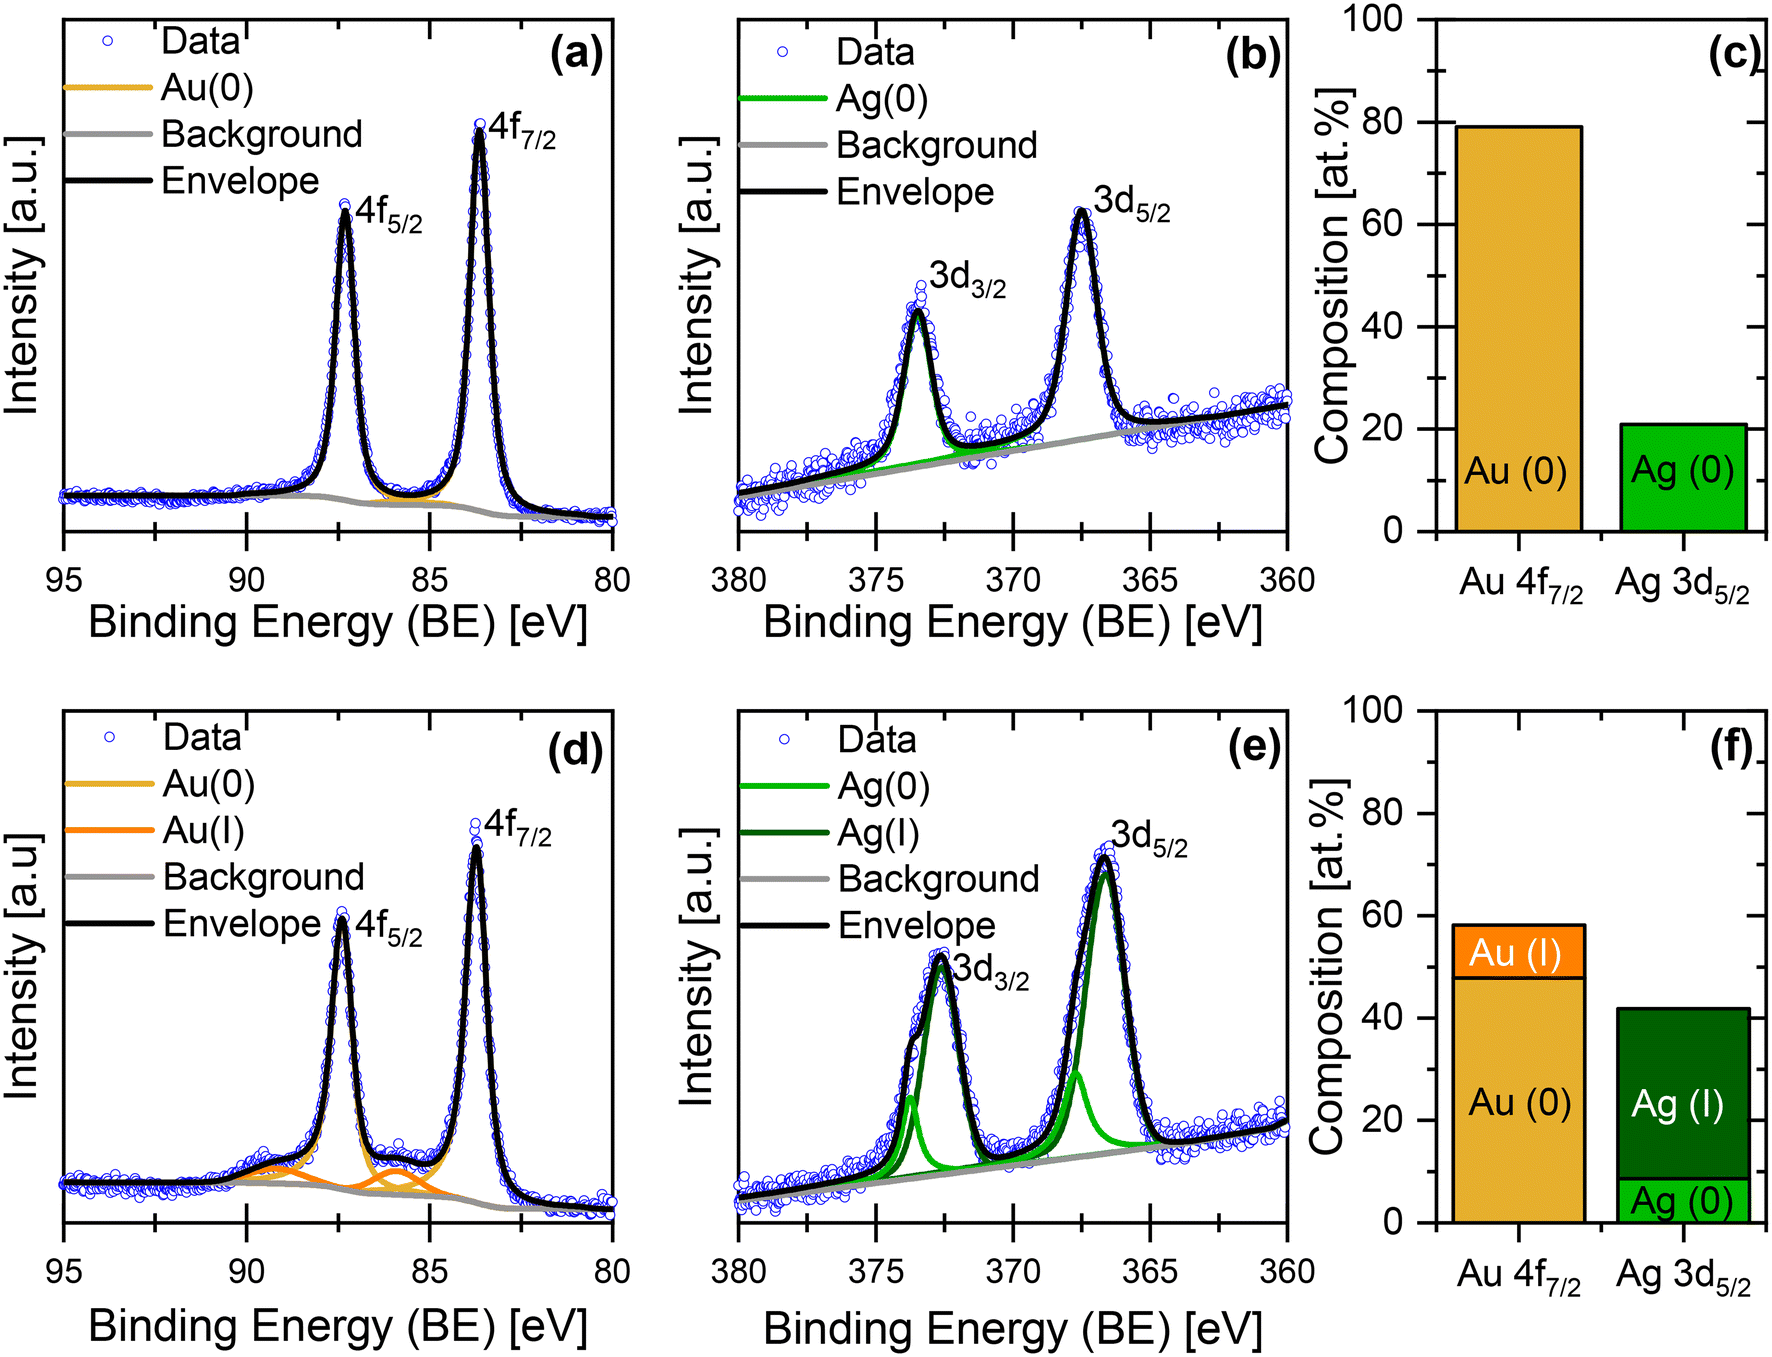 | ||
| Fig. 3 High-resolution (a and d) Au 4f and (b and e) Ag 3d XPS spectra of the initial 12 nm Ag rich Ag86Au14 NPs dealloyed under (a–c) potentiodynamic and (d–f) potentiostatic (at 1.6 VRHE) conditions. Blue circles represent the measured data, while the calculated fits of metallic and oxidized Au and Ag components, background and the envelope are denoted in yellow/orange, light/dark green, grey, and black, respectively. (c and f) Quantity and distribution of the chemical species obtained from the Au 4f7/2 and Ag 3d5/2 XPS data. | ||
In Fig. 3, the Au 4f and Ag 3d XPS spectra of potentiostatically (1.6 VRHE) dealloyed 12 nm NPs indicate the formation of more than one component for each metal. From the Au 4f7/2 XPS peak analysis, the resulting BEs of 83.7 eV and 85.5 eV can be assigned to metallic and oxidized Au surface species, respectively.41 The deconvolution of 3d5/2 Ag XPS peak leads to BEs of 366.7 and 367.7 eV, which is attributed to oxidized and metallic Ag surface species.41 Overall, the XPS quantification shows ca. 48 at% Au0, 10 at% Au2+, 9 at% Ag0 and 33 at% Ag+. It is obvious that the residual silver within the dealloyed 12 nm NPs is strongly oxidized and located at the particle surface. It is noted that the composition obtained from XPS and EDX (XPS: 42 at% Ag//EDX: 19 ± 8 at% Ag) strongly differs from each other due to the different measuring principles and information content of both techniques.
To better understand the formation of a Ag oxide surface, additional electrochemical studies were conducted. Fig. S11 and S12† illustrate the current–time profiles of 12 and 77 nm master NPs at 1.6 VRHE for 15 min and the subsequent CV profiles in a fresh electrolyte. For the initial 12 nm dealloyed NPs, the CV profile (Fig. S11b†) signifies the strong dissolution of pure Ag at 0.8 VRHE in spite of the pre-formation of Au passivation layer. In the same experiment, the initial 77 nm dealloyed NPs exhibit a thicker Au passivation layer and thus prevent the dissolution of Ag atoms in the sub-surface layers, see Fig. S12b.†
In summary, the 77 nm Ag77Au23 master alloy NPs show pore evolution after both potentiodynamic and potentiostatic (at 1.6 VRHE) dealloying protocols. The XPS data reveals the presence of metallic Ag and Au species. In contrast, no pore formation is observed for initial 12 nm Ag86Au14 master NPs with a Ag rich shell irrespective of the dealloying conditions. Interestingly, the XPS analysis shows the appearance of oxidized Ag species only after the chronoamperometric dealloying at 1.6 VRHE, indicating an Ag enrichment at the particle surface. In case of the potentiodynamic dealloying, metallic silver is mainly located at the particle core. This observation signifies the formation of different Au passivation thicknesses depending on the dealloying method.
Influence of potentiodynamic and potentiostatic dealloying on the fine structure of initial 77 nm and 12 nm Ag rich Ag–Au master NPs
In Fig. 4a, a HAADF-STEM micrograph of a representative initial 77 nm Ag77Au23 NP dealloyed under potentiodynamic conditions shows the formation of a pore–ligament structure with ligament size of 5–10 nm. The contrast of the HAADF-STEM image correlates with both the material thickness as well as the atomic number (Z) of the containing elements (Z = 47 for Ag, Z = 79 for Au). As a guide to the eye, a yellow circle denotes one of the dark regions within the dealloyed NP, see Fig. 4a. This observation is more visible by investigating the intensity profile of this NP along the line scan, showing a minimum at ∼12 nm, see Fig. 4c. Very interestingly, the overlaid EDX maps highlight an inhomogeneous distribution of Ag atoms within the dealloyed Au rich NP, see Fig. 4b. The local enrichment of Ag atoms is visualized by the green regions, that are mainly located near the particle edges or pores. Now, the intensity minimum at ∼12 nm along the scan direction can be clearly linked with the Ag enrichment, as detected from the EDX mapping and line scan, see Fig. 4b and d. More precisely, we observed a significant increase of the Ag content up to 38 at% in the green regions of the NP, while the residual part of the NP shows much lower Ag content of around 12–20 at%. The latest is similar to the overall composition of particle ensemble (11 at% Ag and 89 at% Au via EDX) in the respective error range. It is important to note here, that 38 at% Ag correspond to an average value along the electron beam direction as two-dimensional projection images were measured. For this reason, the local Ag concentration can be even higher.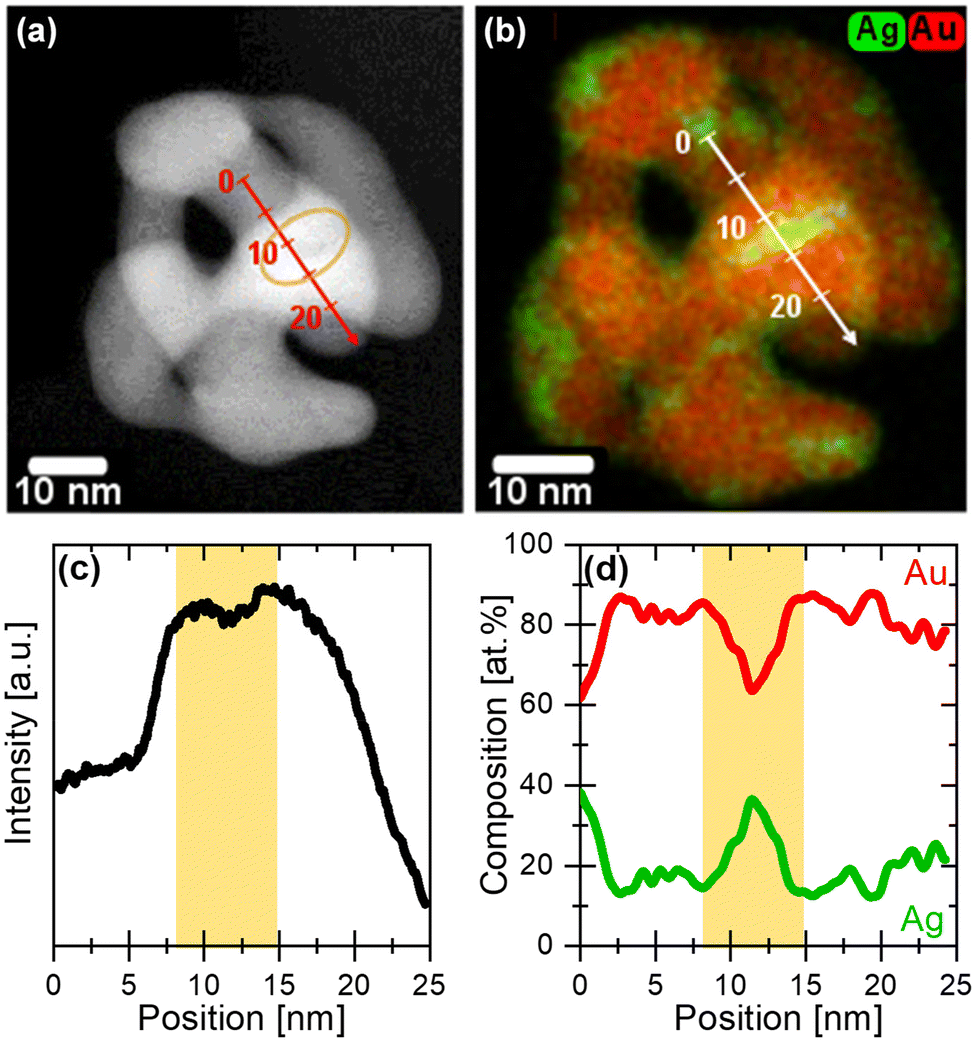 | ||
| Fig. 4 (a) HAADF-STEM micrograph, (b) overlaid EDX maps, and (c and d) corresponding line scans of the initial 77 nm Ag77Au23 NP dealloyed under potentiodynamic conditions. (c and d) The yellow background of the line scan indicates the intensity minimum, which is strongly linked with the Ag enrichment as detected by the EDX data (Ag in green, Au in red). The direction of both intensity and EDX line scans are denoted with the white and red arrows including a linear scale, respectively. | ||
Fig. 5 displays a HAADF-STEM micrograph of an initial 77 nm NP dealloyed after holding the potential at 1.6 VRHE for 15 min. The pore size of this NP is around 5 nm, while the ligament size ranges from 4 to 10 nm. The dark regions within the NP, which are denoted with blue arrows could be attributed to Ag rich regions. In Fig. 5b and c, the overlaid EDX maps and the respective EDX line scans uncover the inhomogeneous distribution of both elements within the dealloyed NP. Again, we observed the appearance of several Ag rich regions located at the particle edges and/or pores. In these regions, the Ag content rises up to 45 at% in projection, while the overall composition of this single NP is only 9 at% Ag and 91 at% Au.
 | ||
| Fig. 5 (a) HAADF-STEM image, (b) overlaid EDX maps, and (c) corresponding EDX line scan of an initial 77 ± 26 nm Ag77Au23 NP dealloyed using chronoamperometric method at 1.6 VRHE. The blue arrows in the HAADF-STEM image denote some darker contrast regions within the dealloyed NP. In the EDX maps and line scan, silver and gold are colored in green and red, respectively. White arrow visualizes the direction of the EDX line scan with a linear scale. (c) As a guide to the eye, the pore regions with an Ag enrichment are highlighted in yellow background. | ||
Additional particles dealloyed with both electrochemical methods were investigated by using the HAADF-STEM-EDX technique, see Fig. S13.† Obviously, the EDX maps of these dealloyed NPs with complex interconnected pore and ligament structure point out the appearance of Ag-enriched regions near the pores and particle edges irrespective of the electrochemical dealloying method, when the critical potential Ecrit is exceeded. The massive Ag dissolution takes place at Ecrit of 1.0 VRHEvia potentiodynamic (CV) method, while in the potentiostatic (CA) the Ecrit is significantly shifted to higher anodic values (>1.5 VRHE). This observation highlights that the dealloying process and pore–ligament formation is solely kinetically controlled. The formation of Ag rich regions and their spatial location, e.g. in the bulk or at the surface will be discussed in detail later.
Analogous to the large particles, Fig. 6 shows a direct comparison of the HAADF-STEM micrographs and the corresponding intensity line profiles of the initial 12 nm Ag86Au14 NPs dealloyed under potentiodynamic and potentiostatic (1.6 VRHE) conditions. Very interestingly, no differences in the particle structure and composition independent from the dealloying protocol is observed. Fig. 6c displays the overlaid EDX maps of a representative 12 nm NP after potentiodynamic dealloying. Obviously, the dealloyed NP shows a uniform elemental distribution with a residual Ag content of 17 at%. In contrast, the potentiostatic dealloying at 1.6 VRHE leads to Ag enrichment at the particle surface, denoted with blue arrows in Fig. 6f. The Ag enrichment is also supported by the surface-sensitive XPS technique, where the appearance of Ag oxide surface species was detected, see Fig. 3e. This observation is very likely related to the formation of different Au passivation thicknesses during the electrochemical dealloying protocols (dynamic vs. steady-state), which will be discussed later.
 | ||
| Fig. 6 (a and d) HAADF-STEM micrographs, (b and e) corresponding line intensity profiles and (c and f) overlaid EDX maps of the initial 12 ± 5 nm Ag86Au14 NPs dealloyed under (a–c) potentiodynamic and (d–f) potentiostatic (at 1.6 VRHE) conditions. The EDX quantification of the single NPs shows (c) 17 at% Ag: 83 at% Au; (f) particle 1: 15 at% Ag: 85 at% Au; particle 2: 17 at% Ag: 83 at% Au; particle 3 and 4: 10 at% Ag: 90 at% Au. (f) Blue arrows denote the Ag-enriched regions in the overlaid EDX maps. | ||
Altogether, we can conclude that no significant differences in the fine-structure and elemental distribution of initial 77 nm Ag rich Ag77Au23 NPs dealloyed under either potentiodynamic (up to 1.3 VRHE) or potentiostatic (1.6 VRHE) conditions could be identified, when the critical potential, Ecrit (CV: >1.0 VRHE//CA: >1.5 VRHE) is exceeded. For both dealloying protocols, the dominant structural particle motif is the formation of numerous Ag rich regions within the Au rich NPs that are mainly located at the particle edges and/or pores. However, these findings are not in line with the initial 12 nm Ag86Au14 NPs dealloyed under similar conditions. Potentiodynamic dealloying leads to a rather homogenous elemental distribution of the initial Au rich core–Ag rich shell NPs, while the Ag surface enrichment largely remains despite the potentiostatic dealloying at 1.6 VRHE. Since the EDX maps are not atomically resolved and the Au features can be still detected by the surface-sensitive CV technique, we suggest that the Au passivation layer consists of only a few atomic layers for the potentiostatically dealloyed 12 nm Ag86Au14 master NPs.
Discussion
This comprehensive study shows the impact of particle size and dealloying method on the structure and elemental distribution of Ag rich Ag–Au master NPs. 77 nm Ag77Au23 master alloy NPs with homogeneous distribution were prepared by the wet-impregnation process, while the one-pot route was used to synthesize 12 nm Ag86Au14 NPs with an Ag/Ag oxide rich particle shell. Dealloying methods vary between cyclic voltammetry (CV, 0.2–1.3 VRHE with 16 cycles at 20 mV s−1) and chronoamperometry (CA) by holding the potential at 0.9, 1.2, and 1.6 VRHE for 15 min. As electrolyte solution used, perchlorates are known as weakly adsorbed anions.Dealloying process is a critical interplay between the dissolution rates of the less noble metal and the surface diffusion rates of the remaining noble metal. Fig. 7 illustrates a simplified schematic to visualize the structure and elemental distribution within the NPs as a function of the particle size and dealloying method. In case of the initial 77 nm Ag77Au23 master alloy NPs, both dealloying protocols evolve the formation of pore–ligament structure. The pore evolution, however, is observed in different extends. Here, the CV profiles between 0.2–1.3 VRHE achieved steady-state conditions already after the first cycle, indicating that the dealloying process is finished. Tschulik and coworkers have reported that steady-state CV profiles cannot be used as a measure to ascribe the completion of dealloying processes.21 However, an increase of the upper vertex potential up to 1.6 VRHE to uncover the electrochemical Au features shows no further Ag dissolution, see Fig. S5.† Generally, porosity can only be formed, when the dealloying process occurs above the critical potential, Ecrit.22,23 For the potentiodynamic method, the Ecrit was determined to be at ∼1.0 VRHE, while the potentiostatic dealloying leads to a shift of Ecrit towards >1.5 VRHE. Below the Ecrit, the large NPs quickly form an Au passivation layer to prevent the Ag dissolution in the sub-surface layers. Since the same master alloy NPs were investigated in this work, the critical potential is not affected by the composition, but by the dealloying method. Thus, the shift of the Ecrit by holding the potential constant is attributed to the changes in the surface diffusion rates of the remaining noble metal atoms. For instance, the formation of oxide or the presence of adsorbed oxygen can reduce the surface mobility of the noble metal.42,43 Even though the formation of an adsorbed OH monolayer on the Au surface is detected at 1.2–1.3 VRHE during the anodic scan of the CV profile (see Fig. S5†), low-coordinated Au surface atoms already form OH species at lower anodic potentials. The adsorbed OH species on the low-coordinated Au surface atoms can be electrochemically stable and reduce the mobility of surface atoms. As a consequence, the Ecrit is shifted to higher values, where a steady-state Ag dissolution current at constant potential is measured.
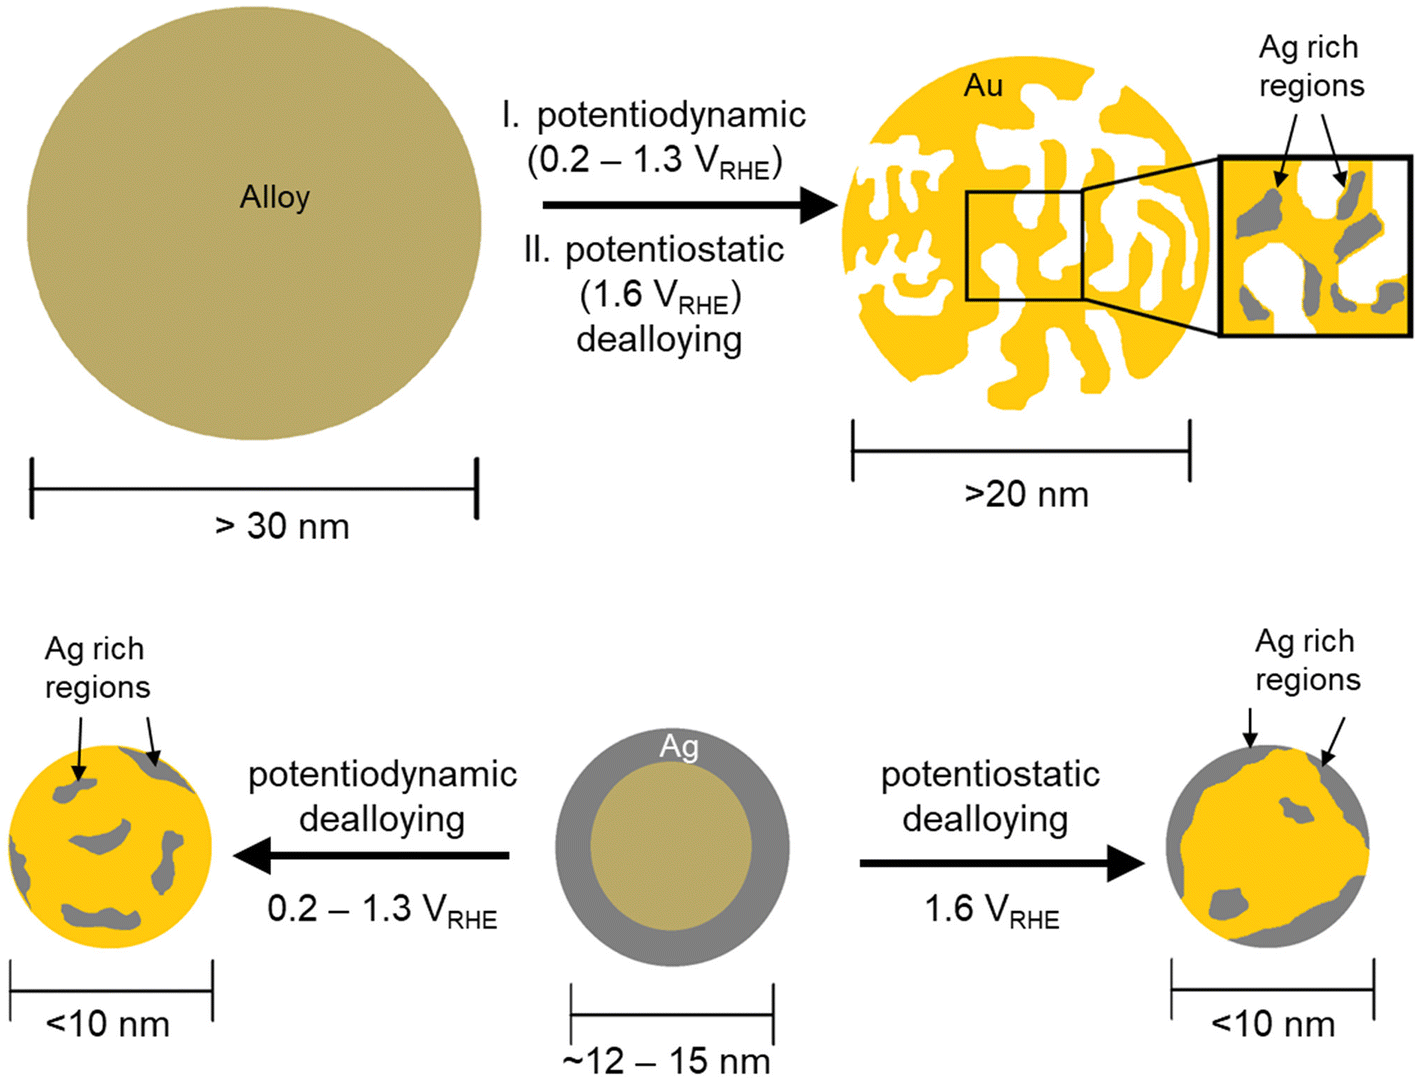 | ||
| Fig. 7 Schematic representation of the morphological and chemical changes of different particle sizes of Ag rich Ag–Au master NPs after applying different potentiodynamic and potentiostatic dealloying methods. | ||
When the Ecrit is exceeded (CV: >1.0 VRHE//CA: >1.5 VRHE), the pore–ligament structure prevails. In this work, the smallest size of porous NPs is observed for 18 nm, which seems to be the critical particle size for pore evolution. This observation is in agreement with the work of Sieradzki et al.,20 where a critical particle size of 12–24 nm proposed for pore evolution. Very interestingly, the residual Ag atoms are inhomogeneously distributed within the porous NPs. Numerous Ag-enriched regions form and are located near the pores and particle edges. At least one monolayer of the passivating gold is needed to protect the Ag rich regions from dissolution. We believe that these trapped Ag rich regions are relics from the master alloy. Similar observations were reported for bulk nanoporous gold by using the STEM-EDX technique, where the residual silver is mainly found in “Ag rich regions”.15 Due to the missing 3D reconstruction of the STEM-EDX data, it is very difficult to distinguish the Ag rich regions from bulk and surface. Surface-sensitive XPS investigations on bulk nanoporous gold showed a higher residual Ag content compared to the EDX data, which is ascribed to the accumulation of the Ag atoms near the ligament surface.8
In Fig. 7, the effect of the particle size on the dealloying process is illustrated for 12 nm Ag86Au14 master NPs. Pore evolution of the initial 12 nm NPs is not observed with either the potentiodynamic or the potentiostatic dealloying method. The dealloyed NPs are still dense and show a size shrinkage from 12 nm to 9–10 nm. It is obvious that the particle size is too small to stabilize a pore of ∼5 nm. On the other hand, smaller NPs tend to form a very quick passivation layer of the remaining noble metal. In this work, we observed that the formation of Ag rich core–Au rich shell arrangement is not the dominant particle motif. Based on our findings, the distribution of the residual Ag atoms depends on the applied dealloying method. Potentiodynamic dealloying leads to a homogenous distribution of the residual Ag, while for the potentiostatic dealloying at 1.6 VRHE the residual Ag atoms prefer to enrich the particle surface.
First, we observed a complex dealloying behavior with several oxidation current peaks during the CV measurement between 0.2–1.3 VRHE. This can be explained by the different environments of Ag and Au surface atoms. Since the appearance of a silver (oxide) surface was demonstrated using STEM-EDX and XPS techniques, the first oxidation current is assigned to pure Ag dissolution. The oxidation current peaks, that follow it, are attributed to Ag atoms surrounded by Au atoms. As the anodic potential increases, the underlying Ag atoms which are alloyed in an Au rich environment begin to dissolve. The shift of the dissolution potential of Ag atoms is related to the concentration of the neighboring Au atoms. In case of homogeneous alloy NPs with similar initial size and composition, the surface-sensitive CV method would show only a simple dissolution current peak shifted to higher anodic potentials compared to the redox potential of Ag/Ag+. The shift in the dissolution potential is due to the electronic interactions of Ag atoms with the directly neighboring Au atoms. Both atomic arrangements (core–shell vs. homogeneous alloy) for small NPs result in a quick formation of an Au passivation layer. If a critical concentration of less noble metal is present on the surface, the size effect predominates over the atomic arrangement of the dissimilar atoms (core–shell vs. homogeneous alloy) for small NPs. This is based on the high mobility of low-coordinated Au surface atoms, which hinder the gradual dissolution of internal Ag atoms from the particle core. Our results reveal that the extent to which the Au passivation layer is formed for similar initial particle size and composition strongly depends on the dealloying method.
Although the composition differs from the larger NPs, smaller particles are less electrochemically stable and tend to dissolve at lower anodic potentials according to the Gibbs–Thomson effect.25 Therefore, the Ecrit is shifted to lower anodic potentials during the CV dealloying compared to that for larger NPs. Consistent with the observed trend between particle size and Ag dissolution, the CA dealloying experiments demonstrate a higher Ag loss at lower anodic potentials compared to larger NPs. Secondly, the formation and thickness of a very quick Au passivation layer seems to be differently pronounced. Only for the potentiostatic dealloying the appearance of Ag oxide was detected by surface-sensitive XPS, implying a very thin Au passivation layer. Since both samples were in contact with air during the transportation and transfer to the electron microscope, an adsorbate-induced segregation of Ag atoms to the particle surface might occur. Theoretical studies from Tang et al.44 and Chen et al.45 demonstrated that silver tends to segregate to the surface of AgAu NPs and preferentially to the particle edges. Lower surface energy and higher electrophilic properties of silver and the formation of Ag oxides can be the driving force for segregation processes. It is expected that the tendency of Ag segregation is affected for small NPs independent of the dealloying method. Based on the results from STEM-EDX and XPS, a surface enrichment of silver is, however, only observed, when the 12 nm NPs were potentiostatically dealloyed. Additional electrochemical control investigations on potentiostatically dealloyed NPs show the re-enrichment of Ag atoms on the surface detected by the dissolution current peak, in Fig. S11.† An explanation could be the variation in the thickness of the Au passivation layer and its stability of these dealloyed NPs to different extents. Thereby, the surface mobility of the remaining Au atoms plays an important role and is reduced by forming adsorbed OH species at high anodic potential, which has an effect on the critical dealloying potential.
Conclusion
This work shows a systematic study of two size groups of Ag rich Ag–Au NPs in dependence of the dealloying methods (potentiodynamic vs. potentiostatic) and correlates these findings with the resulting structure and distribution of the residual Ag atoms. 77 ± 26 nm Ag77Au23 master alloy NPs were prepared by wet-impregnation route, while a two-step colloidal route was applied for the synthesis of 12 ± 5 nm Ag86Au14 master NPs. The elemental distribution within the 77 nm NPs is very homogenous, while 12 nm NPs show the formation of an Ag/Ag2O rich particle shell. Irrespective of the dealloying protocols (CV: 0.2–1.3 VRHE//CA: 1.6 VRHE), the formation of pore–ligament structure is observed for 77 nm master alloy NPs. Only the critical dealloying potential is shifted to more anodic potentials using the steady-state method. The EDX mapping uncovers the spatial distribution of the residual Ag atoms, pointing out that the Ag rich regions form near the pores and particle edges after both dealloying methods. In case of 12 nm Ag86Au14 NPs with a Ag/Ag2O rich shell, a stable pore could not be formed. However, the nano-sizing leads to a higher electrochemical instability of these Ag–Au NPs. More precisely, the critical dealloying potential is significantly shifted to lower anodic potentials due to the size effects and Ag segregation. Apart from the enhanced Ag losses, the quick passivation of Au surface atoms occurs and hinders the further dissolution of underlying Ag atoms. Based on the STEM-EDX data, the potentiodynamic dealloying shows a homogenous distribution of the residual Ag atoms within the Au rich NPs, while the residual Ag atoms are mainly located near/at the particle surface after potentiostatic dealloying. We assume that the Ag re-enrichment is caused by adsorbate-induced Ag segregation after the exposure to air. Therefore, the thickness of the passivation layer strongly depends on the dealloying method. Altogether, we show that the mobility of Au surface atoms and dealloying conditions control the structure and residual Ag distribution within the dealloyed NPs.Author contributions
A. D. performed the synthesis and electrochemical experiments. A. D. and M. Oe. planned the research and wrote the manuscript. A. D., P. P. and C. M. collected and analyzed the (S)-TEM EDX data. C. D. collected the XPS data. M. Oe., A. R., C. D. and M. H. advised in data analysis and discussion. All authors approved the final version of the manuscript.Conflicts of interest
The authors declare no competing financial interest.Acknowledgements
Financial support of Deutsche Forschungsgemeinschaft (DFG) through the Research unit FOR 2213 “Nanoporous Gold – A Prototype for a Rational Catalyst Design”, within the subproject OE610/1-1 (A. Dworzak and M. Oezaslan) as well as the subproject RO-2057/12-2 (A. Rosenauer and C. Mahr) is gratefully acknowledged. Financial support from the Federal Ministry of Education and Research (BMBF, FKZ 03SF0539) is gratefully acknowledged. We also thank the DFG for funding the JEOL JEM2100F TEM (INST 184/106-1 FUGG), ESCALAB 250 Xi XPS spectrometer (INST 184/144-1 FUGG), and Empyrean Theta-Theta diffractometer Panalytical (INST 184/154-1 FUGG).References
- V. Zielasek, B. Jürgens, C. Schulz, J. Biener, M. M. Biener, A. V. Hamza and M. Bäumer, Gold Catalysts: Nanoporous Gold Foams, Angew. Chem., Int. Ed., 2006, 45, 8241–8244 CrossRef CAS PubMed.
- A. Wittstock and M. Bäumer, Catalysis By Unsupported Skeletal Gold Catalysts, Acc. Chem. Res., 2014, 47, 731–739 CrossRef CAS PubMed.
- G. Wittstock, M. Bäumer, W. Dononelli, T. Klüner, L. Lührs, C. Mahr, L. V. Moskaleva, M. Oezaslan, T. Risse, A. Rosenauer, A. Staubitz, J. Weissmüller and A. Wittstock, Nanoporous Gold: From Structure Evolution To Functional Properties In Catalysis And Electrochemistry, Chem. Rev., 2023, 123, 6716–6792 CrossRef CAS PubMed.
- A. Lackmann, C. Mahr, M. Schowalter, L. Fitzek, J. Weissmüller, A. Rosenauer and A. Wittstock, A Comparative Study Of Alcohol Oxidation Over Nanoporous Gold In Gas And Liquid Phase, J. Catal., 2017, 353, 99–106 CrossRef CAS.
- A. Wittstock, A. Wichmann, J. Biener and M. Bäumer, Nanoporous Gold: A New Gold Catalyst With Tunable Properties, Faraday Discuss., 2011, 152, 87–98 RSC ; discussion 99–120.
- A. Wittstock, V. Zielasek, J. Biener, C. M. Friend and M. Bäumer, Nanoporous Gold Catalysts For Selective Gas-Phase Oxidative Coupling Of Methanol At Low Temperature, Science, 2010, 327, 319–322 CrossRef CAS PubMed.
- K. M. Kosuda, A. Wittstock, C. M. Friend and M. Bäumer, Oxygen-Mediated Coupling Of Alcohols Over Nanoporous Gold Catalysts At Ambient Pressures, Angew. Chem., Int. Ed., 2012, 51, 1698–1701 CrossRef CAS PubMed.
- M. Graf, M. Haensch, J. Carstens, G. Wittstock and J. Weissmüller, Electrocatalytic Methanol Oxidation With Nanoporous Gold: Microstructure And Selectivity, Nanoscale, 2017, 9, 17839–17848 RSC.
- M. Graf, B. Roschning and J. Weissmüller, Nanoporous Gold By Alloy Corrosion: Method-Structure-Property Relationships, J. Electrochem. Soc., 2017, 164, C194–C200 CrossRef CAS.
- J. Weissmüller, R. C. Newman, H. J. Jin, A. M. Hodge and J. W. Kysar, Nanoporous Metals By Alloy Corrosion: Formation And Mechanical Properties, MRS Bull., 2009, 34, 577–586 CrossRef.
- C. Mahr, M. Schowalter, C. Mitterbauer, A. Lackmann, L. Fitzek, T. Mehrtens, A. Wittstock and A. Rosenauer, Nanoporous Gold Dealloyed From Auag And Aucu: Comparison Of Structure And Chemical Composition, Materialia, 2018, 2, 131–137 CrossRef.
- S. Ibrahim, D. Crespo, S. Blaseio, A. Hockmann, G. Hilt and M. Oezaslan, Nanoporous Copper For The Electrosynthesis Of Cyclic Carbonates From Co2 And Epoxides, ChemElectroChem, 2024 DOI:10.1002/Celc.202400098.
- S. Ibrahim, A. Dworzak, D. Crespo, F. U. Renner, C. Dosche and M. Oezaslan, Nanoporous Copper Ribbons Prepared By Chemical Dealloying Of A Melt-Spun Zncu Alloy, J. Phys. Chem. C, 2022, 126, 212–226 CrossRef CAS.
- B. Hecker, C. Dosche and M. Oezaslan, Ligament Evolution In Nanoporous Cu Films Prepared By Dealloying, J. Phys. Chem. C, 2018, 122, 26378–26384 CrossRef CAS.
- T. Krekeler, A. V. Straßer, M. Graf, K. Wang, C. Hartig, M. Ritter and J. Weissmüller, Silver-Rich Clusters In Nanoporous Gold, Mater. Res. Lett., 2017, 5, 314–321 CrossRef CAS.
- C. Mahr, K. Müller-Caspary, M. Graf, A. Lackmann, T. Grieb, M. Schowalter, F. F. Krause, T. Mehrtens, A. Wittstock, J. Weissmüller and A. Rosenauer, Measurement Of Local Crystal Lattice Strain Variations In Dealloyed Nanoporous Gold, Mater. Res. Lett., 2018, 6, 84–92 CrossRef CAS.
- C. Mahr, P. Kundu, A. Lackmann, D. Zanaga, K. Thiel, M. Schowalter, M. Schwan, S. Bals, A. Wittstock and A. Rosenauer, Quantitative Determination Of Residual Silver Distribution In Nanoporous Gold And Its Influence On Structure And Catalytic Performance, J. Catal., 2017, 352, 52–58 CrossRef CAS.
- A. A. El-Zoka, B. Langelier, G. A. Botton and R. C. Newman, Enhanced Analysis Of Nanoporous Gold By Atom Probe Tomography, Mater. Charact., 2017, 128, 269–277 CrossRef CAS.
- J. Hernández, J. Solla-Gullón, E. Herrero, A. Aldaz and J. M. Feliu, Methanol Oxidation On Gold Nanoparticles In Alkaline Media: Unusual Electrocatalytic Activity, Electrochim. Acta, 2006, 52, 1662–1669 CrossRef.
- X. Li, Q. Chen, I. Mccue, J. Snyder, P. Crozier, J. Erlebacher and K. Sieradzki, Dealloying Of Noble-Metal Alloy Nanoparticles, Nano Lett., 2014, 14, 2569–2577 CrossRef CAS PubMed.
- C. Rurainsky, A. G. Manjón, F. Hiege, Y.-T. Chen, C. Scheu and K. Tschulik, Electrochemical Dealloying As A Tool To Tune The Porosity, Composition And Catalytic Activity Of Nanomaterials, J. Mater. Chem. A, 2020, 8, 19405–19413 RSC.
- J. Erlebacher, An Atomistic Description Of Dealloying, J. Electrochem. Soc., 2004, 151, C614–C626 CrossRef CAS.
- K. Sieradzki, N. Dimitrov, D. Movrin, C. Mccall, N. Vasiljevic and J. Erlebacher, The Dealloying Critical Potential, Electrochem. Soc., 2002, 149, B370 CrossRef CAS.
- J. Rugolo, J. Erlebacher and K. Sieradzki, Length Scales In Alloy Dissolution And Measurement Of Absolute Interfacial Free Energy, Nat. Mater., 2006, 5, 946–949 CrossRef CAS PubMed.
- L. Tang, B. Han, K. Persson, C. Friesen, T. He, K. Sieradzki and G. Ceder, Electrochemical Stability Of Nanometer-Scale Pt Particles In Acidic Environments, J. Am. Chem. Soc., 2010, 132, 596–600 CrossRef CAS PubMed.
- E. F. Holby, W. Sheng, Y. Shao-Horn and D. Morgan, Pt Nanoparticle Stability In Pem Fuel Cells: Influence Of Particle Size Distribution And Crossover Hydrogen, Energy Environ. Sci., 2009, 2, 865 RSC.
- I. Mccue, J. Snyder, X. Li, Q. Chen, K. Sieradzki and J. Erlebacher, Apparent Inverse Gibbs-Thomson Effect In Dealloyed Nanoporous Nanoparticles, Phys. Rev. Lett., 2012, 108, 225503 CrossRef CAS PubMed.
- M. Oezaslan, M. Heggen and P. Strasser, Size-Dependent Morphology Of Dealloyed Bimetallic Catalysts: Linking The Nano To The Macro Scale, J. Am. Chem. Soc., 2012, 134, 514–524 CrossRef CAS PubMed.
- M. Heggen, M. Oezaslan, L. Houben and P. Strasser, Formation And Analysis Of Core–Shell Fine Structures In Pt Bimetallic Nanoparticle Fuel Cell Electrocatalysts, J. Phys. Chem. C, 2012, 116, 19073–19083 CrossRef CAS.
- W. Cha, Y. Liu, H. You, G. B. Stephenson and A. Ulvestad, Dealloying In Individual Nanoparticles And Thin Film Grains: A Bragg Coherent Diffractive Imaging Study, Adv. Funct. Mater., 2017, 27, 1700331 CrossRef.
- P. Liu, Q. Chen, Y. Ito, J. Han, S. Chu, X. Wang, K. M. Reddy, S. Song, A. Hirata and M. Chen, Dealloying Kinetics Of Agau Nanoparticles By In Situ Liquid-Cell Scanning Transmission Electron Microscopy, Nano Lett., 2020, 20, 1944–1951 CrossRef CAS PubMed.
- C. Mahr, A. Dworzak, M. Schowalter, M. Oezaslan and A. Rosenauer, Quantitative 3d Characterization Of Nanoporous Gold Nanoparticles By Transmission Electron Microscopy, Microsc. Microanal., 2021, 27, 678–686 CrossRef CAS PubMed.
- M. Oezaslan, F. Hasché and P. Strasser, Oxygen Electroreduction On PtCo3, PtCo And Pt3Co Alloy Nanoparticles For Alkaline And Acidic Pem Fuel Cells, J. Electrochem.Soc., 2012, 159, B394–B405 CrossRef CAS.
- M. Oezaslan, F. Hasché and P. Strasser, PtCu3, PtCu And Pt3Cu Alloy Nanoparticle Electrocatalysts For Oxygen Reduction Reaction In Alkaline And Acidic Media, J. Electrochem. Soc., 2012, 159, B444–B454 CrossRef CAS.
- C. Wang, Y. Hongfeng, R. Chan, S. Peng, S. Dai and S. Sun, One-Pot Synthesis Of Oleylamine Coated Auag Alloy Nps And Their Catalysis For Co Oxidation, Chem. Mater., 2009, 21, 433–435 CrossRef CAS.
- M. Chen, Y. G. Feng, X. Wang, T. C. Li, J. Y. Zhang and D. J. Qian, Silver Nanoparticles Capped By Oleylamine: Formation, Growth, And Self-Organization, Langmuir, 2007, 23, 5296–5304 CrossRef CAS PubMed.
- Ernst Ruska-Centre, Ernst Ruska-Centre For Microscopy And Spectroscopy With Electrons (Er-C) Et Al., Feit Titan 80–300 Stem, J. Large-Scale Res. Facil., 2016, 2, A42 CrossRef.
- Ernst Ruska-Centre, Ernst Ruska-Centre For Microscopy And Spectroscopy With Electrons (Er-C) Et Al., Feit Titan G2 80–200 Crewley, J. Large-Scale Res. Facil., 2016, 2, A43 CrossRef.
- C. J. Powell, Cross Sections For Ionization Of Inner-Shell Electrons By Electrons, Rev. Mod. Phys., 1976, 48, 33–47 CrossRef CAS.
- L. Vegard, Die Konstitution Der Mischkristalle Und Die Raumfllung Der Atome, Z. Phys., 1921, 5, 17–26 CrossRef CAS.
- Nist X-Ray Photoelectron Spectroscopy (Xps) Database, Version 3.5, https://Srdata.Nist.Gov/Xps/, (accessed 25 May 2022).
- J. M. Dona and J. Gonzalez-Velasco, Mechanism Of Surface Diffusion Of Gold Adatoms In Contact With An Electrolytic Solution, J. Phys. Chem., 1993, 97, 4714–4719 CrossRef CAS.
- J. Biener, A. Wittstock, M. M. Biener, T. Nowitzki, A. V. Hamza and M. Baeumer, Effect Of Surface Chemistry On The Stability Of Gold Nanostructures, Langmuir, 2010, 26, 13736–13740 CrossRef CAS PubMed.
- L. Deng, W. Hu, H. Deng, S. Xiao and J. Tang, Au–Ag Bimetallic Nanoparticles: Surface Segregation And Atomic-Scale Structure, J. Phys. Chem. C, 2011, 115, 11355–11363 CrossRef CAS.
- X. He, S.-E. Zhang, F. Cheng and Z.-X. Chen, The Region-Specific Segregation And Catalytic Activity Of Gold–Silver Nanoparticles, Chem. Commun., 2018, 54, 638–641 RSC.
Footnote |
| † Electronic supplementary information (ESI) available: Figures to additional structural analysis (XRD, XPS, (S-)TEM-EDX) as well as electrochemical data. See DOI: https://doi.org/10.1039/d4nr00046c |
| This journal is © The Royal Society of Chemistry 2024 |