 Open Access Article
Creative Commons Attribution 3.0 Unported Licence
Kinetic description of water transport during spontaneous emulsification induced by Span 80†
Mao
Fukuyama
 *a,
Tomoko
Mizuguchi
 *b,
Piangrawee
Santivongskul
a,
Yuri
Ono
c,
Motohiro
Kasuya
 d,
Arinori
Inagawa
 e and
Akihide
Hibara
 *f
*f
aInstitution of Multidisciplinary Research for Advanced Materials, Tohoku University, 2-1-1, Katahira, Aoba-Ku, Sendai 980-8577, Japan. E-mail: maofukukuyama@tohoku.ac.jp
bFaculty of Materials Science and Engineering, Kyoto Institute of Technology, Matsugasaki, Sakyo-ku, Kyoto 606-8585, Japan. E-mail: mizuguti@kit.ac.jp
cGraduate School of Science and Technology, Kyoto Institute of Technology, Matsugasaki, Sakyo-ku, Kyoto 606-8585, Japan
dFaculty of Production Systems Engineering and Sciences, Komatsu University, Nu 1-3, Yonchoumemachi, Komatsu, Ishikawa 923-0971, Japan
eFaculty of Engineering, Utsunomiya University, 7-1-2, Yoto, Utsunomiya, Tochigi 321-8585, Japan
fDepartment of Chemistry, Tokyo Institute of Technology, 2-12-1 Ookayama, Meguro-ku, Tokyo 152-8551, Japan. E-mail: hibara.a.aa@m.titech.ac.jp
First published on 12th February 2024
Abstract
Spontaneous emulsification is a phenomenon that forms nanometer-sized droplets (nanodroplets) without the application of any external force, and the mechanism has been actively studied for application to various technologies. In this study, we analyzed the kinetics of spontaneous emulsification induced by Span 80. The measurement of water concentration in Span 80 hexadecane solution indicated that the chemical potential of water in the nanodroplets decreased as the amount of water in the nanodroplets decreased. Based on this result, water transport between the aqueous phase and nanodroplets in which the chemical potential of water was controlled was quantitatively investigated by using a microfluidic device. The results demonstrate that the kinetics of water transport during spontaneous emulsification induced by Span 80 was described by a model of osmotic transport through an organic liquid film between the aqueous phase and nanodroplets.
Introduction
Emulsions are dispersions of liquid droplets in an immiscible liquid and have been widely used, such as in oil recovery, cosmetics, food, medical, and pharmaceutical industries. Since first reported in 1876, spontaneous emulsification has been studied owing to its high potential for industrial applications.1–3 Conventional emulsification requires external forces to form droplets, causing an increase in the interfacial free energy, whereas spontaneous emulsification does not require any external forces. Therefore, spontaneous emulsification has been applied to various technologies, such as for drug carrier preparation,4,5 microanalysis,6–10 and micro- and nanomaterial synthesis.11–17Understanding the mechanism of spontaneous emulsification is important for industrial applications. There are several surfactants used for spontaneous emulsification, such as Aerosol-OT,18 trimethyloctadecylammonium bromide,15,16 Tween series3 and Brij series.3,19 Also, it is known that the mixture of surfactants efficiently induces spontaneous emulsification due to low surface tension dynamic effects such as the Marangoni effect.3,20 The mechanism of spontaneous emulsification is different depending on the surfactants. Several types of mechanisms have been reported based on ultralow interfacial tension,2,20 solubility changes,21 phase transition of the organic phase11,16 and the interface induced by temperature changes.15 Recently, spontaneous emulsification induced by Span 80, a well-known non-ionic surfactant, has been reported (Fig. 1A).22 In this system, water-in-oil droplets with sizes ranging between 10–1000 nm (nanodroplets) are formed in a water-Span 80-organic phase system. The spontaneous emulsification of Span 80 does not follow the aforementioned mechanisms but is considered to be driven by the difference in the chemical potential between the aqueous phase and nanodroplets via a water film transport (Fig. 1B).22,23 By utilizing the spontaneous emulsification of Span 80, we have previously developed microanalytical methods in micrometer-sized water-in-oil droplets (microdroplets).6–10 In this method, the selective concentration enrichment of microdroplet contents was achieved based on the molecular transport, including water23 and solutes,8,24 to the Span 80 nanodroplet during spontaneous emulsification. As a result, various microdroplet manipulations such as protein crystallization6 and immunoassay were demonstrated.9
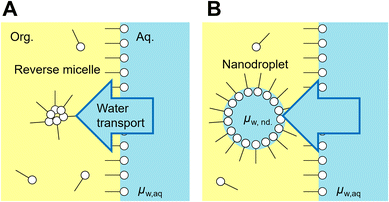 | ||
| Fig. 1 Spontaneous emulsification induced by Span 80. Water transport to the reverse micelle of Span 80 in organic phase (A) and a nanodroplet is formed (B). The water transport continue until chemical potential of water nanodroplet (μw,nd) becomes equal to that in the aqueous phase (μw,aq).23 | ||
Understanding the kinetics of spontaneous emulsification is important for its practical use because it is a non-equilibrium, non-stationary phenomenon in which droplets form at the oil–water interface under transiently changing conditions.1,25 The qualitative mechanism of the spontaneous emulsification of Span 80 (Fig. 1B) has been derived from the investigation based on the equilibrium model.22,23 In the previous study, we have clarified that the water transport during spontaneous emulsification is induced by the difference of chemical potential between the aqueous phase and the nanodroplets by using microfluidic devices.23 However, the kinetics of spontaneous emulsification of Span 80 remain unclear. It has been difficult to describe the kinetics of spontaneous emulsification due to the lack of quantification method for water transport during spontaneous emulsification.
In this study, the kinetics of the spontaneous emulsification of Span 80 was quantitatively investigated using a microfluidic device, in which the emulsion behaviors can be investigated by forming and manipulating the microdroplets in micrometer-sized fluidic channels.26 We considered this feature to quantify trace amounts of water transport in spontaneous emulsification with a high reproducibility and sensitivity. In this study, we first investigated the relationship between the amount of water and the chemical potential in nanodroplets. Subsequently, we quantified the time variation of water transport between the nanodroplets and microdroplets in a microfluidic device. The results indicated that the water transport during spontaneous emulsification induced by Span 80 was described by a model of osmotic transport through an organic liquid film between aqueous phase and nanodroplets.
Materials and methods
Chemicals
NaCl and hexadecane were purchased from FUJIFILM Wako Pure Chemical Corporation (Osaka, Japan). Span 80 and Brij S2 were purchased from Merck KGaA (Darmstadt, Germany). Bis(2-ethylhexyl) hydrogen phosphate (BEHP) was purchased from Tokyo Chemical Industry Co., Ltd (Japan). Silpot 184 and 501 W were obtained from Dow Corning Toray Co., Ltd (Japan).Observation of spontaneous emulsification on a centimeter scale
Hexadecane solutions of 100 mM Span 80, 5 mM Brij S2, and 100 mM BEHP were prepared. Milli-Q water and these hexadecane solutions were gently poured into glass bottles to prepare two-phase systems respectively. These solutions were observed at 0 h and 91 h after pouring.Interfacial tension measurement
The interfacial tension of the water/hexadecane solution of BEHP and Brij S2 was measured by the pendant drop method (Kyowa Interface Science Co., Ltd, Japan). The critical micellar concentration (cmc) was determined based on the dependence of the interfacial tension on the concentration.Pretreatment of organic phases containing surfactants with an aqueous NaCl solution
By using hexadecane as an organic solvent, 100 mM Span 80 solution, 5 mM Brij S2, and 100 mM BEHP solution were prepared. These solutions were pretreated with 1–4 M NaCl aqueous solution. 10 mL of hexadecane solution and 10 mL of aqueous NaCl solution were gently mixed in a 50 mL bottle and remained stationary for 5 min. The aqueous phase was then removed from the bottle. After repeating the procedure three times, the resulting mixture was maintained overnight with a 10 mL additional aqueous NaCl solution at a low stirring speed. During these steps, the reverse micelles were swelled by water and nanodroplets were formed. Shortly before the next experimental step, the mixture was centrifuged at 2000g for 1 min to precipitate the excess aqueous phase, and the supernatant was used as the organic phase solution.Karl Fisher titration
The water concentrations in the pretreated hexadecane solutions of surfactants were measured by using the Karl Fisher titration (MKC-710B, Kyoto Electronics Manufacturing Co., Ltd, Japan).Molecular dynamics (MD) simulation of Span 80 reverse micelles
The MD simulation of Span 80 reverse micelles in hexadecane was performed following the previous report.27 Briefly, the initial structure and partial charges of a Span 80 molecule were taken from ref.28 but the charges of the hydrocarbon tails were set to 0. The interaction parameters of Span 80 were generated based on ref.29 For hexadecane, the GROMOS53A6 force field was used,30 but for the dihedral potential, the Ryckaert-Bellemans model was adopted.31 All partial charges of hexadecane were set to 0. For water, a three-site simple point charge (SPC) model was used.32 The aggregation number of the nanodroplets was set to 70. Two nanodroplets with different numbers of water molecules were prepared: 70 and 140. All simulations were performed using the GROMACS 2021 package33 in the isothermal-isobaric ensemble with temperature T = 298 K and pressure P = 1 bar. After energy minimization for 50![[thin space (1/6-em)]](https://www.rsc.org/images/entities/char_2009.gif) 000 steps in each system, a 210 ns simulation was performed for structural relaxation with the Berendsen barostat,34 followed by a 200 ns run for hydrogen-bond analysis and then a 30 ns run for free energy profile calculation with the Parrinello-Rahman barostat.35 The temperature was kept constant by canonical sampling through velocity scaling.36 The equations of motion were integrated by the leapfrog algorithm with a time step of 2 fs. The electrostatic interaction was handled by the smooth particle mesh Ewald method.37 The visualization of the atomic configurations was performed using the software VMD.38 The lifetime of the hydrogen bond and the activation free energy for hydrogen-bond breaking were calculated using the method in ref.39 The free energy profile of a water molecule was calculated using the umbrella sampling and weighted histogram analysis method.40
000 steps in each system, a 210 ns simulation was performed for structural relaxation with the Berendsen barostat,34 followed by a 200 ns run for hydrogen-bond analysis and then a 30 ns run for free energy profile calculation with the Parrinello-Rahman barostat.35 The temperature was kept constant by canonical sampling through velocity scaling.36 The equations of motion were integrated by the leapfrog algorithm with a time step of 2 fs. The electrostatic interaction was handled by the smooth particle mesh Ewald method.37 The visualization of the atomic configurations was performed using the software VMD.38 The lifetime of the hydrogen bond and the activation free energy for hydrogen-bond breaking were calculated using the method in ref.39 The free energy profile of a water molecule was calculated using the umbrella sampling and weighted histogram analysis method.40
Fabrication of microfluidic devices
A Polydimethylsiloxane (PDMS) microfluidic device was fabricated by following the previous report.23 A mold with 210 μm-wide and 80 μm-deep square microwells on the ceiling of a 3 mm-wide 80 μm-deep microchannel were fabricated by soft lithography. A 7![[thin space (1/6-em)]](https://www.rsc.org/images/entities/char_2009.gif) :
:![[thin space (1/6-em)]](https://www.rsc.org/images/entities/char_2009.gif) 1 mixture of PDMS and curing agent was cured at 75 °C more than 1 h. The microfluidic device was bonded to a PDMS-coated slide glass after plasma treatment (CUTE, Femto Science Inc, Korea).
1 mixture of PDMS and curing agent was cured at 75 °C more than 1 h. The microfluidic device was bonded to a PDMS-coated slide glass after plasma treatment (CUTE, Femto Science Inc, Korea).
Observation of spontaneous emulsification of microdroplets in a microfluidic device
The microdroplets were prepared according to a previously reported procedure.23 First, NaCl aqueous solution was introduced to the microfluidic channel with microwells. Hexadecane was introduced using a manual syringe to isolate the aqueous solution in each microwell. The pretreated Span 80 hexadecane solution was then introduced into the microchannels using a syringe pump (KDS-100, KD Scientific Corporation, USA) at 3 μL min−1 to provide a fresh organic phase to the interface of the microdroplets and to remove the nanodroplets formed by spontaneous emulsification.The micrographs were analyzed usinghrough the pretreatment using the NaCl aqueous so Image J software to determine the volume of the microdroplets by assuming that the shape of the microdroplet is the combination of the outer half of a torus and a cylinder (see section 1 and Fig. S1A in ESI† for detail). The NaCl concentration in the microdroplet was calculated based on the microdroplet volume by assuming that all the NaCl remained in the microdroplets during the spontaneous emulsification.23 The chemical potential of water in the microdroplets (μaq) was calculated based the NaCl concentration.
Measurement of the size of Span 80 reverse micelles by using dynamic light scattering
To investigate the size of the Span 80 reverse micelles, 300 mM hexadecane solution of Span 80 pretreated by 2 M and 5 M NaCl solutions were measured by using dynamic light scattering (Zetasizer Nano-ZS, Malvern Panalytical Ltd., UK)Results and discussion
Water content and chemical potential of the water in nano water droplets
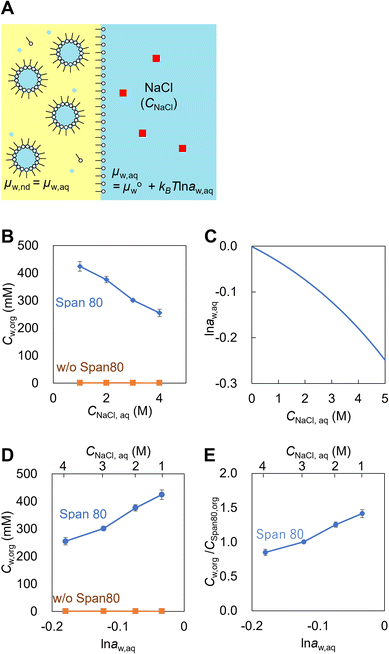
First, the chemical potential of water in nanodroplets in Span 80 hexadecane solution was investigated. The critical micellar concentration (cmc) and interfacial tension (γ) of the water-Span 80-hexadecane system are 0.15 mM and 2 mN m−1, respectively.41 The water concentration in 300 mM of Span 80 hexadecane solution, which achieved partition equilibrium with 1–4 M NaCl aqueous solution, was measured by the Karl Fischer titration. In this experiment, the Span 80 reverse micelles were swelled by water to form the nanodroplets through the pretreatment using the NaCl aqueous solution (Fig. 2A). The chemical potential of water in the nanodroplets (μw,nd) were the same as that in NaCl aqueous solution (μw,aq) because the system achieved the equilibrium. As shown in Fig. 2B, a higher NaCl concentration (CNaCl,aq) resulted in a lower water concentration in the organic phase (Cw,org). We considered that Cw,org/CSpan 80,org indicates amount of water in the nanodroplets since the Span 80 concentration in the hexadecane solution (300 mM) is much higher than cmc (0.15 mM) and the most of the Span 80 molecules were involving in nanodroplets. The activity of water in aqueous solution (aw,aq) is calculated from CNaCl,aq as described the previous study (Fig. 2C, see section 2 in ESI† for detail). The dependences of Cw,org and Cw,org/CSpan 80,org on ln![[thin space (1/6-em)]](https://www.rsc.org/images/entities/char_2009.gif) aw,aq are obtained as Fig. 2D and E.
aw,aq are obtained as Fig. 2D and E.
Fig. 2E indicates that a higher water content in the Span 80 nanodroplets results in a higher chemical potential of water in nanodroplets (μw,nd) since μw,nd = μw,aq. MD simulations of the nanodroplets consisting of water and Span 80 with ratios of 70/70 molecules and 70/140 molecules were conducted (Fig. S2†). The result indicated that the free energy of the water in the 70/70 nanodroplet was lower than that in the 70/140 droplet, which is coincident with the result shown in Fig. 2.
In addition to Span 80, the same experiments were performed with Brij S2 (the main component is diethylene glycol octadecyl ether, cmc < 1.1 mM, γ = 2 mN m−1) and BEHP (cmc < 22 mM, γ = 23 mN m−1) as examples of surfactants that were soluble in hexadecane. The results indicated that Cw,org was constant regardless of CNaCl,aq (Fig. S3A and B†). These surfactants did not cause spontaneous emulsification (Fig. S3C†). These results indicate that the increase in the amount of water in Span 80 nanodroplets with μw,nd increase is characteristic and this can induce the spontaneous emulsification.
Quantitative analysis of the water transport during spontaneous emulsification using microfluidics
To describe the kinetics of water transport in the spontaneous emulsification of Span 80, the transport of water from microdroplets to nanodroplets was observed in a microfluidic device. Microdroplets were formed in a 210 μm sized microwell structure in the device (Fig. 3A). The microdroplet was prepared in each well by introducing aqueous phase, hexadecane, and hexadecane solution of Span 80. An organic phase containing nanodroplets, whose chemical potential of water had been adjusted by the pretreatment, flowed continuously from upstream. These nanodroplets that reach to the microdroplets still had room to swell water from the microdroplets because the NaCl concentration in the microdroplets was lower than that used for pretreatment. The decrease in volume of the microdroplets owing to the transport of water from microdroplets to the nanodroplets was measured. As reported in a previous study, the nanodroplets flowed downstream after contacting the microdroplets for time τ (<1 s, Fig. 3C); the accumulation of nanodroplets on the surface of the microdroplets was not observed in this experiment, although spontaneous emulsification occurred (Fig. 3D).23 Note that during spontaneous emulsification, inorganic salts and hydrophilic molecules remain in the microdroplets and do not partition to the nanodroplets.7,23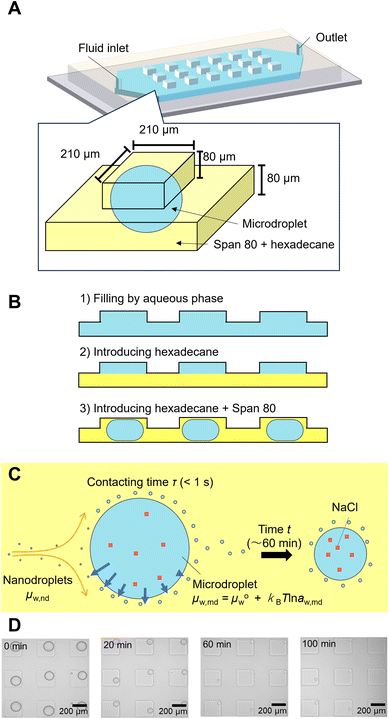 | ||
| Fig. 3 Observation of the water transport during spontaneous emulsification by using microdroplets in the microfluidic device. (A) Schematic illustration of a microdroplet in a microfluidic device. (B) Schematic illustration of microdroplet preparation. (C) Schematic illustration of water transfer around a microdroplet during spontaneous emulsification. (D) Micrographs of microdroplets during spontaneous emulsification. The original data was obtained from ref. 23. | ||
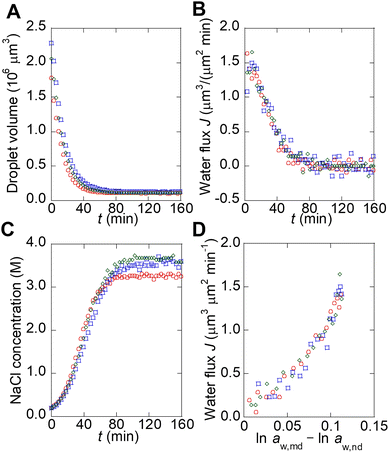
The water transport from microdroplets to nanodroplets was quantified from the micrographs (see section 1 and Fig. S1B–F in ESI† for detail). It should be noted that the chemical potential of water in the microdroplets can be assumed to be the same as that in bulk because the contribution of the interface of the microdroplets is negligible compared to kBTln![[thin space (1/6-em)]](https://www.rsc.org/images/entities/char_2009.gif) aw,md (see section 5 in ESI† for detail). The microdroplets stopped shrinking when they reached a certain size (Fig. 4A). This occurred because the NaCl concentration in the microdroplet increases with shrinkage, and the chemical potentials of water in the microdroplet (μw,md) and nanodroplet (μw,nd) become equal, stopping the apparent water transport.23 The flux of water (J) from the microdroplet to the nanodroplet was calculated from the change in the microdroplet volume (Fig. 4B). The time course of the NaCl concentration in the microdroplet was calculated, assuming that all NaCl remained in the microdroplet, and the water activity in the microdroplet was determined (Fig. 4C).
aw,md (see section 5 in ESI† for detail). The microdroplets stopped shrinking when they reached a certain size (Fig. 4A). This occurred because the NaCl concentration in the microdroplet increases with shrinkage, and the chemical potentials of water in the microdroplet (μw,md) and nanodroplet (μw,nd) become equal, stopping the apparent water transport.23 The flux of water (J) from the microdroplet to the nanodroplet was calculated from the change in the microdroplet volume (Fig. 4B). The time course of the NaCl concentration in the microdroplet was calculated, assuming that all NaCl remained in the microdroplet, and the water activity in the microdroplet was determined (Fig. 4C).
The flux of water transport between organic liquid films driven by osmosis is described by the following equation from Fick's law:42
 | (1) |
 | (2) |
Here, water activity of nanodroplet is calculated from NaCl concentration in the microdroplet (see section 2 in ESI† for details). Considering that aw,nd is the water activity of the NaCl solution used for the pretreatment of the Span 80 hexadecane solution, J was plotted on ln![[thin space (1/6-em)]](https://www.rsc.org/images/entities/char_2009.gif) aw,nd − ln
aw,nd − ln![[thin space (1/6-em)]](https://www.rsc.org/images/entities/char_2009.gif) aw,md, as shown in Fig. 4D; J increases as ln
aw,md, as shown in Fig. 4D; J increases as ln![[thin space (1/6-em)]](https://www.rsc.org/images/entities/char_2009.gif) aw,nd − ln
aw,nd − ln![[thin space (1/6-em)]](https://www.rsc.org/images/entities/char_2009.gif) aw,md increases. This graph was linearly fitted by eqn (1) to obtain P.
aw,md increases. This graph was linearly fitted by eqn (1) to obtain P.
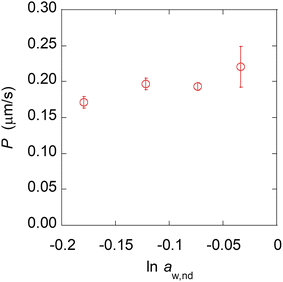
The experimental results using nanodroplets with different indicated that P was 0.2 μm s−1, and independent of μw,nd (Fig. 5). The theoretical value of P was calculated by using Vw = 18 mL mol−1, Vo = 291 mL mol−1, D = 3 × 10⁻⁶ cm2 s−1, K = 7.3 mM/55.4 M = 1.3 × 10⁻⁵, δ = 12 nm. The value of δ is the average distance between micelles when 300 molecules of Span 80 are considered to form one micelle (see section 6 in ESI† for detail). The value of D was estimated based on the Stokes–Einstein equation by using the diffusion coefficient of a typical small molecule in water (10–5 cm2 s−1)43 and the ratio of the viscosities of water (0.890 mPa s−1)43 and hexadecane (3.03 mPa s−1).43 The calculated theoretical value of P was 0.02 μm s−1, which is ten times lower than the experimental value (0.2 μm s−1). A possible reason for the experimental value being higher than the theoretical value is that the Span 80 monomers promote water transport in the thin films of the organic phases containing Span 80.44 Since this is rough estimation and the difference of the theoretical and experimental value is only one order of the magnitude, we concluded that the kinetics of the water transport during spontaneous emulsification induced by Span 80 was described by a model of osmotic transport through an organic liquid film between the aqueous phase and nanodroplets.
This result indicates that the differences depending on the water content of the nanodroplets, such as the curvature of the interface and the strength of the hydrogen bonds (see section 3 in ESI† for detail), do not affect the kinetics of water transport or are already included in the osmosis model. On the other hand, some detail behavior in the experimental results could not be explained by a simple osmotic model. For example, the plot shown in Fig. 4D is not exactly linear, which may be owing to the increase in μw,nd during the contact of the nanodroplets and a microdroplet (τ in Fig. 3C). Therefore, for a more accurate description of the spontaneous emulsification kinetics, it may be necessary to measure the rate of increase of μw,nd.
Conclusion
In this study, we analyzed the kinetics of spontaneous emulsification induced by Span 80. Karl Fischer titration indicated that the chemical potential of water in the nanodroplets decreased as the amount of water in the nanodroplets decreased, which was also reproduced in the MD simulations. The water transport between the nanodroplets and aqueous phase with the modulated water chemical potentials was quantitatively investigated in the microfluidic device. The results indicated demonstrate that the kinetics of the water transport during spontaneous emulsification induced by Span 80 was described by a model of osmotic transport through an organic liquid film between the aqueous phase and nanodroplets. This fundamental understanding has implications for the application of the spontaneous emulsification to various fields such as cosmetics, food, medical, and pharmaceutical industries.Author contributions
M. F. conceived and designed the research; M. F., P. S. and M. K. acquired and analyzed the experimental data; T. M. and Y. O. conducted the MD simulations. M. K., A. I., and A. H. advised the research. The manuscript was prepared by M. F. and T. M. All authors have approved the final version of the manuscript.Conflicts of interest
There are no conflicts to declare.Acknowledgements
This work was financially supported by a Grant-in-Aid from the KAKENHI funding program (grant number 19H02739), Japan Science and Technology Agency (FOREST, JPMJFR211Y), and IMRAM Project. The simulations were performed using computational resources of the Research Center for Computational Science, Okazaki, Japan (Project: 23-IMS-C121). MK was financially supported by KAKENHI funding program (grant number 22H04517). The authors would like to appreciate the technical support provided by Ms. Rika Tanno and Dr Yoko Maruyama, Ms. Yumi Shimizu, Prof. Hitoshi Kasai, Prof. Yoshitaka Koseki, and Prof. Hiromasa Niinomi.References
- J. C. López-Montilla, P. E. Herrera-Morales, S. Pandey and D. O. Shah, Journal of Dispersion Science and Technology, 2002, 23, 219–268 CrossRef.
- C. A. Miller, Colloids Surf., 1988, 29, 89–102 CrossRef CAS.
- Z. Li, D. Xu, Y. Yuan, H. Wu, J. Hou, W. Kang and B. Bai, Adv. Colloid Interface Sci., 2020, 277, 102119 CrossRef CAS PubMed.
- N. Anton, J.-P. Benoit and P. Saulnier, J. Controlled Release, 2008, 128, 185–199 CrossRef CAS PubMed.
- N. Rolley, M. Bonnin, G. Lefebvre, S. Verron, S. Bargiel, L. Robert, J. Riou, C. Simonsson, T. Bizien, J.-C. Gimel, G. Brotons and B. Calvignac, Nanoscale, 2021, 13, 11899–11912 RSC.
- M. Fukuyama, A. Akiyama, M. Harada, T. Okada and A. Hibara, Anal. Methods, 2015, 7, 7128–7131 RSC.
- M. Fukuyama and A. Hibara, Anal. Chem., 2015, 87, 3562–3565 CrossRef CAS PubMed.
- M. Fukuyama, A. Hibara, Y. Yoshida and K. Maeda, Anal. Chem., 2017, 89(17), 9279–9283 CrossRef CAS PubMed.
- M. Fukuyama, K. Kubota and A. Hibara, Langmuir, 2023, 39, 7884–7890 CrossRef CAS PubMed.
- M. Fukuyama, Bull. Chem. Soc. Jpn., 2023, 69, 1252–1257 CrossRef.
- S. Tcholakova, Z. Valkova, D. Cholakova, Z. Vinarov, I. Lesov, N. Denkov and S. K. Smoukov, Nat. Commun., 2017, 8, 1–11 CrossRef PubMed.
- Q. Guo, Y. Li, Q. Liu, Y. Li and D.-P. Song, Angew. Chem., Int. Ed., 2022, 61, e202113759 CrossRef CAS PubMed.
- T.-Y. Tang, H.-L. Wang, C.-T. Yao, K.-C. Yang, R.-M. Ho and D.-H. Tsai, Nanoscale, 2018, 10, 7352–7356 RSC.
- H. Zou and Y. Ren, Nanoscale, 2023, 15, 10484–10497 RSC.
- S. Guttman, Z. Sapir, M. Schultz, A. V. Butenko, B. M. Ocko, M. Deutsch and E. Sloutskin, Proc. Natl. Acad. Sci. U. S. A., 2016, 113, 493–496 CrossRef CAS PubMed.
- N. Denkov, S. Tcholakova, I. Lesov, D. Cholakova and S. K. Smoukov, Nature, 2015, 528, 392–395 CrossRef CAS PubMed.
- H. Hirama and T. Inoue, Chem. Lett., 2017, 46, 460–462 CrossRef CAS.
- T. Nishimi and C. A. Miller, Langmuir, 2000, 16, 9233–9241 CrossRef CAS.
- C. R. Davis, C. J. Martinez, J. A. Howarter and K. A. Erk, Langmuir, 2020, 36, 7517–7527 CrossRef CAS PubMed.
- Y. Zheng, C. R. Davis, J. A. Howarter, K. A. Erk and C. J. Martinez, Langmuir, 2022, 38, 4276–4286 CrossRef CAS PubMed.
- M.-J. Rang and C. A. Miller, J. Colloid Interface Sci., 1999, 209, 179–192 CrossRef CAS PubMed.
- H. González-Ochoa and J. L. Arauz-Lara, Langmuir, 2007, 23, 5289–5291 CrossRef PubMed.
- M. Fukuyama, L. Zhou, T. Okada, K. V. Simonova, M. Proskurnin and A. Hibara, Anal. Chim. Acta, 2021, 1149, 338212 CrossRef CAS PubMed.
- M. Fukuyama, M. Suto and A. Hibara, Anal. Sci., 2021, 37, 753–758 CrossRef CAS PubMed.
- M. Schmitt, R. Toor, R. Denoyel and M. Antoni, Langmuir, 2017, 33, 14011–14019 CrossRef CAS PubMed.
- N. Bremond and J. Bibette, Soft Matter, 2012, 8, 10549–10559 RSC.
- Y. Ono, T. Mizuguchi and M. Fukuyama, Transaction of the Japan Society for Simulation Technology, 2023, 15(2), 36–41 Search PubMed.
- I. V. Kopanichuk, E. A. Vedenchuk, A. S. Koneva and A. A. Vanin, J. Phys. Chem. B, 2018, 122, 8047–8055 CrossRef CAS PubMed.
- X. Tang, K. J. Huston and R. G. Larson, J. Phys. Chem. B, 2014, 118, 12907–12918 CrossRef CAS PubMed.
- C. Oostenbrink, A. Villa, A. E. Mark and W. F. Van Gunsteren, J. Comput. Chem., 2004, 25, 1656–1676 CrossRef CAS PubMed.
- J. Ryckaert and A. Bellemans, Faraday Discuss. Chem. Soc., 1978, 66, 95–106 RSC.
- H. J. C. Berendsen, J. P. M. Postma, W. F. van Gunsteren and J. Hermans, in Intermolecular Forces: Proceedings of the Fourteenth Jerusalem Symposium on Quantum Chemistry and Biochemistry Held in Jerusalem, Israel, April 13–16, 1981, ed. B. Pullman, Springer Netherlands, Dordrecht, 1981, pp. 331–342 Search PubMed.
- M. J. Abraham, T. Murtola, R. Schulz, S. Páll, J. C. Smith, B. Hess and E. Lindah, SoftwareX, 2015, 1–2, 19–25 CrossRef.
- H. J. C. Berendsen, J. P. M. Postma, W. F. Van Gunsteren, A. Dinola and J. R. Haak, J. Chem. Phys., 1984, 81, 3684–3690 CrossRef CAS.
- M. Parrinello and A. Rahman, J. Appl. Phys., 1981, 52, 7182–7190 CrossRef CAS.
- G. Bussi, D. Donadio and M. Parrinello, J. Chem. Phys., 2007, 126, 014101 CrossRef PubMed.
- U. Essmann, L. Perera, M. L. Berkowitz, T. Darden, H. Lee and L. G. Pedersen, J. Chem. Phys., 1995, 103, 8577–8593 CrossRef CAS.
- W. Humphrey, A. Dalke and K. Schulten, J. Mol. Graphics, 1996, 14, 33–38 CrossRef CAS PubMed.
- D. van der Spoel, P. J. van Maaren, P. Larsson and N. Tîmneanu, J. Phys. Chem. B, 2006, 110, 4393–4398 CrossRef CAS PubMed.
- S. Kumar, J. M. Rosenberg, D. Bouzida, R. H. Swendsen and P. A. Kollman, J. Comput. Chem., 1992, 13, 1011–1021 CrossRef CAS.
- N. Politova, S. Tcholakova and N. D. Denkov, Colloids Surf., A, 2017, 522, 608–620 CrossRef CAS.
- A. Finkelstein, Water Movement Through Lipid Bilayers, Pores, and Plasma Membranes: Theory and Reality, Wiley Interscience, New York, 1987 Search PubMed.
- Handbook of Chemistry and Physics 102nd Edition, ed. D. R. Lide, CRC Press, Boca Raton, 89th edn, 2008 Search PubMed.
- L. Wen and K. D. Papadopoulos, Colloids Surf., A, 2000, 174, 159–167 CrossRef CAS.
Footnote |
| † Electronic supplementary information (ESI) available. See DOI: https://doi.org/10.1039/d3nr06121c |
| This journal is © The Royal Society of Chemistry 2024 |


