
 Open Access Article
 This Open Access Article is licensed under a
 Creative Commons Attribution 3.0 Unported Licence
Digestion of lipid micelles leads to increased membrane permeability†
Jun
Xie
a,
Demi L.
Pink
a,
M.
Jayne Lawrence
 b and
Christian D.
Lorenz
*a
b and
Christian D.
Lorenz
*a
aBiological & Soft Matter Research Group, Department of Physics, Faculty of Natural, Mathematical & Engineering Sciences, King's College London, London, UK. E-mail: chris.lorenz@kcl.ac.uk
bDivision of Pharmacy and Optometry, School of Health Sciences, Faculty of Biology, Medicine and Health, University of Manchester, Stopford Building, Oxford Road, Manchester, UK
First published on 2nd January 2024
Abstract
Lipid-based drug carriers are an attractive option to solubilise poorly water soluble therapeutics. Previously, we reported that the digestion of a short tail PC lipid (2C6PC) by the PLA2 enzyme has a significant effect on the structure and stability of the micelles it forms. Here, we studied the interactions of micelles of varying composition representing various degrees of digestion with a model ordered (70 mol% DPPC & 30 mol% cholesterol) and disordered (100% DOPC) lipid membrane. Micelles of all compositions disassociated when interacting with the two different membranes. As the percentage of digestion products (C6FA and C6LYSO) in the micelle increased, the disassociation occurred more rapidly. The C6FA inserts preferentially into both membranes. We find that all micelle components increase the area per lipid, increase the disorder and decrease the thickness of the membranes, and the 2C6PC lipid molecules have the most significant impact. Additionally, there is an increase in permeation of water into the membrane that accompanies the insertion of C6FA into the DOPC membranes. We show that the natural digestion of lipid micelles result in molecular species that can enhance the permeability of lipid membranes that in turn result in an enhanced delivery of drugs.
1 Introduction
Nanoparticle formulations consisting of a range of materials are being developed for a range of applications including use as drug-delivery vehicles (DDVs).1–14 Lipid-based nanoformulations are of particular importance due to their biocompatability,15–17 and they have been of increasing interest over the past few years as a result of the success of the various lipid nanoparticles (LNPs) used to deliver the COVID vaccines.18Phosphatidylcholine (PC) lipids are the major components of cell membranes. Due to their amphiphilic nature, PC lipids are able to self-assemble into a variety of nanostructures including bilayers and micelles. The molecular architecture of the lipids can be tailored in order to generate a variety of different self-assembled structures. For example, small changes in the lipid tail length can alter the concentration at which the lipid self-assembles (called the critical micelle concentration (CMC)) as well as the structure of the aggregates formed, with the size of the aggregates formed increasing with the length of the hydrophobic tails of the lipid molecules?
Within the body, PC molecules are degraded via the hydrolysis of the PC sn-2 ester bond, a process which is mediated by the calcium-dependent secreted phospholipase A2 (sPLA2) enzyme.19 This hydrolysis results in the production of lysophosphocholine and fatty acid molecules.20,21 Previously we have combined static and time-resolved small angle neutron scattering with all-atom molecular dynamics simulations to characterise how the structure of micelles containing dihexanoylphosphatidylcholine (2C6PC) changes as the molecule is digested by sPLA2 into 1-hexanoyl-lysophosphocholine (C6LYSO) and hexanoic acid (C6FA) (Fig. S1†).2 Our results show that as the degradation progresses the cmc of the resulting micelles decreases and therefore potentially affect the release of any payload that they are carrying.2
The concentration of sPLA2 is elevated in various inflammatory diseases, atherosclerosis and cancers, specifically prostate, breast and pancreatic cancer.22–30 As a result, the release of anti-cancer agents contained in PC lipid-based DDVs can be triggered by an enzyme that is upregulated in the targeted tissue and therefore would not require any external stimuli to trigger the drug release.31–34 Such enzyme triggered release cxould be beneficial in a clinical setting,35 as the localised release of encapsulated drug(s) would reduce their side effects.
The action of the sPLA2 enzyme on these phospholipid-based DDVs will result in the production of bioactive molecules in the form of the lysolipids and fatty acids. As free fatty acids and lysolipids have been shown to enhance drug transport across lipid membranes,36–39 the natural production of these molecules is an attractive way to overcome various biological barriers, to drug absorption which is one of the most significant challenges faced when developing an effective DDV. Specifically, for anticancer DDVs, delivering the drug to the exterior of a solid tumor is not sufficient as the drug has to diffuse through the tumor microenvironment and get into the tumor cells to exert its therapeutic effect.
In this manuscript, we present the results of all-atom molecular dynamics simulations that were used to investigate the interactions of 2C6PC micelles at various stages of digestion with two model lipid membranes: an ordered membrane (70![[thin space (1/6-em)]](https://www.rsc.org/images/entities/char_2009.gif) :30 mole ratio 1,2-dipalmitoyl-sn-glycero-3-phosphocholine (DPPC):Cholesterol (CHOL)) and a disordered membrane (pure 1,2-dioleoyl-sn-glycero-3-phosphocholine (DOPC)). Our findings provide insight into how the natural digestion of the 2C6PC molecules in the micelles lead to their enhanced permeability and in turn may increase the delivery of any encapsulated drugs to the cell. In particular, we demonstrate the unique effects that each of the different components of the micelles has on the interfacial and structural properties of the two different membranes. Additionally, we show the different dynamical properties of the various molecules comprising the micelles have once they have inserted into each of the membranes.
:30 mole ratio 1,2-dipalmitoyl-sn-glycero-3-phosphocholine (DPPC):Cholesterol (CHOL)) and a disordered membrane (pure 1,2-dioleoyl-sn-glycero-3-phosphocholine (DOPC)). Our findings provide insight into how the natural digestion of the 2C6PC molecules in the micelles lead to their enhanced permeability and in turn may increase the delivery of any encapsulated drugs to the cell. In particular, we demonstrate the unique effects that each of the different components of the micelles has on the interfacial and structural properties of the two different membranes. Additionally, we show the different dynamical properties of the various molecules comprising the micelles have once they have inserted into each of the membranes.
2 Results
2.1 Interaction of micelles with membranes
The micelles in each of the simulated systems remained intact throughout the equilibration stages of the simulations, and therefore are still whole in the snapshots taken from the beginning of the production simulations (0 ns snapshot of Fig. 1 and 2). However, in all six of the simulated systems investigated, the micelles were found to disassociate to varying degrees during the production simulations of the micelles interacting with the membranes. Fig. 1 and 2 show the interaction and penetration of the constituent molecules of the three different micelles in the DOPC and DPPC-CHOL lipid membranes, respectively.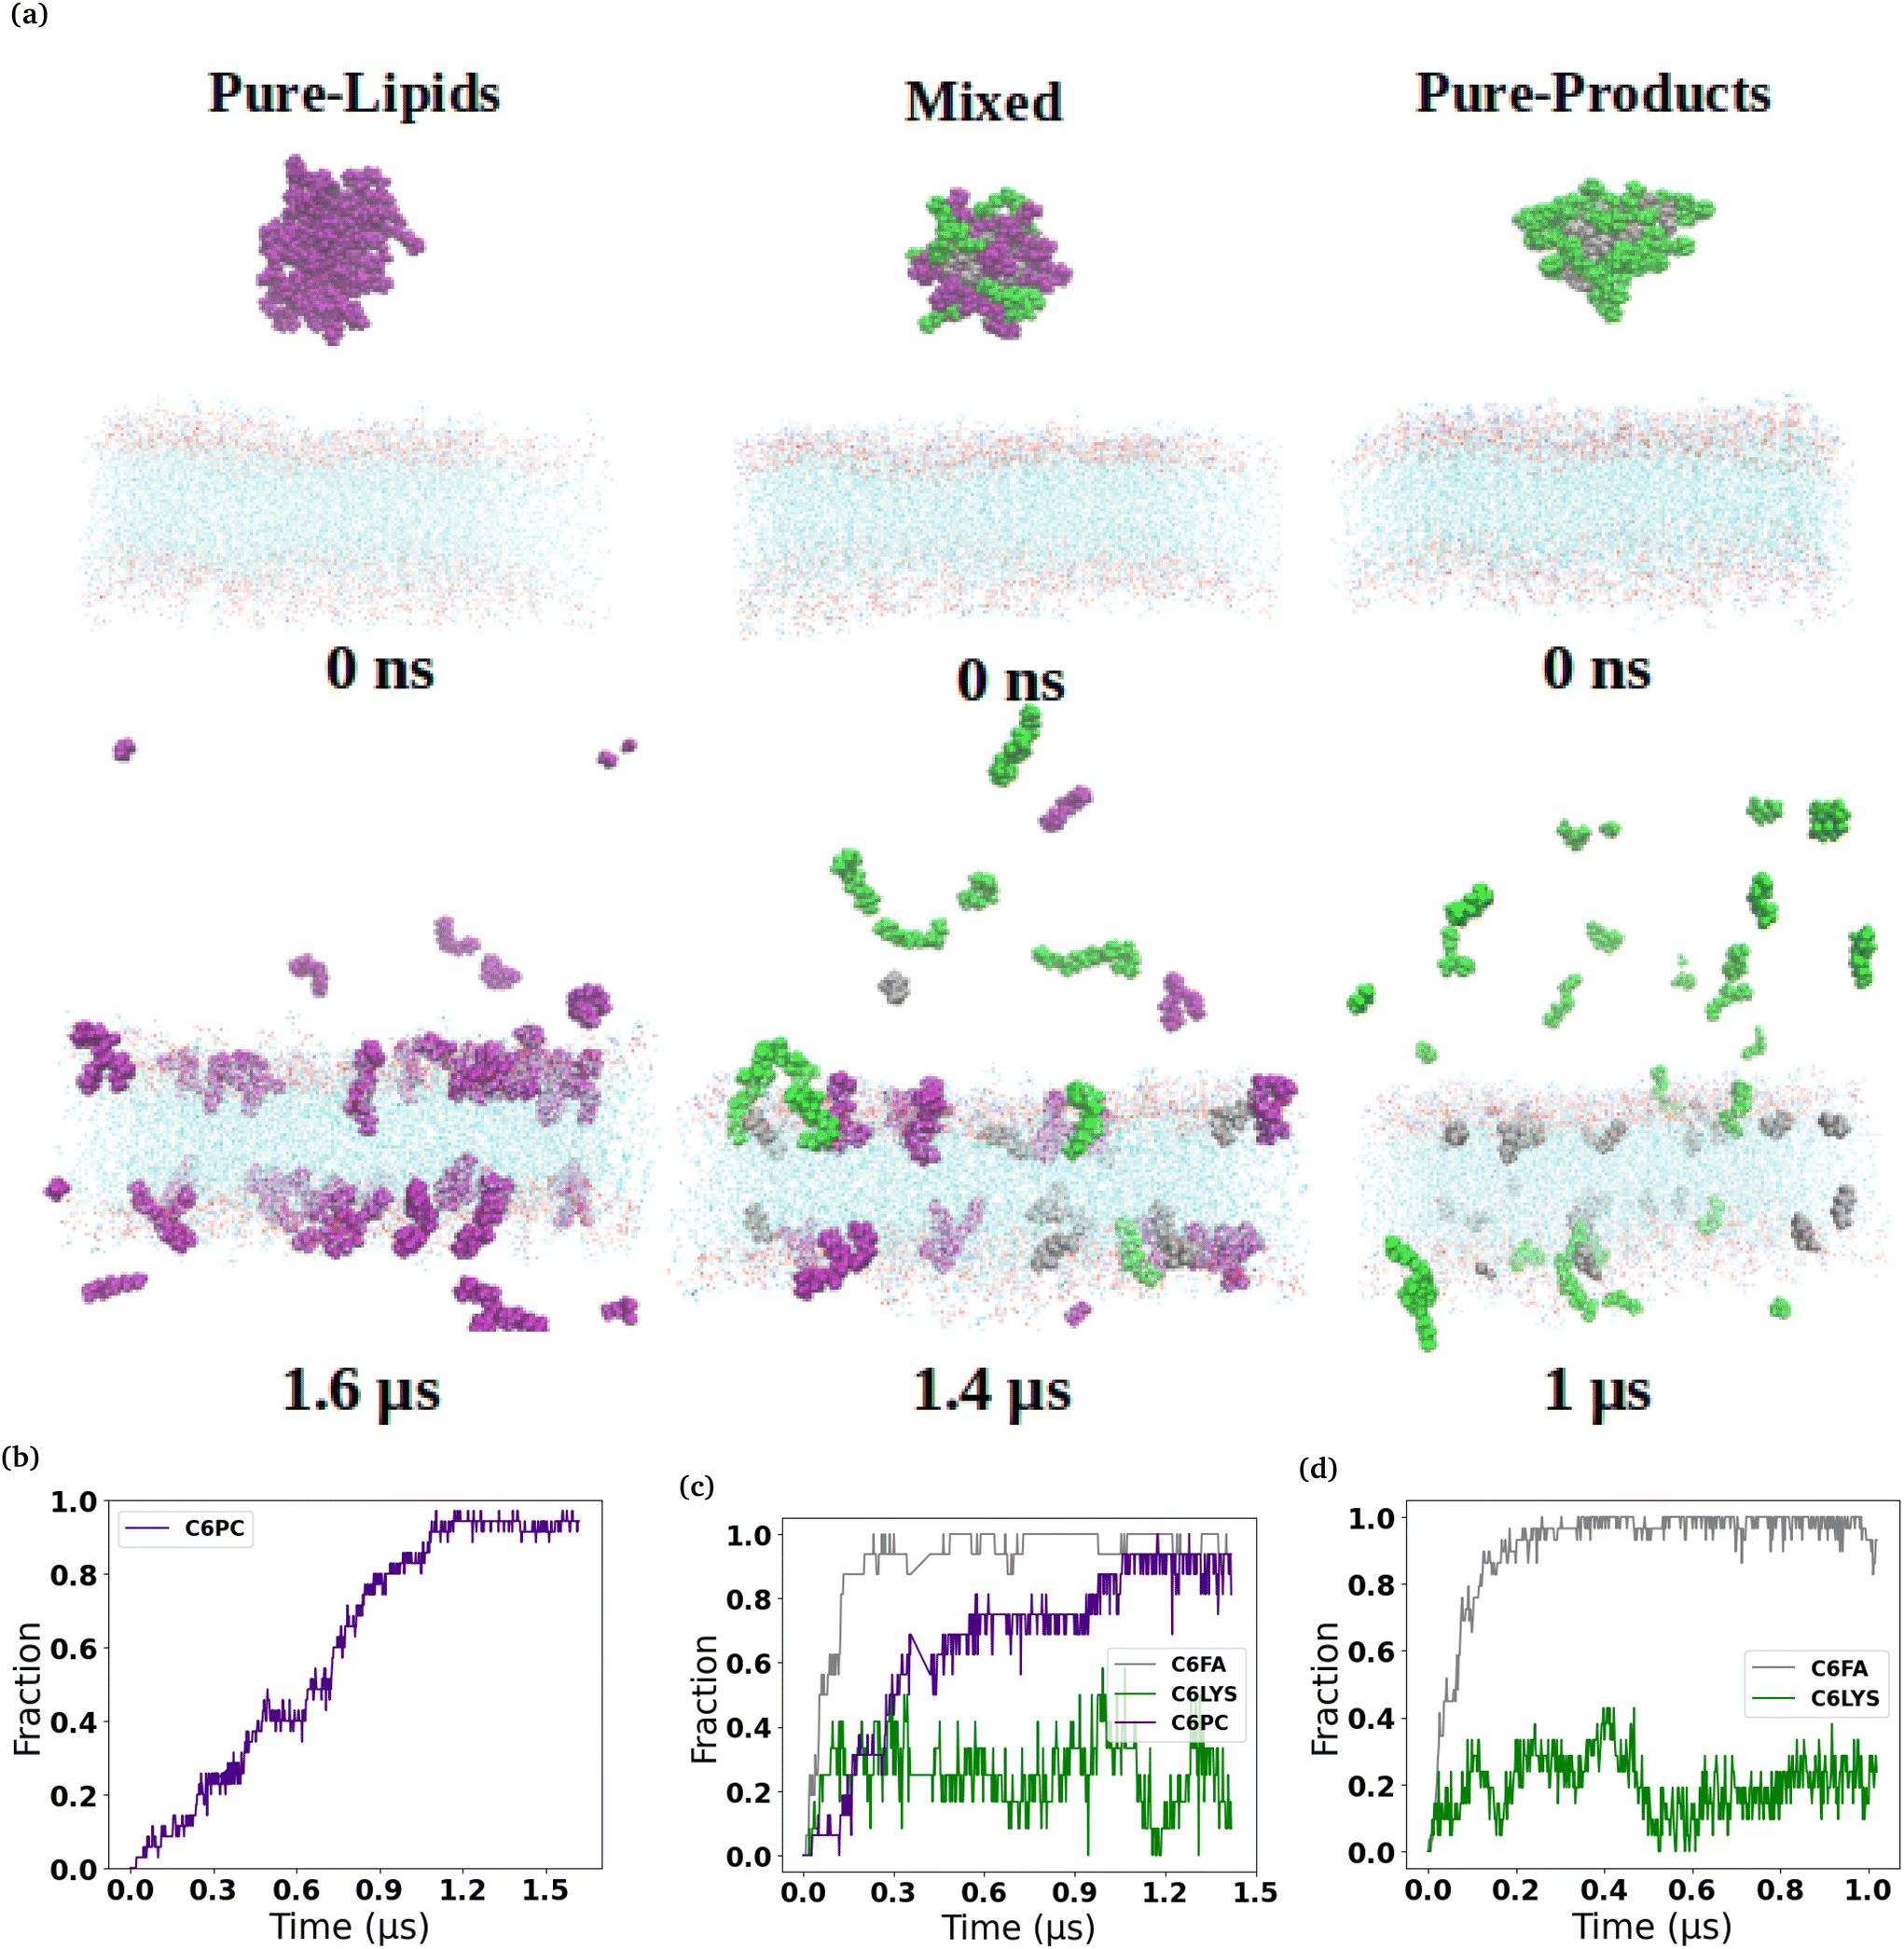 | ||
| Fig. 1 Interactions of micelles with the DOPC membrane. (a) Representative snapshots of three different lipid-based micelles (C6PC purple, C6FA sliver, C6LYS green) interacting with DOPC (cyan) membrane over time. From left to right, they are the Pure-Lipids, Mixed and Pure-Product systems, respectively. Water molecules and ions were removed for clarity. The fraction of the micelle molecules that have inserted into the membranes are shown in the bottom row for each of the three micelles (b–d). | ||
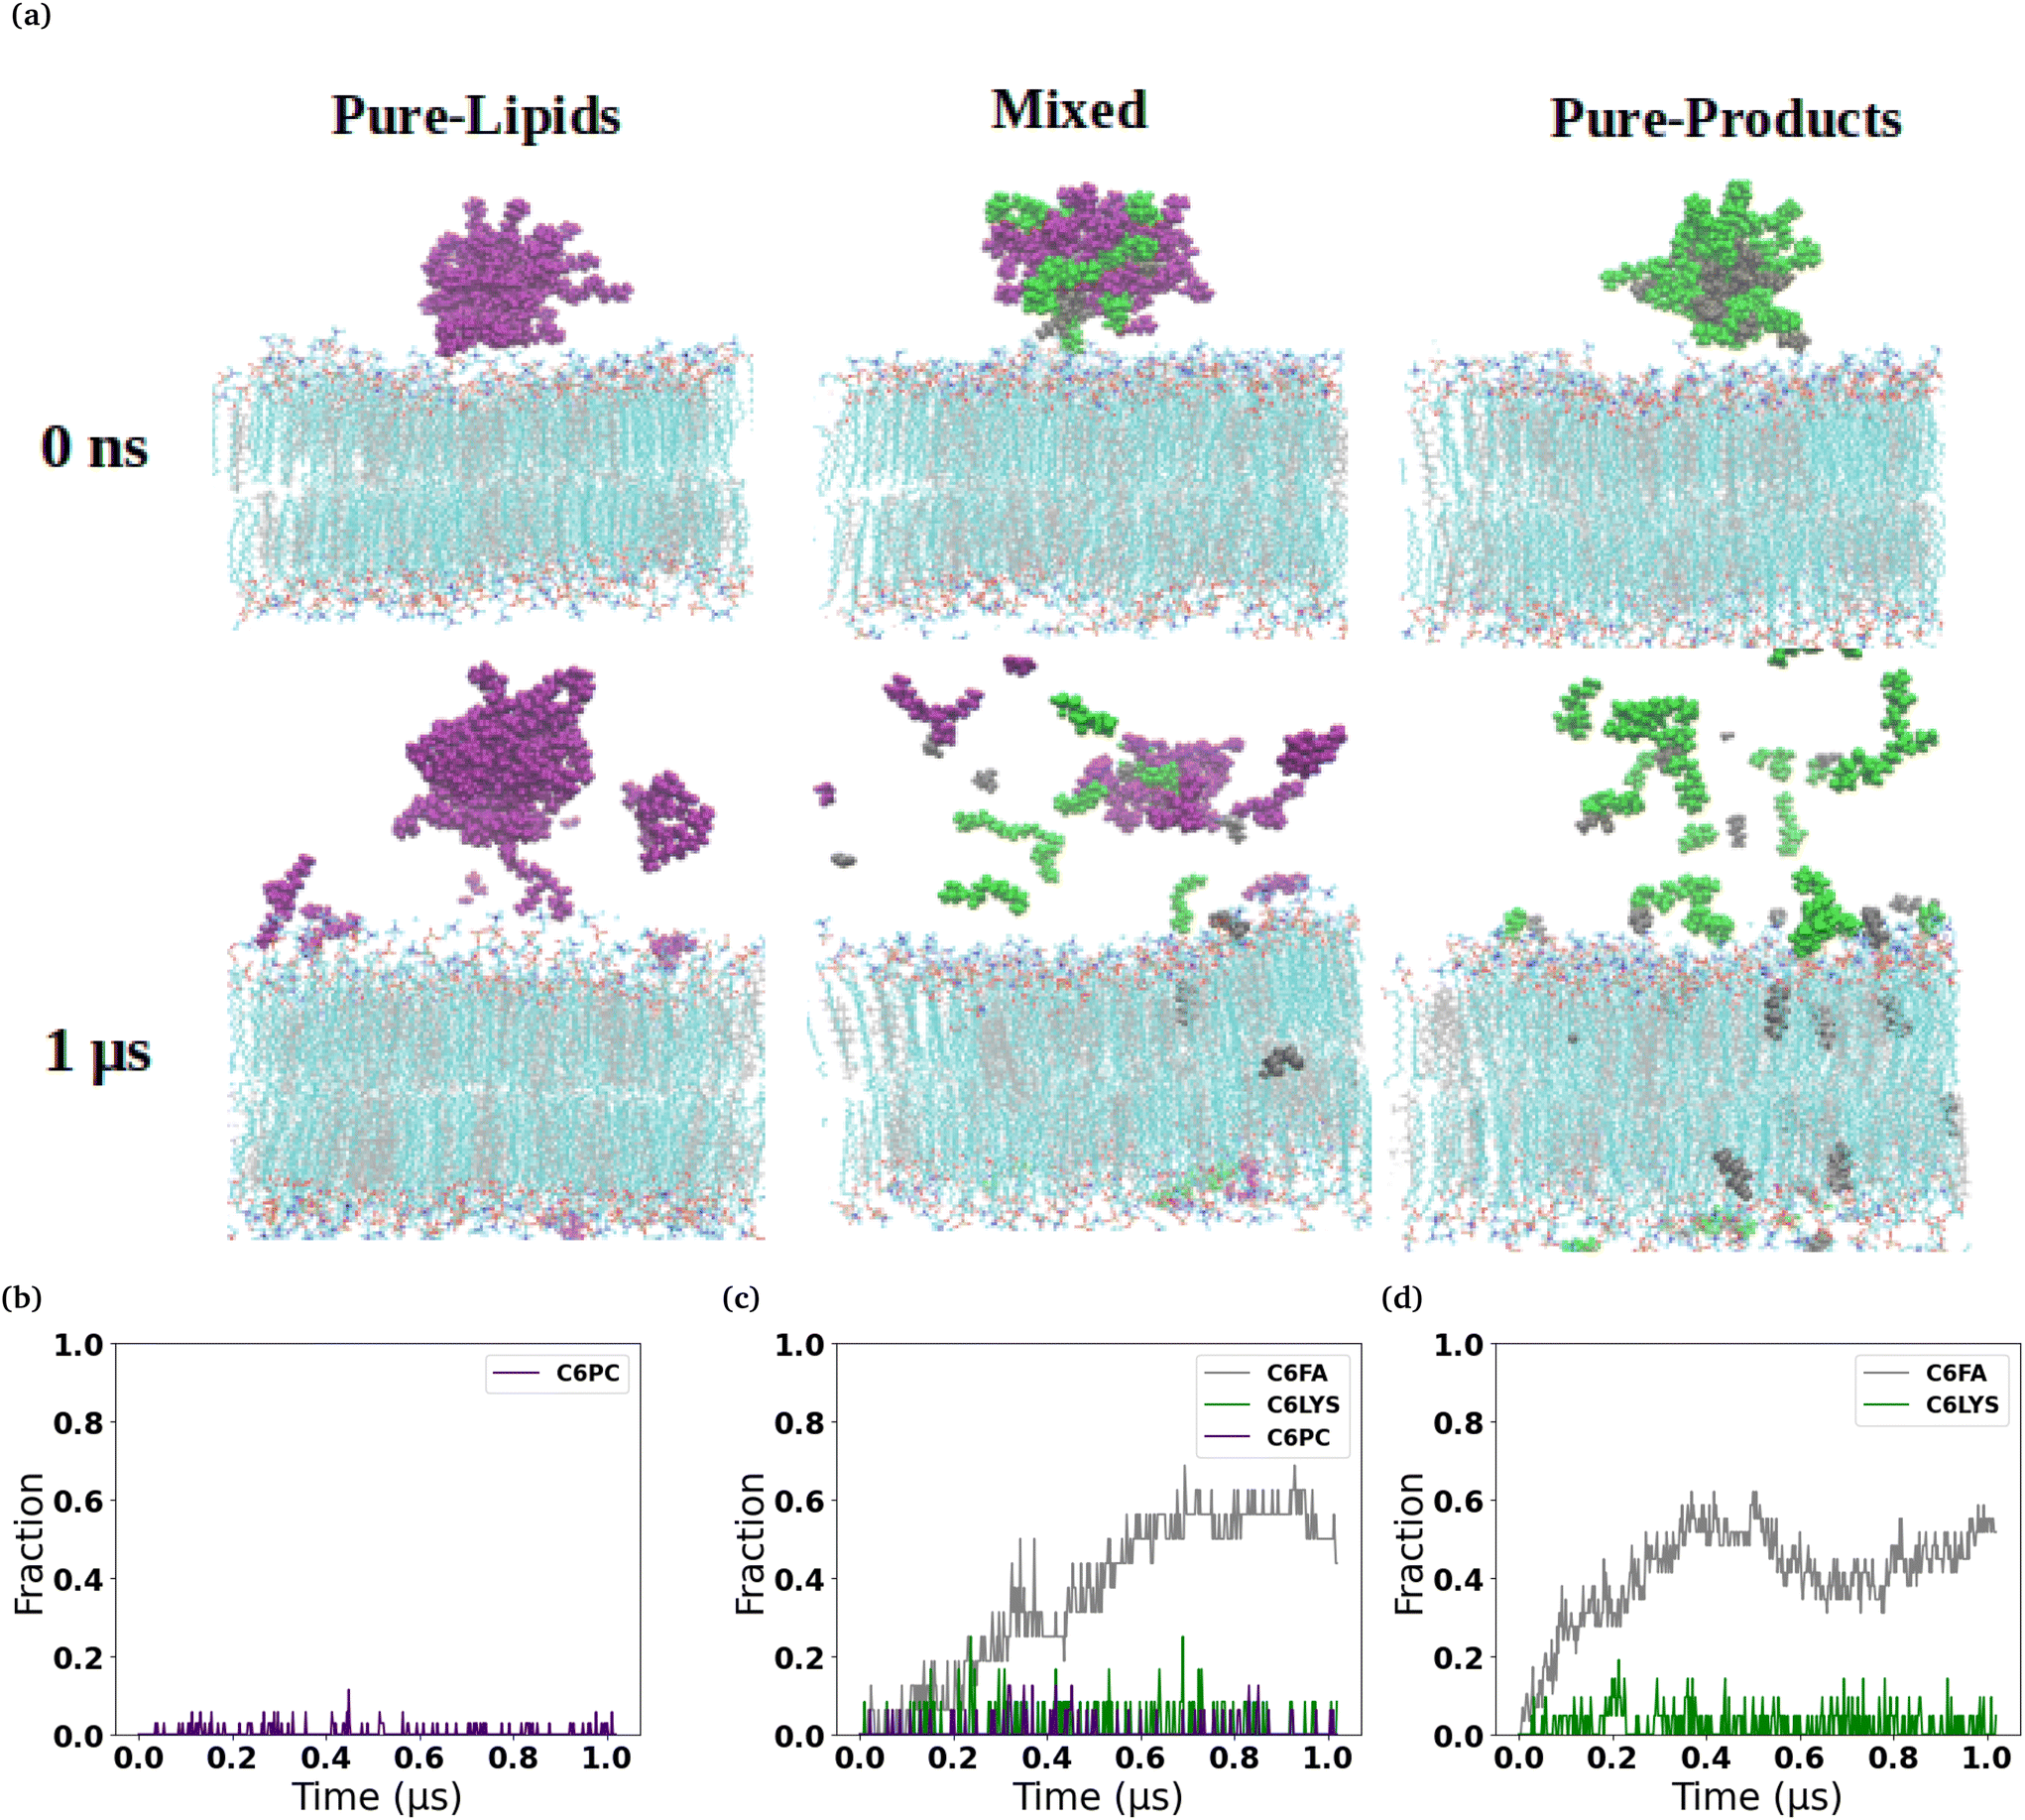 | ||
| Fig. 2 Interactions of micelles with DPPC-CHOL membrane. (a) Representative snapshots of three different lipid-based micelles (C6PC purple, C6FA sliver, C6LYS green) interacting with DPPC-CHOL (DPPC cyan, CHOL grey) membrane over time. From left to right, they are the Pure-Lipids, Mixed and Pure-Product systems, respectively. Water molecules and ions were removed for clarity. The fraction of the micelle molecules that have inserted into the membranes are shown in the bottom row for each of the three micelles (b–d). | ||
As each of the micelles begin to disassociate while interacting with the DOPC bilayer, the different molecular species approach the interface of the lipid bilayer and then penetrate into the membranes (see Fig. 1). The snapshots show that the C6FA, C6LYSO and 2C6PC molecules penetrate the pure DOPC lipid bilayer in differing amounts and to different depths. During this penetration, the C6FA molecules were the first species to insert into the lipid bilayer as they are small in size and are the most hydrophobic. We have extended the simulations with the product containing micelles in order to allow more time for various components to interact with the membranes.
We observed a significantly different behaviour of the micelles when they were interacting with the DPPC-CHOL membrane. Fig. 2 shows typical snapshots of the micelles during their interaction with the more ordered membrane over 1 μs. The three main differences are: (i) fewer molecules penetrate into the membrane than in the DOPC membrane and in particular there are very few C6LYSO or 2C6PC molecules inserted into lipid bilayer even after 1 μs; (ii) aggregates of the molecules in the Mixed and Pure-Lipids systems are observed throughout the production simulations, which is not the case when the micelles interacted with the pure DOPC membranes; and (iii) Pure-Lipids micelles are more likely to remain predominantly whole as some molecules are released and have less impact on the DPPC-CHOL membrane than they did on the DOPC membrane. The micelles destabilise as they begin interacting with the lipid membranes. Via visual inspection, we observe the micelles go through different aggregated states during their destabilization. As 2C6PC and C6FA molecules leave the micelles they interact with the lipid bilayers, while the C6LYS molecules remain isolated in solution. As a result, the different micelles demonstrate different rates of destabilization. For instance, the pure-lipid micelles demonstrated a longer duration of remaining intact compared to the other two, indicating its higher stability, which is in line with our previous findings.
The plots in the bottom row of Fig. 1 and 2 show the extent to which the various constituent molecules comprising the micelles insert into the lipid membranes. The trends shown in the plots are consistent with the trends observed visually in the snapshots for each system. In the DOPC membrane systems, nearly all of the C6FA molecules are fully inserted into the membrane after approximately 200 ns, indicating that the C6FA can easily penetrate into the membrane. As the 2C6PC molecules are larger and have a preference to interact with one another as opposed to inserting into the membrane, they are observed to more slowly migrate to the membrane's interface and penetrate into the membrane until an equilibrium was reached after ∼1.2 μs, as seen in Fig. 1(c) and (d). However, due to the more hydrophilic nature of C6LYS is the least likely molecule to penetrate the membrane, and as such seems to generally prefer to remain isolated in solution. In the DPPC-CHOL membrane, we find that approximately 40% less of the C6FA has inserted for the Pure-Products and Mixed systems than observed in the DOPC membrane (Fig. 2(b), (c) and Table 1). Additionally we observe that very few C6LYSO (∼8%) and 2C6PC (∼4%) molecules penetrate into the DPPC-CHOL membrane (Fig. 2(b–d) and Table 1).
| DOPC | DPPC-CHOL | |||||||
|---|---|---|---|---|---|---|---|---|
| Bilayer | PL | Mixed | PP | Bilayer | PL | Mixed | PP | |
| Thickness | 3.89 (0.04) | 3.73 (0.05) | 3.76 (0.04) | 3.83 (0.04) | 4.87 (0.06) | 4.60 (0.07) | 4.94 (0.03) | 4.85 (0.06) |
| APLPC | 0.68 (0.02) | 0.74 (0.02) | 0.72 (0.01) | 0.71 (0.01) | 0.58 (0.02) | 0.57 (0.01) | 0.59 (0.04) | 0.58 (0.03) |
| APLCHOL | — | — | — | — | 0.40 (0.03) | 0.41 (0.13) | 0.40 (0.07) | 0.40 (0.04) |
| f 2C6PC | — | 0.95 | 0.95 | — | — | 0.03 | 0.04 | — |
| f C6FA | — | — | 0.98 | 0.98 | 0.57 | 0.55 | — | — |
| f C6LYSO | — | — | 0.35 | 0.23 | — | — | 0.07 | 0.08 |
| 〈−SCH,sn1〉 | 0.122 | 0.115 | 0.115 | 0.117 | 0.425 | 0.422 | 0.421 | 0.422 |
| 〈−SCH,sn2〉 | 0.121 | 0.105 | 0.106 | 0.107 | 0.412 | 0.398 | 0.398 | 0.399 |
| n H2O | 14.7 (0.3) | 17.3 (0.6) | 15.9 (0.7) | 16.6 (0.4) | 7.8 (0.1) | 6.5 (0.1) | 7.2 (0.1) | 6.9 (0.1) |
The behaviour of the various molecules that comprise the micelles observed in our simulations are consistent with the critical micelle concentrations (cmc) that have been measured for these molecules experimentally. While there is not any published cmc values for C6LYSO, there are cmc values published for C8LYSO (57 mM), C10LYSO (5.7 mM) and C12LYSO (0.6 mM),40 so the cmc for C6LYSO would be greater than 57 mM. The cmc for 2C6PC was found to be ≈14 mM.41,42 As we have studied the free hexanoic acid (C6FA), there are no experimentally obtained cmc values, but a coarse-grain molecular dynamics simulation study reported a cmc of 9.26 mM at 50 °C, which is an order of magnitude larger than the cmc found for the sodium salt of hexanoic acid.43 Therefore the fact that we find that the C6LYSO is the least likely of the molecules to remain in the micelle or insert into the membrane, and that C6FA is the most likely to be in either environment agrees with the rank order of these cmc values.
2.2 Effect of micelles on membranes’ structural properties
In order to determine how the insertion of the micelle components into the membranes effect the structure of the lipid membranes, we measured the area per lipid for each lipid species, the membrane thickness, and the lipid order parameters. The area per lipid for the pure DOPC and DPPC-CHOL membrane systems are 0.68 nm2 and 0.57 nm2, respectively, which are consistent with those reported elsewhere.44–46 The area per lipid and membrane thickness for each simulated system as the micelles interact with the membranes are shown in Fig. 3. In the three DOPC systems, we observe that the area per lipid increases and the thickness decreases as more and more 2C6PC inserts into the membrane. In all three systems, the area per lipid is larger and the membrane thickness is smaller than those measured in the pure DOPC membrane (Fig. S13†). The same general trends are observed for the DPPC-CHOL membrane as well, where even the minimal amount of 2C6PC that is able to insert into the membrane results in a noticeable difference in the area and thickness of the membrane. Table 1 summarises the calculated values of area per lipid for all of the systems with the micelles.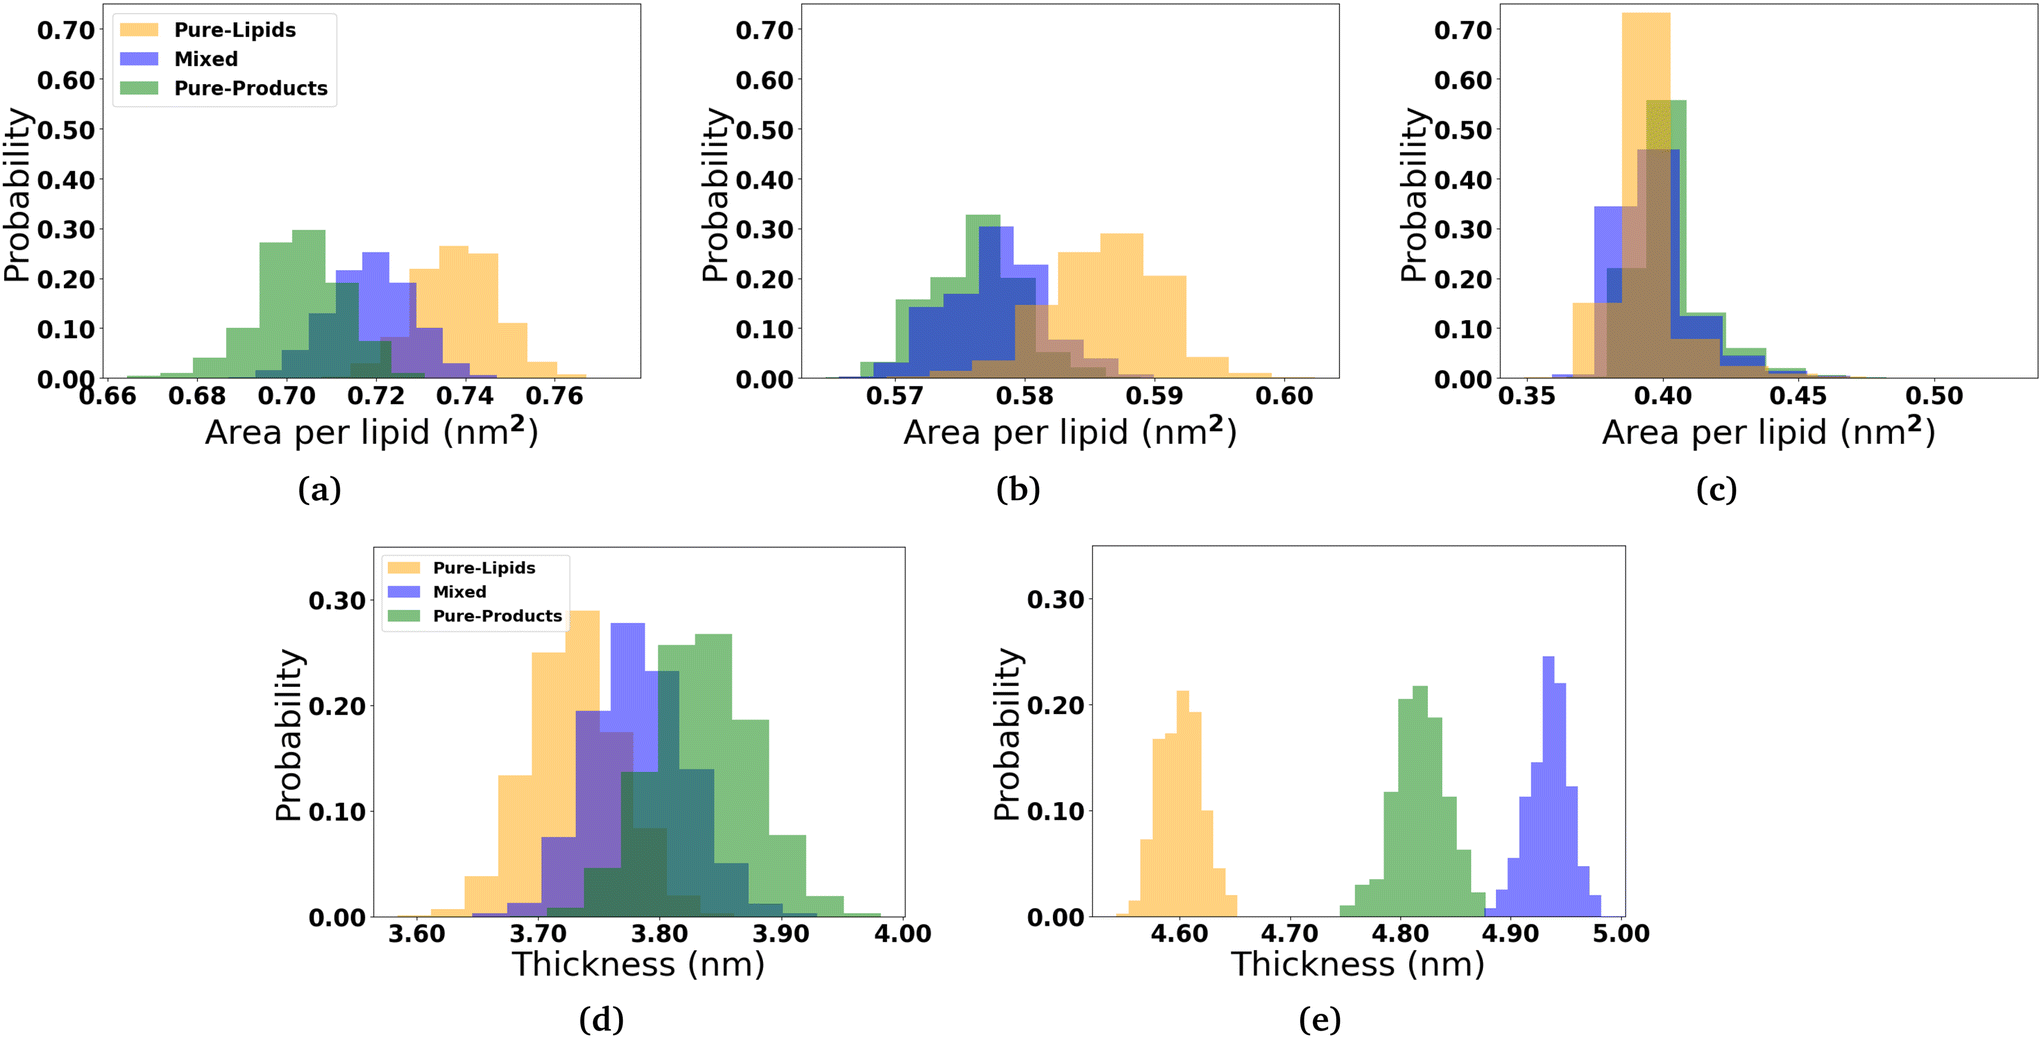 | ||
| Fig. 3 Effects of the micelles on the structure of the bilayers. The distribution of the area per lipid for the (a) DOPC lipids in the DOPC membrane and the (b) DPPC and (c) CHOL lipids in the DPPC-CHOL membrane are displayed. Also the distribution of the thickness of the (d) DOPC and (e) DPPC-CHOL membranes is also plotted. Analysis of micelle-membrane was calculated over the last 200 ns of the production simulations. | ||
2.3 Effect of micelles on the structure of lipid bilayers
To better understand the internal structure of the different bilayers after they interact with the molecules comprising the micelles, mass density profiles along the z-coordinate have been calculated (Fig. 4). In the DOPC membrane, of the three molecules comprising the micelles, the C6FA molecules insert the deepest into the membrane and are generally found amongst the ester groups of the lipids. Meanwhile, the 2C6PC molecules are found amongst the PC headgroups and the ester groups of the DOPC lipids, while the C6LYSO molecules are found amongst the PC headgroups.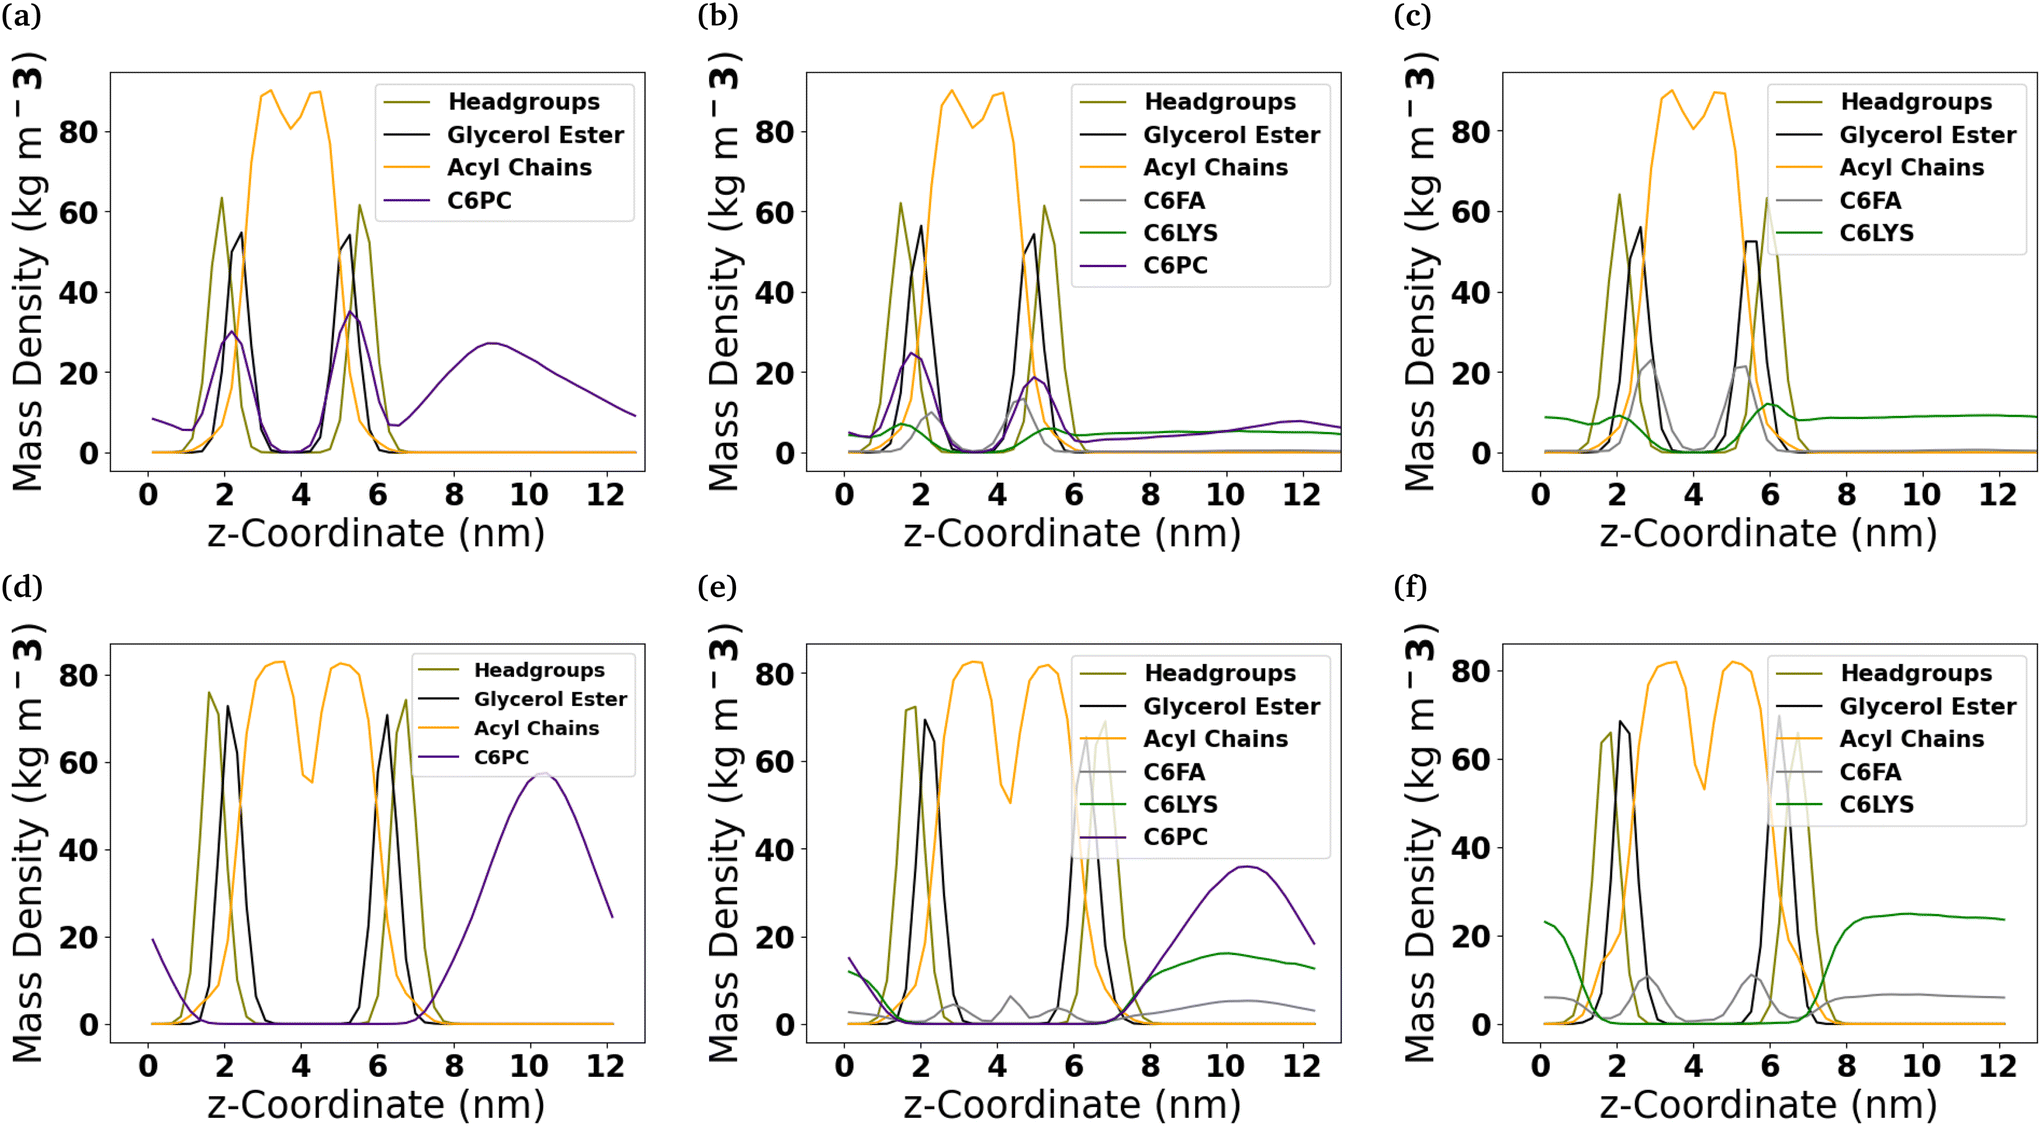 | ||
| Fig. 4 Location of molecules comprising the micelles within lipid membranes. Mass density profiles of the DOPC ((a)–(c)) and DPPC-CHOL ((d)–(f)) membrane systems which have interacted with the three micelles that were studied (Pure-Lipids, Mixed and Pure-Products, respectively). Headgroups refers to the choline and phosphate groups in the PC lipids. | ||
In the DPPC-CHOL membrane, only C6FA inserts into the membrane to a significant extent. The C6FA molecules insert slightly further into the hydrophobic region of the lipid membrane. It is note worthy that in the mixed micelle system, we do find some C6FA at the boundary of the two leaflets of the DPPC-CHOL membrane.
To understand the orientation of the C6FA molecules that have inserted into the DOPC membrane, we measured the angle formed by the vector which connects the terminal carbon (C2) in the hydrocarbon chain of the fatty acid to the double-bonded oxygen (O2) on the other end of the molecule and the z-axis that is normal to the membrane's interface (Fig. 5 and Table S2†). The C6FA molecules are primarily oriented with their carboxylic acid groups located in the same plane within the membrane as the ester groups of the phospholipids with water and their hydrocarbon tails in the hydrophobic core of the DOPC bilayer (cosθ ∼ 0.9). The mass density profiles of the –COOH and C2 groups in the C6FA molecules in the Pure-Products and Mixed micelle systems help to identify the depth and orientation after penetration. Fig. S8† shows that the C2 groups are closer to the mid-plane of the DOPC bilayer while the hydrophobic tails prefer to reside closer to the mid-plane than the COOH groups, indicating that the orientation of inserted C6FA tends to be parallel to the z-axis. The same behaviour is observed for C6FA when present in the DPPC-CHOL membrane, with there being a more significant difference in the mean z-positions of the –COOH and C2 groups indicating that the C6FA are less tilted in the DPPC-CHOL membrane. Also in the DPPC-CHOL membrane we observe that those C6FA molecules found in the bilayer's midplane are oriented parallel to the bilayer's interface.
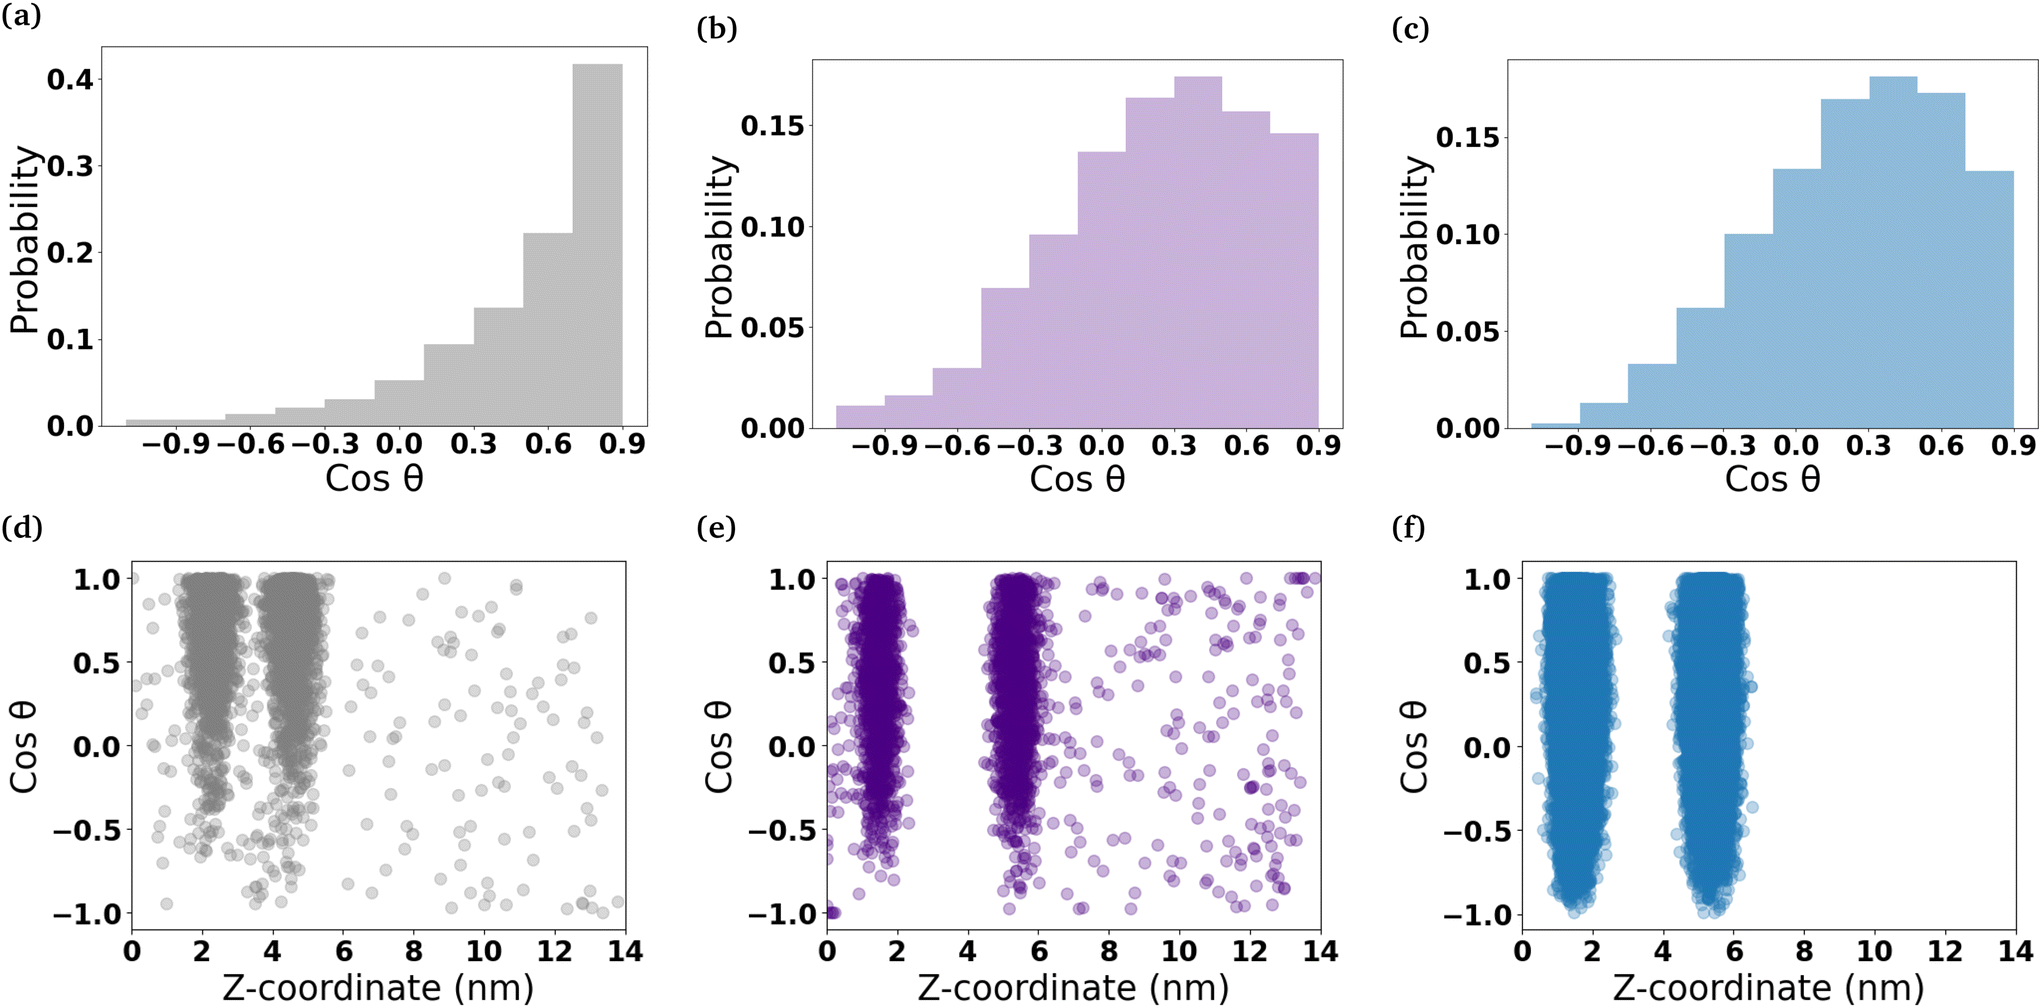 | ||
| Fig. 5 Orientation of micelle components within DOPC membranes. The histograms show the cosine of the tilt angles of the (a) C6FA molecules that have inserted into the DOPC bilayer. (b) and (c) show the distribution of the cosine of the head group tilt angles of the 2C6PC molecules that have inserted into the DOPC bilayers and the head group tilt angles for DOPC lipids in the membrane, respectively. The scatter plots show how the distribution of the orientation of the (d) C6FA molecules, (e) the 2C6PC lipid head group and (f) the DOPC lipid head group changes with the molecule's location in the z-dimension. | ||
The 2C6PC molecules are also found to insert with their tails within the hydrophobic core of the bilayer and the headgroups are solvated. The headgroups of the 2C6PC molecules inserted into the DOPC membrane are generally found to possess similar tilt angles as found for the DOPC lipids (cosθ ∼ 0.34) themselves. The tilt angle distribution measured for the DOPC lipids is similar to those reported elsewhere for DOPC membranes.47
The order parameter has been calculated to study the lipid tail flexibility and is also related to the membrane thickness. It was computed over the trajectories for both saturated and unsaturated acyl chain carbon atoms from the lipid molecules in the upper and lower leaflets separately. The results for the mixed micelle system are shown in Fig. S4,† and the behaviour in the other systems are nearly identical. Similar values of the lipid order parameter for DOPC (liquid-ordered) and DPPC-CHOL (liquid-disordered) membranes have been reported elsewhere.48,49 Interactions with the molecules from the various micelles result in a more significant disordering of the DOPC bilayer than the DPPC-CHOL bilayer as can be seen from the average values of the lipid order parameter for both of the sn1 (〈−SCH,sn1〉) and sn2 (〈−SCH,sn2〉) tails shown in Table 1. Recent studies have shown that the increased free volume in the middle of lipid bilayers is a result of the decreasing the values of the lipid order parameters.50,51 In our case, the localization of the molecules comprising the micelles within the middle of the bilayer promotes a slight disorganization of the carbons in both tails, which leads to the lateral expansion of the membranes.
The radial distribution functions (RDFs) were used to determine the distribution of water molecules around the PC headgroups of the DOPC and DPPC lipid molecules and around the oxygen in the hydroxyl group of the cholesterol molecules in our membranes. By calculating the integral of the RDF from 0 to a distance corresponding to the first peak minimum, the average number of waters in the first hydration shell can be estimated. The RDFs are shown in Fig. S5 and S6.† The calculated coordination numbers for the first shell and the coordination number of waters are reported in Table S3.† The insertion of 2C6PC in the various membrane systems was seen to result in a dehydration of the choline group within the headgroup of DOPC. This dehydration of the nitrogen atom in the choline group of the DOPC molecules is likely due to the large steric barrier that exists between the headgroups when more and more molecules were inserted into membranes. Whereas the hydration of the phosphate group is unchanged by the presence of the molecules comprising the micelles within the lipid bilayer. While significantly less 2C6PC inserts into the DPPC-CHOL membrane, there is still a slight dehydration observed of the choline group of the DPPC lipids.
We have also determined the amount of water that is found between the phosphorous atoms in the lipid headgroups in the upper and lower leaflets of the bilayers. The number of water molecules within the bilayer per lipid molecule in the bilayer is reported in Table 1. We see that in the DOPC membrane there is an increased amount of water molecules that permeate into the bilayer when the various components of the micelle are present. While, in contrast, in the case of the DPPC-CHOL membranes, there is a slight decrease in the amount of water present in the bilayer after interaction with the various molecules comprising the micelles. As the penetration of water molecules into lipid bilayers is regularly used to investigate the permeability of a membrane,52–54 these results demonstrate that as the micelle components partition into the membrane they increase the permeability of the disordered (DOPC) membranes.
2.4 Dynamics of micelle components within lipid bilayers
The motion of each molecule that was initially in a micelle was tracked in the z-dimension in each of the simulated systems (Fig. S10 and S11†). This allowed us to see that the C6FA molecules generally move to membranes’ interface quickly. 2C6PC molecules were also found to adsorb to the membrane interface, while the C6LYSO molecules, which are more hydrophilic than the other molecules comprising the micelles, remain isolated in solution for longer and when they do come to the membrane interface they only remain there for a relatively short period of time.Interestingly, we found that all of the micelle components have the ability to flip-flop across the lipid membranes, although we only observed the flip-flop of C6FA molecules across the DPPC-CHOL membrane. Table 2 contains the total number of flip-flops observed and the flip-flop rate for each molecule type in both membranes. The flip-flop rate is unchanged by the presence of the different molecules from the micelles within the membranes. However, as would be expected, we observe significantly less flip-flop of C6FA molecules within the more ordered DPPC-CHOL membrane than within the DOPC membrane.
| DOPC | DPPC-CHOL | |||||
|---|---|---|---|---|---|---|
| System | PL | Mixed | PP | PL | Mixed | PP |
| 2C6PC | 3 (0.1) | 2 (0.2) | — | 0 (0) | 0 (0) | — |
| C6FA | — | 42 (1.8) | 54 (1.9) | — | 11 (0.7) | 22 (0.8) |
| C6LYSO | — | 16 (0.8) | 18 (0.9) | — | 0 (0) | 0 (0) |
In order to determine whether the micelle components aggregate with one another within the DOPC membrane, we have calculated the lipid enrichment index over the final 200 ns of each of those simulations. The lipid enrichment values are representative of the local environment in the membranes.55 Fig. S12† shows that none of the micelle components (2C6PC, C6FA & C6LYSO) aggregate with one another within the membrane, as generally their respective enrichment indices are lower than 1.
3 Conclusion
In this manuscript, we have used all-atom molecular dynamics simulations to investigate how the C6 phosphocholine micelles at various stages of digestion after exposure to the sPLA2 enzyme interact with a disordered and an ordered lipid bilayer. We observed that as the micelles begin to interact with the bilayers they disassociate and release the various components of the micelles although each of the molecules comprising the micelles behaves differently. The 2C6PC molecules are more preferably found within a micelle and therefore we observe an aggregate remaining as the disassociation progresses, although as the molecules are released they diffuse to the interface of the membranes and insert into the bilayers. In contrast, the lysophosphocholine (C6LYSO) molecules become solvated in the aqueous environment and commonly remain isolated in solution, but occasionally they adsorb reversibly to the interface of the bilayers. The C6FA molecules are found to disassociate from the micelles as they appear to prefer to absorb into the lipid bilayers.The various types of molecules in the micelles then penetrate the two different lipid bilayers to differing degrees with more of each component inserting into the disordered DOPC membrane than into the ordered DPPC-CHOL membrane. This is due to the fact that there is less free volume available for the molecules to insert into the DPPC-CHOL membrane than in the DOPC membrane. Similar trends in the absorption of lysolipids and fatty acids with 10–16 carbons in their hydrocarbon chains have been observedexperimentally.56
We found that each of the micelle components impact the structural properties of the lipid membranes to differing degrees. However, the insertion of the molecules have the same general effect on both membranes. Specifically, the products of the lipid digestion (C6FA & C6LYSO) result in a small increase in the area per lipid of the phosphocholine lipids in each membrane and a slight thinning of both membranes. This is consistent with various studies that found that when fatty acids and lysolipids are added together to liquid ordered and liquid disordered membranes they have little to no effect on the permeation of small molecules into the membranes.36,38,39,57 However, the 2C6PC molecules have more of an impact on the area per lipid and the thinning of the membranes.
In addition to the difference in the structural properties caused by each micelle component, we also found that they demonstrate different dynamic properties within the bilayers. The C6FA molecules are found to flip-flop across the bilayers significantly more and more frequently than either the C6LYSO and 2C6PC molecules. This results from the C6FA being the least hydrated of any of the micelle components when inserted into the membrane and also they are significantly smaller than the 2C6PC molecules. Previously, longer fatty acid chains have been observed to flip-flop across lipid membranes of varying composition.58–61
The findings presented in this manuscript provide the first atomistic understanding of how a combination of lipids and their digestion products affects model lipid membranes. In doing so, we have shown that each micellar component has differing degrees of effect on the interfacial and structural properties of the two model membranes studied. Additionally we have shown that the molecules comprising the micelles have significantly different dynamic properties once they are inserted within the two bilayers. These results will be of particular interest when considering the design of novel lipid-based drug delivery vehicles.
This is of particular interest when considering the application of phospholipid drug delivery vehicles for anticancer therapeutics. The concentration of the sPLA2 enzyme is elevated in cancerous cells which would then lead to a more rapid digestion of the phospholipids into the corresponding lysolipids and fatty acids. Our previous work2 showed that the phospholipid micelles were stable and as the amount of lysolipids and fatty acids increased in the micelles, they became increasingly dynamic. Therefore these phospholipid micelles would then preferentially release their payload near cancerous cells where the action of sPLA2 would be enhanced. In this manuscript, we have gone on to show that the lysolipids and fatty acids produced during the digestion of the phospholipids then result in the increased permeability of lipid membranes which would result in faster diffusion of the therapeutics into the cancerous cells. Therefore phospholipid drug delivery vehicles may prove to be promising anti-cancer formulations moving forward.
4 Methods
4.1 System setup
In this study, we used all-atom molecular dynamics simulations to investigate the interactions between micelles containing 2C6PC and its hydrolysis products and a model disordered and ordered lipid membranes. Firstly, two model lipid membranes were equilibrated: (i) a DOPC membrane (disordered) and (ii) a membrane consisting of 70 mol% DPPC and 30 mol% cholesterol (ordered). In order to insure that the micelles would not interact with themselves through the periodic boundary conditions, the interfacial area of each membrane was chosen such that it was greater than twice the diameter of the largest micelle we planned to investigate in subsequent simulations. The chemical structures of the various lipid molecules comprising the membranes are shown in Fig. S2† while snapshots of the two membranes are shown in Fig. S3.†Both of the lipid bilayers studied were generated by using the CHARMM-GUI Membrane Builder.62 The bilayers were neutralised using a salt concentration of 150 mM NaCl to mimic the physiological environment. Table S1† contains the molecular composition of both types of bilayers. The initial dimensions of the simulated lipid bilayer systems were 10.8 nm × 10.8 nm × 9.0 nm (x × y × z dimensions).
These bilayers were equilibrated using the simulation protocol prescribed by CHARMM-GUI, whereby (i) initial structures were energy minimized using steepest descent, (ii) systems were equilibrated using the NVT (constant number of particles, volume, and temperature) followed by the NPT (constant number of particles, pressure, and temperature) ensembles for at least 1.8 ns, and (iii) finally, MD production simulations were performed using the NPT ensemble for 200 ns.
Subsequently, we investigated the interactions between micelles representing varying degrees of digestion of the 2C6PC molecules and each of the two lipid membranes. Three different micelle compositions (namely, Pure-Lipid, Mixed & Pure-Products system) were investigated according to the percentage of 2C6PC that had been degraded. The Pure-Lipid micelle system contains only 2C6PC. The Mixed micelle represents the state where approximately half of the 2C6PC have been digested and therefore contains a mixture of the parent molecule and both of the hydrolysis products (C6FA & C6LYSO). Finally the Pure-Products micelle represents the aggregate formed when after all of the 2C6PC has been hydrolysed and as a consequence contains only C6FA and C6LYSO. The equilibrated structure of each micelle as reported in our previous study2 was used as an initial state of the micelle in the simulations reported here. The number of each type of molecule in the various micelles is given in Table S1.† We then created six different systems, each one contained a single micelle inserted into the aqueous environment approximately 2 nm above the surface of the equilibrated ordered or disordered membrane. Additional water and ions were added to fully solvate the system and to maintain an ionic concentration of 150 mM NaCl. Each of the micelle and bilayer systems had initial dimensions of 11 nm × 11 nm × 13 nm. A detailed description of the molecular components found in the simulations of the two pure lipid membranes, and the six different micelle and membrane systems is given in Table S1† and their chemical structures can be found in Fig. S1 and S2.† The six resulting systems were then simulated by using the same protocol as described above for the two pure membrane systems, and the parameters suggested by CHARMM-GUI. The starting configurations were first energy minimized in order to remove any possible bad contacts and then six short equilibration simulations (a mixture of NVT and NPT) were performed before the production simulations of at least 1 μs was conducted.
The TIP3P and the CHARMM36 forcefields63 were used for water and all of the lipid molecules, respectively. Periodic boundary conditions were applied in all three dimensions for the simulated systems. All simulations were carried out using the GROMACS MD engine.64 In the production simulations, the temperature was maintained at 310 K with the Nosé–Hoover thermostat with a time constant of 5 ps.65,66 Semi-isotropic pressure coupling was used to maintain a pressure of 1 bar with the Parrinello–Rahman barostat,67,68 using a time constant of 5 ps and a standard compressibility of 4.5 × 10⁻⁵ per bar. The Verlet cutoff scheme was employed. Electrostatic interactions were calculated using the particle-mesh Ewald algorithm. Both electrostatic and van der Waals interactions were cut off beyond 1.2 nm. All bonds involving hydrogen atoms were constrained using the LINCS algorithm.69
4.2 Analysis
In the simulated systems, the membranes are oriented such that their component molecules lie in the xy-plane with their normal vector in the z-direction and their hydrophilic head groups on the exterior surfaces of the membrane. The membrane thickness therefore was determined by calculating the difference between the average z position of the phosphorous atoms of the PC lipid headgroups in the upper leaflet of the membrane and the average z position of the phosphorous atoms of the PC lipids in the membrane's lower leaflet.The area per lipid (APL) was calculated using the Voronoi tessellation scheme found in the FATSLiM python package.70 The mass density profile for the membrane systems was obtained utilizing the gmx density tool in the Gromacs package. Using this tool we are able to find the average distribution of different atom/molecules as a function of the z-axis.
The lipid order parameter of each chain SCH was calculated using eqn (1):
 | (1) |
In order to investigate if there was any preferential interaction of the various components of the micelles with each other or with components of the lipid membranes, a lipid enrichment index was used, which was defined as:
 | (2) |
The tilt angles of the headgroups of the PC lipid molecules are defined as the angle between the vector formed between the atom P and N in the PC headgroup and the z-axis (see Fig. S2†). Meanwhile, the tilt angle of hexanoic acid (C6FA) is measured from the angle between the vector connecting the C2 and O2 atoms (see Fig. S8†) and the z-axis.74 Moreover, the z-coordinates of each molecule has been measured as a function of time in order to track each molecules’ position.
Finally, radial distribution functions (RDFs) were calculated by using the gmx rdf command. The RDF measures the probability of finding a specific particle (B) at a distance r from another particle (A) as shown in eqn (3):
 | (3) |
Snapshots of the simulation systems were created using Visual Molecular Dynamics (VMD).75 In addition to using the gromacs tools noted above, all other analysis was carried out with a mixture of python scripts developed in house and functions found in LiPyphilic.74
Author contributions
Jun Xie: data curation, formal analysis, investigation, methodology, software, validation, visualisation, writing – original draft, writing – review & editing. Demi L. Pinke: conceptualization, writing – review & editing. M. Jayne Lawrence: conceptualization, supervision, writing – review & editing. Christian D. Lorenz: conceptualization, funding acquisition, project administration, resources, supervision, writing – review & editing.Conflicts of interest
There are no conflicts to declare.Acknowledgements
We are grateful to the UK Materials and Molecular Modelling Hub for computational resources, which is partially funded by EPSRC (EP/T022213/1, EP/W032260/1 and EP/P020194/1), and the UK HPC Materials Chemistry Consortium, which is also funded by EPSRC (EP/R029431), for providing us access to computational resources. This work also benefited from access to the King's Computational Research, Engineering and Technology Environment (CREATE) at King's College London.76 J. X. acknowledges the support by King's-China Scholarship Council PhD studentship (KCL-CSC). For the purpose of open access, the author has applied a Creative Commons Attribution (CC BY) licence (where permitted by UKRI, ‘Open Government Licence’ or ‘Creative Commons Attribution No-derivatives (CC BY-ND) public copyright licence’ may be stated instead) to any Author Accepted Manuscript version arising.References
- H. Ishkhanyan, R. M. Ziolek, D. J. Barlow, M. J. Lawrence and C. D. Lorenz, Nanoscale, 2022, 14, 5392–5403 RSC.
- D. L. Pink, F. Foglia, D. J. Barlow, M. J. Lawrence and C. D. Lorenz, Small, 2021, 17, 2004761 CrossRef CAS PubMed.
- D. L. Pink, O. Loruthai, R. M. Ziolek, A. E. Terry, D. J. Barlow, M. J. Lawrence and C. D. Lorenz, J. Colloid Interface Sci., 2021, 597, 278–288 CrossRef CAS PubMed.
- D. L. Pink, O. Loruthai, R. M. Ziolek, P. Wasutrasawat, A. E. Terry, M. J. Lawrence and C. D. Lorenz, Small, 2019, 15, 1903156 CrossRef CAS PubMed.
- D. T. Allen, Y. Aaaka, M. J. Lawrence and C. D. Lorenz, J. Phys. Chem. B, 2014, 118, 13192–13201 CrossRef CAS PubMed.
- S. Senapati, A. K. Mahanta, S. Kumar and P. Maiti, Signal Transduction Targeted Ther., 2018, 3, 7 CrossRef PubMed.
- D. E. Large, J. R. Soucy, J. Hebert and D. T. Auguste, Adv. Ther., 2019, 2, 1800091 CrossRef.
- A. P. Singh, A. Biswas, A. Shukla and P. Maiti, Signal Transduction Targeted Ther., 2019, 4, 33 CrossRef PubMed.
- B. Das, D. Chattopadhyay and D. Rana, Biomater. Sci., 2020, 8, 4665–4691 RSC.
- A. S. Piotrowski-Daspit, A. C. Kauffman, L. G. Bracaglia and W. M. Saltzman, Adv. Drug Delivery Rev., 2020, 156, 119–132 CrossRef CAS PubMed.
- Y.-B. Miao, Y.-J. Lin, K.-H. Chen, P.-K. Luo, S.-H. Chuang, Y.-T. Yu, H.-M. Tai, C.-T. Chen, K.-J. Lin and H.-W. Sung, Adv. Mater., 2021, 33, 2104139 CrossRef CAS PubMed.
- D. E. Large, R. G. Abdelmessih, E. A. Fink and D. T. Auguste, Adv. Drug Delivery Rev., 2021, 176, 113851 CrossRef CAS PubMed.
- K. Paunovska, D. Loughrey and J. E. Dahlman, Nat. Rev. Genet., 2022, 23, 265–280 CrossRef CAS PubMed.
- L. Xu, X. Wang, Y. Liu, G. Yang, R. J. Falconer and C.-X. Zhao, Adv. NanoBiomed Res., 2022, 2, 2100109 CrossRef CAS.
- R. R. Sawant and V. P. Torchilin, Mol. Membr. Biol., 2010, 27, 232–246 CrossRef CAS PubMed.
- J. Li, X. Wang, T. Zhang, C. Wang, Z. Huang, X. Luo and Y. Deng, Asian J. Pharm. Sci., 2015, 10, 81–98 CrossRef.
- Z. Gao, A. N. Lukyanov, A. R. Chakilam and V. P. Torchilin, J. Drug Targeting, 2003, 11, 87–92 CrossRef CAS PubMed.
- C. Zimmer, J. Corum, S.-L. Wee and M. Kristoffersen, Coronavirus vaccine tracker, 2020, https://www.nytimes.com/interactive/2020/science/coronavirus-vaccine-tracker.html Search PubMed.
- E. A. Dennis, P. L. Darke, R. A. Deems, C. R. Kensil and A. Plückthun, Mol. Cell. Biochem., 1981, 36, 37–45 CrossRef CAS PubMed.
- D. A. Six and E. A. Dennis, Biochim. Biophys. Acta, Mol. Cell Biol. Lipids, 2000, 1488, 1–19 CrossRef CAS PubMed.
- G. Lambeau and M. H. Gelb, Annu. Rev. Biochem., 2008, 77, 495–520 CrossRef CAS PubMed.
- W. Pruzanski and P. Vadas, J. Rheumatol., 1988, 15, 1601–1603 CAS.
- S. Yamashita, J. Yamashita and M. Ogawa, Br. J. Cancer, 1994, 69, 1166–1170 CrossRef CAS PubMed.
- H. Kiyohara, H. Egami, H. Kako, Y. Shibata, K. Murata, S. Ohshima, K. Sei, S. Suko, R. Kurano and M. Ogawa, Int. J. Pancreatol., 1994, 13, 49–57 CrossRef PubMed.
- S. Yamashita, J. Yamashita, K. Sakamoto, K. Inada, Y. Nakashima, K. Murata, T. Saishoji, K. Nomura and M. Ogawa, Cancer, 1993, 71, 3058–3064 CrossRef CAS PubMed.
- J. R. Graff, B. W. Konicek, J. A. Deddens, M. Chedid, B. M. Hurst, B. Colligan, B. L. Neubauer, H. W. Carter and J. H. Carter, Clin. Cancer Res., 2001, 7, 3857–3861 CAS.
- L. Leistad, A. J. Feuerherm, M. Ostensen, A. Faxvaag and B. Johansen, Clin. Chem. Lab. Med., 2004, 42, 602–610 CAS.
- B. Rosengren, A. C. Jonsson-Rylander, H. Peilot, G. Camejo and E. Hurt-Camejo, Biochim. Biophys. Acta, Mol. Cell Biol. Lipids, 2006, 1761, 1301–1308 CrossRef CAS PubMed.
- Q. Dong, M. Patel, K. F. Scott, G. G. Graham, P. J. Russell and P. Sved, Cancer Lett., 2006, 240, 9–16 CrossRef CAS PubMed.
- E. A. Dennis, J. Cao, Y.-H. Hsu, V. Magrioti and G. Kokotos, Chem. Rev., 2011, 111, 6130–6185 CrossRef CAS PubMed.
- K. Jørgensen, J. Davidsen and O. G. Mouritsen, FEBS Lett., 2002, 531, 23–27 CrossRef PubMed.
- T. L. Andresen, J. Davidsen, M. Begtrup, O. G. Mouritsen and K. Jørgensen, J. Med. Chem., 2004, 47, 1694–1703 CrossRef CAS PubMed.
- G. Zhu, J. N. Mock, I. Aljuffali, B. S. Cummings and R. D. Arnold, J. Pharm. Sci., 2011, 100, 3146–3159 CrossRef CAS PubMed.
- F. Fouladi, K. J. Steffen and S. Mallik, Bioconjugate Chem., 2017, 28, 857–868 CrossRef CAS PubMed.
- F. Movahedi, R. G. Hu, D. L. Becker and X. Xu, Nanomedicine, 2015, 11, 1575–1584 CrossRef CAS PubMed.
- J. Davidsen, O. G. Mouritsen and K. Jørgensen, Biochim. Biophys. Acta, 2002, 1564, 256–262 CrossRef CAS PubMed.
- R. de la Rica, D. Aili and M. M. Stevens, Adv. Drug Delivery Rev., 2012, 64, 967–978 CrossRef CAS PubMed.
- H. Jespersen, J. H. Andersen, H. J. Ditzel and O. G. Mouritsen, Biochimie, 2012, 94, 2–10 CrossRef CAS PubMed.
- A. Arouri, K. E. Lauritsen, H. L. Nielsen and O. G. Mouritsen, Chem. Phys. Lipids, 2016, 200, 139–146 CrossRef CAS PubMed.
- V. V. Kumar and W. J. Baumann, Biophys. J., 1991, 59, 103–107 CrossRef CAS PubMed.
- P. Martinez-Landeira, J. L. Lopez-Fontan, J. M. Ruso, G. Prieto and F. Sarmiento, Colloids Surf., A, 2003, 216, 91–96 CrossRef CAS.
- R. J. M. Tausk and J. T. G. Overbeek, Biophys. Chem., 1974, 2, 175–179 CrossRef CAS PubMed.
- M. S. Hossain, S. Berg, C. A. S. Bergstrom and P. Larsson, AAPS PharmSciTech, 2019, 20, 61 CrossRef CAS PubMed.
- O. Edholm and J. F. Nagle, Biophys. J., 2005, 89, 1827–1832 CrossRef CAS PubMed.
- N. Kučerka, S. Tristram-Nagle and J. F. Nagle, Biophys. J., 2006, 90, L83–L85 CrossRef PubMed.
- A. I. Greenwood, S. Tristram-Nagle and J. F. Nagle, Chem. Phys. Lipids, 2006, 143, 1–10 CrossRef CAS PubMed.
- S. M. Yee, R. J. Gillams, S. E. McLain and C. D. Lorenz, Soft Matter, 2021, 17, 126–135 RSC.
- A. Suhaj, A. Le Marois, D. J. Williamson, K. Suhling, C. D. Lorenz and D. M. Owen, Phys. Chem. Chem. Phys., 2018, 20, 16060–16066 RSC.
- A. Suhaj, D. Gowland, N. Bonini, D. M. Owen and C. D. Lorenz, J. Phys. Chem. B, 2020, 124, 11419–11430 CrossRef CAS PubMed.
- M. F. Martini and M. Pickholz, Int. J. Quantum Chem., 2012, 112, 3341–3345 CrossRef CAS.
- M. Pickholz, L. F. Fraceto and E. de Paula, Synth. Met., 2009, 159, 2157–2158 CrossRef CAS.
- S. J. Marrink and H. J. C. Berendsen, J. Phys. Chem., 1996, 100, 16729–16738 CrossRef CAS.
- R. M. Venable, A. Kramer and R. W. Pastor, Chem. Rev., 2019, 119, 5954–5997 CrossRef CAS PubMed.
- A. Kramer, A. Ghysels, E. Wang, R. M. Venable, J. B. Klauda, B. R. Brooks and R. W. Pastor, J. Chem. Phys., 2020, 153, 124107 CrossRef CAS PubMed.
- R.-X. Gu, S. Baoukina and D. P. Tieleman, J. Am. Chem. Soc., 2020, 142, 2844–2856 CrossRef CAS PubMed.
- P. Høyrup, J. Davidsen and K. Jørgensen, J. Phys. Chem. B, 2001, 105, 2649–2657 CrossRef.
- A. Arouri and O. G. Mouritsen, Prog. Lipid Res., 2013, 52, 130–140 CrossRef CAS PubMed.
- S. M. Yee and C. D. Lorenz, J. Phys. Chem. B, 2021, 125, 8038–8047 CrossRef CAS PubMed.
- J. A. Hamilton and K. Brunaldi, J. Mol. Neurosci., 2007, 33, 12–17 CrossRef CAS PubMed.
- F. Kamp, D. Zakim, F. Zhang, N. Noy and J. A. Hamilton, Biochemistry, 1995, 34, 11928–11937 CrossRef CAS PubMed.
- A. M. Kleinfeld, P. Chu and C. Romero, Biochemistry, 1997, 36, 14146–14158 CrossRef CAS PubMed.
- E. L. Wu, X. Cheng, S. Jo, H. Rui, K. C. Song, E. M. Dávila-Contreras, Y. Qi, J. Lee, V. Monje-Galvan, R. M. Venable, J. B. Klauda and W. Im, CHARMM-GUI membrane builder toward realistic biological membrane simulations, 2014 Search PubMed.
- J. Huang, S. Rauscher, G. Nawrocki, T. Ran, M. Feig, B. L. De Groot, H. Grubmüller and A. D. MacKerell Jr., Nat. Methods, 2017, 14, 71–73 CrossRef CAS PubMed.
- M. J. Abraham, T. Murtola, R. Schulz, S. Páll, J. C. Smith, B. Hess and E. Lindahl, SoftwareX, 2015, 1, 19–25 CrossRef.
- S. Nosé, Mol. Phys., 1984, 52, 255–268 CrossRef.
- W. G. Hoover, Phys. Rev. A, 1985, 31, 1695 CrossRef PubMed.
- M. Parrinello and A. Rahman, J. Appl. Phys., 1981, 52, 7182–7190 CrossRef CAS.
- S. Nosé and M. L. Klein, Mol. Phys., 1983, 50, 1055–1076 CrossRef.
- B. Hess, H. Bekker, H. J. Berendsen and J. G. Fraaije, J. Comput. Chem., 1997, 18, 1463–1472 CrossRef CAS.
- S. Buchoux, Bioinformatics, 2016, 33, 133–134 CrossRef PubMed.
- T. J. Piggot, J. R. Allison, R. B. Sessions and J. W. Essex, J. Chem. Theory Comput., 2017, 13, 5683–5696 CrossRef CAS PubMed.
- R. Gupta, Y. Badhe, S. Mitragotri and B. Rai, Nanoscale, 2020, 12, 6318–6333 RSC.
- P. Smith, P. G. Petrov and C. D. Lorenz, bioRxiv, 2021.
- P. Smith and C. D. Lorenz, J. Chem. Theory Comput., 2021, 17, 5907–5919 CrossRef CAS PubMed.
- W. Humphrey, A. Dalke and K. Schulten, J. Mol. Graphics, 1996, 14, 33–38 CrossRef CAS PubMed.
- King's College London, King's Computational Research, Engineering and Technology Environment (CREATE), 2022. DOI:10.18742/rnvf-m076.
Footnote |
| † Electronic supplementary information (ESI) available: (i) A detailed description of the analysis carried out for the various simulations, (ii) plots of the RG and eccentricity of the micelles as a function of time (iii) the contacts between the EO monomers and the hydration of the EO monomers on the polymers within each micelle (iv) the intrinsic density of the various components within the simulations for each micelle and (v) the outputs of the dimensionality reduction and clustering of the molecules within each micelle. See DOI: https://doi.org/10.1039/d3nr05083a |
| This journal is © The Royal Society of Chemistry 2024 |