
 Open Access Article
 This Open Access Article is licensed under a Creative Commons Attribution-Non Commercial 3.0 Unported Licence
Depletion-induced crystallization of anisotropic triblock colloids†
Fabrizio
Camerin‡
 *ab,
Susana
Marín-Aguilar‡
*a and
Marjolein
Dijkstra
ab
*ab,
Susana
Marín-Aguilar‡
*a and
Marjolein
Dijkstra
ab
aSoft Condensed Matter & Biophysics, Debye Institute for Nanomaterials Science, Utrecht University, Princetonplein 1, 3584 CC Utrecht, The Netherlands
bInternational Institute for Sustainability with Knotted Chiral MetaMatter (WPI-SKCM2), Hiroshima University, 1-3-1 Kagamiyama, Higashi-Hiroshima, Hiroshima 739-8526, Japan. E-mail: fabrizio.camerin@gmail.com; s.marinaguilar@uu.nl; m.dijkstra@uu.nl
First published on 24th January 2024
Abstract
The intricate interplay between colloidal particle shape and precisely engineered interaction potentials has paved the way for the discovery of unprecedented crystal structures in both two and three dimensions. Here, we make use of anisotropic triblock colloidal particles composed of two distinct materials. The resulting surface charge heterogeneity can be exploited to generate regioselective depletion interactions and directional bonding. Using extensive molecular dynamics simulations and a dimensionality reduction analysis approach, we map out state diagrams for the self-assembly of such colloids as a function of their aspect ratio and for varying depletant features in a quasi two-dimensional set-up. We observe the formation of a wide variety of crystal structures such as a herringbone, brick-wall, tilted brick-wall, and (tilted) ladder-like structures. More specifically, we determine the optimal parameters to enhance crystallization, and investigate the nucleation process. Additionally, we explore the potential of using crystalline monolayers as templates for deposition, thereby creating complex three-dimensional structures that hold promise for future applications.
1 Introduction
The availability of well-characterized colloidal suspensions has enabled us to study physical phenomena that resemble those encountered in the realm of atoms and molecules. The inherent temporal and spatial scales within colloidal systems make their investigation at a single-particle level significantly more attainable compared to their atomic and molecular counterparts. This accessibility has shed light on problems such as crystallization1,2 and the nature of the glass transition.3–5While originally these studies primarily involved simple hard-sphere-like colloids,6 experimental techniques have increasingly advanced to have complete control over their particle shape and particle interactions, thereby achieving a more accurate representation of their molecular analogs. Currently, it is feasible to fabricate colloids that exhibit intricate anisotropic geometries7,8 and interactions.9–11 These colloids can be endowed with different surface functionalizations and directional bonding, closely emulating the principles of molecular recognition, bonding, and shape. A notable recent example involves the self-assembly of colloidal cubic diamond structures using discrete building blocks composed of tetrahedral patchy particles coated with DNA.12 Additionally, the combined use of cubic and spherical colloidal components13 has facilitated the creation of colloidal molecules with precise control over molecular valency and bond flexibility, depending on the size ratio between the cubes and spheres.14
The study of colloids has also shed light on other physical phenomena for which a similarity to the atomistic and molecular world has been found. An illustrative example is the investigation of the vapor–liquid interface, which can be created by adding sufficiently large polymer to a colloidal suspension, thereby inducing a vapor–liquid phase coexistence, which is separated by an interface.15 The driving force behind this phase separation is attributed to the depletion mechanism, which stems from the exclusion of polymers from the interstitial region between the surfaces of two (or more) colloids. This generates an osmotic pressure that brings the colloids closer together, ultimately leading to contact. Depletion thus effectively manifests as an attractive interaction between the colloids16 with its range and strength depending on the size and concentration of the added polymer chains. This type of interaction has proven to be extremely useful as a means of controlling crystallization.17 In order to induce site-selective directional interactions for the self-assembly of intricate structures, depletion interactions have often been coupled with lock-and-key mechanisms relying on the complementary shape of the colloids,7,18–20 or with particles exhibiting regions of different surface roughness.21,22
Therefore, the addition of polymers (or other depletants) to the solution serves as a valuable tool to guide the self-assembly of colloidal particles through depletion. However, colloids are inherently endowed with certain characteristics that contribute to their overall interaction potential. Notably, the presence of surface charges and factors such as the excluded volume of the colloids or their geometric shape can all be harnessed to define new assembly strategies.23 These concepts have been exploited by Liu and coworkers24 who fabricated triblock colloids composed of two distinct polymeric materials and observed the formation of a remarkable array of one- and two-dimensional structures through scanning electron microscopy. These particles exhibit an ellipsoidal shape which can be described by two orthogonal axes. More specifically, they are fabricated by means of a so-called cluster encapsulation method,24,25 consists of 3-(trimethoxysilyl)propyl methacrylate (TPM) and polystyrene (PS), with the former located in the center of the colloid and the latter at the tips. Moreover, by varying the size of the central TPM colloid, triblock colloids with different aspect ratios can be synthesized, consequently yielding different structures such as ladder-like chains, brick-wall configurations or herringbone patterns.
However, while this study has pioneered a novel self-assembly technique, the optimal parameters for the emergence of crystalline patterns remain elusive. For instance, it remains undisclosed whether crystallization might be more pronounced at specific colloid aspect ratios, or for different depletant sizes, depletant concentrations, or colloid packing fractions. Furthermore, the ability of this system to form three-dimensional structures remains unexplored, a facet that could enhance its appeal from an application point of view.26
In this work, we present a comprehensive study on the self-assembly behavior of anisotropic biphasic triblock colloids in which we aim at elucidating their behavior in forming novel crystal structures in a quasi two-dimensional set-up. To this end, we first develop a coarse-grained model that allows us to emulate the shape of the colloids as synthesized in the experiments of ref. 24, introducing the possibility of having different interaction potentials for the different regions of the colloids and thus being able to reproduce the presence of two different materials. By tuning the size of the central particle, we can alter the aspect ratio and the patch sizes of the colloids. Using molecular dynamics simulations, we investigate the effect of packing fraction and size of the depletants on the self-assembled structures of the anisotropic triblock patchy colloids. We analyze such structures using a dimensionality reduction technique called principal component analysis (PCA), in which a linear combination of multiple order parameters allows the efficient identification of crystal structures in certain regions of the state diagram. Subsequently, the crystallization process is investigated by identifying the initial seed and following the nucleation process. Finally, we present an outlook of our study in which we demonstrate the possibility of using triblock colloids as building blocks for the formation of novel three-dimensional crystal structures.
2 Models and methods
2.1 Model of anisotropic biphasic triblock colloids
We develop a coarse-grained model of the anisotropic biphasic triblock colloids to mimic the experimental system presented in ref. 24. The modelling involves the following steps, as also shown schematically in Fig. 1(a). We first place two spheres of diameter σPS at contact, mimicking the PS particles in the experiments, and one sphere with diameter σTPM centered at their contact point, resembling the TPM colloid, see Fig. 1(a1 and a2). The shape of the biphasic triblock colloid is determined by the outer surface of the three intersecting spheres. The aspect ratio λ = 2σPS/σTPM of the triblock colloids can be tuned by adjusting σTPM, while we keep the size of the outer spheres fixed at σPS = 3.3σ, where σ is used as the unit of length in our simulations, see Fig. 1(a3 and a4). We tessellate the outer surface with beads of size σ and unitary mass m, as illustrated in Fig. 1(a5), following the distribution described in ref. 27. Comparable tessellation methodologies have been reported in other studies concerning patchy and Janus particles.28,29 | ||
| Fig. 1 (a) Schematics showing the steps for modeling anisotropic biphasic triblock colloids involving (1) two tip spheres (PS) at contact, (2) the addition of a third central sphere (TPM), (3) the tuning of the size of the central sphere, (4) merging the surfaces of the three spherical colloids and (5) the tessellation of the surface of the resulting triblock colloid with beads. (b) Example of the overall interaction potential (dashed lines) and separate Yukawa and Asakura–Osawa (AO) interaction potential contributions (full lines) assigned to the beads depending on their position on the surface of the triblock colloid relative to the three underlying spheres (PS and TPM). Light blue is for beads belonging to the tips of the colloid, while dark blue is for those belonging to the central particle. The same Asakura–Osawa potential is assigned to all beads. | ||
For each sphere of size σPS, we fix the number of beads NPS = 41. The number of beads assigned to the central particle NTPM is determined to maintain a uniform bead surface density of ρbσ2 = 1.2 across all three spheres constituting the complete colloid structure. Consequently, depending on λ, NTPM ranges from 189 to 51 for λ = 1.30 and 2.50, respectively. As the surface of the triblock colloids corresponds to the intersection of the three spheres mentioned earlier, any overlapping beads are eliminated. Hence, the total number of beads N of the triblock particle is less than the sum of the beads initially assigned to each sphere and varies from N = 210 for λ = 1.30 to N = 158 for λ = 2.50. We verified that doubling the number of beads does not qualitatively change the results other than shifting the energy scale at which the crystalline phases are observed (see ESI†).
2.2 Interaction potential
As observed in the experiments of ref. 24, triblock colloids endowed with surface charges dependent on the specific material, and the addition of polymers to the suspension, give rise to a complex interaction potential βUij(r) for beads i, j = TPM, PS. This can be described by the sum of a repulsive Yukawa potential21,30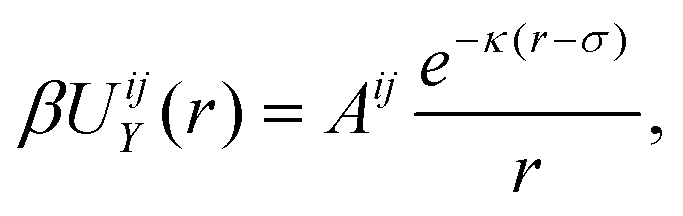 | (1) |
 a prefactor that depends on the material and the size of the colloids with ψPS(TPM) and σPS(TPM) the zeta potential and the diameter of either the tip or central colloid, respectively, λB the Bjerrum length, κ the inverse Debye screening length, β = 1/kBT with kB the Boltzmann constant, T the temperature, e the elementary charge, δ = 1/3 a factor that accounts for the presence of multiple interacting beads on the surface of the colloids, and a depletion contribution described by the Asakura–Oosawa potential31,32
 | (2) |
 | (3) |
2.3 Simulation details
Molecular dynamics simulations are performed using the LAMMPS package.33 Each triblock colloid is treated as a rigid body. For every state point, we start the simulation from two to four different initial configurations, equilibrated at a low colloid number density ρ = Ncσ2/A = 0.013, where Nc denotes the number of colloids and A represents the area of the base of the simulation box. To account for the quasi two-dimensional nature of the experiments, a gravity-like force Fgσ/kBT = 0.08 is applied to each bead in the z direction of the simulation box. Unlike the x and y directions, periodic boundary conditions are not enforced in the z direction. The magnitude of this force is such that at low and intermediate colloid densities, the longest axis of the colloids remains aligned to the xy plane. We perform simulations in the NVT ensemble for varying depletant reservoir packing fractions 0.50 < η < 1.35 and colloid number densities 0.020 < ρ = Ncσ2/A < 0.030, for at least t = 5 × 10⁷δt with δt = 0.0087τ the simulation timestep and the unit of time.
To generate the training dataset for the principal component analysis (PCA), we take as initial configurations the output of the floppy box Monte Carlo method, as described below, and replicate the resulting unit cell in such a way that we obtain a crystalline configuration with a number of colloids Nc > 600. To equilibrate the system, we run the simulation for 2 × 10⁶δt. Since the specific choice of simulation parameters only marginally affects the training dataset, we fix the depletant reservoir packing fraction to η = 1.0 and the depletant-to-colloid size ratio to q = 0.05.
To study the formation of three-dimensional structures by deposition, we start from a monolayer of triblock colloids with an aspect ratio λ = 1.52 arranged in a brick-wall conformation. This monolayer is prepared using the floppy box Monte Carlo method (see below) and the unit cell is subsequently replicated in order to have a number of colloids Nc = 96. After achieving equilibrium within the first monolayer, subsequent layers are assembled in the z-direction, perpendicular to the substrate, by randomly depositing additional triblock colloids in an elongated simulation box. In the x and y directions, parallel to the substrate, the box is triclinic and periodic boundary conditions are applied. In these simulations, we employ the same parameters as introduced previously for the self-assembly simulations conducted within the quasi two-dimensional setting.
2.4 Floppy box Monte Carlo algorithm
The floppy box Monte Carlo algorithm was originally introduced in ref. 34 and 35 for predicting crystal structure candidates for colloidal particles. In the present work, we employ this method for three purposes: (i) to generate the unit cells of the identified quasi two-dimensional crystal phases, which enable the calculation of the order parameters for the perfect crystal structures as input for the PCA approach, (ii) to create colloidal monolayers, onto which we sequentially deposit additional triblock colloids for assembling three-dimensional structures, and (iii) to predict potential three-dimensional candidate structures that can be assembled for varying aspect ratios. In brief, the algorithm is based on NPT Monte Carlo simulations with periodic boundary conditions. Each simulation step involves either a trial move to displace a particle or a trial move to change the volume of the system with acceptance rules determined by the conventional Metropolis algorithm. To explore the potential arrangements of the colloidal particles, it is necessary to also consider fluctuations in the shape of the simulation box, wherein the lattice vectors defining the box are allowed to vary independently. Consequently, a trial volume move comprises an attempt to change the orientation and the length of the lattice vectors of the simulation box. The simulations, which usually involve a small number of particles, are started in a dilute state followed by a step-wise increase in pressure, resulting in compression of the system. In this way, the final configuration corresponds to the unit cell of a dense crystalline structure. By running several independent simulations, a pool of stable unit cell configurations can be obtained for triblock colloids with different aspect ratios λ. As compared to the original algorithm, we introduce appropriate modifications to account for the shape of triblock colloids, and for the surface tessellation of the particles through which the interaction potential is exerted.2.5 Order parameters
In order to analyze the crystalline phases resulting from the self-assembly of the triblock colloids, we employ PCA as described in the following subsection. This approach utilizes bond and orientational order parameters as input. To characterize the orientation between neighboring particles, we use the second Legendre polynomial defined as36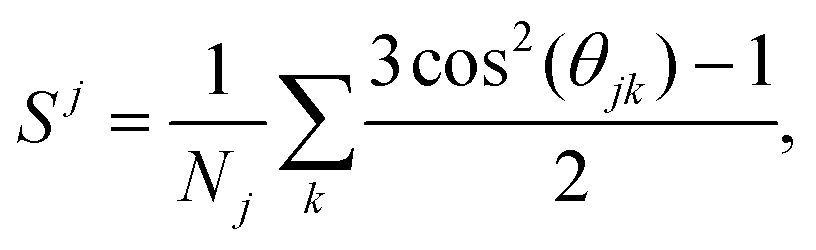 | (4) |
In addition, we make use of the n-atic bond order parameter37
 | (5) |
2.6. Principal component analysis
To identify pertinent order parameters for distinguishing between the different crystal structures, we employ principal component analysis (PCA) – a dimensionality reduction method – applied to the set of bond and orientational order parameters described above. The idea behind PCA is to project the input data onto a new set of variables using a linear basis transformation while preserving most of the original dataset's variance.38 These newly derived variables, known as principal components, result from specific linear combinations of the original parameters and can be used as order parameters.39 This method involves computing the eigenvalues and eigenvectors of the covariance matrix associated with the initial dataset40![[X with combining tilde]](https://www.rsc.org/images/entities/b_i_char_0058_0303.gif) = XV, = XV, | (6) |
the reduced matrix, and V a matrix constructed from the eigenvalues of the covariance matrix of X. The eigenvectors of the latter matrix correspond to the principal components (PCs), with their respective eigenvalues Λ signifying the variance carried by each component. Once the PCs are computed, the PCs are ordered based on their variance, where the first principal component PC1 possesses the largest variance Λ1. The fraction of total variance explained (FVE) associated with each PC is defined as | (7) |
3. Results and discussion
3.1 Identifying crystal phases of triblock colloids
Each triblock colloid consists of three distinct parts, with the tips composed of the same material. Similar to the experimental system,24 the central part has a higher absolute surface charge, resulting in a steeper Yukawa interaction potential as compared to the tips of the colloid. The depletion interaction is the same for each bead regardless of the material type. In this way, the overall interaction potential turns out to be more attractive for the tips and slightly less attractive for the central part of the colloid. More details on the modeling and interaction potentials are provided in the Methods section and are summarized in Fig. 1. In addition, it is important to note that changing the aspect ratio λ of the triblock colloid leads to changes in the surface area of the tips as well as in the central part. For intermediate values of λ, the surface area is distributed relatively evenly between the center and the tips. However, as λ increases further, the surface area of TPM in the center experiences a significant reduction. Specifically, for λ > 2, a concave colloid is created, with a smaller size of the central particle, as depicted in Fig. 2. | ||
| Fig. 2 Representative simulation snapshots showing the phases that are identified for the five examined aspect ratios λ = 1.30, 1.52, 1.68, 2.13 and 2.50. For visual clarity, each snapshot reports a periodic image in the x and y directions. In each panel, we also report an enlargement of the crystal structure and a representation of the individual triblock colloid. | ||
Consequently, we expect the formation of different phases due to (i) the different packings than can be achieved for each size ratio, and (ii) the variation in exposed surface areas of the outer PS and central TPM spheres. To investigate this, we perform molecular dynamics simulations of triblock colloids in a quasi two-dimensional setup for varying aspect ratios λ along with different values for the colloid number density ρ = Ncσ2/A, depletant reservoir packing fraction η, and depletant-to-colloid size ratio q, following the methodology described in the Methods section. In Fig. 2, we present representative simulation snapshots of the observed crystalline phases found for five different aspect ratios, λ = 1.30, 1.52, 1.68, 2.13, and 2.50. Each panel also includes an enlarged view of the corresponding phase, along with representations of the individual triblock colloids giving rise to the respective phase. For the smallest size ratio examined, we primarily observe the formation of two phases, namely the brick-wall and the tilted brick-wall structure. In the first case, colloids interact through their tips with all particles oriented in the same direction, and their specific shape facilitates the formation of a non-close-packed structure, often resulting in the presence of voids.
The formation of the tilted brick-wall structure, on the other hand, arises from the lack of confinement in the third dimension. This enables the colloids to explore the z-direction while remaining tied to the lower substrate. As a result, the particles lie adjacent to each other with their longest axes tilted with respect to the substrate. Brick-wall phases are also extensively found for λ = 1.52 and 1.68. The main difference lies in the spacing between colloids due to their different shapes, resulting in denser phases for higher aspect ratios. In these cases, we also observe the presence of a second phase, where each line of densely packed colloids is tilted in the opposite direction compared to the preceding one. Due to this characteristic, this phase is referred to as herringbone phase and is always found to be surrounded by the more dominant brick-wall phase. In the case of the highest aspect ratios studied, namely for λ = 2.13 and 2.50, there is a preference for the triblock colloids to form linear structures, which can be seen as ladder-like configurations. These ladders can eventually join and give rise to more intricate arrangements, resembling the brick-wall structures but oriented in a tilted manner. In the case of λ = 2.13, a small nucleus of the (standard) brick-wall is also found. From the snapshots, it is evident that the crystalline patterns are typically not arranged in a single continuous grain but rather as separate ones with varying orientations. For the aspect ratios at which the brick-wall structure crystallizes, we also observe distinct grains that can be arranged and connected to the main one by having an orientation difference of ≈90°. In certain cases, we also observe that the herringbone phase is found at the boundary between two brick-wall grains with differing orientations. The observed phases are consistent with those discovered experimentally for the respective aspect ratios.24 However, the tilted brick-wall phase was exclusively found in simulations. We note that our simulations did not exhibit the formation of circles and rings, as observed experimentally for λ > 2. This divergence could originate from several factors, including the density of colloids used in our simulations and the conditions of the substrate. Concerning the former, it seems that chains and rings are found at a lower colloid density than the range we investigated, given our primary focus on understanding the formation of crystalline patterns. Additionally, colloid-substrate interactions and the presence of adsorbed depletants might induce specific particle conformations, potentially leading to the formation of rings or vertically standing particles.
After evaluating the phases that can be attained for triblock colloidal particles with varying aspect ratios, we proceed with investigating under which conditions crystallization is enhanced. The phase space is particularly large, considering that parameters like aspect ratio, colloid number density, depletant reservoir packing fraction and depletant-to-colloid size ratio all affect the self-assembled structures. Furthermore, the unique features of each phase, which could be more effectively characterized using different order parameters, present a challenge in identifying a single descriptor that universally applies to all cases.
Therefore, to facilitate the identification of phase space regions that lead to the self-assembly of crystalline patterns, we employ a dimensionality reduction technique known as principal component analysis (PCA).41,42 We construct the input dataset for PCA using equilibrated, fully crystalline systems. The rationale behind this procedure is to have a representation of all crystalline phases within the principal component space. This representation is subsequently harnessed to classify crystalline patterns in standard self-assembly simulations. To this aim, we employ the floppy box Monte Carlo technique (see Methods) to generate a pool of possible quasi two-dimensional crystals that can be formed by triblock colloids for varying size ratios. This pool includes fully brick-wall, tilted brick-wall, herringbone and ladder-like structures. Subsequently, these configurations are equilibrated using quasi two-dimensional molecular dynamics simulations (see Methods) which introduces thermal fluctuations to the initially perfect crystal structures. To ensure that each crystalline phase is adequately represented, a minimum of Nc = 600 colloids per phase is employed, as described in the Methods section. We then characterize each of these phases by computing the second Legendre polynomials slp and a set of n-atic bond order parameters Ψn.
To determine the most relevant features that describe all the phases, we first apply PCA to a large set of parameters and discard those that contribute less to the first principal component (PC1), based on their first principal component coefficients c1. We note that we specifically focus on the first principal component coefficients since PC1 is expected to retain the most relevant information on the phases, as compared for instance to the second principal component PC2. Subsequently, we apply PCA to the remaining features and we repeat the procedure. We start by considering a set of all n-atic bond order parameters from n∈[2, 12], in addition to the second Legendre polynomials. In Fig. 3(a.I) we show the coefficients c1 for each of the order parameters, and in Fig. 3(a.III) the corresponding first (PC1) and second (PC2) principal component scatter plot of all the phases. For the sake of completeness, the coefficients c2 are also reported in Fig. 3(a.II). We observe that the contribution of each odd n-atic bond order parameter to PC1 tends towards zero. Hence, we discard them as relevant features and apply the PCA only for the even n-atic bond order parameters and the second Legendre polynomials, as shown in Fig. 3(b). We note that these results are very similar to those obtained in the previous step, since the coefficients of all the odd n-atic bond order parameters were already nearly zero. Nevertheless, certain features, particularly  ,
,  ,
,  as well as the second Legendre polynomial, contribute stronger to PC1. The average values of the above features corresponding to each phase are shown in the ESI.† Subsequently, we conduct a final PCA solely using these features. The corresponding outcomes are shown in Fig. 3(c). By applying this approach, we successfully maximize the fraction of explained variance (FVE) (see Methods) for the first principal component to FVE = 0.78 and for the second to FVE = 0.12. This means that by using the first two principal components, we capture 90% of the information carried by the various phases. This efficacy is reflected in the scatter plot shown in Fig. 3(c.III), where all the data points originated from the same phase are tightly grouped within specific regions of the principal component space. This is particularly pronounced for the tilted brick-wall and herringbone structures. In this way, we can define PC1 and PC2 threshold values that characterize each phase, as depicted by the dashed rectangular lines in Fig. 3(c.III). We note that, a subtle mixing between brick-wall and ladder-like structures occurs around PC1 ≈ 1.0 and PC2 ≈ 0.1, most likely because both structures share some orientational similarities. In any case, this small region of overlap does not hinder the identification of either phases.
 | ||
Fig. 3 (Top, I) First principal component coefficients c1, (middle, II) second principal component coefficients c2, and (bottom, III) projection of the dataset with (a) all n-atic bond parameters Ψ from n∈[2, 12] and the second Legendre polynomials (slp), (b) only the even n-atic bond order parameters and the second Legendre polynomials, and (c)  , ,  , ,  and the second Legendre polynomials of fully crystalline configurations onto the first principal component (PC1) and second principal component (PC2) plane. The fraction of variance explained is also reported for the cases in I and II. and the second Legendre polynomials of fully crystalline configurations onto the first principal component (PC1) and second principal component (PC2) plane. The fraction of variance explained is also reported for the cases in I and II. | ||
3.2 State diagrams for anisotropic triblock colloids
To investigate the self-assembly of triblock colloids, we perform molecular dynamics simulations at different colloid number densities, depletant reservoir packing fractions, and depletant sizes, for the previously introduced aspect ratios λ. The simulations are started from a low-density configuration in which the colloids have random positions and orientations. Subsequently, we analyze each state point by calculating the respective principal components. This approach facilitates the identification of different phases by comparing their principal component values to those of the fully crystalline phases (see Fig. 3). Depending on the number of colloids that present certain principal component values, we can quantify the prevalence of a crystal phase as Nx/Nc, where Nx is the number of particles identified in a particular phase. We note that, unlike the fully crystalline systems, particles in the self-assembly simulations tend to organize into distinct crystalline grains. Consequently, particles situated at the boundaries of crystalline regions exhibit principal component values that differ from those in a fully crystallized system due to different arrangements of their nearest neighbors. We observe that this effect may lead to an underestimation of Nx/Nc, particularly for the brick-wall configuration, while boundary regions appear to be well-captured for the other phases. To address this issue, we adopt a strategy wherein we identify a minimum of Nboundary = 20 particles belonging to a brick-wall boundary. Subsequently, we compute their corresponding principal components and observe that they cluster within a specific region of the principal component space, namely, within the range of 0.3 ≤ PC1 ≤ 0.38 and −0.1 ≤ PC2 ≤ 0.1. As a result, by identifying the particles belonging to the brick-wall boundary regions, we can also classify them as part of the brick-wall phase.We summarize our results in the state diagrams shown in Fig. 4(a and b), where we report for each aspect ratio λ and depletant reservoir packing fraction η the fraction of triblock colloids found in the most prevalent crystalline phase, as indicated by the color bar, for two depletant-to-colloid size ratios q = 0.05 and q = 0.075, respectively. In case the fraction of colloids belonging to the most prevalent crystalline phase is lower than 10%, the system is considered as disordered. In the majority of cases, we observe minimal influence stemming from the colloid number density ρ = Ncσ2/A. Therefore, we present for each state point the most prevailing phase for the entire range of colloid number densities investigated. State diagrams displaying the full dependence on ρ are available in the ESI,† where we also report information on the conditions for the second most prevalent phases to be nucleated.
 | ||
| Fig. 4 State diagram of triblock particles in the aspect ratio λ – depletant reservoir packing fraction η representation for depletant-to-colloid size ratio (a) q = 0.05 and (b) q = 0.075. (c) State diagram of triblock particles in the depletant-to-colloid size ratio q-depletant reservoir packing fraction η representation for the aspect ratio λ = 1.52. Five different phases are identified, namely brick-wall (BW) (squares), herringbone (HB) (circles), ladder (L) (triangles), tilted brick-wall (TBW) (triangles down) and disordered (D) (diamonds) structures. For each state point, the most prevalent phase is reported, independent on the colloid number density ρ = Ncσ2/A. With the exception of the disordered phase, symbols are colored according to the fraction of the corresponding crystal phase identified Nx/Nc, in accordance with the color scale displayed in the figure. | ||
We observe that the brick-wall and ladder-like structures are the two prevalent phases for values of λ smaller and higher than 2, respectively. This suggests that convex shapes of the triblock particles are more prone to stabilize brick-wall crystals, while the relatively smaller size of the center of the particles as compared to the tips favors the ladder-like conformation, consistent with the patterns observed in the simulation snapshots reported in Fig. 2. Notably, the formation of tilted brick-wall structure is limited to a single state point for λ = 1.30. Regarding the depletant reservoir packing fraction, crystalline phases are found for 0.7 ≲ η ≲ 1.1 for both q, with the most prevalent occurrences of the brick-wall structure (Nx/Nc > 0.5) at η = 0.8 for λ = 1.52. In contrast, for the highest aspect ratio examined, limited crystal formation is observed, particularly for q = 0.075 where only fully disordered states are found. We note that herringbone phases consistently nucleate alongside brick-wall phases although their occurrence is less frequent. As a result, they are not represented in the state diagrams in Fig. 4 (see ESI†).
In general, we note that our method for detecting crystalline phases may slightly underestimate the quantity of crystals within a particular phase. This issue is further enlarged by the previously mentioned challenge of accurately identifying boundary particles. Another aspect that has to be taken into account concerns the selection of the boundaries in the principal component space for classifying the different phases, as defined in Fig. 3. We note that a shift in these boundaries could have a small effect on the quantity of crystals. The utilization of a distinct technique for phase identification, such as one relying directly on order parameters, would likely encounter comparable issues, particularly in distinguishing different phases and accurately identifying crystal boundaries. Furthermore, adopting such an approach would not ensure the identification of phases with the use of a unique descriptor as achieved through PCA.
We now focus on a specific aspect ratio, namely λ = 1.52, and study in more detail the influence of the depletion interaction, in terms of the depletant-to-colloid size ratio q and depletant reservoir packing fraction η. The corresponding state diagram is reported in Fig. 4(c). Once again, we show the largest value of the prevailing phase encountered across the range of colloid densities explored. We note that the formation of brick-wall crystals emerges as a result of the intricate interplay between q and η. This relationship entails that a reduction in depletant concentration corresponds to an increase in depletant size. Given that these two variables control the range and depth of the depletion potential, it becomes evident that crystal nucleation requires a specific range and strength of the attraction potential. We note that the range of q investigated numerically is significantly larger than the one studied experimentally, which was limited to q = 0.04 and q = 0.06.24 In this way, by meticulously tuning both the range and concentration of depletants, we show that it becomes possible to achieve substantial degree of crystal formation. Alternatively, a different choice of the parameters would lead to the formation of a disordered phase, as indicated by the grey diamond symbols in the state diagram. It is pertinent to observe that different types of disordered structures are found for different values of depletant-to-colloid size ratio q. Specifically, when dealing with larger attraction strengths, i.e. large depletant reservoir packing fractions, gel-like structures emerge on the substrate. These structures are typically characterized by random arrangements of colloids forming a percolating network. In some cases, we also observe the formation of networks that exhibit a certain degree of crystalline order, although this order is less pronounced than under optimal conditions for the formation of crystal grains. The self-assembly of colloids into crystalline networks have been previously reported for other systems with short-range attractions.32,43,44 To further characterize the regions where percolating structures arise, we calculate the fractal dimension df of the disordered structures using the box counting algorithm.45,46 We start by identifying the largest cluster, by defining two colloidal molecules to belong to the same cluster when the distance between their centers is less than 7.5σ. We proceed by subdividing the simulation box into cells of different sizes λ, and by counting the number of cells Nc that encompass at least one colloidal molecule. The fractal dimension is determined by
log![[thin space (1/6-em)]](https://www.rsc.org/images/entities/char_2009.gif) Nc(λ) = −dflogλ. Nc(λ) = −dflogλ. | (8) |
We observe that for percolating structures, df is approximately 1.7 to 1.8. In contrast, for crystalline structures, df is consistently found to be around 2.0. Representative snapshots depicting these phases and their corresponding fractal dimension values are shown in the ESI† for systems with a fixed colloid number density ρ and depletant-to-colloid size ratio q, while varying depletant reservoir packing fraction η. In the ESI† we also show state diagrams in which df is explicitly reported for each of the conditions explored.
Finally, it is interesting to assess whether the prevailing effect on the formation of crystalline patterns is given by the presence of two distinct surface charges or by the inherent shape of the colloids themselves. To investigate this, we performed additional simulations by reversing the surface charge between the tips and the center. In other words, we treat the triblock colloids as if they were composed of TPM at the tips and PS in the center, resulting in a stronger attraction between the centers of the particles. The results are reported in Fig. S4† for λ = 1.52. We observe that reversing the surface charge impedes the formation of crystalline phases, causing particles to primarily interact center-to-center. It becomes apparent that nucleation of brick-wall phases relies on a preference for tip-to-tip interactions. We also examine the case where all beads of the colloids interact with the same interaction potential, mimicking particles composed of only one material, in particular of PS. Yet, realizing such particles might require the development of new synthesis protocols since the anisotropic shape obtained in ref. 24 arises from the use of TPM to encapsulate PS particles. In this case, we observe that a brick-wall phase is found at slightly lower depletant reservoir packing fractions, as shown in Fig. S4.† This emphasizes the significant influence of particle shape on the phase behavior. In summary, our findings indicate that particle shape significantly contributes to determining the phase behavior of colloids, despite the fact that tip-to-tip interactions do not need to be discouraged to initiate nucleation of crystalline phases.
3.3 Nucleation of crystalline phases
In order to investigate the crystal formation process, we closely monitor the nucleation at specific state points. To this end, we present a sequence of simulation snapshots in Fig. 5(a), showcasing the progressive formation of a brick-wall crystal of triblock colloids with an aspect ratio of λ = 1.52, depletant-to-colloid size ratio q = 0.075, depletant reservoir packing fraction η = 0.80, and colloid number density ρ = 0.026. In all frames, the colloids forming the largest crystal cluster at the end of the simulation are highlighted in shades of blue and light blue. The identification of the latter is based on the criterion according to which only colloids with a second Legendre polynomial value S > 0.8 are considered. In this analysis, grey colloids are excluded as they only contribute to the formation of smaller crystallites. | ||
| Fig. 5 (a.I–IV) Representative time-lapse simulation snapshots showing the formation of brick-wall crystals. Red colloids highlight two different seeds from which different grains are formed in (a.I) and (a.II), respectively. These will be part of the largest grain in the last timestep of the simulation (a.IV). Grey colloids are not considered for the calculations in (b) and (c), since they do not belong to the largest crystal cluster as identified in the last timestep of the simulation. (b) Fraction of brick-wall crystal Nx/Nxc as a function of simulation time t/τ, for the largest crystal cluster as identified in the last timestep of the simulation (blue and light blue colloids), reaching a size of Nxc particles. (c) First principal component (PC1) as a function of simulation time t/τ for the same system. Data corresponds to a system of triblock colloids with an aspect ratio λ = 1.52, colloid number density ρ = Ncσ2/A = 0.0262, depletant-to-colloid size ratio q = 0.075, and depletant reservoir packing fraction η = 0.80. | ||
The fraction of crystal that is formed over time within the largest cluster Nx/Nxc is reported in Fig. 5(b), where Nxc corresponds to the total number of particles that constitute the largest crystallite at the end of the simulation. We observe that the formation of the brick-wall structure in the final timestep results from the merging of two distinct crystals, both originating from different seed structures. These seeds can already be identified in the initial two simulation snapshots as highlighted in red, each occurring within the initial 10% of the simulation run. In both cases, crystallization occurs through the formation of a grain wherein a small cluster of particles align to form a nucleus, around which additional colloids assemble. As compared to the analysis performed experimentally in ref. 24, the seeds observed within the simulations correspond to the formation of what is termed a ‘superseed’. In many cases, we also observe the emergence of precursor assemblies involving three or more colloids; however these configurations are short-lived and do not persist over time (not shown). In this specific case, the two distinct grains merge at approximately 0.2 × 10⁸τ. Subsequently, the grain steadily grows until reaching a plateau.
Furthermore, we can follow the progression of crystal formation by utilizing the new order parameter derived from the principal component analysis. In Fig. 5(c), we report the value of the first principal component PC1 as a function of simulation time for the corresponding run. As expected, the trend for PC1 closely resembles that of Nx/Nxc, demonstrating that PC1 can indeed be exploited as a new order parameter for monitoring colloid crystallization. Further insight into the nucleation behavior for different simulation runs with the same parameters is provided in the ESI.†
In all cases, we observe that the largest crystal is obtained at approximately 60% of the simulation duration, after which only a small number of colloids join the primary crystal. Similar to the first case we examined, this crystal is formed through the merging of distinct crystallites that grow and reorient over time. The formation of the herringbone structure, also reported in the ESI,† is facilitated by the presence of pre-existing brick-wall structures and is initiated by a seed of four particles, arranged pairwise with two particles adjacent to each other.
3.4 Formation of three-dimensional structures
All the structures we have analyzed so far exhibit quasi two-dimensional characteristics, where the extension in the third dimension is solely given by the volume of the triblock colloids. At a fundamental level, the formation of these structures show the potential to select the material and the shape of the colloids for directed self-assembly. However, from an application perspective the use of such colloids for the formation of three-dimensional structures is particularly intriguing. These structures could hold promise, for instance, as colloidal photonic crystals.26 To explore this prospect, we first perform molecular dynamics simulations that exploit the deposition of colloids on a substrate.Specifically, our focus lies on triblock colloids with an aspect ratio of λ = 1.52. We initiate the process by forming a brick-wall crystalline monolayer, and by subsequently depositing additional colloids within an elongated simulation box. Further details on these simulations are reported in the Methods section. The outcomes of our simulations are shown in Fig. 6(a) in the form of representative simulation snapshots as a function of simulation time. The starting point is indeed the creation of a crystalline monolayer that serves as a template for the subsequent layers. The subsequent colloids are deposited in the empty spaces left by the former layer in such a way that an alternating stacking pattern is created. Overall, the structure maintains a body-centered tetragonal (BCT) arrangement as shown in Fig. 6(b).
 | ||
| Fig. 6 (a) Representative simulation snapshots showing the deposition of triblock colloids onto a brick-wall crystalline monolayer as a function of simulation time (from left to right). The top (bottom) panels show the top (lateral) view of the elongated simulation box. (b) Body-centered tetragonal (BCT) unit cell formed by the three-dimensional crystal. The upper figure shows the arrangement of the particles in their unit cell and the bottom one the corresponding centers of mass. | ||
The formation of crystalline order in the third dimension is confirmed by computing the principal components as a function of the z-direction, obtaining PC1 ≈ 1.45 and PC2 ≈ −0.11 per layer (see Fig. 3). We stress that the deposition procedure is performed in such a way that individual colloids can progressively arrange on those previously deposited. We verified that faster deposition rates typically tend to result in the formation of disordered states without the ability to restore ordered arrangements at longer times.
This preliminary study on the formation of three-dimensional structures through deposition can be extended to other size ratios for which, depending on the first template layer, different structural arrangements can be anticipated. Additionally, it will be of interest to assess the experimental feasibility and reproducibility of the formation of such lattices. We also note how, in principle, several other lattices can be assembled in three dimensions. To this end, we run the floppy box algorithm in three dimensions for each of the aspect ratios investigated. In Fig. S9† we present snapshots of a few exemplary lattices. The configurations are also available for visualization through the attached HTML files in ESI Data 1.† Investigating the specific stability conditions for these structures and developing novel experimental strategies will open interesting avenues for future research.
4 Conclusions
The synergistic use of shape anisotropy and complex interaction potentials facilitates the assembly of intricate crystal phases. In particular, the use of depletion interactions can play a pivotal role, as it offers effective control over the range and strength of the attractive forces. Additionally, the implementation of such interactions within an experimental framework is relatively straightforward.47,48Inspired by the experimental study by Liu and coworkers,24 we have introduced a model for investigating the self-assembly behavior of biphasic triblock particles through molecular dynamics simulations. In a quasi two-dimensional setting, we have observed the emergence of different crystal phases depending on the aspect ratio of the colloids. These structures typically initiate from different seeds and subsequently merge during the course of the simulations. However, in most cases, we observed the formation of multiple crystallites with varying orientations, which persist over time. These observation are consistent with the bright-field images reported experimentally.24
To classify the phases and determine optimal conditions for crystallization, we exploited PCA as a dimensionality reduction technique. This analysis approach proved to be very effective in discerning crystalline phases through the combination of multiple non-specific bond order parameters. Consequently, we found that brick-wall structures are markedly prevalent for aspect ratios λ < 2, while ladder-like structures dominate the state diagrams for higher aspect ratios. Our simulations revealed an extensive range within the parameter space where crystalline patterns emerge, exceeding the experimentally reported depletant-to-colloid size ratio of q = 0.04 and q = 0.06. Our results demonstrate the intricate influence of both the size and packing fraction of the depletants on these crystalline regimes. Beyond this range, the colloids form disordered phases, with a preference for disordered percolating structures when the fraction of depletants in solution is high. Finally, we have demonstrated the capacity of these colloids to assemble three-dimensional structures through a deposition process.
The range of aspect ratios with which individual building blocks can be synthesized offers the potential to generate structures with a wide array of properties and characteristics both in two and three dimensions. These colloidal crystals hold promise for various applications, including harnessing their optical properties or utilizing them as model systems to study phenomena revealed by molecular systems. We hope that our study stimulates further experimental exploration into this class of colloids, along with a clever combination of different materials on particles of varying shapes. The strategic exploitation of depletant interactions holds potential for creating and investigating novel structures with desired characteristics.
Author contributions
F. C. and S. M.-A. contributed equally to this work. Individual author contributions are defined based on CRediT (contributor roles taxonomy). Conceptualization: F. C., S. M.-A., M. D.; formal analysis: F. C., S. M.-A.; funding acquisition: M. D.; investigation: F. C., S. M.-A.; methodology: F. C., S. M.-A., M. D.; project administration: M. D.; software: F. C., S. M.-A.; supervision: M. D.; validation: F. C., S. M.-A.; visualization: F. C., S. M.-A.; writing – original draft: F. C., S. M.-A., M. D.; writing – review and editing: F. C., S. M.-A., M. D.Conflicts of interest
There are no conflicts to declare.Acknowledgements
We thank Frank Smallenburg for sharing the floppy box Monte Carlo algorithm code and David J. Pine for fruitful discussions. The authors acknowledge funding from the European Research Council (ERC) under the European Union's Horizon 2020 research and innovation program (grant agreement no. ERC-2019-ADG 884902, SoftML). F. C. and M. D. acknowledge funding from the World Premiere International (WPI) Research Center Initiative of the Japanese Ministry of Education, Culture, Sports, Science and Technology (MEXT). S. M.-A. and M. D. acknowledge funding from the Netherlands Center for Multiscale Catalytic Energy Conversion (MCEC).References
- D. M. Herlach, I. Klassen, P. Wette and D. Holland-Moritz, J. Phys.: Condens. Matter, 2010, 22, 153101 CrossRef PubMed.
- U. Gasser, J. Phys.: Condens. Matter, 2009, 21, 203101 CrossRef CAS PubMed.
- S. Gokhale, A. Sood and R. Ganapathy, Adv. Phys., 2016, 65, 363–452 CrossRef.
- E. R. Weeks, Introduction to the colloidal glass transition, 2017 Search PubMed.
- S. Marín-Aguilar, H. H. Wensink, G. Foffi and F. Smallenburg, Soft Matter, 2019, 15, 9886–9893 RSC.
- P. N. Pusey and W. van Megen, Phys. Rev. Lett., 1987, 59, 2083 CrossRef CAS PubMed.
- S. Sacanna and D. J. Pine, Curr. Opin. Colloid Interface Sci., 2011, 16, 96–105 CrossRef CAS.
- T. Hueckel, G. M. Hocky and S. Sacanna, Nat. Rev. Mater., 2021, 6, 1053–1069 CrossRef CAS.
- J. Zhang, E. Luijten and S. Granick, Annu. Rev. Phys. Chem., 2015, 66, 581–600 CrossRef CAS PubMed.
- Q. Chen, E. Diesel, J. K. Whitmer, S. C. Bae, E. Luijten and S. Granick, J. Am. Chem. Soc., 2011, 133, 7725–7727 CrossRef CAS PubMed.
- M. Liu, F. Dong, N. S. Jackson, M. D. Ward and M. Weck, J. Am. Chem. Soc., 2020, 142, 16528–16532 CrossRef CAS PubMed.
- M. He, J. P. Gales, É. Ducrot, Z. Gong, G.-R. Yi, S. Sacanna and D. J. Pine, Nature, 2020, 585, 524–529 CrossRef CAS PubMed.
- I. Chakraborty, V. Meester, C. van der Wel and D. J. Kraft, Nanoscale, 2017, 9, 7814–7821 RSC.
- Y. Shelke, F. Camerin, S. Marín-Aguilar, R. W. Verweij, M. Dijkstra and D. J. Kraft, ACS Nano, 2023, 17(13), 12234–12246 CrossRef CAS PubMed.
- D. G. Aarts, M. Schmidt and H. N. Lekkerkerker, Science, 2004, 304, 847–850 CrossRef CAS PubMed.
- H. N. Lekkerkerker, R. Tuinier, H. N. Lekkerkerker and R. Tuinier, Depletion interaction, Springer, 2011 Search PubMed.
- L. Rossi, S. Sacanna, W. T. Irvine, P. M. Chaikin, D. J. Pine and A. P. Philipse, Soft Matter, 2011, 7, 4139–4142 RSC.
- S. Sacanna, W. T. Irvine, P. M. Chaikin and D. J. Pine, Nature, 2010, 464, 575–578 CrossRef CAS PubMed.
- Y. Wang, Y. Wang, X. Zheng, G.-R. Yi, S. Sacanna, D. J. Pine and M. Weck, J. Am. Chem. Soc., 2014, 136, 6866–6869 CrossRef CAS PubMed.
- A. M. Mihut, B. Stenqvist, M. Lund, P. Schurtenberger and J. J. Crassous, Sci. Adv., 2017, 3, e1700321 CrossRef PubMed.
- D. J. Kraft, R. Ni, F. Smallenburg, M. Hermes, K. Yoon, D. A. Weitz, A. van Blaaderen, J. Groenewold, M. Dijkstra and W. K. Kegel, Proc. Natl. Acad. Sci. U. S. A., 2012, 109, 10787–10792 CrossRef CAS PubMed.
- J. R. Wolters, G. Avvisati, F. Hagemans, T. Vissers, D. J. Kraft, M. Dijkstra and W. K. Kegel, Soft Matter, 2015, 11, 1067–1077 RSC.
- N. Vogel, M. Retsch, C.-A. Fustin, A. Del Campo and U. Jonas, Chem. Rev., 2015, 115, 6265–6311 CrossRef CAS PubMed.
- M. Liu, X. Zheng, V. Grebe, D. J. Pine and M. Weck, Nat. Mater., 2020, 19, 1354–1361 CrossRef CAS PubMed.
- X. Zheng, M. Liu, M. He, D. J. Pine and M. Weck, Angew. Chem., 2017, 129, 5599–5603 CrossRef.
- Z. Cai, Z. Li, S. Ravaine, M. He, Y. Song, Y. Yin, H. Zheng, J. Teng and A. Zhang, Chem. Soc. Rev., 2021, 50, 5898–5951 RSC.
- M. Deserno , If Polymerforshung (Ed.), 2004, 99.
- Z. Zhang and S. C. Glotzer, Nano Lett., 2004, 4, 1407–1413 CrossRef CAS PubMed.
- L. Hong, A. Cacciuto, E. Luijten and S. Granick, Nano Lett., 2006, 6, 2510–2514 CrossRef CAS PubMed.
- A.-P. Hynninen and M. Dijkstra, Phys. Rev. E: Stat., Nonlinear, Soft Matter Phys., 2003, 68, 021407 CrossRef PubMed.
- S. Asakura and F. Oosawa, J. Polym. Sci., 1958, 33, 183–192 CrossRef CAS.
- S. Marín-Aguilar, F. Camerin and M. Dijkstra, J. Chem. Phys., 2022, 157, 154503 CrossRef PubMed.
- A. P. Thompson, H. M. Aktulga, R. Berger, D. S. Bolintineanu, W. M. Brown, P. S. Crozier, P. J. in ‘t Veld, A. Kohlmeyer, S. G. Moore, T. D. Nguyen, R. Shan, M. J. Stevens, J. Tranchida, C. Trott and S. J. Plimpton, Comput. Phys. Commun., 2022, 271, 108171 CrossRef CAS.
- L. Filion, M. Marechal, B. van Oorschot, D. Pelt, F. Smallenburg and M. Dijkstra, Phys. Rev. Lett., 2009, 103, 188302 CrossRef PubMed.
- J. de Graaf, L. Filion, M. Marechal, R. van Roij and M. Dijkstra, J. Chem. Phys., 2012, 137, 214101 CrossRef PubMed.
- P.-G. De Gennes and J. Prost, The physics of liquid crystals, Oxford University Press, 1993 Search PubMed.
- D. R. Nelson, Bond-orientational order in condensed matter systems, Springer Science & Business Media, 2012 Search PubMed.
- I. T. Jolliffe and J. Cadima, Philos. Trans. R. Soc., A, 2016, 374, 20150202 CrossRef PubMed.
- R. Van Damme, G. M. Coli, R. Van Roij and M. Dijkstra, ACS Nano, 2020, 14, 15144–15153 CrossRef CAS PubMed.
- D. Coslovich, R. L. Jack and J. Paret, J. Chem. Phys., 2022, 157, 204503 CrossRef CAS PubMed.
- C. M. Bishop and N. M. Nasrabadi, Pattern recognition and machine learning, Springer, 2006, vol. 4 Search PubMed.
- K. P. Murphy, Machine learning: a probabilistic perspective, MIT press, 2012 Search PubMed.
- A. Fortini, E. Sanz and M. Dijkstra, Phys. Rev. E: Stat., Nonlinear, Soft Matter Phys., 2008, 78, 041402 CrossRef PubMed.
- E. Zaccarelli, P. J. Lu, F. Ciulla, D. A. Weitz and F. Sciortino, J. Phys.: Condens. Matter, 2008, 20, 494242 CrossRef.
- J. Gagnepain and C. Roques-Carmes, Wear, 1986, 109, 119–126 CrossRef.
- J. Ruiz-Franco, F. Camerin, N. Gnan and E. Zaccarelli, Phys. Rev. Mater., 2020, 4, 045601 CrossRef CAS.
- L. Rossi, V. Soni, D. J. Ashton, D. J. Pine, A. P. Philipse, P. M. Chaikin, M. Dijkstra, S. Sacanna and W. T. Irvine, Proc. Natl. Acad. Sci. U. S. A., 2015, 112, 5286–5290 CrossRef CAS PubMed.
- L. Feng, B. Laderman, S. Sacanna and P. Chaikin, Nat. Mater., 2015, 14, 61–65 CrossRef CAS PubMed.
Footnotes |
| † Electronic supplementary information (ESI) available. See DOI: https://doi.org/10.1039/d3nr04816k |
| ‡ These authors contributed equally to this work. |
| This journal is © The Royal Society of Chemistry 2024 |