A novel atomic removal model for chemical mechanical polishing using developed mesoporous shell/core abrasives based on molecular dynamics†
Zhensong
Liu
a,
Zhenyu
Zhang
 *a,
Junyuan
Feng
*b,
Xian
Yi
 *c,
Chunjing
Shi
b,
Yang
Gu
d,
Feng
Zhao
a,
Shihao
Liu
e and
Jingru
Li
e
aState Key Laboratory of High-Performance Precision Manufacturing, Dalian University of Technology, Dalian 1160214, China. E-mail: zzy@dlut.edu.cn
bSchool of Mechanical Engineering, Hangzhou Dianzi University, Hangzhou 310018, China. E-mail: fjy@dlut.edu.cn
cKey Laboratory of Icing & Anti/De-icing, China Aerodynamics Research and Development Center, Mianyang 610082, China. E-mail: yixian@cardc.cn
dOffice of Research and Development, Hainan University, Haikou 570228, China
eCollege of Mechanical and Electrical Engineering, Hainan University, Haikou 570228, China
First published on 5th December 2023
Abstract
To improve polishing performance and reduce the environmental pollution of chemical mechanical polishing (CMP) tests, mesoporous shell/core silica abrasives were prepared, and a novel green CMP slurry was developed, including sorbitol, hydrogen peroxide and sodium carbonate. Prior to CMP, fused silica was roughly polished with ceria slurry. Using developed mesoporous abrasives, surface roughness Sa is reduced from 0.347 to 0.253 nm for a scanning area of 200 × 200 μm2, and the material removal rate (MRR) is increased from 70 to 127 nm min−1, compared with traditional solid abrasives. Based on molecular dynamics (MD) simulations, a novel atomic removal model is proposed for mesoporous abrasives through the immediate elastic recovery of atoms. MD simulations suggest that the formation of convex peaks and pits was inhibited by the mesoporous structure, promoting uniform distribution of surface atoms and atomic removal. This is different from a conventional simple increase of polishing times. In addition, more bridge bonds of Si–O–Si and a lower average Si–O bond order are produced in fused silica samples due to their mesoporous structure, contributing to a higher MRR.
Introduction
Chemical mechanical polishing (CMP) is an ultra-precision processing technology that integrates chemical corrosion and mechanical removal.1–6 This synergy serves to effectively diminish surface roughness and sub-surface damage, ultimately yielding an impeccably smooth and unblemished surface.7 In particular, abrasives in CMP play an important role in both fundamental mechanical force and bonding force on account of their advantages for material removal, and thus polishing performance is significantly affected by the morphology, structure, size and chemical composition of abrasives.8,9For decades, a series of research studies have been conducted to investigate the influence of abrasive morphology10,11 and the micro-topological structure12–15 on polishing performance. Liang et al. synthesized necklace-shaped silica particles which exhibited a superior material removal rate (MRR) from 13.4 nm min−1 to 22.2 nm min−1 compared with conventional silica particles.10 Compared with spherical particles, the MRR can be improved by 117.4% utilizing flower-shaped particles synthesized by Xu et al.11 While the above nanoparticles undeniably yield a substantial elevation in polishing efficiency, their discernible impact on enhancing the quality of the workpiece surface remains less pronounced. By contrast, the mesoporous structure exhibits a dual advantage, notably augmenting both polishing efficiency and surface quality, which has been confirmed in some reports.16–20 Ryu et al. discovered that the mesoporous structure of wrinkled silica nanoparticles increased the MRR by 89.3% and reduced root-mean-square (RMS) roughness from 0.226 nm to 0.164 nm compared to silica nanospheres.16 Chen et al. utilized the mesoporous structure to obtain superior polishing efficiency increasing from 21.1% to 163.9% and polishing quality improving from 32.2% to 60% in RMS relative to solid silica particles (sSiO2).17,18 Lei et al. prepared mesoporous structure alumina abrasives and obtained a higher MRR from 1.75 mg min−1 to 4.25 mg min−1 and reduced surface roughness by 12.2% compared with solid alumina abrasives.19 From the perspective of microstructure, mesoporous structure can be considered a normal abrasive with holes on its surface, akin to nanoscale cutting edges that encompass minute gaps.21 This intriguing attribute leads to the presence of what can be termed nanoscale gap multi-edges (NGMEs), which wield a dual advantage by positively influencing both surface roughness and the MRR in CMP. While a plethora of studies have concentrated on elucidating its efficacy and practical utility in polishing performance, the nuanced microscopic effects and underlying removal mechanisms intrinsic to the mesoporous structure in CMP have yet to receive unequivocal explication.
At present, due to the limitations of testing techniques, the mesoporous structure action mechanism during CMP remains elusive and cannot be directly observed or documented. Most previous reports concentrated on conducting various types of experimental characterization methods to infer the material removal mechanism, which is still hard and expensive.17,22 Molecular dynamics (MD) simulation provides an alternative solution, which has been proven effective in exploring the material removal mechanism.23 As a computational approach that explores atomic dynamic behaviors, MD simulations can intuitively reflect the dynamic evolution process of materials.24–27 Chen et al. explored the atomic adhesive behavior of silicon under impact processing of porous silica clusters based on classical MD, which mainly depended on the elastic–plastic deformation of abrasives during impact.24 Vo et al. utilized ReaxFF MD to investigate the influence of pore shape and porosity on the mechanical properties of abrasives.28 Regrettably, the atomic-scale mechanical and chemical removal effects of NGMEs pertaining to the mesoporous structure abrasives in CMP have received limited attention in the current work. Consequently, the specific way that NGMEs contribute to material removal remains an enigma, posing a substantial impediment to the advancement of subsequent nano/atomic-level processing methodologies. Through the meter per second (m s−1) level of polishing speed, the contact interval between two edges with a nanogap is just picosecond scale, which is consistent with MD. Thus, MD simulations stand as a judicious approach for investigating the intricate action mechanism underlying NGMEs and have the potential to elucidate the uncharted terrain of NGME-driven material removal.
Herein, to realize the complementarity of different structures and utilize the surface smoothing effect of spherical shape,1,29 mesoporous core/shell silica nanosphere abrasives (sSiO2@mSiO2) were synthesized and applied in CMP. According to CMP experiment results, sSiO2@mSiO2 manifest superior potential in both polishing efficiency and quality compared with sSiO2. After that, MD simulations were conducted to explore the chemical–mechanical cutting mechanism of NGMEs. In simulations, both classical and ReaxFF MD models with special double-tips representing the multiple edges of the mesoporous structure were established to synergistically investigate the action mechanism. This proposed approach provides a valuable analytical approach for nano/atomic scale processing and theoretical guidance for subsequent related work.
Methodology
Experiment details
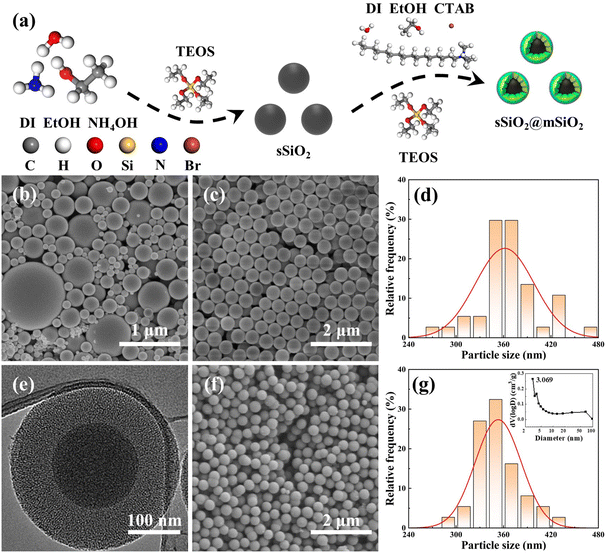
Since the sizes of commercial silica abrasives (cSiO2) from Jinan Zhongye New Materials Co., Ltd (China) were inconsistent (Fig. 1(b)), it was impossible to form a control experiment with a similar particle size, morphology and structure between sSiO2@mSiO2 and cSiO2, so the synthesis of sSiO2 was still required. Briefly, DI (45 mL), EtOH (45 mL) and NH4OH (14 mL) were mixed at room temperature. Next, TEOS (10 mL) was fast-injected into the mixed solution and stirred (600 rpm) for 4 h. Then silica particles from the solution were centrifuged (7000 rpm) and washed with EtOH and DI several times, and dried overnight at 80 °C. Finally, the sSiO2 was obtained after grinding and calcining at 550 °C for 8 h.
| Tests | Polishing slurry parameters | Process parameters | ||||
|---|---|---|---|---|---|---|
| Abrasive | Oxidant | pH regulator | Pressure | Speed | Flow rate | |
| Rough polishing | 4 wt% CeO2 | — | — | 27.5 kPa | 90 rpm | 15 mL min−1 |
| Fine polishing | 3 wt% cSiO2 | 5 wt% H2O2 | 0.4 wt% Na2CO3 | 37.5 kPa | 80 rpm | 20 mL min−1 |
| 3 wt% sSiO2 | ||||||
| 3 wt% sSiO2@mSiO2 | ||||||
Characterization
The morphology of silica abrasives was characterized by scanning electron microscopy (SEM) and transmission electron microscopy (TEM). Nitrogen (N2) adsorption/desorption and X-ray diffraction (XRD) were utilized to investigate the aperture distribution of sSiO2@mSiO2. An optical surface profiler (Zygo NewView™ 9000, USA) was applied to measure the surface roughness of silica samples. The surface topography of the silica samples was investigated using an optical microscope (BX53M, Olympus, Japan). The surface chemical information of fused silica was characterized by Fourier-transform infrared spectroscopy (FTIR), X-ray photoelectron spectroscopy (XPS) and Raman spectroscopy. A precision balance (Lichen, China) was utilized to weigh the mass of the silica samples before and after CMP. And the MRR of the samples was calculated using eqn (1): | (1) |
Molecular dynamics models
Due to the limitations of both classical MD and ReaxFF MD, it is difficult to comprehensively describe the NGME effect based on a single force field. In this work, two types of different force fields were combined to complement each other based on microscopic atoms. For classical MD, the influences under the mechanical effects of NGMEs on large area fused silica surfaces were investigated. On the other hand, chemical reactions and interatomic dynamic behaviors between the abrasive-slurry and the substrate in different systems were researched through the formation and breaking of chemical bonds by ReaxFF MD. The details of the model establishment are in the ESI.†Results and discussion
Experiment results
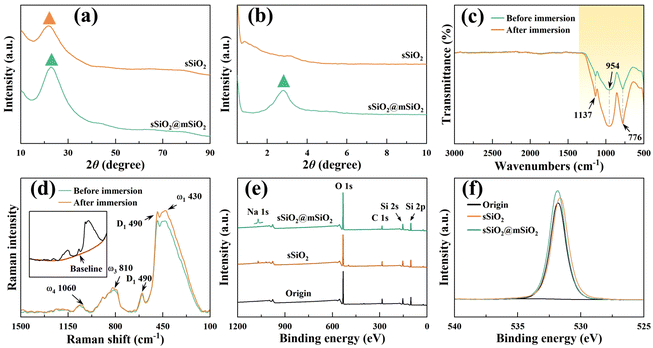
The micromorphologies of various silica abrasives utilized in CMP experiments are shown in Fig. 1(b)–(g). It can be found that cSiO2 has a much wider size distribution range (Fig. 1(b)), while both synthetic particles manifest outstanding size uniformity (Fig. 1(c), (e) and (f)). Furthermore, Fig. 1(d) and (g) illustrate the particle diameter distribution of sSiO2 and sSiO2@mSiO2 and the average particle sizes are 361.5 ± 37.2 nm and 353.3 ± 29.2 nm. Therefore, the influence of both particle size and shape on the CMP process is minimized and the comparison between abrasives is reasonable.To investigate the atomic arrangement and structure orderliness, wide-angle and small-angle XRD tests were conducted on two types of abrasives respectively (Fig. 2(a) and (b)). Fig. 2(a) shows that the diffraction intensity trends of double abrasives are basically identical, and both have feature peaks with a large distribution range around 2θ ≈ 22° instead of sharp diffraction peaks. Such peaks are attributed to atomic arrangement, which manifests that both particles belong to the amorphous silica structure.31 And that corresponds to the construction of molecular dynamics models. It can be seen from the small-angle diffraction pattern (Fig. 2(b)) that sSiO2@mSiO2 has an obvious feature peak near 2θ ≈ 2.82°, while the diffraction curve of sSiO2 is smooth as a whole. And the feature peak is associated with ordered pores of sSiO2@mSiO2.32 According to Bragg's equation (eqn (2)),33 the aperture corresponding to the feature peak value is 3.13 nm. Moreover, based on N2 desorption branching, the most probable aperture of synthetic sSiO2@mSiO2 analyzed by the Barrett–Joyner–Halenda (BJH) method is 3.069 nm (top right of Fig. 1(g)), which is consistent with the results of small-angle XRD. Therefore, sSiO2 and sSiO2@mSiO2 are consistent in atomic arrangement, and sSiO2@mSiO2 particles have an ordered mesoporous shell.
nλ = 2d![[thin space (1/6-em)]](https://www.rsc.org/images/entities/char_2009.gif) sin sin![[thin space (1/6-em)]](https://www.rsc.org/images/entities/char_2009.gif) θ θ | (2) |
To explore the possible chemical reactions during CMP, FTIR, XPS and Raman spectroscopy were performed on fused silica samples (Fig. 2(c)–(f)). Fig. 2(c) displays the transmittance difference before and after 12 h slurry immersion, and the difference occurs only in the yellow region. The infrared bands at 1137 cm−1 and 776 cm−1 are contributed by the antisymmetric and symmetric stretching vibrations of Si–O bonds,34,35 and the feature peak centered at 954 cm−1 corresponds to the Si–O antisymmetric tensile vibration from the silanol structure (![[triple bond, length as m-dash]](https://www.rsc.org/images/entities/char_e002.gif) Si–OH).36 Under the influence of the slurry, chemical reactions such as hydrogenation and hydroxylation occurred on the workpiece surface, which facilitated the increase of the oxidation degree and silanol content (eqn (3)–(7)). Therefore, the yellow region transmittance of fused silica is greatly reduced after immersion.37 The results of Raman spectroscopy and XPS also illustrate this point. Fig. 2(d) displays the Raman spectrum after subtracting the baseline. The main peak (ω1) centered at 433 cm−1 corresponds to the bond angle distribution of Si–O–Si, the bands at 490 cm−1 (D1) and 602 cm−1 (D2) are attributed to the vibrations of quaternary and ternary Si–O rings, respectively, and ω3 and ω4 are associated with the Si–O stretching vibration.38–40 After immersion, the feature peaks corresponding to ω1 and D1 were significantly enhanced, indicating an increase of oxygen content in fused silica. Fig. 2(e) shows that except for a few Na elements, no other impurity elements pollute the workpiece surface after CMP, which avoids serious damage to material properties. And the oxygen content of the workpiece surface increased slightly after polishing (Fig. 2(f)).
Si–OH).36 Under the influence of the slurry, chemical reactions such as hydrogenation and hydroxylation occurred on the workpiece surface, which facilitated the increase of the oxidation degree and silanol content (eqn (3)–(7)). Therefore, the yellow region transmittance of fused silica is greatly reduced after immersion.37 The results of Raman spectroscopy and XPS also illustrate this point. Fig. 2(d) displays the Raman spectrum after subtracting the baseline. The main peak (ω1) centered at 433 cm−1 corresponds to the bond angle distribution of Si–O–Si, the bands at 490 cm−1 (D1) and 602 cm−1 (D2) are attributed to the vibrations of quaternary and ternary Si–O rings, respectively, and ω3 and ω4 are associated with the Si–O stretching vibration.38–40 After immersion, the feature peaks corresponding to ω1 and D1 were significantly enhanced, indicating an increase of oxygen content in fused silica. Fig. 2(e) shows that except for a few Na elements, no other impurity elements pollute the workpiece surface after CMP, which avoids serious damage to material properties. And the oxygen content of the workpiece surface increased slightly after polishing (Fig. 2(f)).
| NaCO3 + H2O ⇌ 2Na+ + HCO3− + OH− | (3) |
| HCO3− + H2O ⇌ H2CO3 + OH− | (4) |
| H2O ⇌ H+ + OH− | (5) |
(![[triple bond, length as m-dash]](https://www.rsc.org/images/entities/char_e002.gif) Si)+ + OH− ⇌ ( Si)+ + OH− ⇌ (![[triple bond, length as m-dash]](https://www.rsc.org/images/entities/char_e002.gif) Si–OH) Si–OH) | (6) |
(![[triple bond, length as m-dash]](https://www.rsc.org/images/entities/char_e002.gif) Si–O)− + H+ ⇌ ( Si–O)− + H+ ⇌ (![[triple bond, length as m-dash]](https://www.rsc.org/images/entities/char_e002.gif) Si–OH) Si–OH) | (7) |
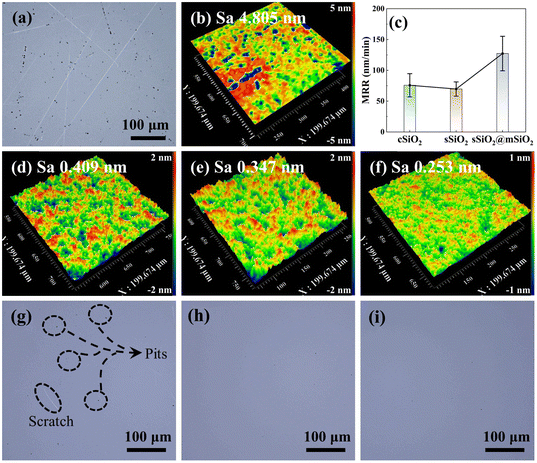
The surface morphology of fused silica after rough polishing is shown in Fig. 3(a) and (b). It can be seen that there are numerous scratches and pits on the workpiece surface after rough polishing and the surface roughness Sa is 4.805 nm. After fine polishing (Fig. 3(g)–(i)), the workpiece surface still manifests some defects such as pits and scratches in the cSiO2 system, while sSiO2 and sSiO2@mSiO2 induced samples are relatively smooth. This discrepancy can be attributed to the highly uneven particle sizes of cSiO2, whereas sSiO2 and sSiO2@mSiO2 demonstrate a more uniform particle size distribution. For consistent particles, the load from the workpiece will be evenly distributed on each particle during CMP. However, for inconsistent particles, the load is concentrated on a small fraction of particles with larger diameters. This concentration of load presses particles to a greater depth, leading to the formation of scratches and pits on the workpiece surface.
According to CMP characterization tests as shown in Fig. 3(c)–(f), the system induced by sSiO2@mSiO2 exhibits a higher MRR and better Sa. For CMP systems with cSiO2, sSiO2 and sSiO2@mSiO2, MRRs of fused silica are 76 ± 19 nm min−1, 70 ± 12 nm min−1 and 127 ± 28 nm min−1, respectively. And the Sa of cSiO2, sSiO2 and sSiO2@mSiO2 are 0.409 nm, 0.347 nm and 0.253 nm with a scanning area of 200 × 200 μm2, respectively. Compared to sSiO2, sSiO2@mSiO2 can induce an 81.4% higher MRR and lower the surface roughness by 27.1%. Since the size and shape of abrasives are identical and other polishing parameters are the same, these improvements are solely contributed by the mesoporous structure.
Influence of the removal of immediate elastic recovery atoms
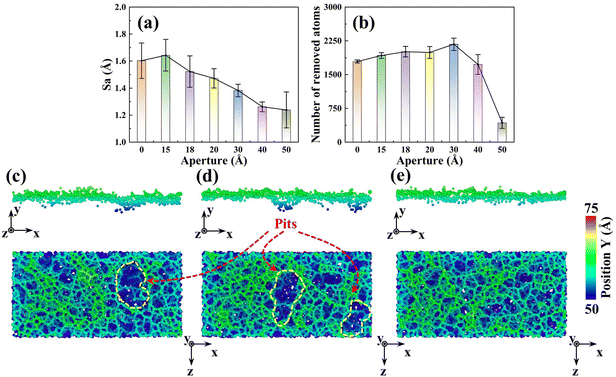
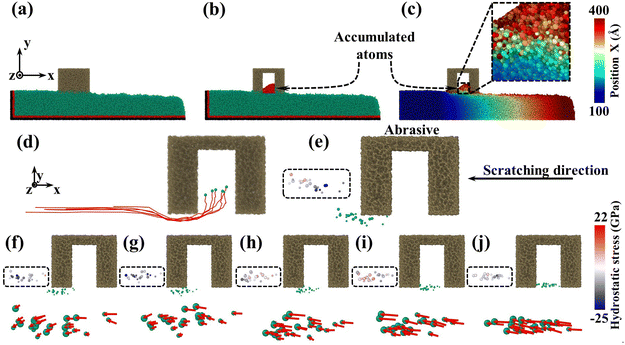
To reveal the mesoporous structure effect of sSiO2@mSiO2 abrasives, a series of CMP simulations induced by abrasives with different d1 (Fig. S1†) at 50 m s−1 were conducted and three simulations were carried out for each process parameter. Compared to the sSiO2 system, the system induced by 3 nm sSiO2@mSiO2 exhibits a 13.9% lower Sa and 383 more removed atoms (Fig. 4(a) and (b)), which matches the experiment results. Through further simulation, it is discovered that the surface roughness becomes lower as the aperture increases, and the number of removed atoms increases first from 0 to 3 nm and then decreases sharply (even less than the sSiO2 system), which indicates that superior Sa and MRR are both contributed by the mesoporous structure with an appropriate aperture.To investigate what causes the decrease in surface roughness, processed systems induced by both abrasives were explored (Fig. 5(a)–(c)). No accumulated atoms were formed in front of both abrasives while some atoms were embedded in the mesoporous gap as shown in Fig. 5(b). Fig. 5(c) illustrates that the top accumulated atoms were carried from a further distance, while the below ones were from adjacent spots. According to trajectory lines (Fig. 5(d)), the accumulated atoms experienced two stages of compression and rebound relative to the abrasive under continuous scratching, and a series of dynamic snapshots about some atoms were recorded (Fig. 5(e)–(j)). During MD simulations, the elastoplastic deformation occurred on the substrate surface. Firstly, only some atoms in the right direction were compressed (hydrostatic stress in blue, Fig. 5(e)). As scratching progressed, the left atoms were also pressed down and all atoms slipped slightly to the negative X axis (Fig. 5(f) and (g)). After the external load disappeared (abrasive leaving), immediate elastic recovery occurred under the action of interatomic repulsion on the substrate surface (hydrostatic stress turns pink)41–43 which was manifested by an upward bulge of the substrate relative to the abrasive bottom. For the presence of pores, the bulge would be embedded in the pores (Fig. 5(h) and (i)). As the abrasive moved, tips continued to squeeze and scratch the bulge, and then part of the bulge was removed (Fig. 5(j)), which inhibits the formation of convex peaks and promotes uniform distribution of surface atoms. Moreover, the removed atoms would accumulate gradually and the initial accumulated atoms would continue to rise during the removal of immediate elastic recovery atoms (RERA) subsequently (Fig. 5(c) and (d)), which is different from the adhesion removal of common abrasives in CMP.44,45
In addition to convex peaks, the formation of pits is also an important factor affecting roughness. As d1 increases, the pit region on the surface gradually becomes smaller (Fig. 4(c)–(e)). When d1 reaches 3 nm, large pits disappear and surface uniformity becomes better, which is consistent with the CMP experiments (Fig. 3(e) and (f)). Moreover, since the original surface after modeling was relatively smooth and Sa was near 0 (0.6853 Å), such pits were formed during the scratching process.
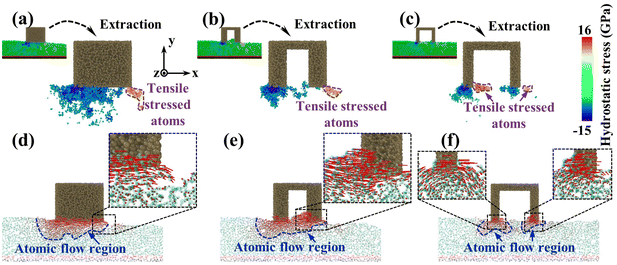
To investigate the reason for the formation of the pit region, the hydrostatic stress distribution and atomic displacement vector of the substrate were analyzed during CMP (Fig. 6). During sliding, workpiece atoms before and below the abrasive were squeezed to develop a compressive stress area. After the abrasive left, elastic recovery occurred behind the abrasive, and a tensile stress region was formed under the friction and adhesion of the abrasives. Meanwhile, under the friction effect, the plastic flow appeared on workpiece surface atoms below the abrasive. For the sSiO2 system, the contact atoms were subjected to violent friction and adhesion to form a wide range of tensile stress zones (Fig. 6(a)), which caused a large section of tensile fracture behind the abrasive and thus pits were formed (Fig. 6(d)). As the aperture increases, the friction and adhesion between the abrasive and the workpiece surface weaken continuously, and the high tensile stressed zone gradually approaches the workpiece surface (Fig. 6(a)–(c)). When d1 reaches 3 nm, the number of highly stressed atoms decreases significantly (Fig. 6(b)). Under the influence of nanoscale gaps, the REAR effect inhibits the formation of surface convex peaks and releases some stress from contact atoms, which reduces friction and adhesion below the second cutting edge. As a result, the range of the tensile stress region is obviously reduced (Fig. 6(b)), some atoms are accumulated before the second cutting edge by the RERA effect, and the depth of atomic flow behind the second edge is remarkably reduced (Fig. 6(e)). Therefore, inter-atomic tensile fracture can only occur in a few layers of surface atoms, which inhibits the formation of pits. In the 5 nm NGME system, the friction and adhesion are further weakened, and the distribution depth of high tensile stress atoms is pronouncedly lowered (Fig. 6(c)). Moreover, double almost independent atomic flow regions were formed below the two cutting edges and the atomic flow range was greatly reduced (Fig. 6(f)), which further improved surface quality.
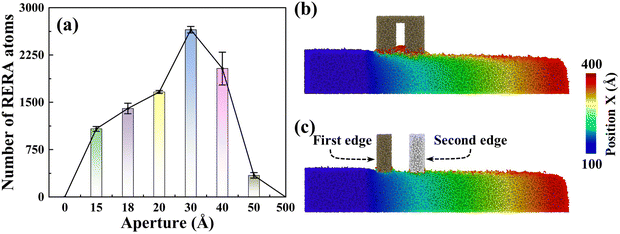
Notably impacting Sa, the influence of RERA extends to the MRR as well. The MRR is mainly contributed by two parts, namely, adhesive removal of the abrasive and the RERA effect. The accumulated atoms with more than 5 nm displacement in the X direction are defined as RERA atoms, which reflect the intensity of the RERA effect (Fig. 7(a)). From 0 to 3 nm systems, the RERA effect is continuously enhanced, which compensates for the slight decrease in abrasive adhesion, and a continuous increase in the number of removed atoms was observed (Fig. 4(b)). In the range of 3–5 nm, the RERA effect experiences substantial attenuation (Fig. 7(a) and (b)), concomitant with a diminishing adhesive influence of the abrasive. This brings about a pronounced decrease in the number of removed atoms, even less than that of the sSiO2 system. When d1 reaches 50 nm, scarcely any RERA atomic formation is observed (Fig. 7(c)), which illustrates that the RERA effect fundamentally differs from mere increasing in cutting number. This indicates that there is an optimal aperture size for RERA action, and too large or too small d1 will both weaken RERA action. For smaller pore sizes, the elastic recovery of atoms is limited and the RERA effect is weakened. For larger apertures, surface atoms complete elastic recovery and re-enter equilibrium, and the second cutting edge will return to adhesion removal mode, greatly reducing or even making RERA not occur. According to simulation results, the RERA effect is most significant when d1 is about 3 nm.
From the above analysis, the special atomic scale cutting effect (RERA) explained the better surface roughness and higher MRR induced by the mesoporous structure. And it was discovered that the RERA effect induced by 3 nm NGMEs was most significant and RERA bears an inherent distinction from the simple augmentation of cutting times. Such an effect is a vital factor in understanding mesoporous abrasive removal mechanisms and can be used in studying the benefits of porous abrasives in polishing more materials like sapphire and even SiC.
Effect of nanoscale gap multi-edges in chemical reactions
Though classical MD has successfully revealed the above special material removal mechanism that promotes the MRR utilizing porous abrasives, the chemical reaction aspect of such a process is still unknown. Whether NGMEs are capable of also promoting chemical reactions and leading to a higher MRR based on MD urgently needs to be investigated.Based on previous research,46,47 two essential stages in the process of removing atoms from fused silica exist: namely the formation of Si (substrate)–O–Si (abrasive) bridge bonds and the breaking of surrounding chemical bonds under the pull of bridge bonds.
(![[triple bond, length as m-dash]](https://www.rsc.org/images/entities/char_e002.gif) Si)+ + ( Si)+ + (![[triple bond, length as m-dash]](https://www.rsc.org/images/entities/char_e002.gif) Si–OH) ⇌ ( Si–OH) ⇌ (![[triple bond, length as m-dash]](https://www.rsc.org/images/entities/char_e002.gif) Si–O–Si Si–O–Si![[triple bond, length as m-dash]](https://www.rsc.org/images/entities/char_e002.gif) ) + H+ ) + H+ | (8) |
| H3O+ ⇌ H+ + H2O | (9) |
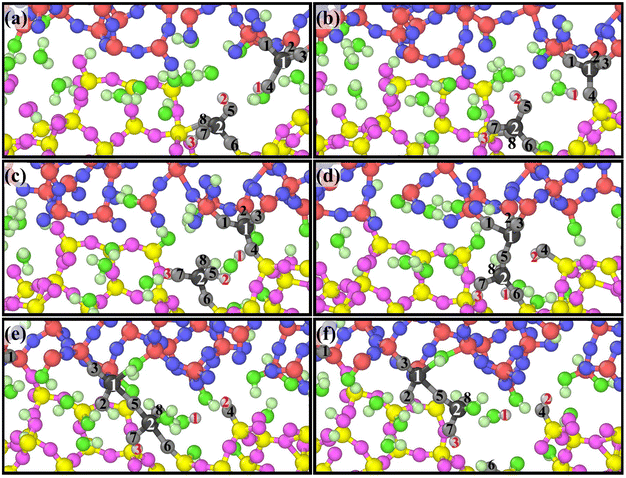
A group of atoms at the interface were tracked during scratching and a series of snapshots were captured as presented in Fig. 8 based on ReaxFF MD, which perfectly reveals the atomic removal process. Fig. 8(a)–(d) illustrate the formation of bridge bonds. Under the influence of the sliding process and surrounding atoms, Si1 and Si2 undergo dehydroxylation and dehydrogenation reactions, respectively, to form Si1–O5–Si2 bridge bonds. Fig. 8(e) and (f) indicate the breaking of surrounding chemical bonds under the pull of Si1–O5–Si2. The chemical reaction eqn (5)–(9) are involved in the whole process. According to the above dynamic process, the number of bridge bonds and the chemical bond stability are vital factors affecting material removal. Therefore, these two factors are the focus of the following exploration.
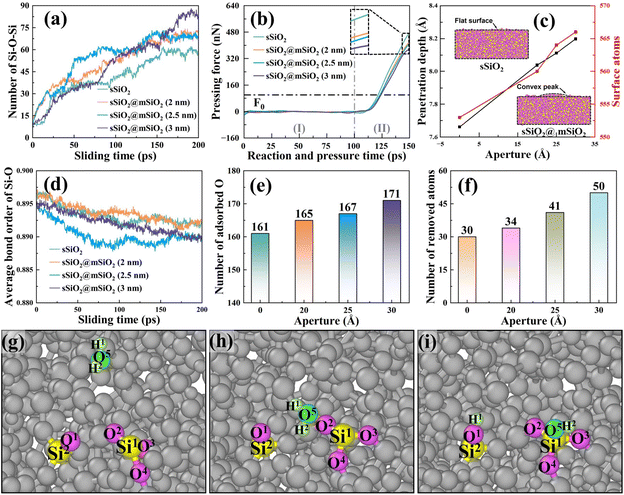
The number of Si (substrate)–O–Si (abrasive) bonds during the sliding process was counted as shown in Fig. 9(a), and it was found that more bridge bonds were commonly formed in sSiO2@mSiO2 systems, which means there were more atoms with a tendency to be removed.
To further explain the above difference, the information about pressing force and depth was processed and analyzed (Fig. 9(b) and (c)), and the Z-direction mean coordinate value difference of the abrasive bottom between the after-relaxation stage and under loading force F0 (100 nN) was defined as penetration depth. As d2 (Fig. S3†) increases, pressing force (Fz) decreases and penetration depth rises (Fig. 9(b) and (c)). The reason is that the effective contact area of sSiO2@mSiO2 samples is smaller than that of sSiO2 under the influence of NGMEs, resulting in a single substrate contact atom bearing a larger load under the same loading force. To balance the extra load, the contact area atoms of the substrate are further compressed to create greater interatomic forces and thus contribute to a deeper penetration depth. This indicates that the contact atoms of the substrate will be more strongly squeezed under the influence of NGMEs.
In fact, the slurry layer would hinder the contact between the abrasive and the substrate to form bridge bonds, and a stronger compression effect would encourage abrasives to break through the slurry layer and contact the substrate, facilitating the formation of more Si–O–Si bridge bonds.48 Furthermore, a nanoscale gap will inevitably reduce the compression area between the abrasive and the substrate, and thus the advantage of stronger compression in increasing bridge bonds is not obvious at the beginning of the sliding process. As abrasives slide, an under-compressed region corresponding to the original nanoscale gap is gradually compressed, and more bridge bonds in the sSiO2@mSiO2 system are formed under stronger compression (Fig. 9(a)).
Bond order is a numerical value that represents the strength of chemical bonds between atoms. The larger the bond order value is, the more stable the bond between atoms is, and the less likely the bond is to break.49 As shown in Fig. 9(d), the average Si–O bond order of the substrate of the sSiO2@mSiO2 system is generally lower than that of sSiO2, which indicates that the Si–O bonds of the substrate in the sSiO2@mSiO2 system are more unstable and it is easier to obtain enough energy to break through the energy barrier under external force to prompt atomic detachment and removal.
To further explore the reason for the difference in bond order, the number of substrate surface atoms was counted as presented in Fig. 9(c). It can be observed that the number of atoms on the workpiece surface is higher in the sSiO2@mSiO2 system, and this number increases with the growth of the nanoscale gap. Under the compression of a solid abrasive, the substrate surface atoms were squeezed evenly to form a flat surface. However, in the sSiO2@mSiO2 system, an under-compressed region was formed due to the nanoscale gap, which facilitated the formation of convex peaks on the surface and increased the number of surface atoms. For more surface atoms and stronger compression on contact atoms, more O atoms were adsorbed on the substrate surface for the oxidation reaction in the sSiO2@mSiO2 system (Fig. 9(e)), which is consistent with XPS results (Fig. 2(f)). Fig. 9(g)–(i) illustrate a common adsorption form of O atoms, which is consistent with the results of FTIR and Raman spectroscopy (eqn (5)–(7)). After the oxidation reaction (Fig. 9(e)), the coordination number of Si1 increases (from 3 to 4), which lowers the stability and average bond order value of Si–O.50,51
From the microscopic dynamic behavior of atoms, it can be found that more Si (substrate)–O–Si (abrasive) bridge bonds and a lower average bond order of Si–O bonds were formed in the sSiO2@mSiO2 system. The more bridge bonds indicate a tendency to remove more atoms, while the lower bond order value suggests that chemical bonds between atoms are more likely to break under the influence of an external force. Both factors contribute to the removal of a greater number of atoms. Therefore, the number of removed atoms in the sSiO2@mSiO2 system is universally higher than that in the sSiO2 system (Fig. 9(f)), which is consistent with the CMP experiments.
Conclusions
This work explored the NGME effect of sSiO2@mSiO2 on fused silica by MD simulations combined with correlative experiments. Experiment results illustrate that fused silica samples manifest superior surface quality and polishing efficiency induced by sSiO2@mSiO2 compared with sSiO2. Then based on a special material removal model caused by sSiO2@mSiO2, RERA was proposed. According to MD results, the RERA effect promotes atomic uniform distribution and removal and contributes to obtaining better surface quality and polishing efficiency compared with sSiO2, which is similar to CMP experiment results. After further analysis, the strength of RERA exhibits a close correlation with nanoscale apertures. The RERA effect is most significant when d1 equals 3 nm. And when the gap increases to a certain extent (i.e., 50 nm), the RERA effect almost disappears. Moreover, under the influence of sSiO2@mSiO2, more bridging bonds (from 20.7% to 41.4%) and lower average Si–O bond order values of fused silica were formed, which contributed to the removal of more atoms (from 13.3% to 60%). Therefore, the superiority of a mesoporous structure is well explained. This proposed approach offers a significant analytical method and theoretical guidance for related research work.Author contributions
Z. Y. Z. conceived the projects. Z. S. L. performed the experiments and simulation. Z. S. L. and J. Y. F. analyzed the mechanism and completed the manuscript. X. Y., C. J. S. and F. Z. revised the manuscript. Y. G., S. H. L. and J. R. L. characterized the samples. All authors discussed the results.Conflicts of interest
The authors declare no competing interests.Acknowledgements
The authors acknowledge the financial support from the National Key Research and Development Program of China (2018YFA0703400), the Basic Research Expenses for Provincial Colleges and Universities – Research and Innovation Project for Young Teachers (GK239909299001-021), the Young Scientists Fund of the National Natural Science Foundation of China (52205447), and the Changjiang Scholars Program of the Chinese Ministry of Education.References
- X. D. Feng, D. C. Sayle, Z. L. Wang, M. S. Paras, B. Santora, A. C. Sutorik, T. X. T. Sayle, Y. Yang, Y. Ding, X. D. Wang and Y.-S. Her, Science, 2006, 312, 1504–1508 CrossRef CAS.
- L. Wang, P. Zhou, Y. Yan, B. Zhang, R. K. Kang and D. M. Guo, Int. J. Mach. Tools Manuf., 2017, 120, 61–71 CrossRef.
- T. S. Kim, T. Konno and R. H. Dauskardt, Acta Mater., 2009, 57, 4687–4696 CrossRef CAS.
- C. Xiao, F. C. Hsia, A. Sutton-Cook, B. Weber and S. Franklin, Carbon, 2022, 196, 29–48 CrossRef CAS.
- K. C. Tseng, Y. T. Yen, S. R. Thomas, H. W. Tsai, C. H. Hsu, W. C. Tsai, C. H. Shen, J. M. Shieh, Z. M. Wang and Y. L. Chueh, Nanoscale, 2016, 8, 5181–5188 RSC.
- X. L. Shi, L. Xu, Y. Zhou, C. L. Zou, R. R. Wang and G. S. Pan, Nanoscale, 2018, 10, 19692–19700 RSC.
- M. Krishnan, J. W. Nalaskowski and L. M. Cook, Chem. Rev., 2010, 110, 178–204 CrossRef CAS PubMed.
- T. Y. Kwon, M. Ramachandran and J. G. Park, Friction, 2013, 1, 279–305 CrossRef.
- W. X. Xie, Z. Y. Zhang, L. X. Liao, J. Liu, H. J. Su, S. D. Wang and D. M. Guo, Nanoscale, 2020, 12, 22518–22526 RSC.
- C. Liang, L. Wang, W. Liu and Z. Song, Colloids Surf., A, 2014, 457, 67–72 CrossRef CAS.
- L. Xu, H. Lei, T. X. Wang, Y. Dong and S. W. Dai, Ceram. Int., 2019, 45, 8471–8476 CrossRef CAS.
- Y. Chen, Z. N. Li and N. M. Miao, Appl. Surf. Sci., 2014, 314, 180–187 CrossRef CAS.
- R. A. Pai, R. Humayun, M. T. Schulberg, A. Sengupta, J. Sun and J. J. Watkins, Science, 2004, 303, 507–510 CrossRef CAS PubMed.
- Y. M. Ren, D. Zhang, J. J. Suo, Y. M. Cao, F. T. Eickemeyer, N. Vlachopoulos, S. M. Zakeeruddin, A. Hagfeldt and M. Grätzel, Nature, 2023, 613, 60–65 CrossRef CAS PubMed.
- S. L. Yin, Z. Q. Wang, S. L. Liu, S. Q. Jiao, W. J. Tian, Y. Xu, X. N. Li, L. Wang and H. J. Wang, Nanoscale, 2021, 13, 3208–3213 RSC.
- J. Ryu, W. Kim, J. Yun, K. Lee, J. Lee, H. Yu, J. H. Kim, J. J. Kim and J. Jang, ACS Appl. Mater. Interfaces, 2018, 10, 11843–11851 CrossRef CAS.
- A. L. Chen, Y. Chen, Y. Y. Wang and J. W. Qin, J. Alloys Compd., 2016, 663, 60–67 CrossRef CAS.
- A. L. Chen, Y. Chen, X. B. Zhao and Y. Y. Wang, J. Alloys Compd., 2019, 779, 511–520 CrossRef CAS.
- H. Lei, L. Jiang and R. L. Chen, Powder Technol., 2012, 219, 99–104 CrossRef CAS.
- N. Tarutani, R. Sato, W. Yamazaki, K. Katagiri, K. Inumaru and T. Ishigaki, Nanoscale, 2021, 13, 11446–11454 RSC.
- Y. Chen, C. Z. Zuo, X. Y. Ma and A. L. Chen, J. Mater. Sci.: Mater. Electron., 2018, 29, 3817–3828 CrossRef CAS.
- Y. Chen, Y. Y. Wang, J. W. Qin and A. L. Chen, Tribol. Lett., 2015, 58, 37 CrossRef.
- A. González, A. Covarrubias-Pinto, R. M. Bhaskara, M. Glogger, S. K. Kuncha, A. Xavier, E. Seemann, M. Misra, M. E. Hoffmann, B. Bräuning, A. Balakrishnan, B. Qualmann, V. Dötsch, B. A. Schulman, M. M. Kessels, C. A. Hübner, M. Heilemann, G. Hummer and I. Dikić, Nature, 2023, 618, 394–401 CrossRef.
- R. L. Chen, R. R. Jiang, H. Lei and M. Liang, Appl. Surf. Sci., 2013, 264, 148–156 CrossRef CAS.
- R. L. Chen and S. Li, Friction, 2022, 10, 677–687 CrossRef.
- D. Y. Liang, J. Liu, H. Heinz, S. E. Mason, R. J. Hamers and Q. Cui, Nanoscale, 2022, 14, 7003–7014 RSC.
- J. Gilbert, I. Ermilova, M. Nagao, J. Swenson and T. Nylander, Nanoscale, 2022, 14, 6990–7002 RSC.
- T. Vo, B. He, M. Blum, A. Damone and P. Newell, Comput. Mater. Sci., 2020, 183, 109881 CrossRef CAS.
- Y. Chen and R. W. Long, Appl. Surf. Sci., 2011, 257, 8679–8685 CrossRef CAS.
- W. Stöber, A. Fink and E. Bohn, J. Colloid Interface Sci., 1968, 26, 62–69 CrossRef.
- C. Z. Geng, Z. C. Mei, X. Yao, C. Y. Wang, D. Y. Lu and W. Chen, Constr. Build. Mater., 2023, 362, 129787 CrossRef CAS.
- S. Luan, W. Li, Z. W. Guo, W. X. Li, X. Hou, Y. Song, R. Wang and Q. Wang, Green Energy Environ., 2022, 7, 1033–1044 CrossRef CAS.
- C. G. Pope, J. Chem. Educ., 1997, 74, 129 CrossRef CAS.
- W. C. Dong, C. G. Bao, K. Sun, H. Q. Ma, S. J. Li, T. X. Liu and W. Q. Lu, Addit. Manuf., 2022, 53, 102714 CAS.
- H. L. Zhang, Z. J. Xu, W. Sun, Y. G. Zhu, D. X. Chen and C. Y. Zhang, Appl. Surf. Sci., 2023, 612, 155884 CrossRef CAS.
- K. M. Davis and M. Tomozawa, J. Non-Cryst. Solids, 1996, 201, 177–198 CrossRef CAS.
- A. W. Smith and P. Hubert, Composites, Part B, 2023, 254, 110579 CrossRef CAS.
- M. Bergler, K. Cvecek, F. Werr, M. Brehl, D. D. Ligny and M. Schmidt, Int. J. Extreme Manuf., 2020, 2, 035001 CrossRef CAS.
- H. Wang, K. Zhao, H. Shen and Z. Q. Yao, J. Manuf. Process., 2020, 55, 87–95 CrossRef.
- C. H. Li, X. L. Kang, D. C. Luan, Q. H. Zhu and W. G. Zheng, Opt. Laser Technol., 2019, 111, 727–733 CrossRef CAS.
- S. H. Zhang, X. G. Guo, Z. J. Jin, R. K. Kang and D. M. Guo, Tribol. Int., 2020, 143, 106027 CrossRef CAS.
- Z. W. Sun, S. To, S. J. Zhang and G. Q. Zhang, Int. J. Mech. Sci., 2018, 140, 313–324 CrossRef.
- X. B. Jing, R. Y. Lv, Y. Chen, Y. L. Tian and H. Z. Li, Int. J. Mech. Sci., 2020, 176, 105540 CrossRef.
- J. Chen, L. Fang, H. Chen, K. Sun, S. Dang and J. Han, Mater. Chem. Phys., 2023, 293, 126927 CrossRef CAS.
- X. X. Cui, Z. Y. Zhang, S. Q. Yu, X. Chen, C. J. Shi, H. X. Zhou, F. N. Meng, J. X. Yu and W. Wen, Nanoscale, 2023, 15, 9304–9314 RSC.
- W. Liu, S. Yuan and X. G. Guo, Appl. Surf. Sci., 2022, 591, 153166 CrossRef CAS.
- H. T. He, S. H. Hahn, J. X. Yu, Q. Qiao, A. C. T. VanDuin and S. H. Kim, Acta Mater., 2020, 189, 166–173 CrossRef CAS.
- X. G. Guo, S. Yuan, J. X. Huang, C. Chen, R. K. Kang, Z. J. Jin and D. M. Guo, Appl. Surf. Sci., 2020, 505, 144610 CrossRef CAS.
- A. Coissard, D. Wander, H. Vignaud, A. G. Grushin, C. Repellin, K. Watanabe, T. Taniguchi, F. Gay, C. B. Winkelmann, H. Courtois, H. Sellier and B. Sacépé, Nature, 2022, 605, 51–56 CrossRef CAS.
- G. Ouyang, G. W. Yang, C. Q. Sun and W. G. Zhu, Small, 2008, 4, 1359–1362 CrossRef CAS PubMed.
- C. Q. Sun, Prog. Solid State Chem., 2007, 35, 1–159 CrossRef CAS.
Footnote |
| † Electronic supplementary information (ESI) available. See DOI: https://doi.org/10.1039/d3nr04420c |
| This journal is © The Royal Society of Chemistry 2024 |

