
 Open Access Article
 This Open Access Article is licensed under a Creative Commons Attribution-Non Commercial 3.0 Unported Licence
Surface modification effect on contrast agent efficiency for X-ray based spectral photon-counting scanner/luminescence imaging: from fundamental study to in vivo proof of concept†
Loic
Cuau
a,
Pia
Akl
bc,
A.
Gautheron
 bd,
Angèle
Houmeau
b,
Frédéric
Chaput
a,
Ala
Yaromina
e,
Ludwig
Dubois
e,
Philippe
Lambin
e,
Szilvia
Karpati
a,
Stephane
Parola
a,
B.
Rezaeifar
ef,
Jean-Baptiste
Langlois
g,
Salim A.
Si-Mohamed
bc,
Bruno
Montcel
b,
Philippe
Douek
bc and
Frederic
Lerouge
*a
bd,
Angèle
Houmeau
b,
Frédéric
Chaput
a,
Ala
Yaromina
e,
Ludwig
Dubois
e,
Philippe
Lambin
e,
Szilvia
Karpati
a,
Stephane
Parola
a,
B.
Rezaeifar
ef,
Jean-Baptiste
Langlois
g,
Salim A.
Si-Mohamed
bc,
Bruno
Montcel
b,
Philippe
Douek
bc and
Frederic
Lerouge
*a
aUniversité de Lyon, Ecole Normale Supérieure de Lyon, CNRS UMR 5182, Université Claude Bernard Lyon 1, Laboratoire de Chimie, 46 allée d'Italie, F69364 Lyon, France. E-mail: frederic.lerouge@ens-lyon.fr
bUniversité de Lyon, INSA-Lyon, Université Claude Bernard Lyon 1, UJM-Saint Etienne, CNRS, Inserm, CREATIS UMR 5220, U1294, F-69621, Lyon, France
cDepartment of Radiology, Hospices Civils de Lyon, 69500 Bron, France
dUniversité Jean Monnet Saint-Etienne, CNRS, Institut d'Optique Graduate School, Laboratoire Hubert Curien UMR 5516, F-42023, Saint-Etienne, France
eDepartment of Precision Medicine, The M-Lab, GROW – School of Oncology, Maastricht University, Maastricht, 6200, MD, The Netherlands
fResearch group NuTeC, Centre for Environmental Sciences, Hasselt University, Diepenbeek, Belgium
gCERMEP-imagerie du vivant, 59 boulevard Pinel, 69500 Bron, France
First published on 17th January 2024
Abstract
X-Ray imaging techniques are among the most widely used modalities in medical imaging and their constant evolution has led to the emergence of new technologies. The new generation of computed tomography (CT) systems – spectral photonic counting CT (SPCCT) and X-ray luminescence optical imaging – are examples of such powerful techniques. With these new technologies the rising demand for new contrast agents has led to extensive research in the field of nanoparticles and the possibility to merge the modalities appears to be highly attractive. In this work, we propose the design of lanthanide-based nanocrystals as a multimodal contrast agent with the two aforementioned technologies, allowing SPCCT and optical imaging at the same time. We present a systematic study on the effect of the Tb3+ doping level and surface modification on the generation of contrast with SPCCT and the luminescence properties of GdF3:Tb3+ nanocrystals (NCs), comparing different surface grafting with organic ligands and coatings with silica to make these NCs bio-compatible. A comparison of the luminescence properties of these NCs with UV revealed that the best results were obtained for the Gd0.9Tb0.1F3 composition. This property was confirmed under X-ray excitation in microCT and with SPCCT. Moreover, we could demonstrate that the intensity of the luminescence and the excited state lifetime are strongly affected by the surface modification. Furthermore, whatever the chemical nature of the ligand, the contrast with SPCCT did not change. Finally, the successful proof of concept of multimodal imaging was performed in vivo with nude mice in the SPCCT taking advantage of the so-called color K-edge imaging method.
Introduction
The development of original and efficient nanoparticle-based contrast agents represents a significant part of the ongoing improvements in medical imaging. The constant advances in the field of nanotechnology play a major role in offering new tools for enhanced and optimized imaging with great potential for clinical applications.1 Among the existing modalities, X-ray imaging techniques are most commonly used owing to their fast acquisition, high spatial resolution and low cost, which make them extremely relevant for use in clinics. A typical example is computed tomography (CT), which has become a widely used clinical X-ray imaging modality since its first development fifty years ago. In addition, other techniques such as X-ray micro-CT have received growing interest in life science imaging and preclinical studies on small animals thanks to their higher resolution.2,3 Constant developments of these X-ray imaging modalities have led to many newly emerging technologies such as the recent color K-edge imaging that have been deployed in spectral photon-counting CT (SPCCT).4–6 This new generation of CT systems combines high resolution (250 μm), element-specific imaging and in situ quantification.7,8 One issue still remains to be addressed due to the intrinsic X-ray absorption in normal tissues that leads to relatively low imaging sensitivity. Recently, X-ray-activated luminescence has been considered as a promising approach for high sensitivity and deep-tissue imaging.9,10 Indeed, the combination of X-ray excitation and visible luminescence successfully combines the strengths of both techniques: deep tissue penetration, low X-ray scattering in tissue, and negligible auto-fluorescence background.11The improvement of these techniques (CT, SPCCT and X-ray activated luminescence) is strongly related to the elaboration of novel X-ray sensitive contrast agents.12,13 Thus, intensive research has been conducted on the development of inorganic nanoparticles to improve contrast with the new SPCCT imaging modality14 and the optimization of luminescent nanoparticles for X-ray excited optical imaging.9,15 Unfortunately, very few studies propose the design of nanoparticles acting as innovative contrast agents for the effective combination of both X-ray based modalities.16–18 Indeed the possibility to bring together CT, SPCCT and X-ray activated optical imaging with the same nanoparticle-based contrast agent offers great interest for the development of multimodal imaging with strong impact on the future of diagnostics.
Within the toolbox of available nanoparticles, compositions sometimes include elements with high toxicity such as tungsten or chromium which despite good luminescence properties have limitations for further use in vivo.17,19 Lanthanide-based rare earth sodium fluoride nanoparticles NaREF4 are interesting systems featuring all the essential characteristics that make them ideal candidates with heavy elements, attractive optical properties with narrow emission bands and excellent photostability.20,21 The only weakness of these nanoparticles is their limited chemical stability in aqueous suspensions (pure water and buffers at pH 7.7 and 8.0) or under neutral physiological conditions.22–24
In this context, the aim of our work was to design multimodal contrast agents suitable for X-ray based imaging technologies with high colloidal stability and biocompatibility. Recently, we demonstrated that GdF3 nanocrystals (NCs) are efficient systems for in vivo imaging with SPCCT due to their X-ray attenuation properties.25 Indeed, gadolinium has a K-edge value in a range of energy perfectly suited for K-edge imaging with SPCCT technology (50.2 keV).26,27 Furthermore, this element is already used for MRI in clinics or in nanoparticle research development.28 Also, due to its very low solubility in aqueous media (less than 3 × 10⁻⁵ mol L−1), GdF3 can be considered as one of the most stable gadolinium derivatives, making it the matrix of choice for this work.29 The rational design of the targeted nanoparticles for X-ray imaging technologies requires a comprehensive understanding of the parameters inducing optimized luminescence, contrast with the scanner and biocompatibility. Hence, in order to impart luminescence X-ray activation properties, the GdF3 matrix was doped with various amounts of Tb3+ (from 0.20 moles to 0.05 moles). A systematic study using UV/Vis and X-ray irradiation identified the most relevant composition in terms of luminescence intensity and emission lifetime. For water dispersibility NCs were functionalized with various ligands and coatings including polyacrylic acid, sodium tripolyphosphate, polyethylene glycol bearing phosphonic acid function and a silica layer. Nevertheless, it is known that surface-linked molecules (e.g., C–H and O–H vibrational modes of ligands) or hydroxyl groups in aqueous media can act as luminescence quenchers.30,31 This motivated us to study the luminescence behavior of NC surfaces modified with the typical ligands and coating, expanding the knowledge of water dispersible X-ray activated nano-contrast agent properties. Finally, the interest and feasibility to use optimal systems for multimodal imaging in vivo were illustrated through a proof of concept with nude mice, upon X-ray activation in the SPCCT using a clinical sequence acquisition (Scheme 1).
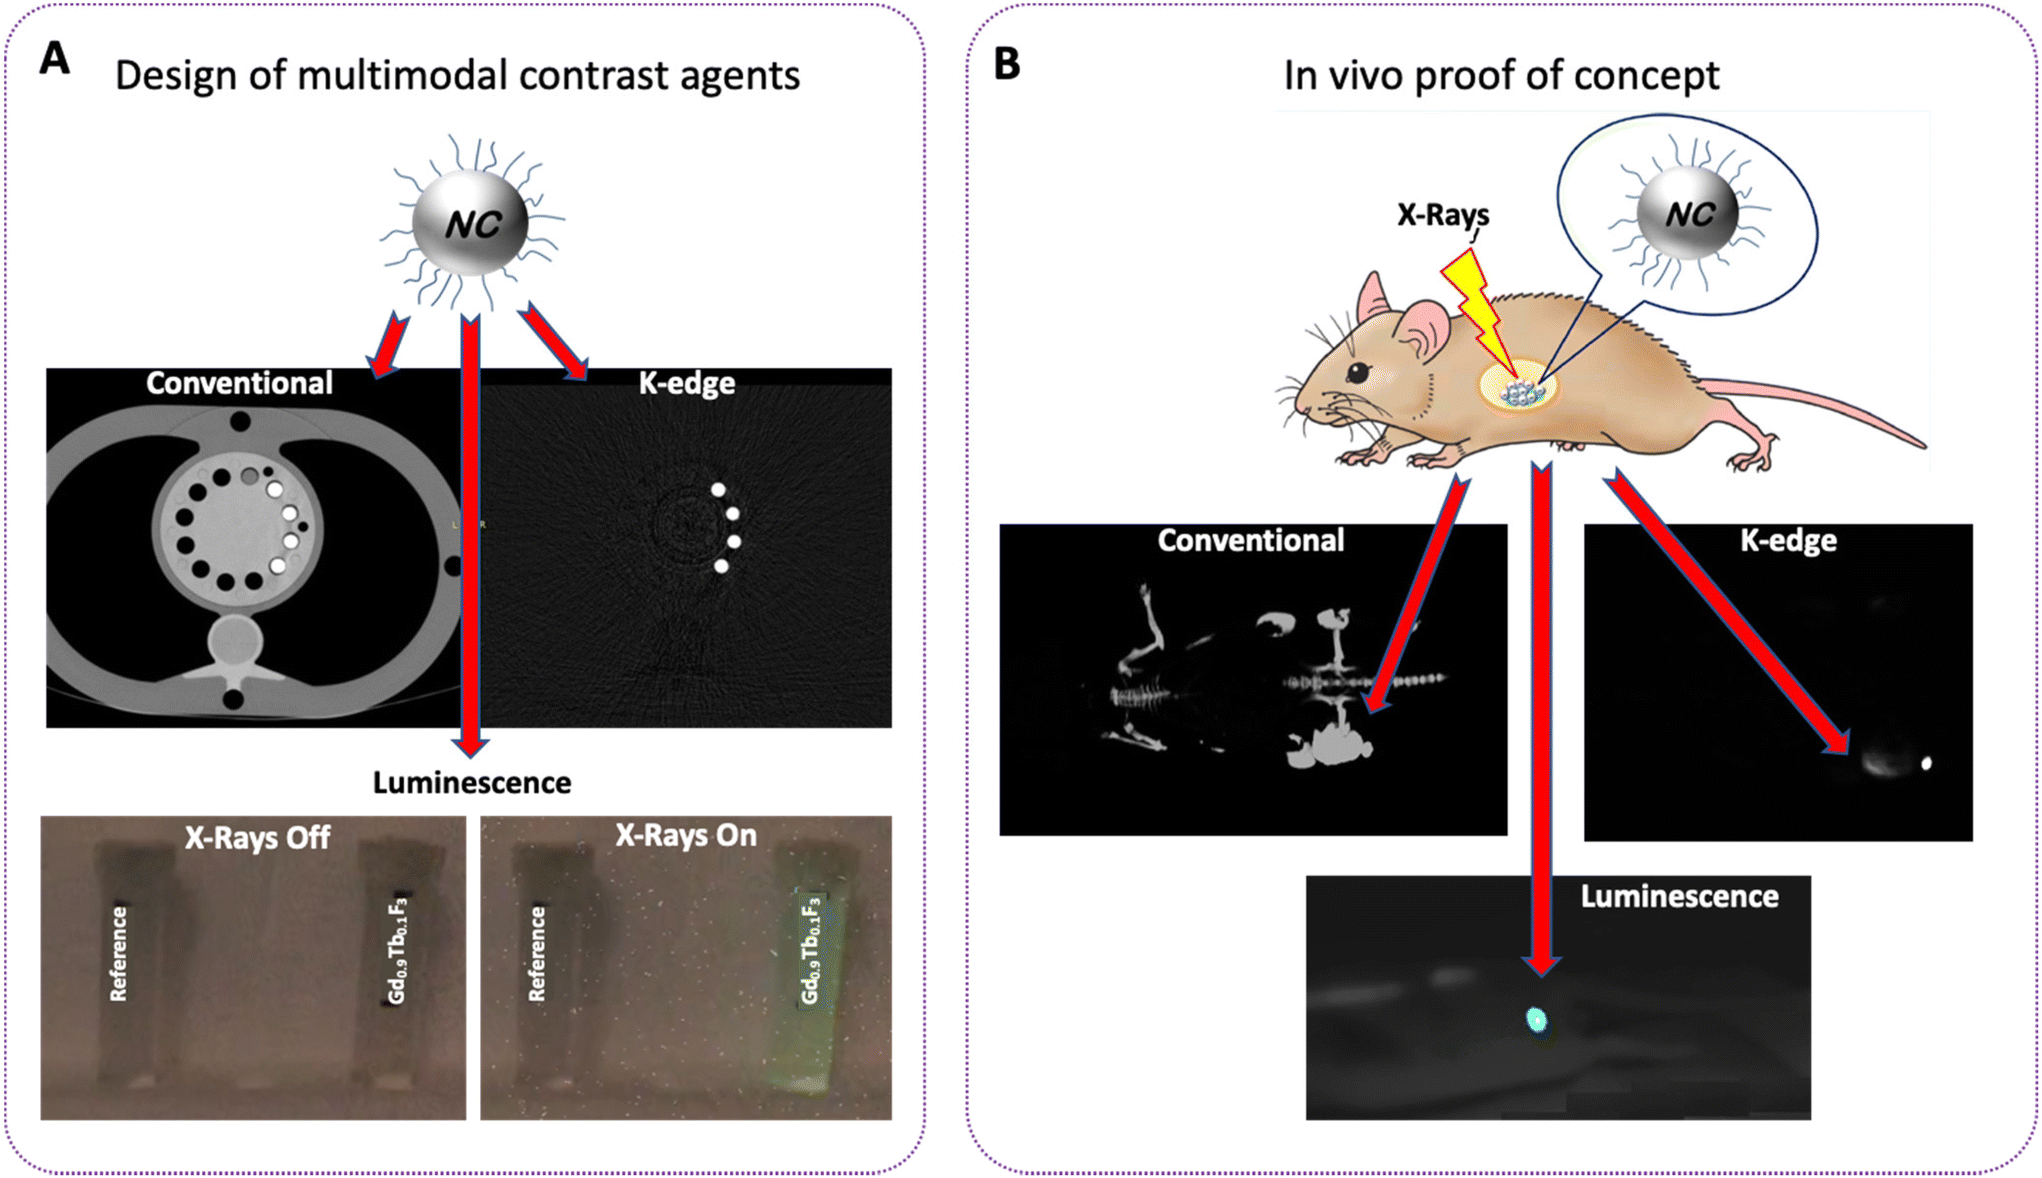 | ||
| Scheme 1 Conceptual advance of this work with (A). Demonstration of the spectral photon-counting scanner (conventional and color gadolinium K-edge)/luminescence imaging of optimized contrast agents, and (B). In vivo proof of concept for multimodal imaging. | ||
Experimental
Synthesis of NCs of various compositions
The typical procedure for the Gd0.80Tb0.20F3 composition is as follows (quantities are then adapted for other compositions): to a solution of GdCl3, 6H2O (3.87 g, 9.8 mmol) and TbCl3, 6H2O (0.21 g, 1.1 mmol) dissolved in ethylene glycol, a solution of hydrofluoric acid (875 μL, aqueous solution 50% by mass) with 2-pyrrolidinone is added. The transparent mixture is placed in a Teflon insert and then heated in an autoclave at 170° C for 1 hour. The resulting light brown product is treated with acetone to precipitate the nanoparticles. After purification steps by centrifugation–redispersion cycles in methanol the particles are finally dispersed in ultrapure water to give a transparent suspension.Surface modification of NPs with various ligands
Analysis of particle morphology and composition
DLS and zeta potential measurements were performed on liquid suspensions of the nanoparticles, using a Malvern Instruments Nano ZS. TEM images were acquired using a JEOL 2100F and operated at 120 kV. TGA analysis was performed on a Setaram LABSYS1600. FTIR spectra were recorded on a PerkinElmer Spectrum 65 equipped with an ATR module.Luminescence and lifetime measurements
The emission spectra of the NCs were measured with a Horiba–Jobin–Yvon Fluorolog-3 fluorimeter using a system of three monochromatic double-grid slits. The luminescence ground state was excited by unpolarized light emitted by a 450 W continuous xenon lamp. The spectra were plotted by correcting the spectrum of the lamp and that of the detector. For the terbium(III) doped samples the entrance and exit slits were set to a 2 nm width. In all cases, the integration time used was 0.1 s. The decay in luminescence was obtained using an FL-1040P pulsed xenon lamp and half-life times were calculated by exponential fit using Origin® software.Scintillation studies on micro-CT
Irradiation and imaging were performed using an X-RAD225Cx device (Precision X-Ray, North Brandford, CT) equipped with a copper X-ray tube and a tungsten anode with an aluminum filter. The irradiated samples are placed in quartz tanks. Scintillation was detected by a camera positioned vertically to the tank at an angle of 90° to the source in order to acquire maximum luminescence.Scintillation studies on SPCCT
SPCCT-induced luminescence measurements were performed using an experimental setup composed of an immersed optical fiber connected to a spectrometer. In addition, a homemade electronic circuit triggers the spectrometer with the X-ray emission. The cleaved end of the optical fiber (FG550UEC Thorlabs Inc.) was immersed in the nanoparticle solution and the SMA connector end was connected to the spectrometer via a round-to-linear bundle of fiber (PL200-2-VIS-NIR, Ocean Insight). The bundle maximizes the light signal entering the spectrometer (Ocean Insight MayaPro2000). The spectrometer has previously been calibrated in order to give absolute spectral irradiance measurements. The luminescence measurements were triggered by a dedicated electronic circuit that detects the excitation X-ray signal emitted from the SPCCT using a stand-alone X-ray detector (Philips). The detector is composed of a basic scintillation detector attached to a photodiode encapsulated in epoxy to protect the assembly. The trigger circuit is composed of 4 electronic stages for amplifying the signal from the detector which is wired to an input pin of the Arduino Board, which is required to generate a TTL signal. The TTL signal is then fed to the triggering pin of the spectrometer. The trigger circuit allowed us to measure the light spectra both during excitation (X-ray on) and background (X-ray off). The luminescence spectrum is obtained by subtracting the background spectrum from the excitation spectrum. This suppresses any background parasitic light that could impair the luminescence emission. Finally, we applied a sliding average filtering with a window of 3 pixels to reduce the noise.Clonogenic cell survival assay
MDA-MB-231 cells were seeded in 6 cm dishes and allowed to attach overnight. Then cells were incubated with either Gd0.90Tb0.10F3@SiO2@PEG or Gd0.90Tb0.10F3@PEG of various concentrations between 62.5 and 1000 μM for 24 h. Then, the cells were seeded in triplicate to allow colony (>50 cells) formation for 12 days. The number of colonies was manually counted and the surviving fraction was calculated as the number of colonies divided by the number of seeded cells normalized to the plating efficiency of the untreated controls.in vivo experiments
A nude Swiss female mouse used for the in vivo studies was purchased from Charles River Laboratories (7 weeks old) weighing about 30–35 g. The animal was provided with standard mouse food and water ad libitum and maintained under conventional housing conditions in a temperature-controlled room with a 12-hour dark–light cycle. All experiments were carried out in accordance with the European Directive 2010/63/UE, approved by the Ethics Committee (CELYNE CEEA42) and authorized by the Ministry of Higher Education, Research and Innovation (APAFIS#19829).Results and discussion
Design and characterization of the NCs
NCs with four compositions were prepared under solvothermal conditions, following a previously described process with some modifications.32 Briefly, the desired amounts of rare earth salts of Gd3+ and of Tb3+ (with respective molar ratios 0.95/0.5; 0.90/0.10; 0.85/0.15 and 0.80/0.20) in ethylene glycol were reacted with a charge transfer complex involving F− anions and protonated pyrrolidinone. The mixture was heated in an autoclave for 1 hour and purified by centrifugation/redispersion steps to finally give a clear, colorless suspension of nanoparticles in water.Powder X-ray Diffraction (PXRD) confirmed that all samples have a highly crystalline structure with a GdF3 orthorhombic phase (Pnma space group, lattice parameters: a = 6.5710 Å, b = 6.9850 Å, c = 4.3930 Å and α = β = γ = 90°) when compared to the ICDD 00-049-1804 theoretical pattern (Fig. 1A and Fig. S1†). The composition of the prepared systems was determined by elemental analysis (Inductively Coupled Plasma – ICP) confirming that for all four compositions, the ratio between Gd3+ and Tb3+ in the inorganic core was consistent with what was expected for the synthesis (Table S2†).
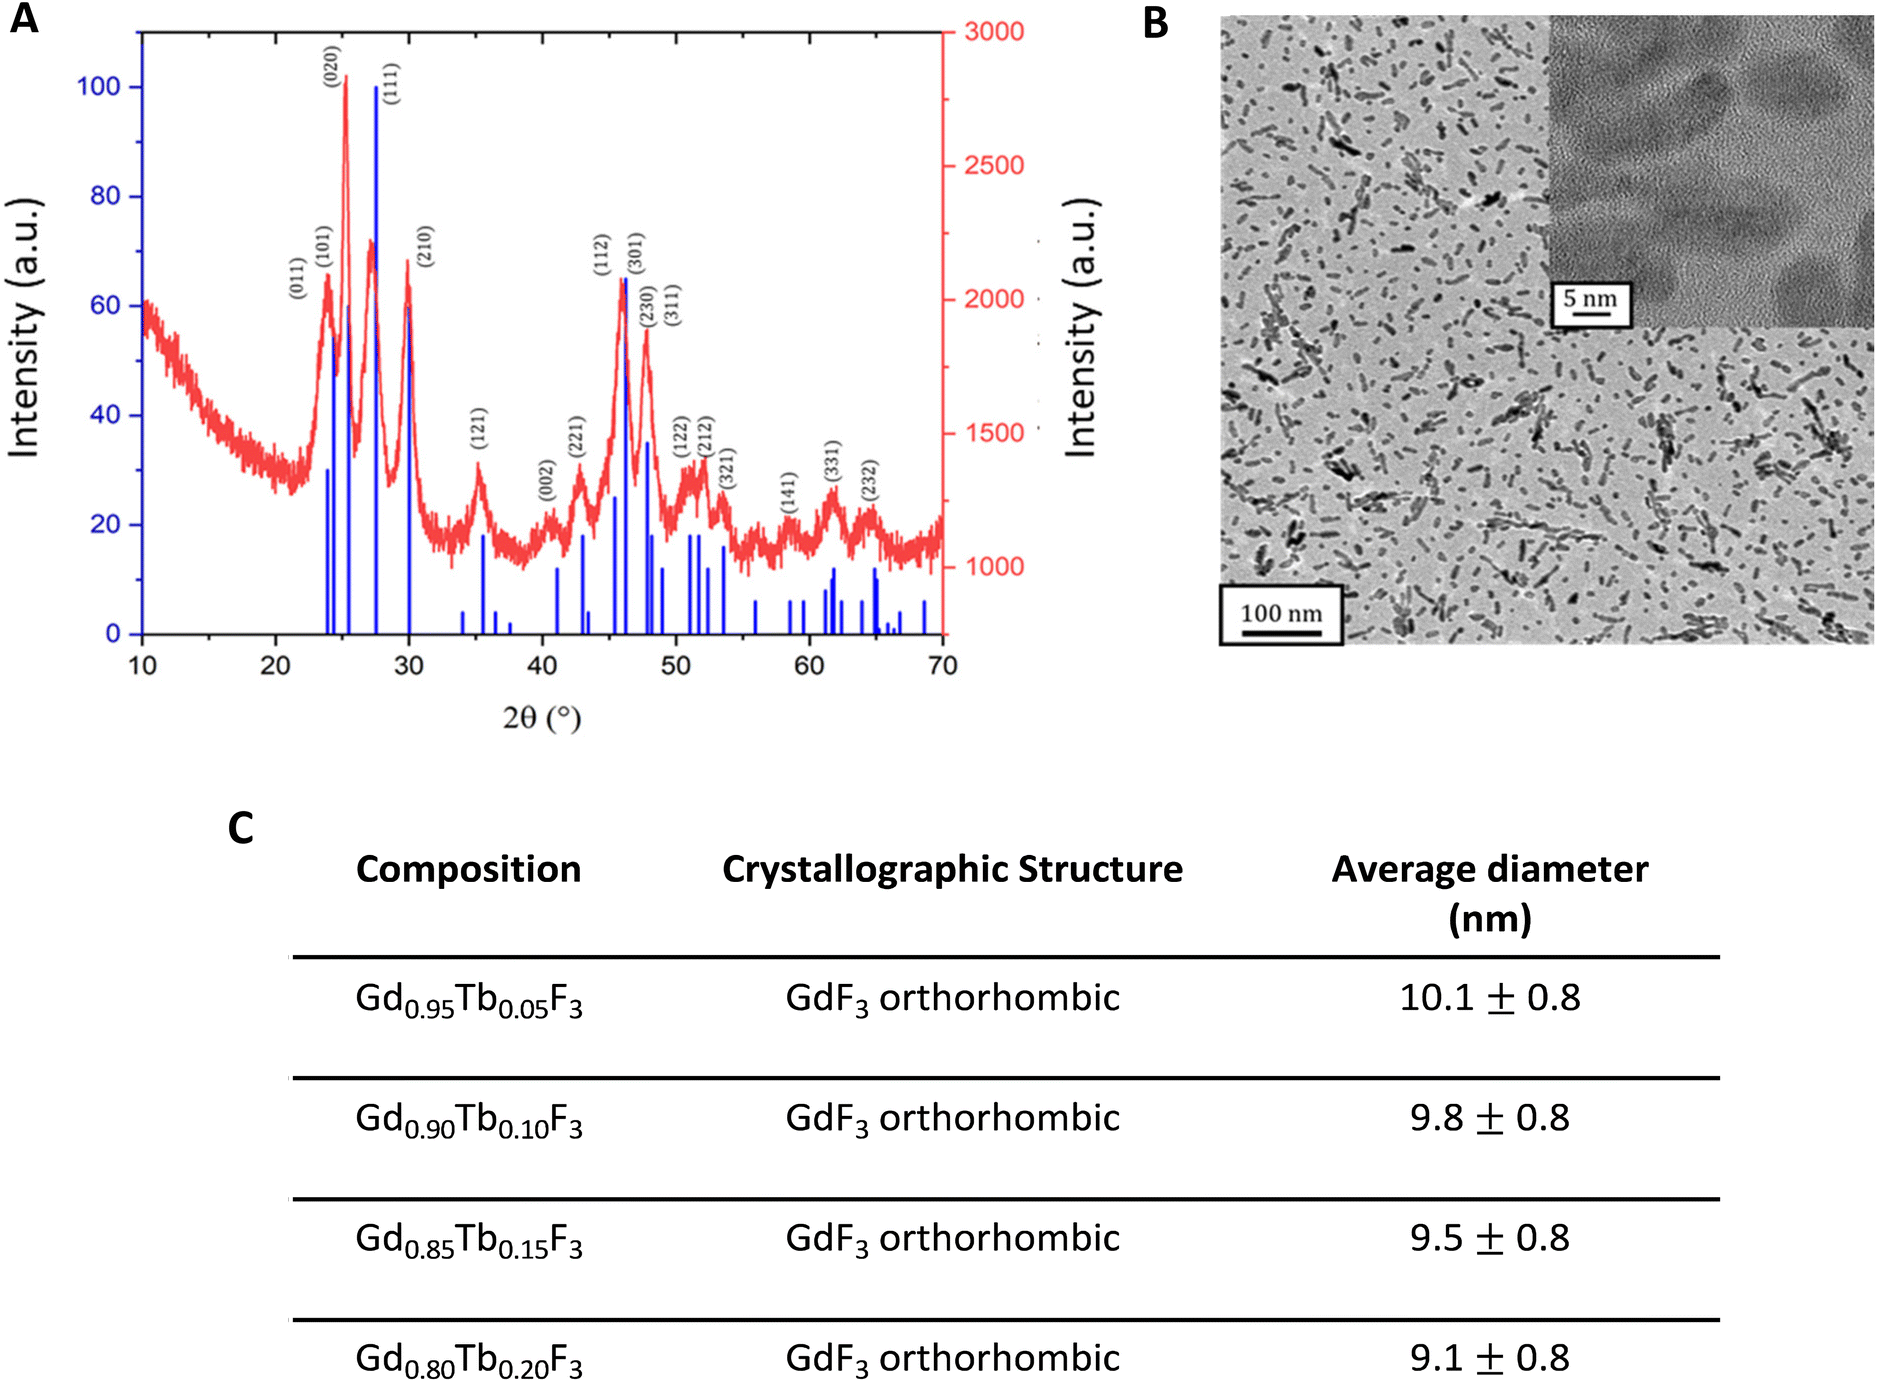 | ||
| Fig. 1 (A) PXRD of Gd0.95Tb0.05F3 (red line) compared with the ICDD 00-049-1804 theoretical pattern (blue lines). (B) TEM image of NCs. HRTEM of the same sample in the inset. (C) Results of the PXRD and TEM results for all compositions. | ||
The size and morphology of the nanoparticles were characterized by transmission electron microscopy (TEM) and dynamic light scattering (DLS). Whatever the composition, the NCs show slightly elongated morphologies (“bean-like”) with a 9.8 ± 0.8 nm average gyration diameter (Fig. 1B).
DLS measurements in water showed a low polydispersity of NCs and hydrodynamic diameters in the 13–18 ± 3 nm range (Table S3†). These results confirm that the amount of terbium added did not affect the size, the morphology or the crystallinity of the desired nanocrystals. Zeta potential measurements in water (pH 6) gave positive values of 48 ± 2 mV, whatever the composition, confirming the high colloidal stability of these systems. The positive charge can be explained by the excess of lanthanide ions on the surface in accordance with energy dispersive X-ray spectroscopy analysis (Fig. S4†).
Fourier-transform infrared spectroscopy (ATR-FTIR) analysis shows specific bands of remaining 2-pyrolidinone molecules on the surface of the particles as previously observed.33 Upon coordination through the oxygen atom of the carbonyl bond, the C![[double bond, length as m-dash]](https://www.rsc.org/images/entities/char_e001.gif) O stretching vibration frequency of 2-pyrrolidinone shifts from 1679 cm−1 to 1648 cm−1. The bands of the molecule in the range 1463–1424 cm−1 can be attributed to C–H deformations and they are shifted to 1448 cm−1 once on the NPs. Finally, the C–N vibration of the 2-pyrrolidinone cycle, initially observed at 1284 cm−1, shifts to 1313 cm−1 suggesting interactions between the nitrogen atoms and lanthanides on the surface of the particles.
O stretching vibration frequency of 2-pyrrolidinone shifts from 1679 cm−1 to 1648 cm−1. The bands of the molecule in the range 1463–1424 cm−1 can be attributed to C–H deformations and they are shifted to 1448 cm−1 once on the NPs. Finally, the C–N vibration of the 2-pyrrolidinone cycle, initially observed at 1284 cm−1, shifts to 1313 cm−1 suggesting interactions between the nitrogen atoms and lanthanides on the surface of the particles.
Optical properties of the NCs
The luminescence properties of the NCs were first studied upon excitation at 273 nm in water (0.30 M in lanthanides). This wavelength corresponds to the transition between the energy levels 8S7/2 and 6IJ of Gd3+ (Fig. 2).34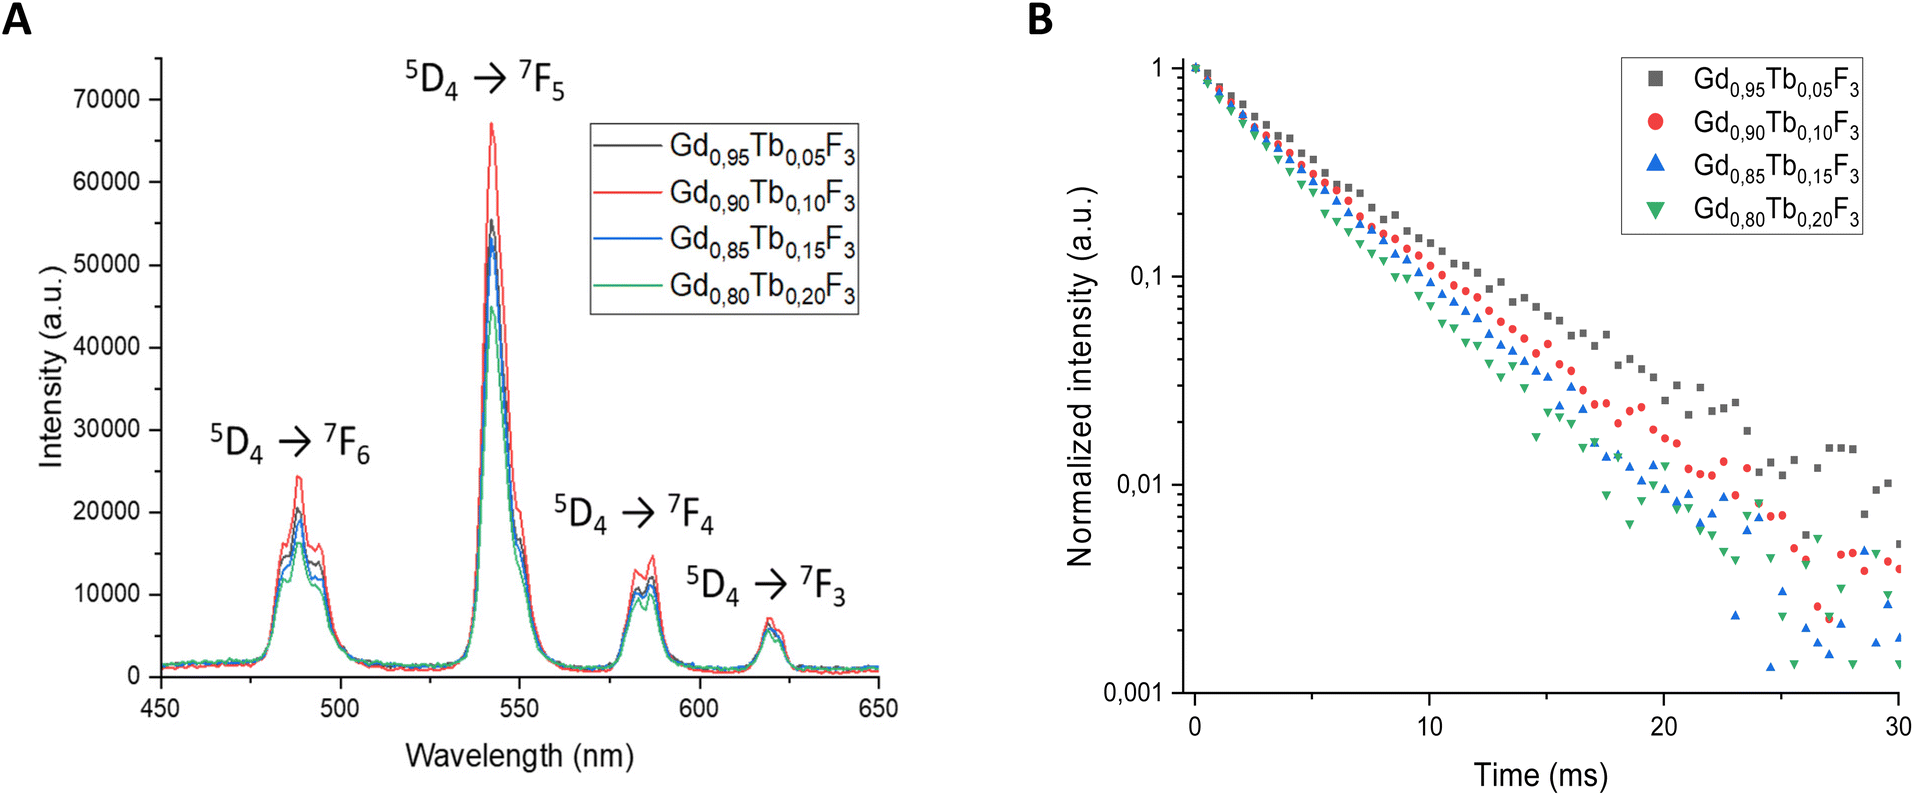 | ||
| Fig. 2 (A) Luminescence spectra of the various NC compositions after excitation at 273 nm. (B) Lifetime decay measurements after excitation at 273 nm. | ||
For all cases, the emission spectra observed are characteristic of Tb3+ and the bands centered at 488 nm, 543 nm, 582 nm and 619 nm correspond to the energy transition from 5D4 to 7FJ (J = 6, 5, 4, 3).35 The maximum luminescence intensity is observed for the Gd0.90Tb0.10F3 composition and other systems show lower intensities independent of Tb3+ amount. Furthermore, when the molar ratio of Tb3+ increases above 0.10 the luminescence decreases. This result can be explained by the interactions between Tb3+ ions in excited states. When the ions are in close vicinity within the NP matrix, phenomena such as reabsorption and non-radiative deexcitations lead to the quenching of luminescence. To further confirm the optimum wavelength of excitation, spectra of the Gd0.90Tb0.10F3 composition were recorded at each emission band of Tb3+ (i.e. 488 nm, 543 nm, 582 nm, 619 nm). Whatever the Tb3+ band considered, the excitation spectra show an intense signal centered at 273 nm (Fig. S5†). This corresponds to the transition of the energy level of the Gd3+ present in the crystalline matrix (8S7/2 to 6IJ), proving that the emission of the NCs results from an energy transfer from Gd3+ to Tb3+.
Measurements of the luminescence decay of each composition were conducted at 543 nm with an excitation wavelength of 273 nm. The decays fit well with a monoexponential rate and the respective fluorescence lifetimes were evaluated for the different ratios of Gd3+/Tb3+ (Table 1).
| Composition | Lifetime (ms) | Correlation coefficient |
|---|---|---|
| Gd0.95Tb0.05F3 | 4.30 ± 0.04 | 0.998 |
| Gd0.90Tb0.10F3 | 4.84 ± 0.04 | 0.998 |
| Gd0.85Tb0.15F3 | 4.04 ± 0.03 | 0.998 |
| Gd0.80Tb0.20F3 | 3.57 ± 0.03 | 0.998 |
All lifetime values are in the 4.04–4.84 ms range except for the Gd0.80Tb0.20F3 composition with a lifetime of 3.57 ms. The lifetime results follow the trend observed with luminescence intensity and a maximum is measured for an optimal molar amount of Tb3+. Indeed, the Gd0.90Tb0.10F3 composition shows both the highest luminescence lifetime (4.84 ms) and the highest intensity. As lifetime can be directly linked to photoluminescence quantum yield,36 the Gd0.90Tb0.10F3 NPs seem to present the most interesting optical properties, and this composition will be the candidate of choice for further studies with X-rays. To evaluate the ability of the NCs to emit light upon excitation with X-rays, a specific setup in a Micro-CT device was first used (Fig. S6†). This setup allows the irradiation of the sample with various X-ray energies and recording of the emitted light with an optical camera. For comparison, two compositions Gd0.90Tb0.10F3 and Gd0.80Tb0.20F3 were studied in suspension in water (0.5 M of lanthanides). The intensity of luminescence produced under X-ray irradiation at different energies is detailed in Fig. 3A and B.
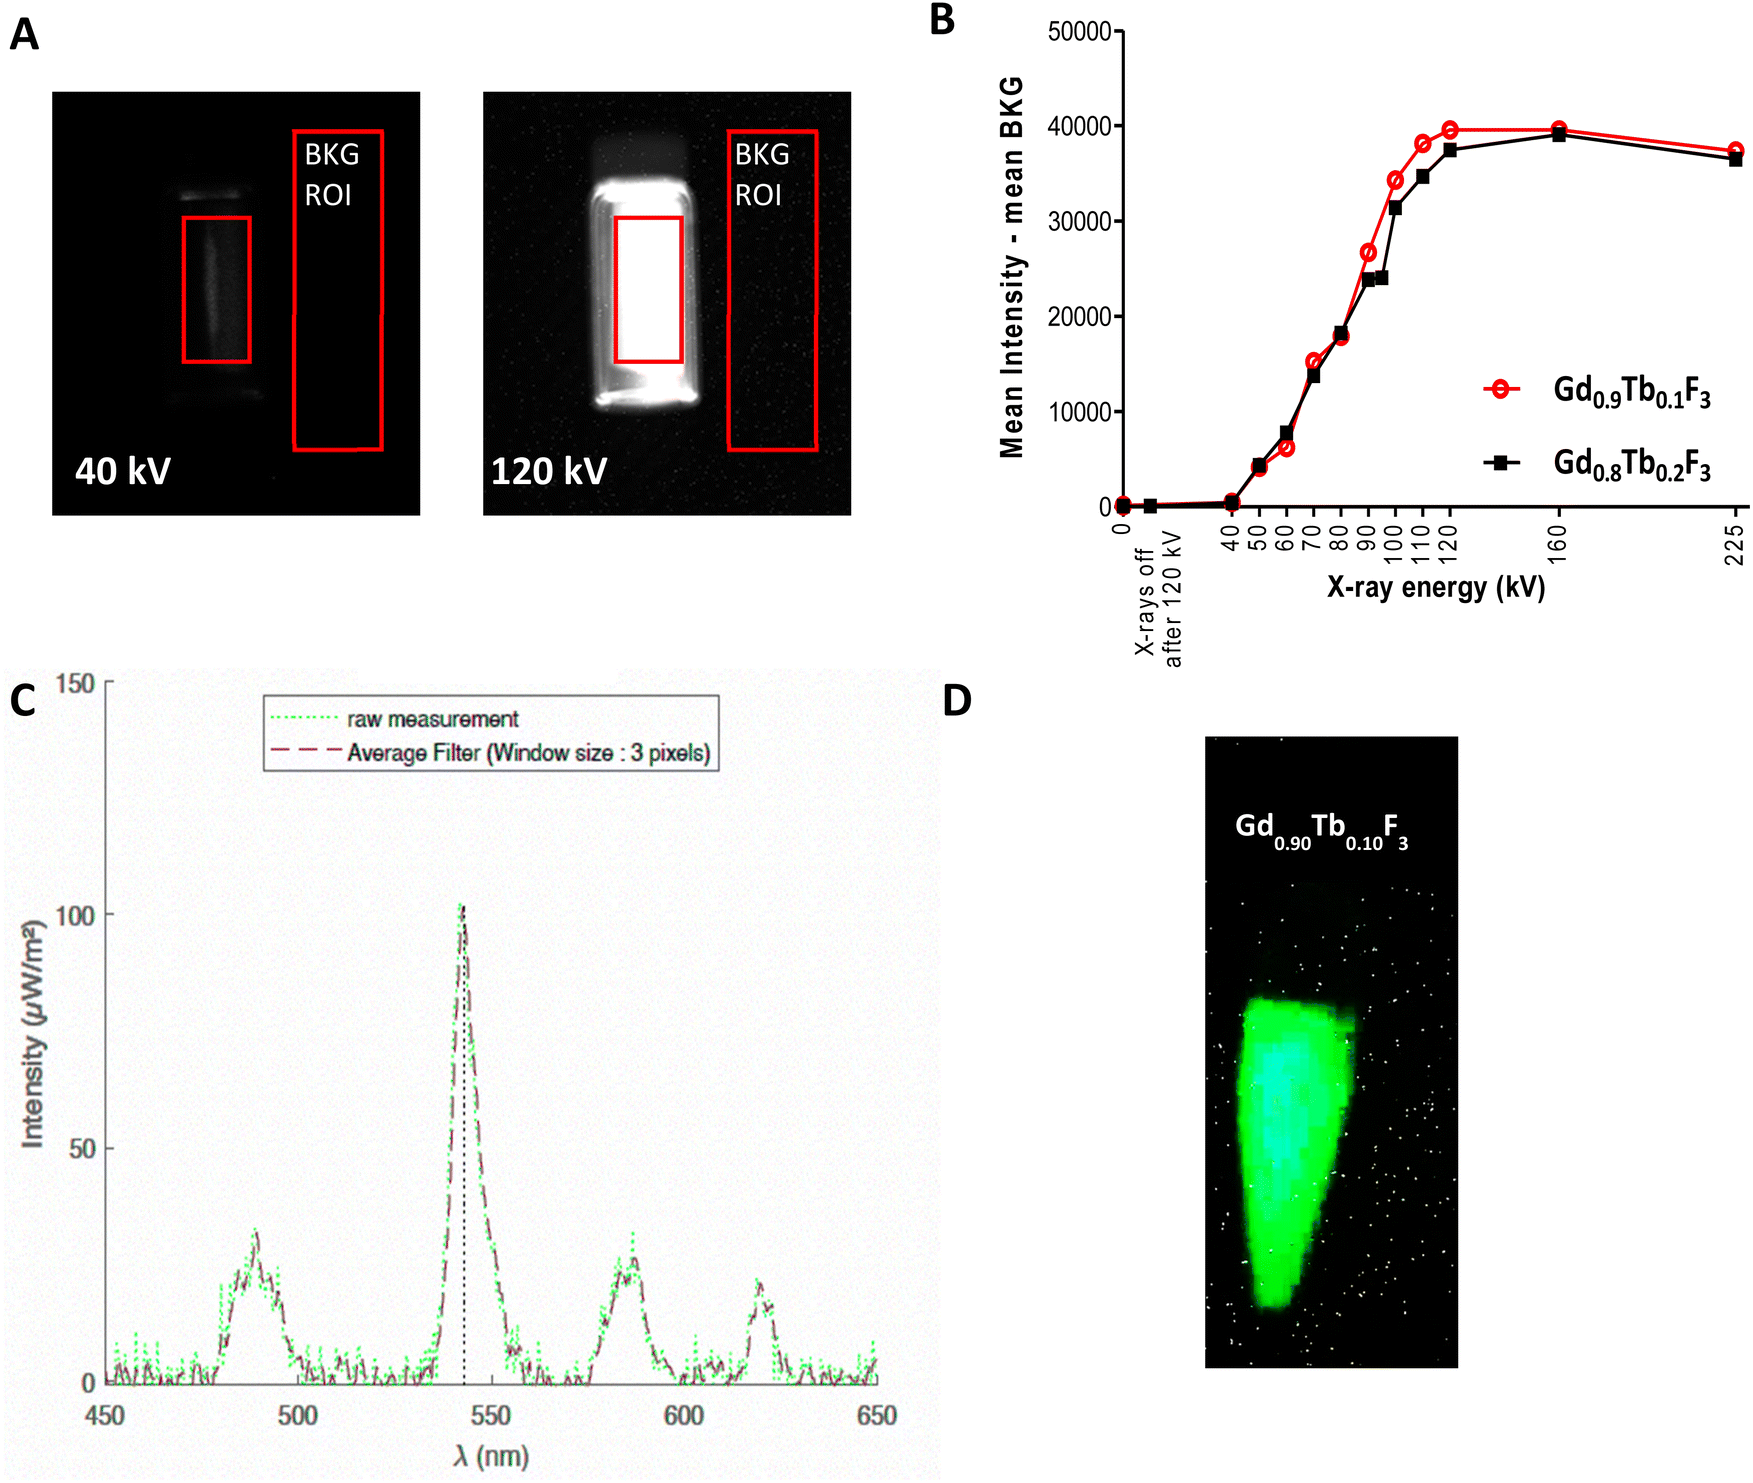 | ||
| Fig. 3 (A) Images of the tube containing the colloidal suspension of Gd0.9Tb0.1F3 at various energies of X-ray excitation (2.5 mA, Cu filter). Red areas correspond to the ROI (luminescence and background – BKG) to determine the final intensity. (B) Evolution of luminescence intensity as a function of the X-ray energy of excitation. (C) Emission spectra of the colloidal suspension of Gd0.9Tb0.1F3 in the spectral photocount scanner at an energy of 120 kV and 300 mAs. (D) Image of a tube containing an aqueous suspension of Gd0.9Tb0.1F3 in water (0.5 M) subjected to X-rays in the SPCCT. | ||
Below 40 kV, no emission from the NCs is detected. For energies between 40 kV and 120 kV, the luminescence intensity increases with X-ray energy following a linear behavior until reaching a plateau after 120 kV. At that point, the inorganic matrix of GdF3 absorbed the maximum energy it could. The two compositions follow the same profile with a slightly higher intensity observed for Gd0.90Tb0.10F3 in the 90–120 kV energy range. These results seem to agree with the experiments performed with UV excitation, although intensities measured with X-rays are in the same margin of error.
Since the targeted application is the use of these systems as dual contrast agents with SPCCT, luminescence measurements were performed on Gd0.90Tb0.10F3 suspension in water with the spectral scanner (Fig. 3C and D). When subjected to X-rays (120 kV, 300 mAs) a green light, specific to Tb3+, is observed and imaged (Fig. 3D). The dedicated setup using an optical fiber (Fig. S7†) allows the measurement of the spectra of Gd0.90Tb0.10F3 during excitation. These spectra present the four characteristic bands of Tb3+ luminescence centered at 488 nm, 543 nm, 582 nm and 619 nm (Fig. 3C). This result proves the ability of the NCs to generate visible light upon excitation with X-rays from a clinical scanner.
Medical imaging with the NCs
After confirming the luminescence properties of these systems with X-rays, their efficiency as contrast agents for CT imaging has been evaluated. Previous studies have shown that there is interest in using GdF3 nanoparticles as a contrast agent for conventional CT imaging and K-edge imaging.25,33 The composition with optimal luminescence properties Gd0.90Tb0.10F3 was therefore studied to evaluate its ability to generate contrast. A range of suspensions with increasing concentrations of rare earth elements (0.015 M, 0.035 M, 0.1 M, 0.17 M, 0.25 M, and 0.300 M) was placed in a dedicated phantom. The acquisition sequence was the same as generally used in conventional imaging for a patient (120 kVp and 200 mAs). Conventional and color K-edge CT imaging of the suspensions was performed in parallel to the quantification of the contrast agent concentration (Fig. 4).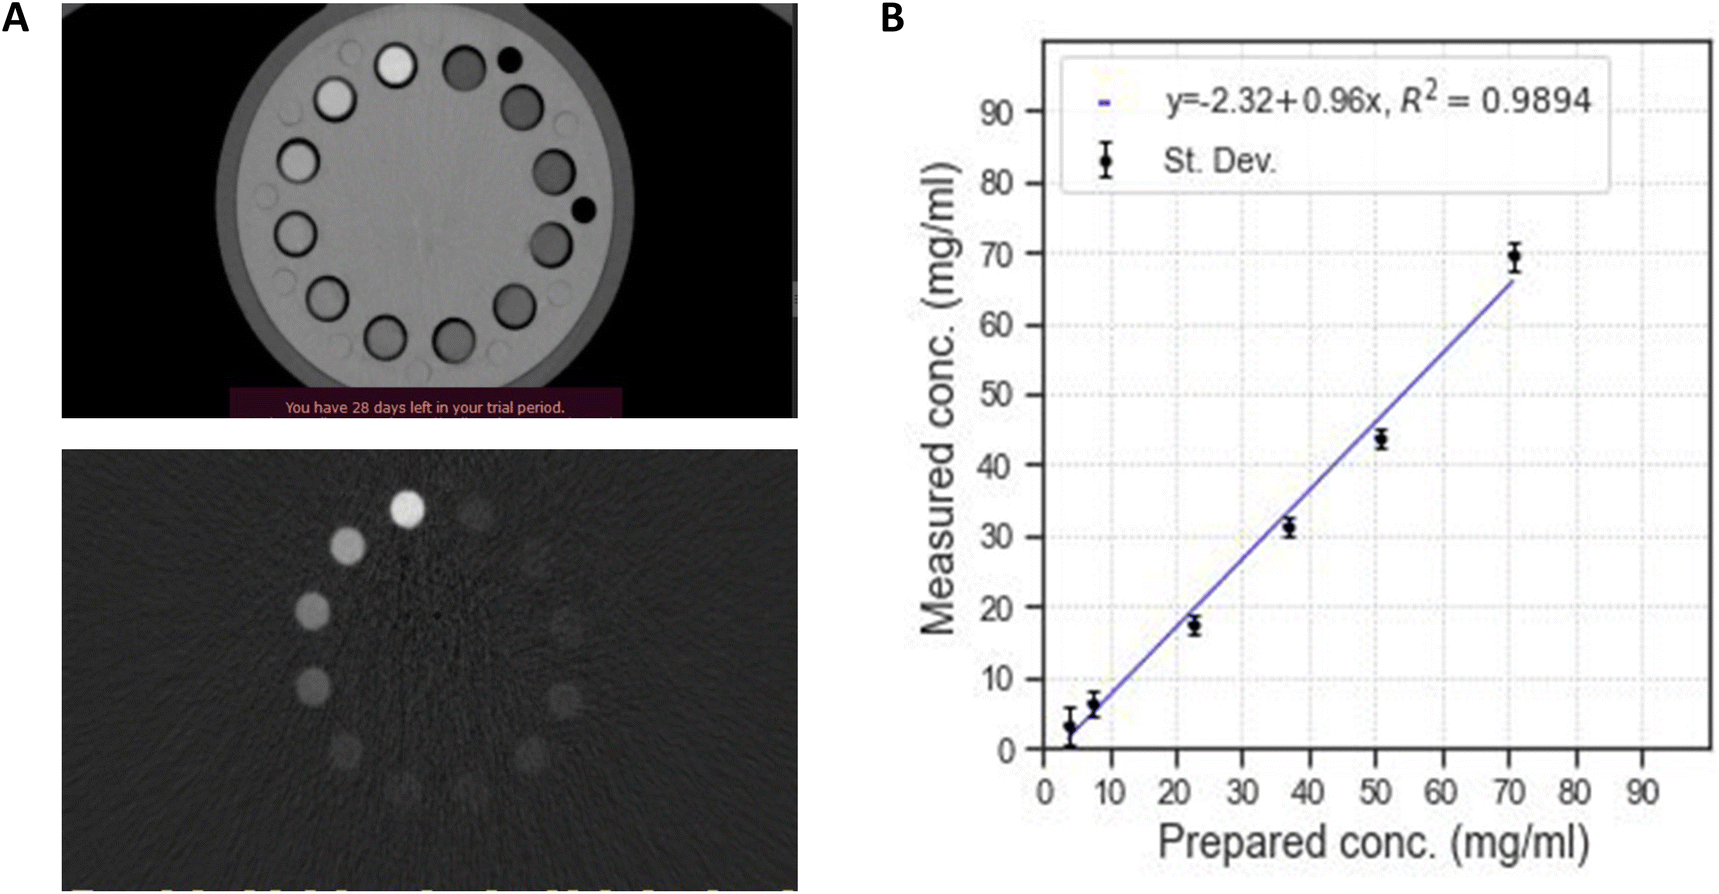 | ||
| Fig. 4 Imaging and quantification studies on six suspensions of Gd0.90Tb0.10F3 with concentrations: 3.82 mg mL−1, 7.50 mg mL−1, 22.6 mg mL−1, 36.8 mg mL−1, 50.9 mg mL−1, and 70.8 mg mL−1. (A) Conventional CT imaging of a phantom containing the suspensions (up). Color K-edge imaging of the same phantom (down). The Gd concentration in the suspensions increases clockwise. (B) Correlation between the gadolinium concentrations measured by ICP and by SPCCT. | ||
With SPCCT, it is possible to conduct conventional CT imaging and gadolinium-specific color K-edge imaging of the suspensions. Both imaging techniques show an increase of the contrast with the concentration of lanthanides. The Gd0.90Tb0.10F3 NCs are well suited for further use with this technology. Finally, the color K-edge imaging technique also allows us to quantify the element inducing the contrast, through a direct correlation between the measured attenuation and the gadolinium concentration. Fig. 4B shows the linear correlation existing between the gadolinium concentration measured by SPCCT and the one measured by ICP. It then becomes possible to accurately dose the quantity of the contrast agent injected in vivo.
Surface functionalization of the Gd0.90Tb0.10F3 NCs
Surface functionalization of NCs was performed mainly following two approaches: (i) direct grafting of a ligand on the surface or (ii) the design of a core–shell system using a layer of silica (Scheme 2).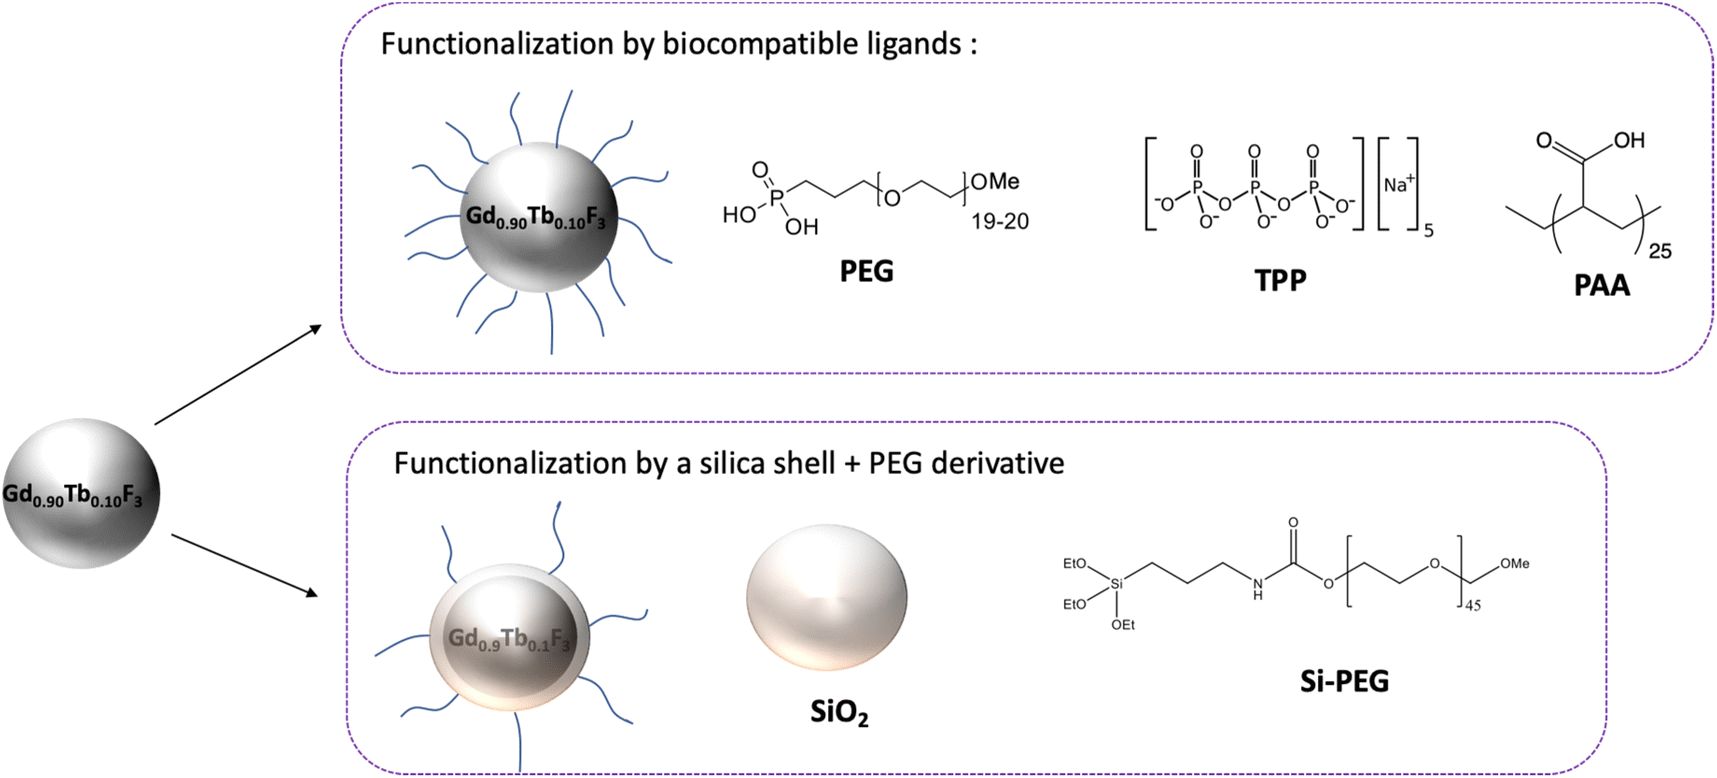 | ||
| Scheme 2 General strategies for the design of surface-modified NCs and corresponding ligands. | ||
The first strategy (ligand-based) is based on the stable anchoring of organic molecules (or macromolecules) through reactive functions (phosphonates, phosphates, and carboxylic acids) on the nanoparticle surface. The nature of the chemical bond formed between the nanoparticle and the molecule is coordinative, ionic or iono-covalent, conferring stability to the final system. Numerous works related to nanoparticle applications for in vivo studies have shown that high biocompatibility is achieved with polyethylene glycol (PEG) ligands. Following this general idea and based on previous work,25 studies have been focused on the use of phosphonic acid derived PEG (PPEG1000), which is known to have strong interactions with the rare earth fluoride nanoparticle surface. The choice of TPP (sodium tripolyphosphate) was motivated by the presence of multiple PO and P–OH functions leading to strong anchoring on the nanoparticle surface and creating highly stable systems. Polyacrylic acid (PAA) is a polymer bearing several carboxylic functional groups along its structure which is expected to increase grafting stability.37,38 As opposed to direct grafting, the core–shell design is indeed a two-step approach where the nanoparticles are first covered by a layer of silica followed by the covalent linking of a Si-PEG functionalized with a silane function (C–Si–O–Si bonding).
Efficient grafting of the various ligands on Gd0.90Tb0.10F3 NCs was evidenced by FTIR (Fig. S8†). For TPP and PEG modifications, the intense signal around 1060 cm−1 is attributed to P–O stretching.39 In the case of PAA modified NPs, the strong peak at 1680 cm−1 is attributed to CO stretching of the carboxylic acid function. Core shell systems SiO2@PEG show the characteristic signal of Si–O–Si stretching overlapped with C–O–C stretching in the 1100 cm−1 region.40,41 For all surface modifications involving organic moieties (SiO2@PEG, PEG, and PAA) the presence of a signal in the 2850–2900 cm−1 area (C–H stretching) is observed.
HRTEM observations of the different surface-modified systems show no modification in terms of morphology or crystallinity of the NC cores (Fig. S9†) with an average gyration diameter of 9.8 ± 0.8 nm. The NCs in suspension at pH = 7 were analyzed by DLS and zeta potential measurements (Table 2).
| Dh (nm) | ZP (mV) | PDI | |
|---|---|---|---|
| Gd0.90Tb0.10F3 | 13 ± 3 | +48 ± 5 | 0.11 |
| Gd0.90Tb0.10F3@TPP | 13 ± 3 | −45 ± 5 | 0.10 |
| Gd0.90Tb0.10F3@PEG | 24 ± 3 | +27 ± 5 | 0.15 |
| Gd0.90Tb0.10F3@PAA | 24 ± 3 | −51 ± 5 | 0.14 |
| Gd0.90Tb0.10F3@SiO2@PEG | 32 ± 3 | −25 ± 5 | 0.15 |
For all the systems considered, a clear increase of the Dh is observed after surface modification which is in agreement with the presence of the ligands on the NC surface. The small Dh (13 nm) observed for Gd0.90Tb0.10F3@TPP is consistent with the grafting of small molecules as opposed to polymers such as PEG, PAA or SiO2-PEG. The low polydispersity indexes indicate that the systems are homogeneous, without the presence of aggregates at a macroscopic scale. For all cases, the high absolute value of ZP (above 25 mV) confirms the high colloidal stability. The negative values measured for TPP, PAA, and SiO2-PEG modifications, respectively, indicate the presence of negatively charged phosphonate, carboxylate and silanolate groups.
Finally, the quantification of the ligands was assessed using Thermogravimetric Analysis (TGA). All samples show mass loss in the 250 °C–400 °C range attributed to decomposition of the organic moieties. As expected, in the case of the inorganic ligand TPP, no loss was observed. The results obtained for the various systems are summarized in Table 3.
| Composition | Total organic mass loss (%) | Calculated numbers of ligands per NCs |
|---|---|---|
| Gd0.90Tb0.10F3 | −6.4 | 2.58 × 10³ |
| Gd0.90Tb0.10F3@TPP | None | None |
| Gd0.90Tb0.10F3@PEG | −40.3 | 2.61 × 10³ |
| Gd0.90Tb0.10F3@PAA | −21.8 | 5.44 × 10³ |
| Gd0.90Tb0.10F3@SiO2@PEG | −12.8 | 2.68 × 10² |
The analysis performed on unmodified NCs shows a mass loss of 6.4%. This result agrees with FTIR analysis (Fig. S8†) and the presence of organic molecules (2-pyrrolidinone) on the surface. In the case of Gd0.90Tb0.10F3@TPP no mass loss except the one corresponding to water was observed which is expected since no organic molecules are attached to the surface of the NCs. For the other systems the calculated number of ligands per nanoparticles is on the same order of magnitude. In the case of Gd0.90Tb0.10F3@SiO2@PEG, the number of organic ligands per nanoparticles is lower. Indeed, the reactivity of the surface of the NPs is driven by the interactions between the alkoxysilane-derived PEG and the active sites (silanols) on the silica layer. Since the number of silanols is limited, the total amount of grafted ligands is lower than that in the case of direct grafting on Gd0.90Tb0.10F3 with other macromolecules.
Effect of the ligands on the optical properties of the NCs
The influence of the various ligands or layers on the emission properties of the NCs has been studied. For a more detailed comparison, the Gd0.9Tb0.1F3 nanoparticles were subjected to a surface cleaning procedure in order to remove the pyrrolidinone molecules from the surface. The efficiency of this cleaning step was controlled with TEM and XRD to make sure no evolution of the size nor the crystallinity of the NCs was observed and with FTIR to verify that no organic moieties remained on the surface of the nanoparticles (Fig. S10†). The luminescence properties were recorded for all samples with the same concentration (0.06 M in lanthanides) in water and in D2O, under UV excitation at 273 nm (Fig. 5). | ||
| Fig. 5 (A) Luminescence spectra of the various surface-modified Gd0.9Tb0.1F3 systems in H2O, with excitation at 273 nm. (B) Luminescence spectra of the various surface-modified Gd0.9Tb0.1F3 systems in D2O, with excitation at 273 nm. (C) Lifetime decay of the colloidal suspension of Gd0.9Tb0.1F3 systems in H2O. (D) Lifetime decay of the colloidal suspension of Gd0.9Tb0.1F3 systems in D2O. | ||
For all cases, the typical luminescence spectra of Tb3+ are observed with 5D4 to 7FJ (J = 6, 5, 4, 3) transitions. The luminescence intensities measured in water show the impact of the surface modification from clean (Gd0.9Tb0.1F3) to functionalized NCs (Gd0.9Tb0.1F3, Gd0.9Tb0.1F3@PEG and Gd0.9Tb0.1F3@SiO2@PEG) with a decrease of the emission properties. This result can be explained by the presence of vibrators (O–H and N–H) in the molecules on the surface, acting as quenchers of the luminescence.42 Interestingly in the case of Gd0.9Tb0.1F3@TPP the measured intensity is the highest. The same experiments were conducted in D2O and the luminescence intensity is higher than that in the case of experiments performed in H2O. This result confirms the luminescence quenching of excited Tb3+ by high-energy O–H vibrational modes.43 The general trend remains the same with higher intensities in the case of unmodified NCs. The lowest variation is observed with Gd0.9Tb0.1F3@TPP, suggesting that the TPP acts as a protective layer from the surroundings of the nanoparticles. Therefore, almost no variations are observed between H2O or D2O environments. In contrast, Gd0.9Tb0.1F3@PAA shows a much higher luminescence intensity in D2O than in water. In that case, the carboxylic functions are deprotonated (confirmed by negative ZP measurements shown in Table 3) meaning that the quenching of luminescence could only come from water entrapped in the grafted polymer layer (H-bonding) near the surface of the NCs. This study was completed by measurements of the luminescence lifetime at 543 nm after excitation at 273 nm in water and in D2O (Table 4).
| Composition | Lifetime (ms) | Lifetime (ms) | Correlation coefficient |
|---|---|---|---|
| Gd0.90Tb0.10F3 | 4.84 ± 0.03 | 5.56 ± 0.03 | 0.997 |
| Gd0.90Tb0.10F3 cleaned | 5.16 ± 0.03 | 5.82 ± 0.03 | 0.997 |
| Gd0.90Tb0.10F3@TPP | 5.05 ± 0.04 | 5.10 ± 0.04 | 0.997 |
| Gd0.90Tb0.10F3@PEG | 4.81 ± 0.03 | 5.47 ± 0.03 | 0.997 |
| Gd0.90Tb0.10F3@PAA | 3.65 ± 0.03 | 4.50 ± 0.03 | 0.997 |
| Gd0.90Tb0.10F3@SiO2@PEG | 4.59 ± 0.03 | 5.11 ± 0.03 | 0.997 |
Whatever the solvent, the fluorescence lifetime measured is higher for cleaned Gd0.9Tb0.1F3, confirming the effect of water and also the impact of the O–H and N–H oscillators from the ligands. In the cases of Gd0.9Tb0.1F3@PEG, Gd0.9Tb0.1F3@SiO2@PEG and Gd0.9Tb0.1F3, lifetimes are in the same range with an increase by roughly 0.6 ms for all the systems when shifting from water to D2O. Whatever the solvent, the lowest fluorescence lifetime is measured with Gd0.9Tb0.1F3@PAA but with the highest variation from water to D2O (0.85 ms). This confirms the previous measurements with the presence of water entrapped in the polymer layer. All the obtained results show that quenching of the luminescence has two origins: on one side, the presence of the ligands or layers on the surface of the NCs with O–H or N–H vibrators, and on the other side, the presence of water more or less attracted/adsorbed at the surface of the NCs.
Finally, the low variation measured for Gd0.9Tb0.1F3@TPP (0.05 ms) agrees with the observations of luminescence spectra and the protective activity of the inorganic TPP layer at the surface of the NPs. Unfortunately, despite many efforts, the stability of Gd0.9Tb0.1F3@TPP decreased strongly when trying to increase the concentration in water or physiological serum. Being unable to reach values above 0.1 M the composition was not evaluated further with X-ray activation.
Effect of ligands on the X-ray activated luminescence properties of the functionalized NCs
In the previous part the results showed that the various ligands grafted on the surface of the Gd0.9Tb0.1F3 NCs played an essential role in the final optical properties of the systems when excited by UV light. The same approach was considered with the two different types of X-ray activations, microCT and SPCCT, on colloidal suspensions in water (0.5 M) (Fig. 6).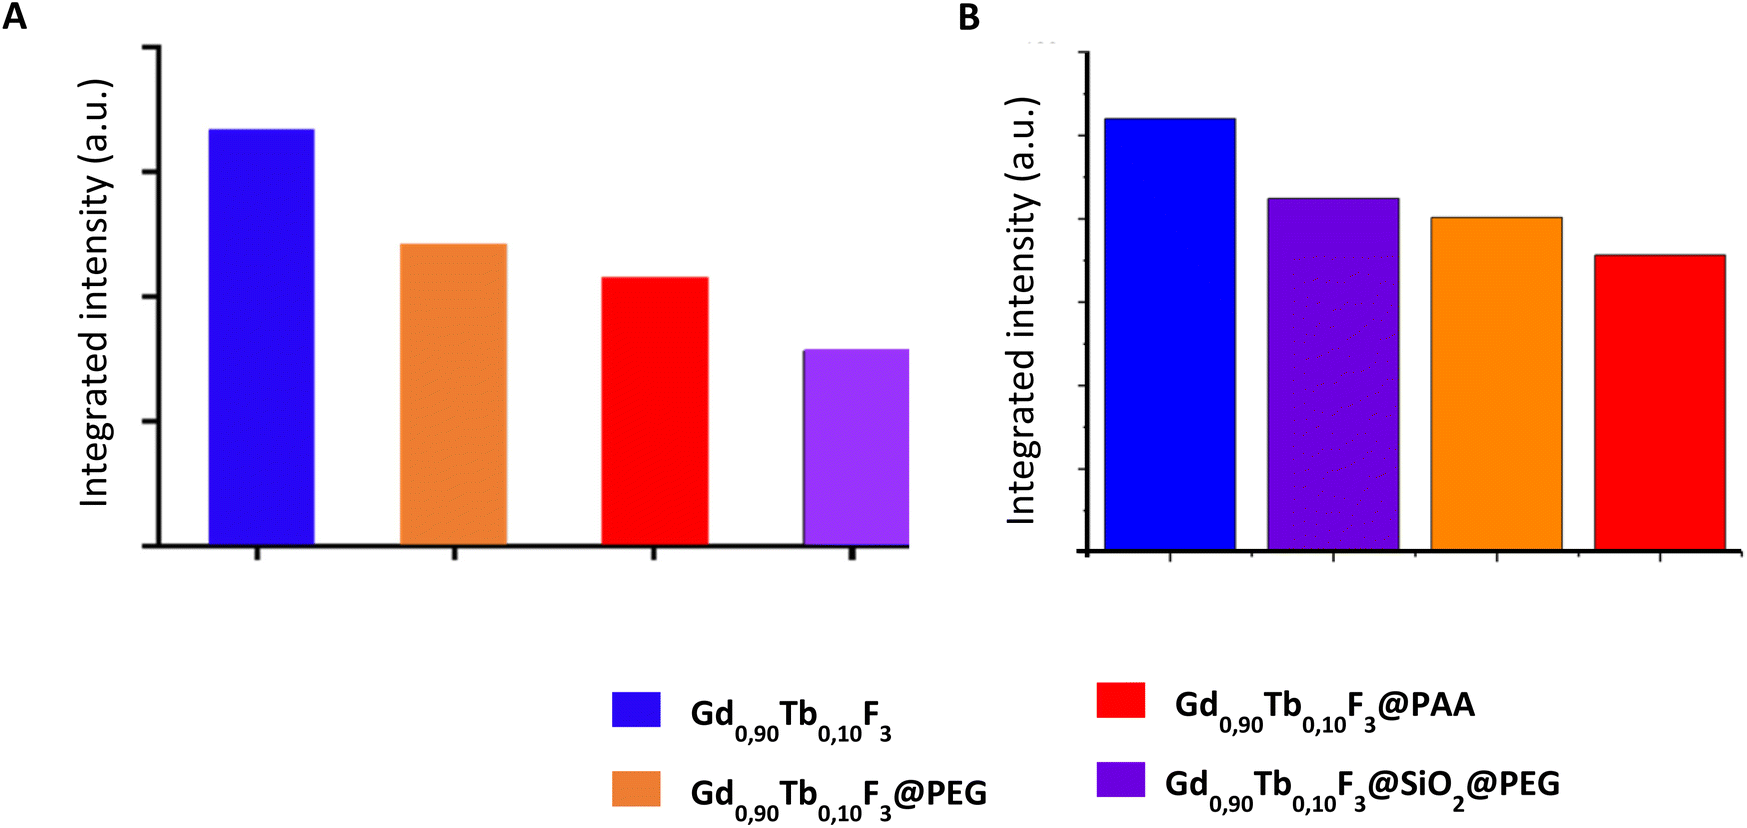 | ||
| Fig. 6 (A) Integrated luminescence intensities of various systems studied under X-ray excitation with microCT (2.5 mAs, 120 kV). (B) Integrated luminescence intensities of the same systems under X-ray excitation of SPCCT (300 mAs, 120 kV). | ||
Fig. 6 shows that the luminescence intensity of the nanoparticles is lower with the presence of the ligands on their surface independent of the X-ray excitation values considered (2.5 mAs and 300 mAs) and as observed in the case of photoexcitation.
In the case of experiments conducted in micro-CT, the integrated intensity of the functionalized NCs follows the same trend as observed with UV excitation i.e. the intensity decreases as follows: Gd0.90Tb0.10F3@PEG > Gd0.90Tb0.10F3@PAA > Gd0.90Tb0.10F3@SiO2@PEG. This last system seems to show properties well below the other two. Interestingly slight differences are observed when measurements are conducted with SPCCT, and in that case the integrated intensities follow the order: Gd0.90Tb0.10F3@SiO2@PEG > Gd0.90Tb0.10F3@PEG > Gd0.90Tb0.10F3@PAA with low differences. These discrepancies observed between microCT and SPCCT can be explained by the type of setup used for the measurements. Indeed, microCT experiments are very sensitive to the scattering of the nanoparticles and since Gd0.90Tb0.10F3@SiO2@PEG has the highest Dh (Table 3) with a surrounding silica shell, it has the strongest scattering. Therefore, the overall measured luminescence intensity is impaired by this phenomenon. In the case of SPCCT experiments, the optical fiber is directly immersed within the colloidal suspensions; therefore the scattering effect is limited and the signals are less perturbed during detection. Thus, the two PEGylated systems Gd0.90Tb0.10F3@PEG and Gd0.90Tb0.10F3@SiO2@PEG seem to be the most promising for X-ray triggered luminescence with SPCCT.
Functionalized NCs as contrast agents with the CT scanner and SPCCT
To prove that functionalized NCs can be used as a contrast agent for scanner imaging, a conventional CT scanner and color K-edge imaging have been used with SPCCT. A phantom containing suspensions of functionalized NCs in an Eppendorf tube (0.5 M in water) was irradiated under 100 mAs, 120 keV using X-rays of SPCCT (Fig. 7).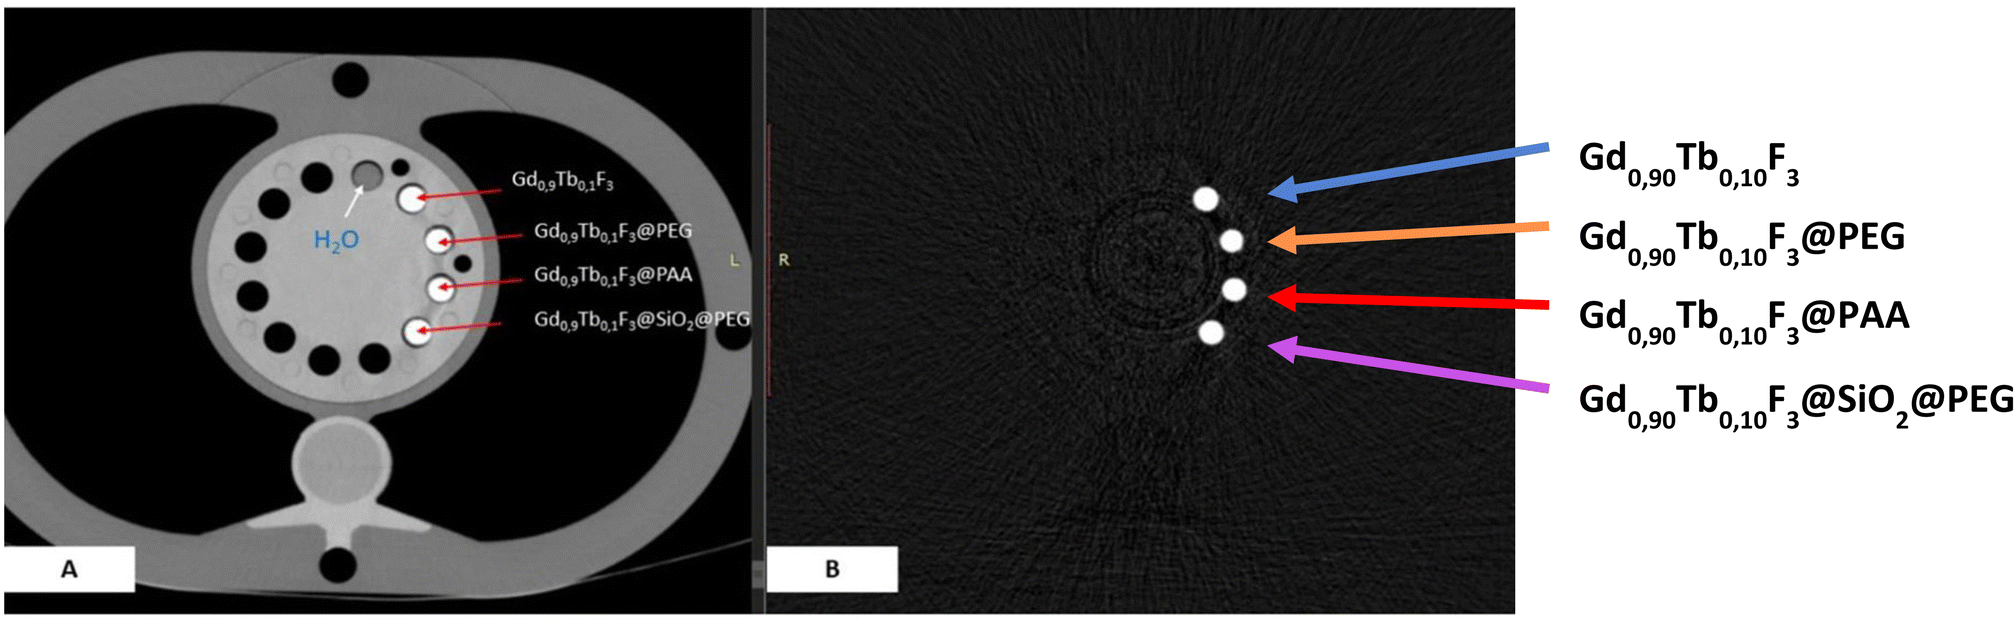 | ||
| Fig. 7 (A) Conventional SPCCT imaging of a phantom containing colloidal suspensions of normal, PEG modified, PAA modified and SiO2@PEG modified NCs in water (0.5 M). (B) Same phantom with color gadolinium K-edge imaging using SPCCT. | ||
Comparison with a water sample confirms that functionalized NCs exhibit properties generating high contrast in conventional SPCCT imaging. Color K-edge observations only show the signal of gadolinium and confirm that these samples are suitable for this technique of imaging (high contrast). The contrast being the same for all samples with K-edge imaging, we can also confirm that the concentration in gadolinium in the different suspensions is the same. Finally, whatever the ligand or coating, the contrast was the same proving that the surface modification did not impair the NCs.
Cytotoxicity of the NCs
Prior to in vivo studies, clonogenic cell survival assay was performed to assess the cytotoxicity of Gd0.90Tb0.10F3@SiO2@PEG and Gd0.90Tb0.10F3@PEG in three independent experiments (Fig. S11†). The results indicated that the investigated NCs did not induce a significant decrease in clonogenic cell survival up to 1 mM.Proof of concept of in vivo dual imaging with SPCCT
To assess the ability of the NCs to be used as X-ray based multimodal contrast agents in vivo, a study was carried out on a nude and healthy mouse with an acquisition sequence in the SPCCT. A suspension of Gd0.90Tb0.10F3@PEG (50 μL, 1 M in physiological serum) was injected subcutaneously near the caudal thigh muscles of the anesthetized animal. Conventional CT and color gadolinium specific K-edge as well as luminescence imaging were then achieved with the SPCCT (Fig. 8).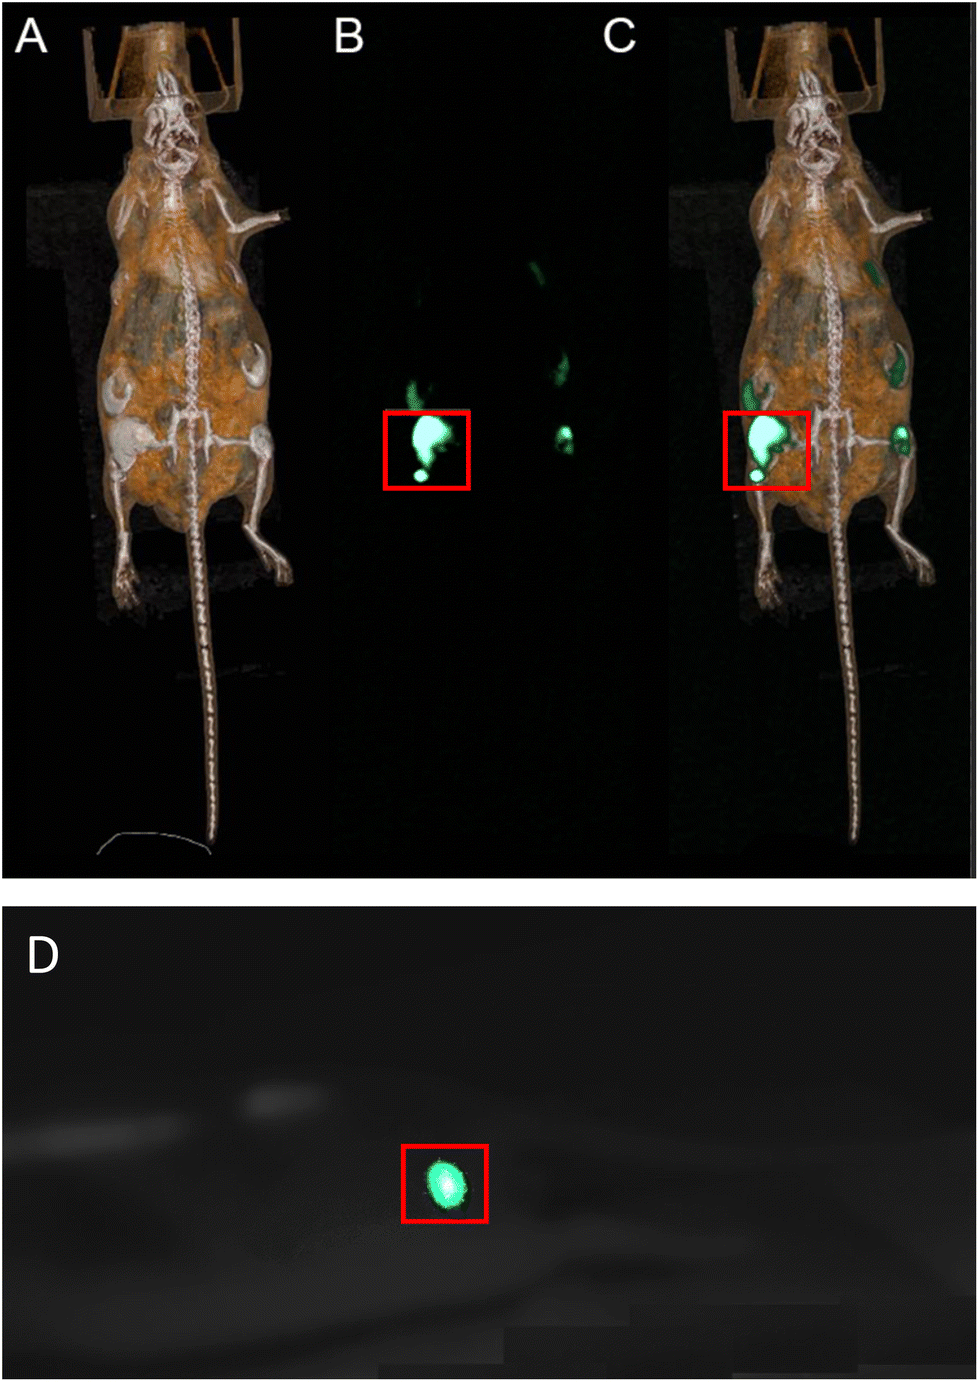 | ||
| Fig. 8 Multimodal in vivo SPCCT imaging of the mouse 20 min after injection of Gd0.90Tb0.10F3 at different sub-cutaneous sites at different volumes and concentrations. The area of interest (injection of the 1 M suspension) is delimited by the red box. (A) Conventional CT imaging of the whole animal. (B) Color gadolinium specific K-edge imaging. (C) Fusion of conventional and color K-edge imaging. (D) Luminescence imaging during acquisition with SPCCT. | ||
While conventional CT imaging provides a nonspecific imaging of the contrast agent (Fig. 8A), color K-edge imaging enables a specific and quantitative imaging of its biodistribution (Fig. 8B). Fusion of conventional and color K-edge imaging enables a comprehensive imaging of the contrast agent biodistribution (Fig. 8C). Monitoring was carried out over a period of 1 hour in order to follow the distribution of the nanoparticles. The systems remain localized and no diffusion in the surrounding tissues was observed. Finally, 24 hours after injection, the mouse showed no sign of infection. The detection of the luminescence of NCs in vivo was conducted during a new acquisition sequence of the SPCCT, on the same animal, using the previously used parameters (120 KeV – 300 mAs). Observations were made with a camera during the X-ray irradiation (Fig. 8D). A clear and intense green luminescence at the injection site of the 1 M suspension is observed. The signal is strong enough to be detected through the skin of the animal with the naked eye. The impact of the X-ray dose delivered for optimized imaging and the influence of the concentration of the particles are currently being studied and will be the subject of an upcoming paper.
Conclusions
In summary, we have successfully developed highly efficient X-ray activated nanoprobes for multimodal imaging. The nanocrystals consist of a GdF3 matrix doped with various ratios of Tb3+. After finding the optimal composition of the original NCs with a systematic luminescence study, we were able to effectively evaluate the contrast capability in CT and SPCCT with gadolinium specific color K-edge imaging. The influence of surface modification on the luminescence properties was evaluated. Various strategies were considered using encapsulation with a silica layer and direct grafting of molecules such as PEG, PAA or TPP derivatives. As the contrast with conventional CT and color K-edge imaging using SPCCT did not change, the luminescence intensity of these NCs in water was reduced compared to that of the original NCs. This was attributed to the quenching caused by surface ligands and water molecules. Our results suggest that the surface modified NCs are promising contrast agents for multimodal medical imaging with X-ray optical imaging, as well as for CT and SPCCT. The proof of concept performed on a nude mouse with SPCCT confirmed that the luminescence could be observed though the skin of the animal, together with strong contrast in CT and SPCCT.Author contributions
LC: investigation, visualization, and writing original draft; PA: investigation; AG: investigation and writing original draft; AH: investigation and validation; FC: investigation and methodology; AY: investigation; LD: conceptualization; PL: conceptualization; SK: investigation and writing original draft; SP: conceptualization; BR: investigation; JBL: investigation; SAS-M: conceptualization and writing original draft; BM: conceptualization and writing original draft; PD: conceptualization; FL: conceptualization, supervision, writing original draft, and writing – review and editing.Conflicts of interest
There are no conflicts to declare.Acknowledgements
This work was done in the frame of the SCANnTREAT project, and this project has received funding from the European Union's Horizon 2020 research and innovation program under grant agreement no. 899549. Luminescence studies with SPCCT were funded by a public grant from the French National Research Agency (ANR) under the “France 2030” investment plan, which has the reference EUR MANUTECH SLEIGHT – ANR-17-EURE-0026. This work was funded by LABEX PRIMES (ANR-11-LABX-0063) of Université de Lyon, within the program “Investissements d'Avenir” (ANR-11-IDEX-0007), operated by the French National Research Agency (ANR). The experiments were based on the work done on the ISO 9001:2015 PILoT facility. The authors thank Dr O. Maury from Chemistry Laboratory for fruitful discussions and help with luminescence measurements, Y. Yagil from Philips company for his strong input on SPCCT technology improvement and R. Biemans from Maastricht university for her work on clonogenic assays.References
- D. Bobo, K. J. Robinson, J. Islam, K. J. Turecht and S. R. Corrie, Pharm. Res., 2016, 33, 2373–2387 CrossRef CAS PubMed.
- S. D. Rawson, J. Maksimcuka, P. J. Withers and S. H. Cartmell, BMC Biol., 2020, 18, 21 CrossRef PubMed.
- J. F. Hainfeld, D. N. Slatkin, T. M. Focella and H. M. Smilowitz, Br. J. Radiol., 2006, 79, 248–253 CrossRef CAS PubMed.
- S. Si-Mohamed, D. Bar-Ness, M. Sigovan, D. P. Cormode, P. Coulon, E. Coche, A. Vlassenbroek, G. Normand, L. Boussel and P. Douek, Nucl. Instrum. Methods Phys. Res., Sect. A, 2017, 873, 27–35 CrossRef CAS.
- S. Si-Mohamed, D. P. Cormode, D. Bar-Ness, M. Sigovan, P. C. Naha, J.-B. Langlois, L. Chalabreysse, P. Coulon, I. Blevis, E. Roessl, K. Erhard, L. Boussel and P. Douek, Nanoscale, 2017, 9, 18246–18257 RSC.
- S. A. Si-Mohamed, M. Sigovan, J. C. Hsu, V. Tatard-Leitman, L. Chalabreysse, P. C. Naha, T. Garrivier, R. Dessouky, M. Carnaru, L. Boussel, D. P. Cormode and P. C. Douek, Radiology, 2021, 300, 98–107 CrossRef PubMed.
- A. de Vries, E. Roessl, E. Kneepkens, A. Thran, B. Brendel, G. Martens, R. Proska, K. Nicolay and H. Grüll, Invest. Radiol., 2015, 50, 297–304 CrossRef PubMed.
- J. Greffier, N. Villani, D. Defez, D. Dabli and S. Si-Mohamed, Diagn. Intervention Imaging, 2023, 104, 167–177 CrossRef PubMed; A. Pourmorteza, R. Symons, V. Sandfort, M. Mallek, M. K. Fuld, G. Henderson, E. C. Jones, A. A. Malayeri, L. R. Folio and D. A. Bluemke, Radiology, 2016, 279, 239–245 CrossRef PubMed; I. Blevis, in Radiation Detectors for Medical Imaging, ed. J. S. Iwanczyk, CRC Press, Boca Raton, 1st edn, 2015, ch. 3, pp. 169–192 RSC; S. Si-Mohamed, D. P. Cormode, D. Bar-Ness, M. Sigovan, P. C. Naha, J. B. Langlois, L. Chalabreysse, P. Coulon, I. Blevis, E. Roessl, K. Erhard, L. Boussel and P. Douek, Nanoscale, 2017, 46, 18246–18257 RSC.
- L. Sudheendra, G. K. Das, C. Li, D. Stark, J. Cena, S. Cherry and I. M. Kennedy, Chem. Mater., 2014, 26, 1881–1888 CrossRef CAS PubMed.
- L. Song, X. H. Lin, X. R. Song, S. Chen, X. F. Chen, J. Li and H. H. Yang, Nanoscale, 2017, 9, 2718–2722 RSC.
- H. Chen, D. C. Colvin, B. Qi, T. Moore, J. He, O. T. Mefford, F. Alexis, J. C. Gore and J. N. Anker, J. Mater. Chem., 2012, 22, 12802–12809 RSC.
- J. C. Hsu, L. M. Nieves, O. Betzer, T. Sadan, P. B. Noël, R. Popovtzer and D. P. Cormode, Wiley Interdiscip. Rev.: Nanomed. Nanobiotechnol., 2020, 12, e1642 Search PubMed.
- Z. Hong, Z. Chen, Q. Chen and H. Yang, Acc. Chem. Res., 2023, 56, 37–51 CrossRef CAS PubMed.
- D. P. Cormode, S. Si-Mohamed, D. Bar-Ness, M. Sigovan, P. C. Naha, J. Balegamire, F. Lavenne, P. Coulon, E. Roessl, M. Bartels, M. Rokni, I. Blevis, L. Boussel and P. Douek, Sci. Rep., 2017, 1, 4784 CrossRef PubMed.
- L. Song, X. H. Lin, X. R. Song, S. Chen, X. F. Chen, J. Li and H. H. Yang, Nanoscale, 2017, 9, 2718–2722 RSC.
- X. Li, Z. Xue, M. Jiang, Y. Li, S. Zeng and H. Liu, Nanoscale, 2018, 10, 342–350 RSC.
- T. Guo, Y. Lin, W. J. Zhang, J. S. Hong, R. H. Lin, X. P. Wu, J. Li, C. H. Lu and H. H. Yang, Nanoscale, 2018, 10, 1607–1612 RSC.
- Q. Ju, S. Luo, C. Chen, Z. Fang, S. Gao, G. Chen, X. Chen and N. Gu, Adv. Healthcare Mater., 2019, 8, 1801324 CrossRef PubMed.
- Z. Z. Chen, L. C. Wang, D. Manoharan, C. L. Lee, L. C. Wu, W. T. Huang, E. Y. Huang, C. H. Su, H. S. Sheu and C. S. Yeh, Adv. Mater., 2019, 31, 1905087 CrossRef CAS PubMed.
- H. Lusic and M. W. Grinstaff, Chem. Rev., 2013, 113, 1641–1666 CrossRef CAS PubMed.
- E. Hemmer, N. Venkatachalam, H. Hyodo, A. Hattori, Y. Ebina, H. Kishimotoac and K. Soga, Nanoscale, 2013, 5, 11339–11361 RSC.
- S. Lahtinen, A. Lyytikäinen, H. Päkkilä, E. Hömppi, N. Perälä, M. Lastusaari and T. Soukka, J. Phys. Chem. C, 2016, 121, 656–665 CrossRef.
- D. Lisjak, O. Plohl, M. Ponikvar-Svet and B. Majaron, RSC Adv., 2015, 5, 27393–27397 RSC.
- D. Lisjak, O. Plohl, J. Vidmar, B. Majaron and M. Ponikvar-Svet, Langmuir, 2016, 32, 8222–8229 CrossRef CAS PubMed.
- N. Halttunen, F. Lerouge, F. Chaput, M. Vandamme, S. Karpati, S. Si-Mohamed, M. Sigovan, L. Boussel, E. Chereul, P. Douek and S. Parola, Sci. Rep., 2019, 9, 12090 CrossRef PubMed.
- S. Si-Mohamed, A. Thivolet, P.-E. Bonnot, D. Bar-Ness, V. Képénékian, D. P. Cormode, P. Douek and P. Rousset, Invest. Radiol., 2018, 53, 629–639 CrossRef PubMed.
- S. Si-Mohamed, D. Bar-Ness, M. Sigovan, V. Tatard-Leitman, D. P. Cormode, P. C. Naha, P. Coulon, L. Rascle, E. Roessl, M. Rokni, A. Altman, Y. Yagil, L. Boussel and P. Douek, Eur. Radiol. Exp., 2018, 2, 34 CrossRef PubMed.
- H. K. Kim, G. H. Lee and Y. Chang, Future Med. Chem., 2018, 10, 639–661 CrossRef CAS PubMed.
- M. P. Menon and J. James, J. Chem. Soc., Faraday Trans. 1, 1989, 85, 2683 RSC.
- J. C. G. Bünzli and C. Piguet, Chem. Soc. Rev., 2005, 34, 1048–1077 RSC.
- H. Liu, C. T. Xu, D. Lindgren, H. Xie, D. Thomas, C. Gundlach and S. Andersson-Engels, Nanoscale, 2013, 5, 4770–4775 RSC.
- F. Mpambani, A. K. O. Åslund, F. Lerouge, S. Nyström, N. Reitan, E. M. Huuse, M. Widerøe, F. Chaput, C. Monnereau, C. Andraud, M. Lecouvey, S. Handrick, S. Prokop, F. L. Heppner, P. Nilsson, P. Hammarström, M. Lindgren and S. Parola, ACS Appl. Bio Mater., 2018, 1, 462–472 CrossRef CAS PubMed.
- S. Karpati, V. Hubert, I. Hristovska, F. Lerouge, F. Chaput, Y. Bretonnière, C. Andraud, A. Banyasz, G. Micouin, M. Monteil, M. Lecouvey, M. Mercey-Ressejac, A. K. Dey, P. N. Marche, M. Lindgren, O. Pascual, M. Wiar and S. Parola, Nanoscale, 2021, 13, 3767–3781 RSC.
- H. H. Caspers, S. A. Miller, H. E. Rast and J. L. Fry, Phys. Rev., 1969, 180, 329–333 CrossRef CAS.
- J. C. G. Bünzli and S. V. Eliseeva, in Lanthanide Luminescence, ed. P. Hänninen and H. Härmä, Springer, Heidelberg, 2010, ch. 7, pp. 1–45 Search PubMed.
- M. A. Omary and H. H. Patterson, in Encyclopedia of Spectroscopy and Spectrometry, ed. J. C. Lindon, G. E. Tranter and D. W. Koppenaal, Academic Press, 3rd edn, 2017, pp. 636–653 Search PubMed.
- N. Liu, N. Gobeil, P. Evers, I. Gessner, E. M. Rodrigues and E. Hemmer, Dalton Trans., 2020, 49, 16204–16216 RSC.
- S. Wilhelm, M. Kaiser, C. Wurth, J. Heiland, C. Carrillo-Carrion, V. Muhr, O. S. Wolfbeis, W. J. Parak, U. Resch-Genger and T. Hirsch, Nanoscale, 2015, 7, 1403–1410 RSC.
- L. Daasch and D. Smith, Anal. Chem., 1951, 23, 853–868 CrossRef CAS.
- A. Agarwal and M. Tomozawa, J. Non-Cryst. Solids, 1997, 209, 166–174 CrossRef CAS.
- N. S. Vrandečić, M. Erceg, M. Jakić and I. Klarić, Thermochim. Acta, 2010, 498, 71–80 CrossRef.
- A. Beeby, I. M. Clarkson, R. S. Dickins, S. Faulkner, D. Parker, L. Royle, A. S. de Sousa, J. A. G. Williams and M. Woods, J. Chem. Soc., Perkin Trans. 2, 1999, 493–504 RSC.
- J.-C. Boyer, F. Vetrone, L. A. Cuccia and J. A. Capobianco, J. Am. Chem. Soc., 2006, 128, 7444–7445 CrossRef CAS PubMed.
Footnote |
| † Electronic supplementary information (ESI) available. See DOI: https://doi.org/10.1039/d3nr03710j |
| This journal is © The Royal Society of Chemistry 2024 |