
 Open Access Article
 This Open Access Article is licensed under a Creative Commons Attribution-Non Commercial 3.0 Unported Licence
On the interactions between RNA and titrateable lipid layers: implications for RNA delivery with lipid nanoparticles†
Jennifer
Gilbert
 *ab,
Inna
Ermilova
c,
Marco
Fornasier
a,
Maximilian
Skoda
d,
Giovanna
Fragneto
ef,
Jan
Swenson
c and
Tommy
Nylander
abgh
*ab,
Inna
Ermilova
c,
Marco
Fornasier
a,
Maximilian
Skoda
d,
Giovanna
Fragneto
ef,
Jan
Swenson
c and
Tommy
Nylander
abgh
aDivision of Physical Chemistry, Department of Chemistry, Naturvetarvägen 14, Lund University, 22362 Lund, Sweden. E-mail: jennifer.gilbert@fkem1.lu.se; tommy.nylander@fkem.lu.se
bNanoLund, Lund University, Professorsgatan 1, 223 63 Lund, Sweden
cDepartment of Physics, Chalmers University of Technology, 412 96 Gothenburg, Sweden
dISIS Neutron and Muon Source, Rutherford Appleton Laboratory, Harwell, Oxford OX11 0QX, UK
eInstitut Laue-Langevin, 71 avenue des Martyrs, CS 20156, 38042 Grenoble, France
fEuropean Spallation Source ERIC, P.O. Box 176, SE-221 00 Lund, Sweden
gLund Institute of Advanced Neutron and X-Ray Science, Scheelevägen 19, 223 70 Lund, Sweden
hSchool of Chemical Engineering and Translational Nanobioscience Research Center, Sungkyunkwan University, Suwon, Republic of Korea
First published on 7th December 2023
Abstract
Characterising the interaction between cationic ionisable lipids (CIL) and nucleic acids (NAs) is key to understanding the process of RNA lipid nanoparticle (LNP) formation and release of NAs from LNPs. Here, we have used different surface techniques to reveal the effect of pH and NA type on the interaction with a model system of DOPC and the CIL DLin-MC3-DMA (MC3). At only 5% MC3, differences in the structure and dynamics of the lipid layer were observed. Both pH and %MC3 were shown to affect the absorption behaviour of erythropoietin mRNA, polyadenylic acid (polyA) and polyuridylic acid (polyU). The adsorbed amount of all studied NAs was found to increase with decreasing pH and increasing %MC3 but with different effects on the lipid layer, which could be linked to the NA secondary structure. For polyA at pH 6, adsorption to the surface of the layer was observed, whereas for other conditions and NAs, penetration of the NA into the layer resulted in the formation of a multilayer structure. By comparison to simulations excluding the secondary structure, differences in adsorption behaviours between polyA and polyU could be observed, indicating that the NA's secondary structure also affected the MC3-NA interactions.
1. Introduction
The importance of successful RNA delivery in recent years cannot be overstated. Lipid nanoparticle (LNP) based mRNA delivery was used in two approved vaccines against SARS-CoV-2 (mRNA-12731 and BNT162b2), which have been some of the most effective tools in the SARS-CoV-2 pandemic, in part due to rapid and cost effective production methods.3 Although there is a long history of work in this area, these recent successes and proof of efficacy have led to growing interest in RNA LNPs. This has resulted in the development of a range of RNA LNP based products,4 many of which have reached clinical trials.5 As these LNPs can be considered a ‘platform’ that can be loaded with different cargos, they have found a wide range of target illnesses, including previously thought ‘undruggable’ illnesses and cancer.5,6 There is now a focus on the rational design of LNPs in order to maximise their desirable properties, including limiting the immune response, optimising nucleic acid (NA) encapsulation efficiency during formulation, protecting the NA cargo from degradation and aiding endosomal escape.3,4Since their introduction by Semple et al.,7 cationic ionisable lipids (CILs) have been shown to massively increase LNP delivery efficacy.3–5 The commonly used CILs are positively charged at low pH (aiding efficient encapsulation of NA cargo during LNP formulation) and near neutral at physiological pH (reducing the toxicity associated with permanently charged cationic lipids).4,8 Since then, there has been further optimisation of the CIL structure with regards to pKa of the charged group and number of double bonds in the chain, among other characteristics.9,10 One of the most potent CILs developed was DLin-MC3-DMA (MC3), which has a pKa of 6.44,10 which makes it optimal for such applications in vivo. Currently the composition of the most widely used LNP formulations includes a CIL, a neutral helper lipid (usually a phosphatidylcholine), cholesterol and a PEG lipid.3 There is a rapidly growing body of literature investigating the application of these LNPs with different formulations, especially with the design of new CILs and RNA cargos, and their efficacy in vitro (mostly focussing on hepatocytes) and in vivo (almost exclusively in mouse models)(ref. 4–5 and references within, ref. 11–18). Although there has been work on the physicochemical characterisation of LNP structural features,19–27 it is much less common and detailed characterisation is rare. It has, however, been generally concluded that the LNP structure, composition, size and surface characteristics greatly affect LNP function. Specifically, the structure of the LNP core and the CIL interaction with the NA cargo (complexation vs. encapsulation) are key.4 It is, therefore, vital to understand the interaction of the NA cargo with the delivery vehicle at different pHs in order to optimise encapsulation and release in different environments.28
However, detailed characterisation requires relatively large amounts of material, which is often not possible or prohibitively expensive when working with mRNA.28,29 ‘Model mRNAs’, such as polyadenylic acid (polyA) and polyuridylic acid (polyU), synthetic homopolymers of the RNA nucleotides adenosine and uracil respectively, are an attractive alternative, as they are cheaper and more readily available. These are often used to initially characterise the binding properties of RNA to RNA binding proteins30–32 and have been used in previous studies of the LNP structure.19,22
Due to the complex and multicomponent nature of the popular LNP formulations, it is challenging to isolate the contribution of the CIL, therefore it is necessary to work with in a simplified system. In this study, we have investigated a model system of a supported lipid layer composed of varying ratios of the CIL MC3 and DOPC, as PCs are the most commonly used helper lipids in LNP formulations3–5,8,28,33 and here DOPC facilitates deposition of a planar layer. The lipid layer structure, dynamics and interactions with different RNAs (human erythropoietin (EPO) mRNA, polyA and polyU) have been characterised in a cell relevant pH range using various surface characterisation methods and compared to molecular dynamics simulations.
2. Materials and Methods
2.1. Materials
1,2-Dioleoyl-sn-glycero-3-phosphocholine (DOPC, powder) was purchased from Avanti Polar Lipids (Birmingham, AL, USA) and (6Z,9Z,28Z,31Z)-heptatriacont-6,9,28,31-tetraene-19-yl 4-(dimethylamino)butanoate (DLin-MC3-DMA or MC3, liquid oil) was purchased from Biorbyt (Cambridge, UK). The fluorescently labelled lipid 1,2-distearyl-sn-glycero-3-phosphoethanolamine-N-(TopFluor AF488) ammonium salt was purchased from Sigma (Avanti Polar Lipids). Chloroform, buffer salts (NaCl, KH2PO4, Na2HPO4, NaH2PO4·H2O) and D2O were purchased from Sigma Aldrich. MilliQ purified water (18 MΩ cm) was used for all experiments.Polyadenylic acid (polyA) and polyuridylic acid (polyU) were purchased from Sigma Aldrich. CleanCap™ Erythropoietin mRNA (EPO mRNA, 1.0 mg mL−1 in 1 mM sodium citrate at pH 6.4) was purchased from TriLink Biotechnologies (San Diego, CA, USA).
50 mM sodium phosphate buffers (pH 6 and pH 7) were prepared in D2O, H2O and a mix of 38![[thin space (1/6-em)]](https://www.rsc.org/images/entities/char_2009.gif) :62 D2O:H2O (CMSi, contrast matched to Si) by mixing the corresponding 50 mM Na2HPO4 and 50 mM NaH2PO4·H2O solutions while monitoring the pH to the target pH (6, 6.5, 7, 8).
:62 D2O:H2O (CMSi, contrast matched to Si) by mixing the corresponding 50 mM Na2HPO4 and 50 mM NaH2PO4·H2O solutions while monitoring the pH to the target pH (6, 6.5, 7, 8).
2.2. Sample preparation
Lipid vesicles were prepared using a modified version of the protocol used by Dabkowska et al.34 In summary, stock solutions of each lipid in chloroform were prepared and mixed to the required MC3/DOPC molar ratio (0/100, 5/95, 10/90, 15/85), which were briefly vortexed. The chloroform was then evaporated under a gentle N2 flow followed by desiccation under vacuum for 14 h to remove any remaining chloroform.For quartz crystal microbalance with dissipation monitoring (QCM-D) measurements, the lipid film was then hydrated in phosphate buffered saline (1× PBS, pH 7.20 ± 0.05, 155 mM NaCl, 2.97 mM Na2HPO4, 1.06 mM KH2PO4) to a final concentration of 0.5 mg mL−1, vortexed until all of the lipid film was removed from the surface of the vial and left for 15 min to hydrate. The resulting dispersion was sonicated in an ice water bath using a tip sonicator (Vibra-Cell VCX 130, Sonics & Materials Inc., Newton, CT, USA) with the following settings: 15 min sonication time, 10 s on, 10 s off, 50% amplitude. After sonication, the samples were diluted to 0.15 mg mL−1 in 1× PBS.
For neutron reflectometry experiments, the lipid films were prepared 1 week in advance, shipped in dry ice and stored in a −20 °C freezer prior to the experiment. The general sample preparation was as above, except the lipid films were hydrated to 2 mg mL−1 before sonication using a Fisherbrand Model 50 Sonic Dismembrator (Fisherscientific, Waltham, MA, USA) at POLREF/Vibra-Cell VCX 130 (Sonics & Materials Inc., Newton, CT, USA) at D17 and diluted to 0.5 mg mL−1 in 1× PBS before injection.
For total internal reflection fluorescence (TIRF) microscopy, vesicles composed of pure DOPC, and with the MC3/DOPC molar ratios 5/95, 10/90, and 15/85 with the addition of 0.1 wt% of the labelled lipid AF488-DSPE (1,2-distearyl-sn-glycero-3-phosphoethanolamine-N-(TopFluor AF488) ammonium salt, Avanti Polar Lipids, purity > 99%) were prepared by dissolving the required amount of lipids in 200 μL of chloroform to reach a total lipid concentration of 0.5 mg mL−1. After drying under a gentle N2 stream, a lipid film was obtained and then hydrated in 1× PBS buffer. The mixture was vortexed until it yielded a homogeneous opaque mixture and sonicated using a tip sonicator (CV18 model, Chemical Instruments AB) set at 50% amplitude, in pulse mode (10 s on, 10 s off) for 30 minutes of total sonication time. The vesicles samples were used within one hour of preparation.
PolyA and polyU were dissolved in 50 mM sodium phosphate buffer in H2O at the desired pH to a final concentration of 0.1 mg mL−1 and vortexed until the solid had dissolved (approximately 30 seconds). EPO mRNA was diluted 100-fold in 50 mM sodium phosphate buffer in D2O at the desired pH to a final concentration of 10 μg mL−1.
2.3. Quartz crystal microbalance with dissipation (QCM-D)
For the QCM-D measurements, quartz crystals (QSensor QSX 303 SiO2) with a top coating material of SiO2 were used. The fundamental frequency of the crystals was 4.95 MHz. Before use, the crystals were cleaned by rinsing with MilliQ water, 99.5% ethanol, drying with N2 and plasma cleaning for 10 min. The crystals were introduced to the measurement cells immediately after cleaning. After each measurement, they were cleaned for 5 min in 2% (vol/vol) Hellmanex III®, MilliQ water, then 99.5% ethanol while sonicating, dried with N2 and stored in air.A Q-Sense E4 system (Biolin Scientific, Gothenburg, Sweden) with 4 measurement cells was used. All measurements were performed at 25.0 °C at a flow rate of 0.09 mL min−1. Firstly, MilliQ water was introduced to the cells using a peristaltic pump (Ismatec IPC-N 4, Zürich, Switzerland) and the crystals were left to stabilise for 15 min before the fundamental frequencies and dissipation for each overtone were determined. A baseline in MilliQ water was then acquired until the baseline stabilised (at least 30 min), before establishing a baseline in 1× PBS and 50 mM sodium phosphate buffer (for mRNA, in H2O and D2O buffers). The vesicle samples were then injected for 30 min, before rinsing with MilliQ water and 50 mM phosphate buffer (for mRNA, in H2O and D2O). For polyA/polyU measurements, the polyA/polyU was flowed through the cell until Δf and ΔD reached a plateau, then the cell was rinsed with 50 mM phosphate buffer. For mRNA measurements, the mRNA was injected in D2O buffer, then incubated in the cell for 1 h before rinsing with 50 mM phosphate buffer (D2O, then H2O). All measurements were performed in triplicate for each condition.
The measurement data was baseline corrected and plotted in Matlab R2020b (The Mathworks Inc., Natick, MA, USA) and the adsorbed mass was calculated using the Sauerbrey equation.35
2.4. Neutron reflectometry (NR)
Neutron reflectometry measurements were performed using polished silicon substrates (Sil'Tronix, Archamps, France) with the dimensions 50 mm × 80 mm × 15 mm and capped with a silicon oxide layer. The substrates were cleaned using the RCA method, summarised here. The substrates were immersed in a base mixture of 25% NH4OH, 30% H2O2 and MilliQ water (vol/vol/vol 1/1/5) at 80 °C for 5 min, thoroughly rinsed with MilliQ water, then immersed in an acid mixture of 32% HCl, 30% H2O2 and MilliQ water (vol/vol/vol 1/1/5) at 80 °C for 5 min. The substrates were thoroughly rinsed with MilliQ water, then immediately introduced to the reflectometry cells. For POLREF, as this was a remote experiment, the cells were filled with D2O, sealed and shipped to the facility, whereas for D17, this was performed at the facility. Custom neutron reflectometry flow cells optimised for measurements in a horizontal sample geometry were used.Specular neutron reflectometry measurements were performed on the POLREF reflectometer at the ISIS Neutron and Muon Source (STFC Rutherford Appleton Laboratory, Didcot, UK) over q range 0.009–0.27 Å−1 and on the D17 reflectometer at the Institut Laue–Langevin (Grenoble, France) over q range 0.007–0.27 Å−1. Throughout the experiment, the temperature was maintained at 25 °C and for all non-manual sample or contrast changes, an HPLC pump with a flow rate of 1 mL min−1 (POLREF) and 2 mL min−1 (D17) were used. The raw data from POLREF was reduced using Mantid Workbench36 and the data can be found at https://doi.org/10.5286/ISIS.E.RB2010562. The raw data from D17 was reduced using LAMP37 and the data can be found at https://doi.ill.fr/10.5291/ILL-DATA.8-02-892.
Initially the bare surfaces were characterised in D2O and H2O before manual injection of the 0.5 mg mL−1 lipid vesicle sample in 1× PBS. After an incubation period of 45 min–1 h, the cells were manually rinsed with MilliQ water. NR curves for the lipid layer only were obtained after rinsing with each 50 mM sodium phosphate buffer contrast in the following order: D2O buffer, H2O buffer, CMSi buffer. D2O buffer was then pumped into all the cells before the mRNA, polyA or polyU was manually injected. EPO mRNA adsorption was investigated on POLREF for a range of MC3 compositions: 5, 10, 15% MC3 at pH 6 (all) and pH 7 (5 and 15% MC3 only) buffer, whereas adsorption of polyA and polyU was investigated on D17 only for 15% MC3 in pH 6 buffer. After an incubation period of 45 min–1 h, the cell was manually rinsed with D2O buffer. NR curves were obtained after rinsing with each 50 mM sodium phosphate buffer contrast in the following order: D2O buffer, CMSi buffer, H2O buffer. On D17, a further mRNA matched contrast was acquired.
All neutron reflectometry data was fitted using the RefNX data analysis package.38 In this process, the model of the structure is built up of a series of slabs described by a thickness, a scattering length density (SLD), a volume fraction of solvent (vf) and an interfacial (Gaussian) roughness. The model fit was co-refined with measurements in 3 solvent contrasts (D2O buffer, CMSi buffer and H2O buffer, with an additional CMRNA buffer after incubation with polyA/polyU) using differential evolution as the fitting method. Bayesian analysis was performed using Markov chain Monte Carlo (MCMC) sampling to estimate the posterior probability distributions for each fit parameter, which were used to discuss if the fit is sensitive to this fit parameter and if parameters are correlated.39 The data for the lipid layers alone were fit using multiple models, which were compared based upon the calculated global χ2 (i.e. the total for the 3 contrasts) and Bayesian distributions (i.e. is the fit sensitive to each parameter). The values used for scattering length density calculations (Tables S1 and S2) and fitting models are described in detail in the ESI.†
2.5. Total internal reflection fluorescence (TIRF) microscopy
0.15 mm thick rectangular glass slides (number one coverslips ∅ 25 mm, Thermo Fisher Scientific) were cleaned following a protocol already reported in the literature.40 The glass slides were placed in a piranha solution (3:1 v/v of 99% H2SO4 and 30% H2O2, both from Sigma) and heated at 80 °C for 30 minutes. The glass slides were then rinsed excessively in running, distilled water, and a press-to-seal silicon well (Silicon isolators, 12 × 4.5 mm diameter, 1.7 mm depth, Grace Biolabs) were attached to them. The vesicles were diluted 1:20 (v/v) in 60 μL of 1× PBS buffer and incubated for one hour at room temperature in the well. The solution was kept for 1 hour at room temperature and in dark conditions; after the incubation, the excess of vesicles was removed from the formed lipid layer by washing at least five times first with distilled water and then with 50 mM sodium phosphate buffer to reach the target pH in the well. The fluorescence recovery after photobleaching (FRAP) measurements were performed using a Nikon Eclipse TE2000-U microscope equipped with a Hamamatsu ORCA-Flash4.0 LT Digital scientific CMOS camera (C1140-22U) and a Nikon Apo TIRF 60× magnification oil-immersion objective was employed for the fluorescence measurements. The fluorescently labelled lipid layer was illuminated by Cobolt MLD compact diode lasers operating at 488 nm (30 mW). A small area of the lipid layer was photobleached (circular bleaching with laser spot diameter = 20 μm) by focusing the laser illumination to the center of the lipid layer and the studying the recovery after bleaching. A high recovery (>80%) was observed in all cases, and then the FRAP profile was analyzed by the MATLAB program frap_analysis.41 The lipid layer images were acquired with 100 ms of exposure time, via μ Manager version 1.4.42 The experiments were repeated on three independent samples for each condition and on two different areas per sample. The same protocol was followed after addition of polyA and rinsing with the desired 50 mM sodium phosphate buffer.
2.6. Classical molecular dynamics (MD) simulations
Before performing classical MD simulations, a model for the ionisable form of DLin-MC3-DMA was derived using the same approach and methods as in previous work43 in order to complement the neutral model suitable for SLipids force field. Here we note that there are several different force fields that can be used in modelling this lipid in lipid bilayers. For a detailed discussion we refer the reader to the recent work of Ibrahim et al.44In this work the goal was to derive partial atomic charges, while all other parameters were taken from the previously derived version of the force field. In contrary to the neutral model the total charge of the ionised lipid was equal to +1. Partial atomic charges were computed for 50 random conformations of every ionised lipid using quantum chemical software Gaussian09. The level of theory was B3LYP45 and cc-pVTZ46 was the basis set. Restrained electrostatic potential (RESP) approach in the R.E.D.47 software was utilised to obtain more precise partial charges. The IEFPCM48 solvent model with the dielectric constant of 78.4 were used in order to mimic the solvent around the lipid head-groups since they were of particular concern here. The set of partial charges can be observed in Fig. S1 of the ESI.†
Then the derived model was added to the SLipids force field database and the MD simulations were prepared according to the following protocol. Firstly, lipid bilayers containing DOPC and DLin-MC3-DMA were created where the ionisable lipids were placed randomly among the phospholipids in order to avoid any potential aggregation during the equilibration. Neutral systems with 5% of DLin-MC3-DMA contained 10 ionisable lipid molecules and 190 molecules of DOPC, while systems with 15% of DLin-MC3-DMA had 30 molecules of DLin-MC3-DMA and 170 molecules of DOPC. 16000 water molecules of the TIP3p49 model were present in both systems as well as ions of Na and Cl for the concentration of salt equal to 0.1 M. Systems with ionised lipids were constructed in a similar way except that when adding the ions of salt the protonation state of DLin-MC3-DMA was taken into account which resulted in 30 extra Cl ions for the simulation with 15% of the ionisable lipid and 10 additional Cl ions for the system with 5% of DLin-MC3-DMA in order to have the total charge of the system equal to zero.
Then the created lipid bilayers in water were equilibrated in NPT ensemble under the pressure of 1 atm and the temperature of 25 °C for 200 ns, followed by a production run of 600 ns. Berendsen barostat was employed for maintaining and keeping the pressure under semi-isotropic50,51 pressure coupling scheme. Velocity rescaling52 thermostat was used for regulating the temperature. Newtonian equations of motion were integrated by leap-frog53 algorithm with a step of 2 fs. The cut-off scheme was Verlet54 with the type van der Waals and a radius of 1.2 nm. LINCS55,56 algorithm was used for optimizing the bonds with 12 iterations. GROMACS-201957,58 software was used for simulating all systems.
After equilibration of 200 ns frames with lipid bilayers were extracted without water in order to create simulations with polyA and polyU. Due to its large size which would lead to extremely large systems, mRNA were not considered for MD simulations. PolyA and polyU were taken in their short versions (11 residues for polyA and 8 residues for polyU) from the existing structural solutions in the Protein Data Bank (PDB). For polyA the structure 4JRD59 and for polyU it was a part of the structure 5N9460 taken from the PDB. Both polynucleotides were taken as single strands and their protonation states were adjusted according to the pH of simulations.
In boxes containing only equilibrated lipid bilayers 4 polyA/polyU chains were inserted randomly keeping the distance of 7 Å from the membrane surfaces. The same distance was applied between chains themselves. After the addition of polynucleotides the total charge of every system was recalculated and ions were added respectively for following the concentration of salt equal to 0.1 M and the total charge of every system equal to 0. Then 16000 water molecules of TIP3p49 model were added and resulting boxes were equilibrated for 200 ns, followed by production runs until 600 ns. Settings, algorithms and software for simulations with polynucleotides were exactly the same as for membranes containing only lipids.
3. Results and discussion
3.1. Lipid layer
From QCM-D data, the mass adsorbed to the crystal surface and the viscoelasticity of the layer can be determined from the change in frequency and dissipation, respectively. Assuming that the layer is homogenous and rigid and that its mass is small compared to the mass of crystal, the adsorbed mass can be calculated using the Sauerbrey equation.35 | (1) |
 | ||
| Fig. 1 Change in (a) adsorbed mass and (b) dissipation from QCM-D measurements for lipid layers with different MC3 content at different pHs before incubation with nucleic acid and change in (c) diffusion constant and (d) immobile fraction of the fluorescent probe from TIRF measurements. | ||
The dynamics in the lipid layer were studied by means of fluorescence recovery after photobleaching (FRAP) using TIRF microscopy to evaluate the lateral (2-dimensional) diffusion constant and the immobile fraction (the fraction of immobile molecules that do not contribute to the fluorescence recovery) of the dye within the lipid layer. These values are dependent on the chemical surroundings of the labelled lipid, therefore we can get information about how the inclusion of MC3 affects the diffusivity of the probe in comparison to the control membrane (pure DOPC). A clear difference in the behavior of the probe in the pure DOPC membrane compared to all MC3 containing membranes can be observed. Even at 5% MC3 at all pHs under investigation, the diffusion constant and the immobile fraction increased, most likely due to an increased disorder of the layer as already observed from the QCM-D results. Interestingly, the apparent pKa of MC3 influences the diffusion constant; the diffusivity below and slightly above this threshold is lower than the one measured above the pKa (both pH 7 and 8) and this difference becomes more evident when increasing the MC3 content in the lipid layer. The pH dependent mobility is related to the charge of MC3: apparently, when it is positively charged, the diffusion of the fluorescently labelled lipid is partially hindered, whereas it is enhanced at neutral or basic pH. On the other hand, the number of immobile molecules of dye that do not contribute to the FRAP signal seems to be unaffected by the pH of the medium. By increasing the MC3 content in the layer, the immobile fraction increases, indicating that the inclusion of CIL mostly affects the distribution of mobile dye molecules.
From this initial characterisation, it can be concluded that even with a small proportion of MC3 in the lipid layer, the bilayer structure is perturbed. It is therefore possible that the decrease in dissipation observed when increasing MC3 content from 5% to 15% is due to partial phase separation of the MC3 in the layer. If a lower MC3 content causes disorder within the layer, a higher MC3 content might instead cause phase separation, thereby reducing the disorder. In the TIRF measurements, this could affect the immobile fraction of the labelled lipid. In the TIRF images no domains were visible, however given that the spatial resolution of the technique is around 200–250 nm, there could be domains present with a size below this limit.
The structure of the MC3 containing lipid layers was further investigated using neutron reflectometry (NR) at 2 different pHs, above and below the apparent pKa. The experimental results are discussed in comparison to complementary molecular dynamics (MD) simulations of the same lipid composition with fully ionised or neutral MC3.
From snapshots of the simulated lipid layers (Fig. 2), an idea of the structure of the layer can be inferred. In all cases, the structure seems somewhat bilayer like. It should be noted that, although in the 15% ionised MC3 snapshot, the layer appears slightly bent, it is unlikely that this would be observed in the corresponding experiments, due to the influence of the supporting silicon surface on the layer in the experimental set up. Mass density profiles for the simulated lipid layers (Fig. S3†) show minimal differences, but it is possible to distinguish between them, as the 5% MC3 layers appear to be slightly thicker than the 15% (the small difference observed in the simulations is likely within experimental error, therefore would not be detectable).
 | ||
| Fig. 2 Snapshots of simulated systems containing no NA. (a) System with 5% of neutral DLin-MC3-DMA. (b) System with 15% of neutral DLin-MC3-DMA. (c) System with 5% of protonated DLin-MC3-DMA. (d) System with 15% of protonated DLin-MC3-DMA. Colors: dark blue – DLin-MC3-DMA lipids; cyan – DOPC; red/dark yellow balls are head groups of DOPC lipids. Water is omitted for the clarity. | ||
In order to highlight the difference in behavior between groups of interest in MC3 in its protonated and neutral states, subtracted partial mass density profiles were calculated (Fig. 3). In the protonated system, the MC3 head groups are situated mainly at the membrane surface while in the neutral form they can reside below the carboxyl groups of the phospholipid, closer to the membrane centre. Similarly, in the ionised form, the methyl group and the unsaturated parts of the MC3 tail prefer to locate closer to phospholipid head-groups compared to the neutral case. When comparing the 5% and 15% MC3 containing layers, these differences are even more enhanced with a larger amount of MC3. In an earlier work,63 it was demonstrated that in membranes with DOPC containing some amount of neutral MC3, loading more of this lipid could result in aggregation of this lipid in the bilayer, which did not occur in the absence of MC3. This can explain the observation of clusters in systems with a larger proportion of neutral MC3.
 | ||
| Fig. 3 Subtracted partial mass density profiles for simulations without NA for parts of DLin-MC3-DMA. Here the subtraction was done in a following way: from the mass density of the charged system the mass density of neutral was subtracted. (a) Simulations with 5% of DLin-MC3-DMA. (b) Simulations with 15% of DLin-MC3-DMA. “head” is for head-groups of DLin-MC3-DMA, “DB” – for the double bond region and “CH3” stands for CH3 groups in lipid tails. | ||
From these simulation predictions for the charged systems, the lipid layers in pH 6 buffer are expected to have a more “bilayer-like” structure with the MC3 head groups located close to the DOPC head groups. As can be seen in Fig. 4 showing the corresponding NR data, there is very little difference between the scattering profiles for all of the MC3% in all solvent contrasts in pH 6 buffer. The applied bilayer model agrees well with the experimental data for this pH, as shown in Fig. S4.† The results from the fitting are discussed in more detail in the ESI (Tables S3–S5, and Fig. S4–S11†). The volume fraction profiles for each sample were plotted for the bilayer model fit in Fig. S5† and were similar for all of the lipid layers in pH6 buffer. All of the layers had a similar lipid area per molecule (APM) and number of water molecules per lipid head group (WPLH) (see Table S3†), which compare well to the literature values of 72.2 Å2 and 11 respectively for a DOPC bilayer at 30 °C.64 It should be noted that the WPLH of ≈10 stated here refers to the number of water molecules per lipid between adjacent headgroups in the same monolayer. This is opposed to the more commonly quoted larger number of water molecules per lipid, reported to be 32 for the DOPC system, that also include those between adjacent bilayers in a stack.65 However, a slightly higher WPLH and bilayer roughness for the 5% MC3 layer resulted in a higher volume fraction of solvent in the head group (Fig. S5a†) compared to the bilayers with higher content of MC3 (Fig. S5b and c†). The roughness of the layer increased with decreasing MC3 in the layer from 3.1 ± 0.1 Å for 15% MC3 to 4.4 ± 0.2 Å for 5% MC3.
 | ||
| Fig. 4 Neutron reflectometry data for the lipid layers with different content of MC3 in (a) pH 6 buffer for all contrasts: D2O (top), CMSi (middle) and H2O (bottom). Minor differences in the NR data (b) for pH 6 and 7 are observed for the 5% MC3 layers over the whole q range and (c) for the 15% MC3 layer at high q. Data is plotted as Rq4 against q to highlight the small differences between the curves. | ||
Comparing the effect of different pHs for the 15% MC3 layers (Fig. 4), the curves mostly overlay but with a small difference at high q, indicating a minor increase in thickness in pH 7 buffer. However, a change in shape of the curve with pH can be observed over the full q range for a content of 5% MC3. The lipid layers at pH 7 can also be reasonably well described using a bilayer model (Fig. S12†), resulting in a higher WPLH but slightly lower APM for both layers compared to the pH 6 results. This is apparent from the volume fraction for the different samples (Fig. S13†), especially for 15% MC3 (Fig. S13c and d†). A similar roughness was calculated for 5% MC3 in pH 7 as in pH 6 buffer, whereas an increase in roughness was observed for 15% MC3, which could be interpreted as a roughening of the head group/tail interface due to clustering of the MC3 (see Table S6†).
In the snapshots from simulations (Fig. 2), for the 5% MC3 layers, there isn't any clear clustering of the MC3, most likely due to the small number of MC3 molecules present. For the 15% MC3 layers, however, clustering of the MC3 molecules appears to be present in both the ionised and neutral cases, but especially in the neutral form. In this case, clusters are observed in the bilayer center, which was also observed in previous work.43 Since clustering appears to occur to some extent for both charged and neutral MC3 and, given the difference in the MC3 and DOPC tails, we can attribute this clustering to the tail mismatch. For the neutral MC3, more extensive clustering was observed in simulation, which could also be driven by the disruption of the H bonding network between DOPC and water (Table S18†). Taking into account the difference in the time-scale of simulations compared to the actual time scale of lipid motions, i.e. lipid flip-flop can occur on a time-interval from seconds to hours, while in atomistic computations the limit is in microseconds, free energy calculations can help to establish if MC3 has the ability to aggregate inside a DOPC bilayer.
Such calculations were previously performed63 for various phospholipid bilayers with neutral forms of different ionisable lipids. For each composition, 5 random starting configurations were simulated in parallel in order to obtain better statistical sampling. In calculations with a pure DOPC membrane and a single molecule of MC3 it was observed that MC3 would not penetrate the membrane spontaneously (the value of the potential of mean force was positive in the bilayer center), while in systems with pre-loaded MC3 the lowest negative value of the potential of mean force was in the bilayer center for a selected single molecule of MC3.63 This indicates its ability to penetrate the membrane as well as to aggregate in the bilayer center spontaneously. Consequently, it is possible that on a larger time and length scale (than accessible for simulations) this clustering could form domains.
This clustering could also be a reason for the minor disagreement between the bilayer model and the experimental neutron reflectometry data recorded in the silicon matched water (CMSi) contrast for 15% MC3 at pH 7 (Fig. S12†), which shows that the model does not describe the full behaviour of the system. This is expected as the other complementary data and simulation structures indicate that at a pH above the apparent pKa, where the majority of the MC3 lipid would be neutral, the structure does not behave as a perfect bilayer and may contain some clustered MC3. It is under these conditions where we expect the lipid layer to be the least ‘bilayer-like’ of the samples measured. Fitting with alternative models, including a bilayer with a water interlayer, a generic 3 slab model and a generic 4 slab model to describe the lipid layer, also cannot fully reproduce this part of the 15% MC3 pH 7 curve, although all of them reproduce the trends in hydration and roughness observed with the bilayer model fit. The models and fitting parameters are discussed in more detail in the ESI (Tables S6–S9, and Fig. S12–S21†). Due to the small amount of MC3 included and the similar scattering length densities (SLDs) of DOPC and MC3, there is some ambiguity in the data fitting. Deuteration of the lipids would be required to confirm the position of the MC3 in the layer.
3.2. Interaction between nucleic acids and the lipid layer
 | ||
| Fig. 5 Cases observed in QCM-D measurements. The trace starts from the values of the equilibrated lipid layer after rinsing with 50 mM phosphate buffer to adjust the pH and are plotted for at least 4 overtones, where (e.g.) F3 and D3 refer to the change in frequency (Δf) and dissipation (ΔD) for overtone number 3. The changes in Δf and ΔD after addition of polyA for different measurement conditions are plotted to demonstrate the different cases: (a) shows case (i), where there is no significant change upon addition of polyA; (b) shows case (ii), where there are initial changes upon addition of polyA, which then recover after equilibration and rinsing; (c) shows case (iii), where the changes upon addition of polyA remain after equilibration and rinsing. | ||
In case (i), no change is observed in Δf or ΔD after addition of the nucleic acid, except a small increase in dissipation when adding the NA, which can be attributed to the small increase in viscosity of the bulk solvent due to the dissolved NA. This indicates that there is no significant interaction between the lipid layer and NA. Case (ii) is more difficult to interpret. Although this could be interpreted as NA adsorption and desorption after rinsing, this is likely not the reason as a clear permanent change is observed in the NR data (Fig. 7), which is discussed in more detail below. An alternative, more likely, interpretation is that the NA adsorbs to and penetrates into the lipid layer. In this case, the initial Δf decrease and ΔD increase correspond to the adsorption of the NA to the outside of the layer, followed by a slow Δf increase and ΔD decrease as the NA penetrates into the lipid layer, displacing water associated with the layer and possibly removing lipid from the layer. The Δf and ΔD values return to close to or slightly less than those of the equilibrated lipid layer. In case (iii), there is a permanent change in Δf and ΔD indicating that there is added mass to the adsorbed layer. This is most likely due to adsorption of NA to the surface of the layer possibly with some small penetration into the lipid layer.
A general trend was observed for all RNAs, that with increasing %MC3 and decreasing pH, the behaviour changed from case (i) through case (ii) (for polyA and polyU) to case (iii), as illustrated in Fig. 6. These changes in adsorption type can be linked to both the (changes in) structure of each RNA and the lipid layer.
 | ||
| Fig. 6 Figure showing trends in QCM-D case with pH and %MC3 for polyA (left), polyU (middle) and EPO mRNA (right), where case (i) is represented by white, case (ii) by a striped square and case (iii) by a solid coloured square. | ||
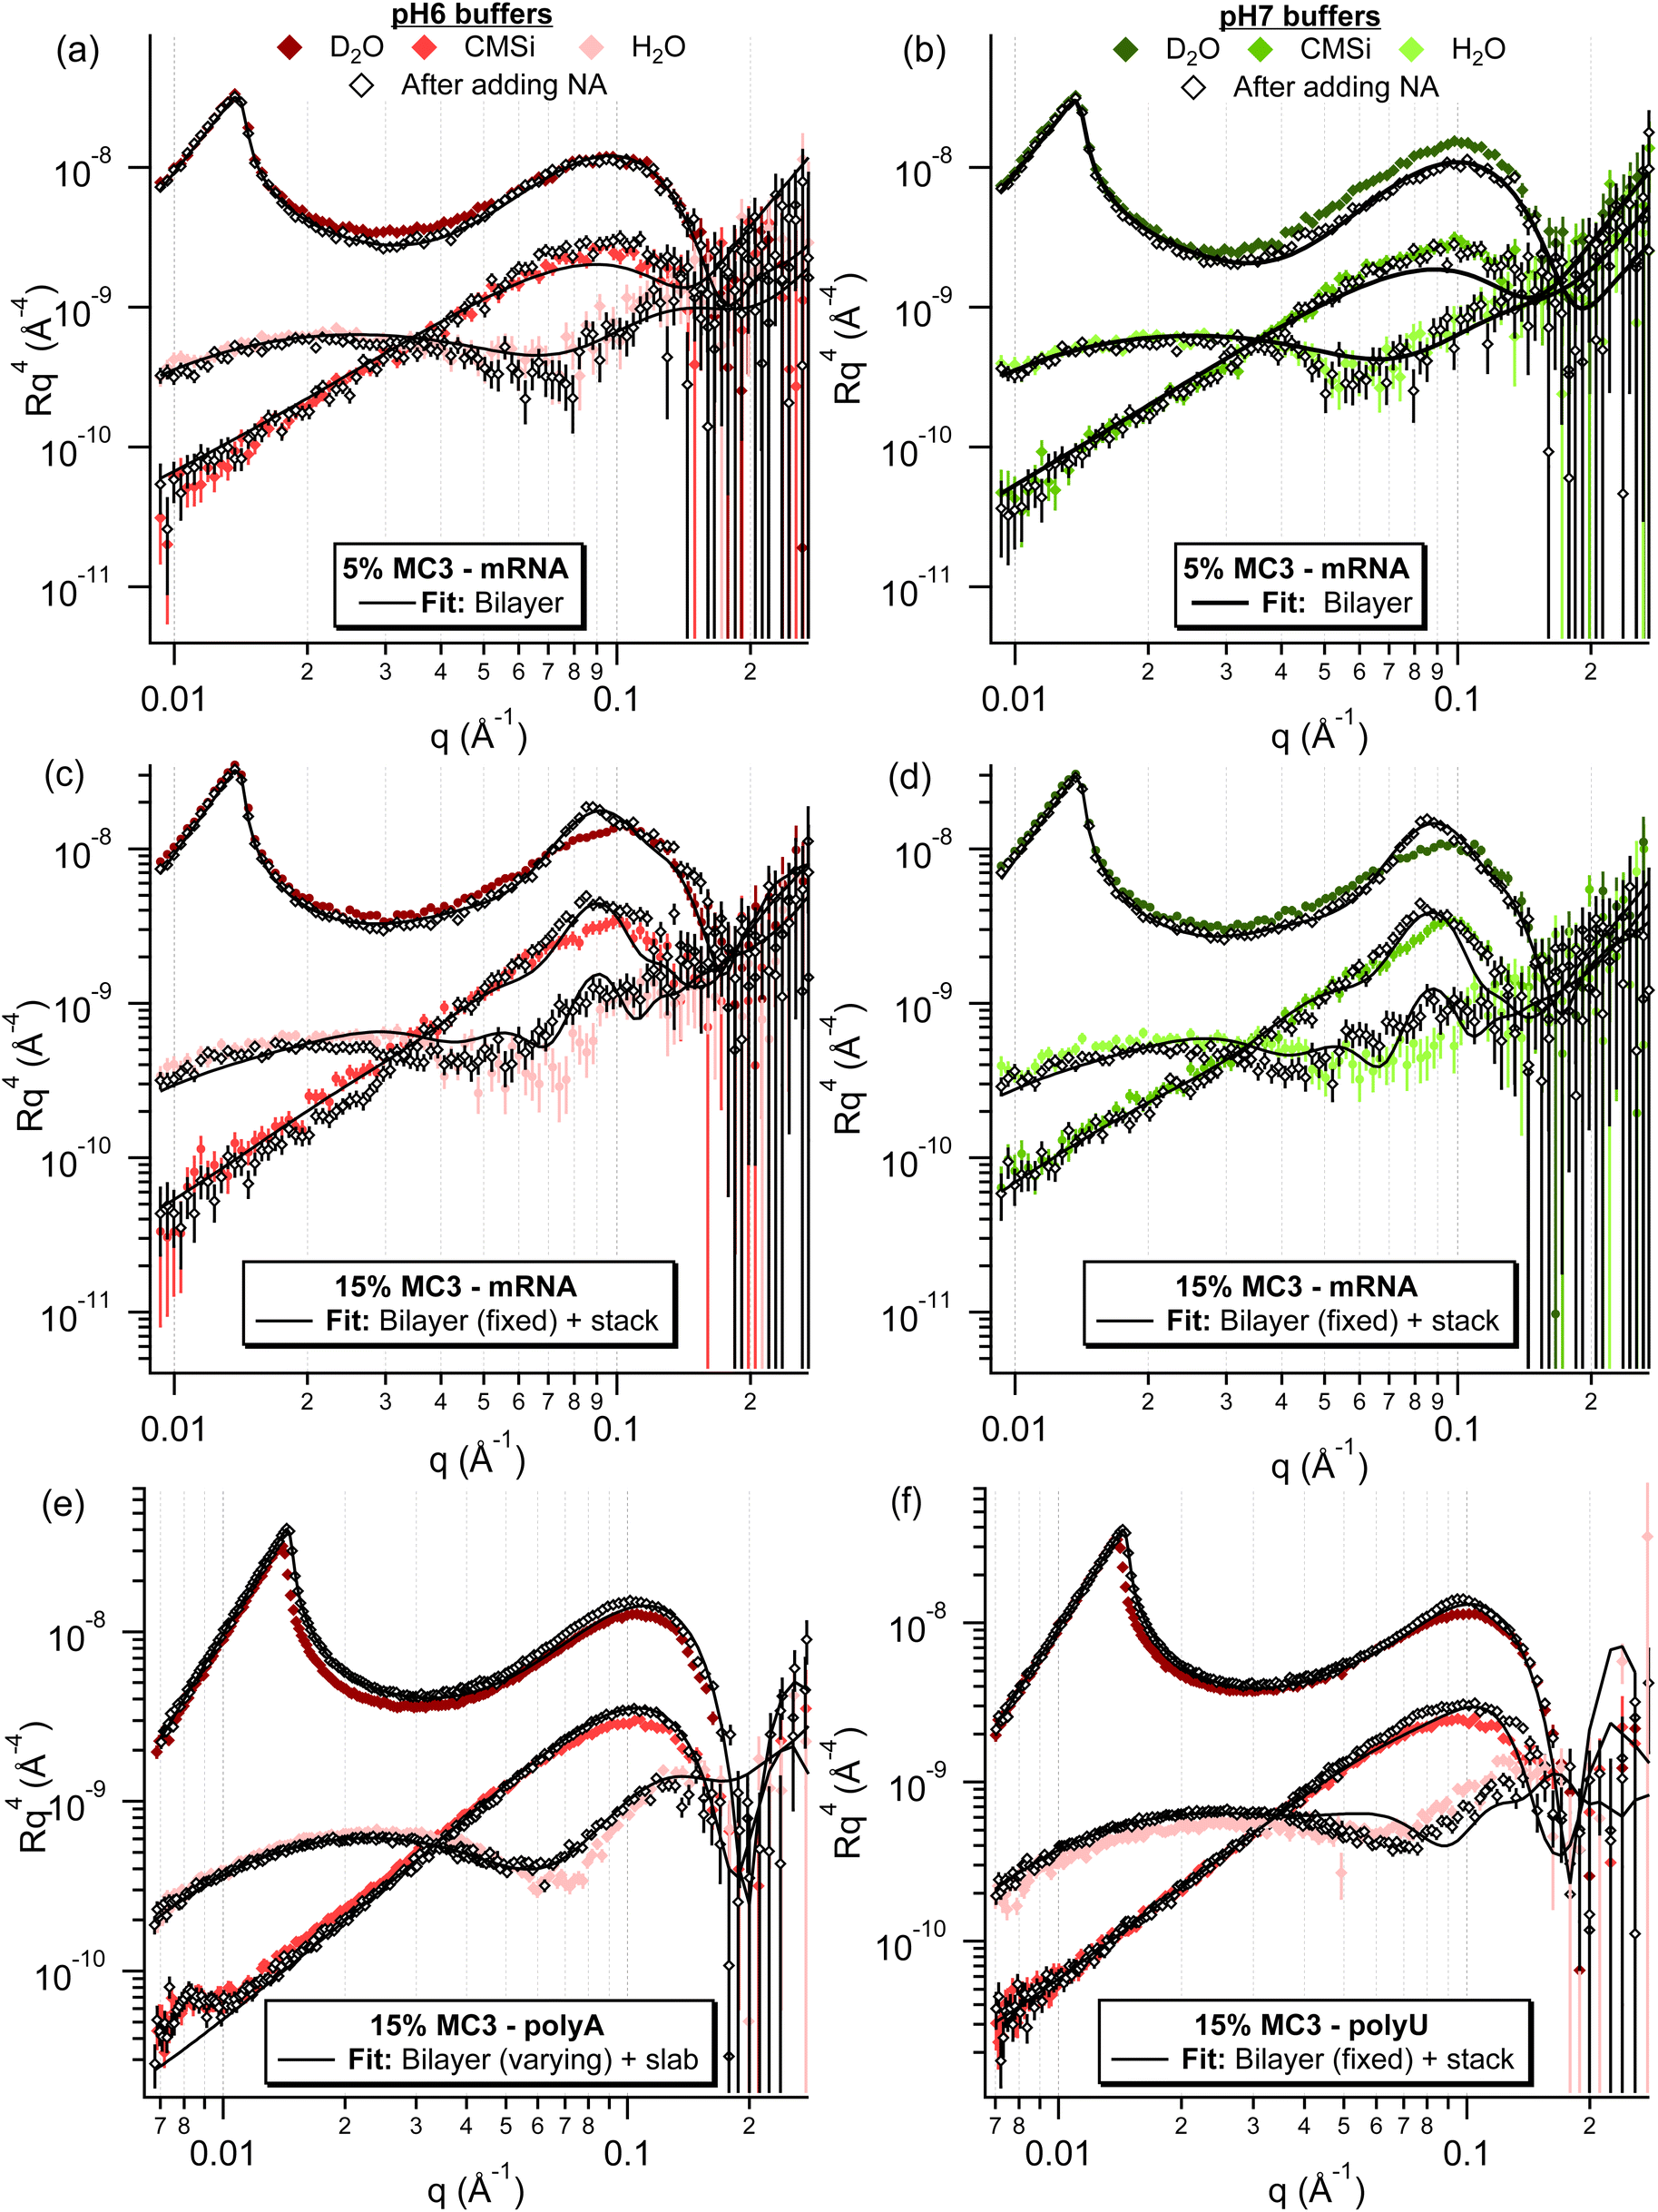 | ||
| Fig. 7 Neutron reflectometry data for the different %MC3 containing lipid layers after incubation with different NAs. For the 5% MC3 layers in both pHs (a and b), only minor changes are observed after incubation with mRNA, which are mostly within experimental error. For the 10% MC3 layer in pH 6 (Fig. S27†) and 15% MC3 layers in both pHs (c and d) after incubation with mRNA, the formation of a broad peak can be observed at approximately 0.09 Å−1, indicating the presence of a multilayer. For the 15% MC3 layer in pH 6 buffer after incubation with polyA (e), minor changes were observed, mostly in the H2O contrast, whereas after incubation with polyU (f), a subtle broad peak can be observed, mostly in the D2O contrast, analogous to the ones in (c and d). | ||
Case (i) is observed for the pure DOPC and 5% MC3 layers for all RNAs at all pHs, indicating that there is a threshold amount of MC3 required in the layer for significant adsorption of NA. This concept can be further extended to a required charge density in the layer, as there is a clear MC3 content and pH dependent trend in the adsorbed amount for the higher %MC3 layers. The pH range of these measurements covers the pKa of MC3, which is ≈6.44, therefore >50% of the MC3 is expected to be positively charged at the lowest pH studied here.66 It should be noted, however, that the cited pKa is the apparent pKa, as the environment surrounding the protonation site can have a large effect on its pKa.67 As can be seen in Fig. 8(a, c and e), the adsorbed mass upon addition of NA for polyA, polyU and mRNA respectively, increases with decreasing pH and increasing amount of MC3 in the layer. For mRNA the adsorbed mass before and after equilibration was the same within error for all conditions. At the same pH, the charge density in the layer would be increased by the increasing the amount of MC3 in the layer, resulting in higher NA adsorption (e.g.Fig. 8c: polyU adsorption at pH 6). Similarly, at the same MC3 content, the positive charge density in the layer is increased by lowering the pH to below the pKa, i.e. an increasing proportion of the MC3 becomes protonated. This results in higher adsorption (e.g.Fig. 8c: polyU adsorption at 15% MC3). Assuming that the frequency change between the lipid layer and the initial minimum after addition of the NA for case (ii) indicates the mass of the adsorbed NA, as in case (iii), the adsorbed amounts for polyA and polyU are similar for the lipid layer with 15% MC3, whereas the adsorbed mass for mRNA is significantly higher.
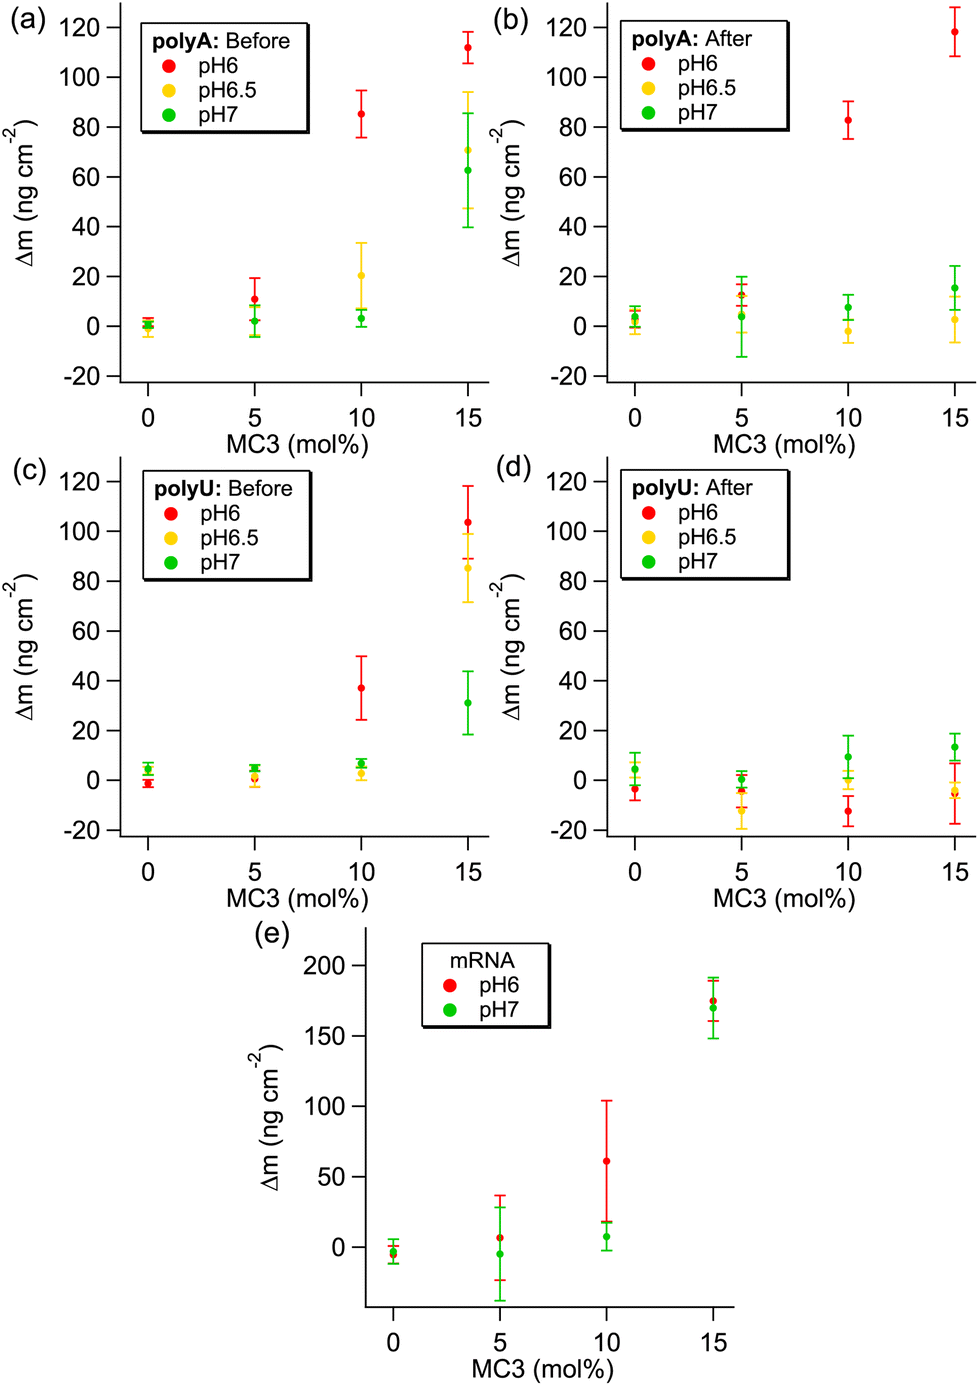 | ||
| Fig. 8 The change in adsorbed mass before and after equilibration is shown for polyA (a and b) and polyU (c and d). For mRNA in all conditions, the adsorbed mass remained the same after equilibration (e). Change in adsorbed mass before equilibration was calculated using the difference in frequency between the lipid layer and the initial minimum after addition of the NA. Adsorbed mass after equilibration was calculated using the difference in frequency between the lipid layer and the plateau after equilibration and rinsing. The corresponding plots showing change in dissipation (Fig. S22) are included in the ESI, along with the equivalent plots using only the 7th overtone, which show the same trend (Fig. S23 and S24†). | ||
To gain further insight on the adsorption of the NA to the different lipid layers, the corresponding neutron reflectometry measurements were also performed for 5, 10 and 15% MC3 layers in pH 6 (all) and pH 7 (5 and 15% only) buffer for EPO mRNA. For both 5% MC3 layers, only a minor change was observed after incubation with mRNA, therefore these curves were fit with a bilayer model (Fig. S25–27†). Small differences in the number of waters per lipid head (WPLH) and lipid area per molecule (APM) were observed for both layers, with an increase in roughness for both (see Table S11†). For all of the other layers (10% MC3 in pH 6 and 15% MC3 in both pHs), the appearance of a broad peak at approximately 0.082 Å−1 was observed after incubation with mRNA, indicating the formation of a multilayer structure with a repeat distance of approximately 77 Å (Fig. 7). The conditions under which this peak is observed correspond to those where a change in adsorbed mass was observed with QCM-D. When plotted together (Fig. S28†), the reflectivity curves overlap well apart from a deviation at high q for 15% MC3 at pH 7 compared to the corresponding layer at pH 6. The same trends were observed already in the lipid layer alone, indicating a similar multilayer is formed in these conditions. A mixed area model of a bilayer and multilayer stack, where the stack consists of two alternating layers, could be successfully fitted to the experimental data (Fig. S29–32†). Judging from the SLD values of the layers, they contain a mixture of lipids and mRNA, with one less hydrated, lipid rich layer and one more hydrated, mRNA rich layer (Table S12†). Considering the thickness of the layer and the high degree of hydration, it does not appear that the mRNA is densely packed in the mRNA rich layer, however there is not sufficient sensitivity in the measurement to extract any structural details.
NR measurements were additionally performed for 15% MC3 in pH 6 buffer with polyA and polyU, in which conditions case (iii) is observed for polyA (and EPO mRNA) and case (ii) for polyU in QCM-D. Compared to the mRNA curve for the same conditions, a similar but much smaller change can be observed for polyU, with a broad peak at approximately 0.09 Å−1 (Fig. 7). This sample was therefore fit using the same mixed area model of a bilayer and multilayer stack, with similar fit values observed (Fig. S33, S34, and Table S13†). It should be noted that this fit does not describe the region where the peak observed in the D2O contrast, which indicates the presence of a multilayer, very well. This is most likely due to lack of sensitivity of the fit for this more subtle feature. In the polyA sample, however, this broad peak is not observed and the main difference is instead seen in the H2O contrast, which is more sensitive to the lipid head groups. This sample was best described by a mixed area model of a bilayer and a bilayer with a single slab, when the bilayer parameters were allowed to vary during the fitting process (Fig. S35–S38 and Tables S14–S17†).
The question arises of whether the formation of the complexes between NAs and MC3 can lead to removal of material from the interface via mixed micelle formation. The QCM-D results do not appear to indicate any large loss of material, however it is not possible to differentiate between loss of material from the layer or of water associated to the layer. From the reflectometry fitting, the total surface coverage appears to be unaffected by the addition of NAs. For the 5% MC3 layers in both buffers after addition of EPO mRNA and the 15% MC3 layer in pH6 buffer after addition of polyA, the fitted WPLT was zero within error. For the 10% MC3 layer in pH 6 buffer after addition of EPO mRNA and the 15% MC3 layers after addition of polyU or EPO mRNA, the volume fraction of solvent in the layer of the multilayer closest to the Si surface is very low. The multilayer structure observed in the 15% MC3 layers after addition of EPO mRNA or polyU could possibly be interpreted as mixed micelles. However, further information would be needed to make this conclusion. Assuming mixed micelles did form, they would be expected to have close to zero net-charge and poor aqueous solubility, therefore would be likely to remain close to the interface.
To interpret the different cases, NR curves and the conditions in which they are observed, it is important to discuss the structure of the different RNAs in solution. Over the pH range investigated here, polyA undergoes structural changes, where the structure depends on its protonation state (68 and ref. within). The exact pH values for these transitions depend on the solution conditions, temperature and measurement technique. In neutral or slightly alkaline pH (≥7.3), it exists as single stranded, right handed helix, with melted domains that increase in size with increasing temperature.68 As the pH lowers to ≈6.5 (pH 6.2–6.5), the double stranded structures start to form, initially dominated by an intermediate ‘B’ state then transitioning to a tightly packed ‘A’ state at ≈pH 6 then becomes ‘gel-like’ at lower pH.69,70 Conversely, although polyU can undergo structural ordering at low temperatures, it has a random coil structure under physiological conditions and the experimental conditions investigated here (71 and ref. within). Understanding the structure of even relatively short chain biological RNA is challenging, as many different secondary structures can form that depend not only on the sequence but also environmental conditions, such as temperature, pH, crowding, ions in solution, enzymatic modification and protein or small molecule binding.72 The secondary structure is most often stabilised by intra-/interstrand base stacking and hydrogen bonding.72,73 Additionally there are multiple possible tertiary structures into which the RNA can fold, partially dictated by the secondary structure.73 Excluding very specific conditions, even highly structured RNAs tend to populate a variety of states and are highly dynamic, making simulations, which often work by minimising the system energy, struggle to capture a representative picture.72,73 Consequently, although it was not possible to simulate the EPO mRNA used here due to its size and complexity, it is assumed that it has some secondary structure that could be pH dependent.
Taking these structural differences into account, the differences in QCM-D case with pH can be discussed (see Fig. 6). Case (iii) is observed for polyA in pH 6, where the double stranded structures start to dominate, and for mRNA in both pH 6 and 7. The interaction of the nucleobases with the lipid layer is likely to be hampered if the NA has a sufficiently ordered or bulky structure or if substantial base pairing occurs. The main interaction would then be via the charged sugar phosphate backbone, which would limit the ability of the NA to penetrate into the layer. This could result in an NA layer forming on top of the lipid layer or partial penetration of the NA into the head group layer, with a part remaining on or near the interface. For adsorption of polyA in pH 6 buffer, the data is well described by a model where parts of the bilayer have polyA in a single slab on the bilayer surface. It should be noted here that the main difference between the data before and after incubation with polyA is observed in the H2O contrast, which is the most sensitive to the lipid head groups, indicating that this part is affected the most by the NA interaction.
Case (ii) is only seen for polyU, which is a random coil for all conditions here, and polyA in conditions where it is dominated by the single stranded helical form, from pH 6.5 and above. This seems to indicate that the single stranded nature of the structure is important to allow this penetration into the lipid layer, which is possibly due to the less bulky nature of the NA under these conditions and/or that such a configuration allows access to the more hydrophobic parts of the nucleotides promoting hydrophobic interactions with the lipid acyl chains, as proposed previously.74–76 Although the model fitting of the NR data for the polyU is somewhat ambiguous, the presence of the broad peak in Fig. 7 indicates multilayer formation. Clear multilayer formation, however, was observed for 10% MC3 in pH 6 buffer and 15% MC3 on both pH 6 and 7 buffers after incubation with EPO mRNA, where alternating mRNA rich and lipid rich layers with high roughness were observed. This could be a result of penetration of the mRNA into and disruption of the lipid bilayer, causing structural rearrangement into a less ordered layer and/or coating of the mRNA in lipids. However, as highlighted previously, this technique was not sensitive enough to resolve this level of structural detail.
Due to its comparatively complex sequence, it is likely that the mRNA has parts that are double stranded, such as hairpin loops, and parts which are single stranded. As a result, a combination of these effects is likely to be relevant for mRNA with parts that penetrate into the lipid layer and parts residing at the surface of the lipid layer.
A further effect that could contribute to both the structural changes observed in the NR measurements and the magnitude of the ΔD and Δf changes observed in QCM-D measurements is the size of the adsorbed molecules. Both polyA and polyU are very polydisperse with a mean molecular weight that has been shown to vary between batches, whereas mRNA has a well defined length dictated by its sequence. For example, the EPO mRNA used here has a length of 858 nucleotides with a mass of 290 kDa.77,78 The magnitude of different effects due to the molecule length (e.g. loss of conformational entropy upon adsorption) could result in preferential adsorption of a certain molecule size.
Although molecular dynamics simulations today can handle relatively large systems on an all-atom level, due to the very large and complex structures of mRNA it cannot be investigated with such high resolution. Accurate and reliable models of mRNA with a lower resolution (i.e. coarse grained models) have not yet been developed in such a way that they give proper information about the interactions and structures of the system. In this work, we have therefore, only simulated the interaction between our model lipid system and polyA or polyU. As previously stated, short versions of the NAs were used to avoid unfeasible simulation lengths, but it should be noted that the shorter chain length could affect the lipid–NA interaction. The effect of pH was additionally investigated by changing the protonation states of the molecules in the system and inserting counter ions in order to maintain the overall neutrality of the system. This is a well-known approach for this type of system.
One way to investigate the behavior of molecules in systems containing lipid bilayers is through computing the mass density profiles of those systems in the z-direction (perpendicular to the bilayer plane). Such profiles can show if the thickness of the bilayer (double the distance from the bilayer center to the maximum value of the mass density) has changed. Another way is to look at the radial distribution functions of certain parts of the system components which provide information about possible associations between the NAs and lipids. Structural investigations of the NAs can show which conformations can appear and how they could possibly affect and be affected by the lipid layer.
In the molecular dynamics simulations, we have chosen to add the NAs as single strands in order to see if; (1) the NA strand alone is enough to reproduce experimental trends (i.e. is the structure important or is the interaction on a molecular level sufficient?) and (2) the lipid–NA interaction would induce or inhibit the formation of the structures seen in solution (i.e. can the solution structure form in the presence of lipids?). As polyU was unstructured in all experimental conditions measured, these considerations are more relevant to polyA, in order to see if polyA would start forming ordered double stranded structures which were assumed to be present in experiment. For instance, in the work of N. Safaee et al.59 it was shown that the process of formation of these ordered structures was fast and polyA-binding protein was used in order to inhibit it.
Fig. S39 in the ESI† shows the full mass density profiles of the lipid systems with and without polyA/polyU. Although it can be stated from these profiles that addition of the polynucleotides changes the shapes of the curves around the lipid head groups, looking at simulation snapshots and partial mass density profiles are required to discuss the locations of polyA and polyU respective to the membrane lipids in detail.
Snapshots are taken at selected time-points, but they provide some insight into the conformation and distribution of components in the system. Fig. S40–S43† shows that both polyU and polyA tend to place themselves close to the surface of the membrane in all conditions. Generally in the 5% MC3 systems, the NAs do not appear to be tightly bound to the lipid layer. For the systems with 5% ionised MC3, both NAs tend to colocalise with the MC3 lipids. For the 5% neutral MC3, this colocalisation is less apparent, although the difference is not overly visible due to the low number of MC3 lipids at this composition. Bigger differences can be observed in the systems with 15% MC3. In the systems with the neutral form of this lipid, polyA appears preferentially to associate with clusters of ionisable lipid where it is in contact with the lipid layer, but is not tightly bound. In the case of polyU, more of the neutral MC3 appears closer to the centre of the layer and the polyU molecules are barely in contact with the layer. In simulations with ionised MC3, however, both NAs seem to have a much stronger interaction with the lipid layer, with much more contact between polyU and the lipid layer and polyA stretched and flattened along the layer. A similar trend can be observed in the ionised system where polyA “collects” all of the MC3 lipids at the membrane surface, whereas in the system with polyU bigger quantities of ionisable lipids can be observed below the surface.
Although looking at snapshots can provide some information about the appearance of various conformations, the NA behavior in time can only be fully understood by computing dihedrals over various time intervals. There are many different dihedrals in NAs. Since the NA backbone is responsible for the secondary structure dihedrals were selected of the backbone. Distributions for four of them (α, δ, γ and χ) were chosen for analysis and computed by BARNABA software.79
Fig. S44–S59 in the ESI† show the dihedrals themselves as well as their average difference computed at different time points. In general, it can be observed (for 3 out of 4 dihedrals) that there are fewer conformational changes for polyA regardless of the system, indicating that it is more rigid. Out of presented data it can also be concluded that pH and amount of MC3 can affect the conformational distribution of NAs and their stability. For instance, in simulations with 15% MC3 the dihedrals vary over bigger degree intervals than in systems with 5% of the ionisable lipid. Fewer variations in conformation can be seen in systems with protonated DLin-MC3-DMA, likely due to a stronger association with the ionised lipid.
This brings into question how their possible molecular conformations are affected by the lipid interaction. It can be already seen that polyA is tending towards double stranded structures in simulations with protonated MC3. However, during the nanosecond simulation time, it was not possible to observe formation of “perfect” double stranded structures. Additionally, in the simulations with ionised MC3 it could be seen that polyA tended to build dimers (longer chains) while polyU seemed to exist as single stranded, disordered structures. In available experimental data,59 where the structure of polyA was well-characterised, in order to be able to solve the crystal structure of polyA, a polyA-binding protein was necessary to reduce the rate of association of RNA strands and demonstrated a continuous helix of polyA. Although we have a slightly different environment (i.e. no binding protein, added lipids), we can compare our findings to the observed features in this experiment. Fig. 9a shows the experimentally determined structure. This can be compared to observed simulation structures in (b) and (c) one can see structures formed by polyA in simulated systems with 15 % MC3. On the panel (b) with the neutral DLin-MC3-DMA it can be observed that polyA has some disordered single stranded structures (like rings) even after 400 ns equilibration time. In systems with protonated MC3, shown on the panel (c), polyA has formed elongated chains which are similar to the ones observed in the double stranded structures observed experimentally,59 but in simulations the time scale might not be long enough to see this and the interaction with the lipid layer might prevent formation of the perfect double stranded long chains. Nevertheless, the fact that the chain growth can be seen from single-stranded conformations confirms the fact that in the acidic environment polyA tended to build longer chains, which was the first step observed in the formation of the double stranded structures.59
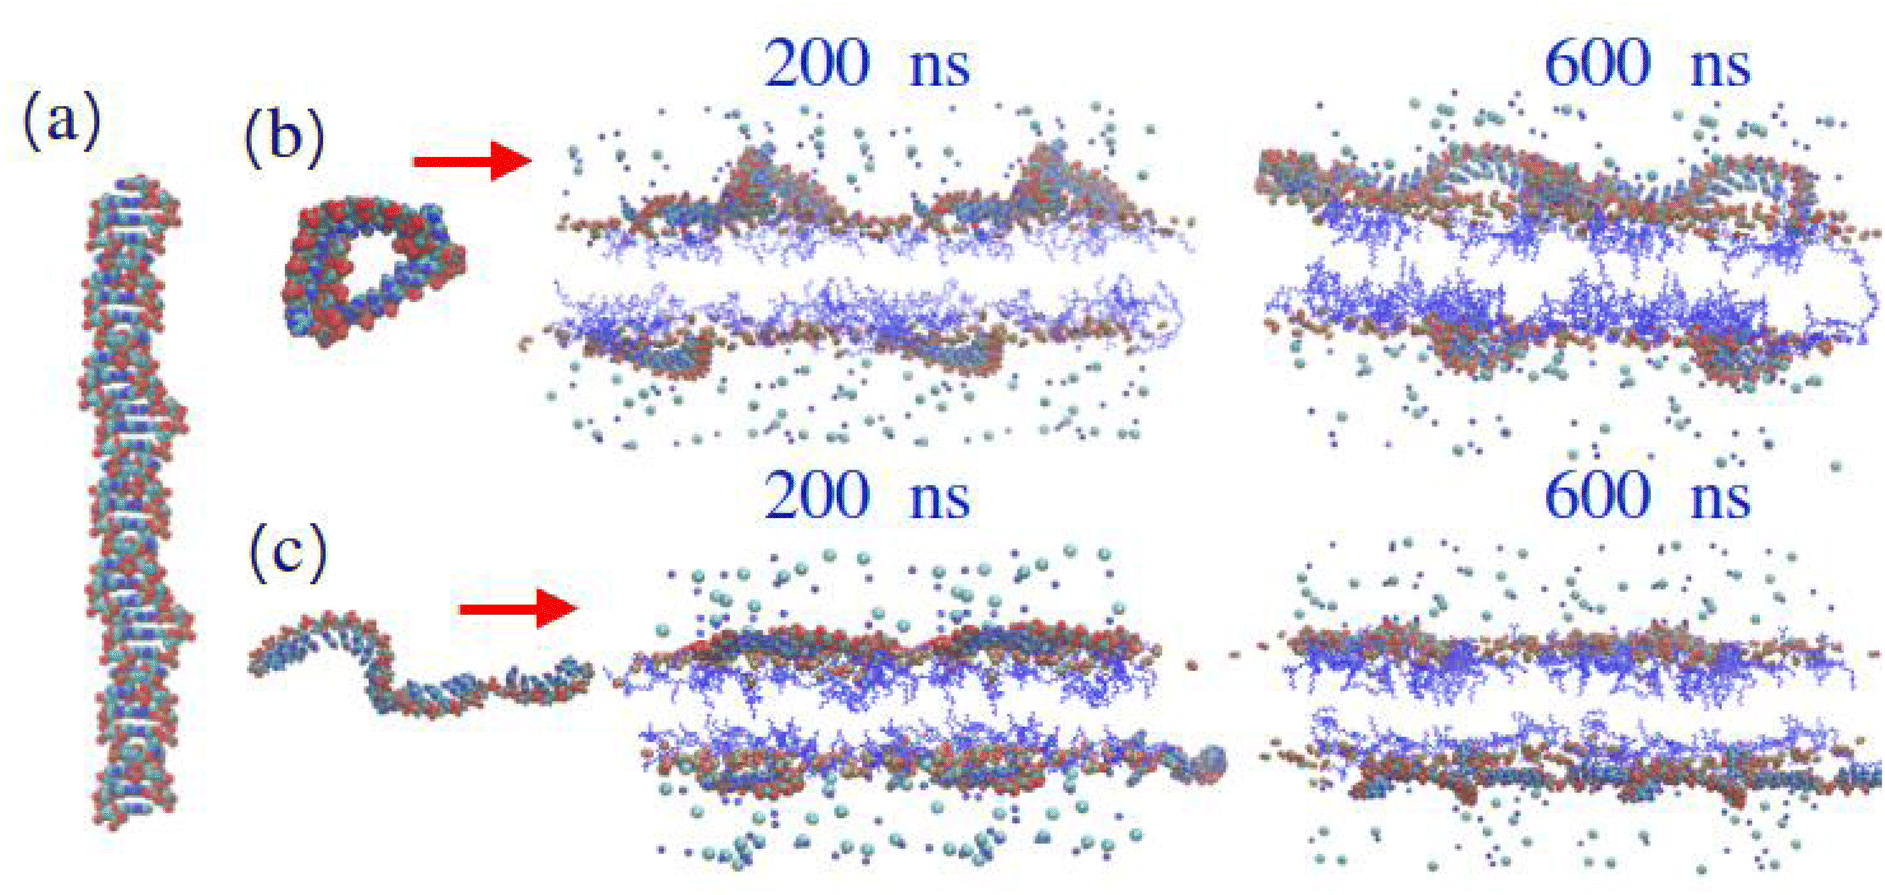 | ||
| Fig. 9 Structures of polyA. (a) Structure visualized from the papers by N. Safaee et al.59 (b) A sample structure observed in simulation with 15% of neutral DLin-MC3-DMA at 600 ns and snapshots of a bilayer with 15% of neutral DLin-MC3-DMA and polyA at 200 and 600 ns. (c) A sample structure observed in simulation with 15% of ionized DLin-MC3-DMA at 600 ns and snapshots of a bilayer with 15% of ionized DLin-MC3-DMA and polyA at 200 and 600 ns. Water and DOPC lipids were omitted for clarity. Visualization: blue lines – DLin-MC3-DMA, big and fat molecules on top are polyA, light blue and cyan balls are ions of salt. | ||
The behaviour observed qualitatively in the snapshots, can be discussed more quantitatively by looking at partial mass density profiles for both lipids and the NAs. Fig. S60† shows partial mass-density profiles for the systems with 5% MC3. Both polynucleotides preferred to locate at the membrane surface according to the distance from the bilayer center to the points of maximums on profiles. Differences between ionised and neutral simulations were rather insignificant here.
Fig. S61† shows the partial mass density profiles for simulations with 15% MC3. In all systems containing 15% MC3, the peaks of the NA profile are closer to the bilayer centre. In the systems with neutral MC3, the NA peak for both polyA and polyU is broader and has a tail on the side of the peak away from the lipid layer, with a much wider, flatter profile for polyU compared to polyA. For the ionised MC3 systems, for both NAs, the NA peak is narrower and has a larger area of intersection with the curves for the MC3 head group and double bond regions. As expected the areas of intersection with the DOPC NCH3 and PO4 groups also increase, as the mass density profiles describe the proximity of the different groups in the z-direction only. In order to understand which lipids the NAs colocalise with, it is necessary to examine partial radial distribution functions (RDFs) of the components, as these also take into consideration the x and y direction.
Fig. S62–S73 in the ESI† show radial distribution functions between the centres of mass of selected groups in the lipids and parts of the NAs averaged over the last 200 ns of the simulation. From the analysis of all the presented figures it can be concluded that the strongest associations were observed between the centres of mass of the residues of the NAs and the head groups of MC3 at all concentrations and in both protonation states (Fig. S62–S65†). This can be correlated with the locations of the NAs in the systems since strong associations with MC3 are related to the positions of its head groups. Most of the RDFs for the DOPC phosphatic (Fig. S66–S69†) and carboxylic groups (Fig. S70–S73†) show a steady increase from around 6 Å to a plateau, as opposed to the peaks observed in the RDFs with the MC3 head groups (Fig. S62–S65†), indicating that the NAs do not specifically associate with these parts of the DOPC lipids. Some peaks were observed in the RDFs for the phosphatic groups of DOPC, but in smaller amounts and mainly for polyU and less for polyA.
Additional understanding of the interactions in the systems can be provided by looking at the occurrence of hydrogen bonds between different components in combination with the RDFs. Table S18 in the ESI† shows the number of hydrogen bonds between various components in the systems. In systems with 5% MC3 higher numbers of hydrogen bonds between DOPC and water were detected than in simulations with 15% of the ionisable lipid. A smaller number of hydrogen bonds between DOPC and water were observed in the 15% MC3 systems compared to the 5% MC3 systems, with a larger decrease observed after the addition of polyA than polyU. This indicates a stronger dehydrating effect of polyA on the DOPC head groups. Out of data presented in the table, unsurprisingly there were more hydrogen bonds occurring between DOPC and ionised MC3 in simulations with 15% MC3 compared to those with 5% MC3, which did not significantly change with the addition of NA. Along the same line, MC3 formed more hydrogen bonds with water in simulations with 15% ionised MC3 than 5% but was again not affected by the addition of NA. Regarding the hydrogen bonds between NAs and water it can be noted that polyA in general has significantly more hydrogen bonds with water than polyU irrespective the protonation state of MC3. Nevertheless, comparing only systems with polyA or simulations with polyU, the lower amount of hydrogen bonds between DOPC and water cannot only be caused entirely by the presence of NA. As demonstrated in previous work,43 negligible amounts of water could also penetrate the membrane with DOPC which contained more of MC3 due to the disruption of hydrogen-bonding network at the membrane surface. Therefore, insignificantly increased membrane water-permeability could be a reason why the number of hydrogen bonds between DOPC and water was affected in investigated systems.
At 15% protonated MC3, polyA has more hydrogen bonds with the ionised lipid than polyU, but given the low number of hydrogen bonds observed between the MC3 and NAs and typical MC3 head-residue distance (>4 Å) in the radial distribution functions, it can be concluded that interactions between MC3 and the NAs are not mainly related to hydrogen bonds. It is more likely, as suggested earlier, that the MC3–NA interactions are instead mediated by a combination of electrostatic (e.g. water/salt bridges) and hydrophobic interactions. These hydrophobic interactions would become more dominant as the pH increases, leading to a lower proportion of protonated MC3 and different position of the NA within the layer. In the QCM-D data, at a pH far above the pKa of MC3, where it can be assumed that all MC3 is in its neutral form, no further absorption was observed with polyA. Under these conditions the electrostatic interactions might not be strong enough to bring the NA in close proximity for there to be a sufficiently strong hydrophobic interaction between the MC3 tail and the RNA nucleobase.
In the experimental conditions investigated here, the pHs are relatively close to the apparent pKa of MC3, therefore it is very likely that by changing the pH in the experiments the relative proportions of charged and neutral MC3 change but neither population goes to zero. In the simulated systems, however, the extreme cases of pH are explored for the MC3 lipid (i.e. fully ionised or fully neutral). For the neutral case, it was previously shown that neutral MC3 had a higher affinity to a DOPC layer when there was already some neutral MC3 present in the centre.63 Due to differences in time-scales between molecular dynamics simulations and the actual process of the lipid penetration through a membrane, it would therefore be expected that the accumulation process of the lipid in the membrane centre goes slowly and further aggregation of the neutral MC3 in the layer centre could have been observed with dramatically longer simulation time. Here we can also add that since MD has shorter time-scale, free-energy calculations show more accurate results of a possibility of a spontaneous penetration process.63
A further consideration, which is rarely included in lipid MD simulations and was briefly mentioned earlier, is the possible effect of a surface on the system. Adding (different kinds of) solid supports has been shown to affect the behaviour of the lipid membrane, including leaflet decoupling, changes in diffusion coefficients and phase transition temperatures, in addition to the clear limitation of curvature in the z direction.80–83 This is especially a consideration in systems where increased permeability could be observed, such as penetration of mRNA through the layer as has been shown in the multilayer structures formed here. Especially in the case of the ionised MC3 containing layers, the slightly negatively charged silicon and glass surfaces used in the experimental work are likely to interact strongly with the charged lipid, and therefore have an effect on the observed structure, such as strongly limiting or preventing curvature seen in simulation snapshots with 15% ionised MC3.
4. Conclusions
In this work, we have investigated the effect of pH on the adsorption behaviour of different (model) mRNAs in a model system of varying DOPC and MC3 compositions. This study has highlighted that even with low amounts of MC3 in the lipid layer, the adsorption behaviour of different NAs and the dynamics and viscoelasticity of the lipid layer change significantly. The change in the structure of the system from a bilayer-like structure to increased clustering of MC3 closer to the centre of the layer was observed when changing the pH from pH 6 to 7. This clustering observed with higher amounts of MC3 in the layer seemed to decrease the viscoelasticity of the layer, therefore indicating decreased disruption of the bilayer structure, and could be important in NA binding.A clear difference between the adsorption behaviour of the NAs with pH and amount of MC3 was demonstrated, which could be related to both the primary and secondary structure of the NAs. The effect of the primary structure was investigated using MD simulations, in which a stronger interaction between polyA and the surface of the layer was observed, resulting in a more tightly bound/condensed structure at the surface and dehydration of the DOPC at the surface of the layer. In comparison, polyU had a weaker interaction, especially with the neutral form of MC3, and was less tightly bound to the layer. The effect of the secondary structure contributions could be observed in the polyA binding to the surface layer at pH 6, where it is in its double stranded structure, rather than penetrating into the lipid layer and/or causing arrangement into the multilayer structure seen with other NAs and in the other conditions, where polyA would be dominated by its single stranded form. This effect of structure on interactions is important to consider in investigations where polyA is used as a model for mRNA. It has previously been used due to its similar biophysical properties, but this structural transition can cause complications if used to formulate LNPs, as polyA becomes gel-like in appearance below pH 3.5 (i.e. conditions which are commonly used to prepare LNPs).84 As a result, modifications to the standard formulations conditions are often required.
In summary, the present study highlighted the influence of the MC3 content on the structure of a lipid bilayer, even at very low proportions. The simulation data shows the importance of hydrophobic interactions between the nucleic acids and the lipids, in addition to the electrostatic component, which is often neglected in the discussion surrounding LNP formation. This is verified experimentally in follow up work,85 where we have observed a decrease in the stability of LNPs with nucleic acid cargos with lower base pairing, which relates to the penetration of the nucleic acid into the lipid layer observed here. When developing a certain formulation it is therefore important to consider the secondary structure of mRNA and it is clear that furthering our mechanistic understanding of the interactions between the different NAs and MC3 with pH will allow us to predict and optimise the changes in the core of LNPs with pH. This will allow us to obtain more stable formulations that at the same time facilitate cellular uptake.
Author contributions
T.N., J.G., I.E. and J.S. conceptualised the work and T.N. and J.S. secured funding. QCM-D data was measured and analysed by J.G., TIRF data was measured and analysed by M.F. and the simulations were performed and analysed by I.E. The samples for the POLREF beamtime were prepared by J.G. and M.S., the data was collected by M.S. and the data analysis was performed by J.G. and M.S. The samples for the D17 beamtime were prepared by J.G., the data was collected by J.G. and G.F and the data analysis was performed by J.G. with input from M.S. The manuscript was written by J.G., I.E. and M.F. with review and feedback provided by all the authors.Conflicts of interest
There are no conflicts to declare.Acknowledgements
We are grateful to the ILL and ISIS for allocating beamtime on D17 (https://doi.ill.fr/10.5291/ILL-DATA.8-02-892) and POLREF (https://doi.org/10.5286/ISIS.E.RB2010562) respectively and Dr Sophie Ayscough for the useful discussions and support. We would like to thank the Swedish Research Council (Vetenskapsrådet) for grants 2017-06716 and 2019-04020. The computations were performed on resources provided by the Swedish National Infrastructure for Computing (SNIC). In National Supercomputer Center (NSC) Tetralith cluster was employed for calculations through projects SNIC2021/5-470, SNIC2019/3-553 and SNIC2019/7-36 and SNIC2022/5-511. In High Performance Computing Center North (HPC2N) Kebnekaise cluster was used for simulations with the project numbers SNIC2019/5-74, SNIC2020/5-45, SNIC2020/10-22, SNIC2020/6-53, SNIC2022/5-86, SNIC2022/5-43, SNIC2022/22-539, SNIC2022/22-1019. At PDC Center for High Performance Computing we would like to thank for letting us use cluster Dardel with the project SNIC2022/22-1030.References
- L. R. Baden, H. M. El Sahly, B. Essink, K. Kotloff, S. Frey, R. Novak, D. Diemert, S. A. Spector, N. Rouphael, C. B. Creech, J. McGettigan, S. Khetan, N. Segall, J. Solis, A. Brosz, C. Fierro, H. Schwartz, K. Neuzil, L. Corey, P. Gilbert, H. Janes, D. Follmann, M. Marovich, J. Mascola, L. Polakowski, J. Ledgerwood, B. S. Graham, H. Bennett, R. Pajon, C. Knightly, B. Leav, W. Deng, H. Zhou, S. Han, M. Ivarsson, J. Miller and T. Zaks, N. Engl. J. Med., 2021, 384, 403–416 CrossRef CAS PubMed.
- F. P. Polack, S. J. Thomas, N. Kitchin, J. Absalon, A. Gurtman, S. Lockhart, J. L. Perez, G. Pérez Marc, E. D. Moreira, C. Zerbini, R. Bailey, K. A. Swanson, S. Roychoudhury, K. Koury, P. Li, W. V. Kalina, D. Cooper, R. W. Frenck, L. L. Hammitt, O. Türeci, H. Nell, A. Schaefer, S. Ünal, D. B. Tresnan, S. Mather, P. R. Dormitzer, U. Şahin, K. U. Jansen and W. C. Gruber, N. Engl. J. Med., 2020, 383, 2603–2615 CrossRef CAS PubMed.
- B. N. Aldosari, I. M. Alfagih and A. S. Almurshedi, Pharmaceutics, 2021, 13, 206 CrossRef CAS PubMed.
- E. Samaridou, J. Heyes and P. Lutwyche, Adv. Drug Delivery Rev., 2020, 154–155, 37–63 CrossRef CAS PubMed.
- X. Hou, T. Zaks, R. Langer and Y. Dong, Nat. Rev. Mater., 2021, 6, 1078–1094 CrossRef CAS PubMed.
- Nat. Rev. Mater., 2021, 6, 1071–1094, DOI:10.1038/s41578-021-00398-6.
- S. C. Semple, S. K. Klimuk, T. O. Harasym, N. Dos Santos, S. M. Ansell, K. F. Wong, N. Maurer, H. Stark, P. R. Cullis, M. J. Hope and P. Scherrer, Biochim. Biophys. Acta, Biomembr., 2001, 1510, 152–166 CrossRef CAS PubMed.
- K. A. Hajj and K. A. Whitehead, Nat. Rev. Mater., 2017, 2, 17056 CrossRef CAS.
- J. Heyes, L. Palmer, K. Bremner and I. MacLachlan, J. Controlled Release, 2005, 107, 276–287 CrossRef CAS PubMed.
- S. C. Semple, A. Akinc, J. Chen, A. P. Sandhu, B. L. Mui, C. K. Cho, D. W. Y. Sah, D. Stebbing, E. J. Crosley, E. Yaworski, I. M. Hafez, J. R. Dorkin, J. Qin, K. Lam, K. G. Rajeev, K. F. Wong, L. B. Jeffs, L. Nechev, M. L. Eisenhardt, M. Jayaraman, M. Kazem, M. A. Maier, M. Srinivasulu, M. J. Weinstein, Q. Chen, R. Alvarez, S. A. Barros, S. De, S. K. Klimuk, T. Borland, V. Kosovrasti, W. L. Cantley, Y. K. Tam, M. Manoharan, M. A. Ciufolini, M. A. Tracy, A. de Fougerolles, I. MacLachlan, P. R. Cullis, T. D. Madden and M. J. Hope, Nat. Biotechnol., 2010, 28, 172–176 CrossRef CAS PubMed.
- A. Akinc, A. Zumbuehl, M. Goldberg, E. S. Leshchiner, V. Busini, N. Hossain, S. A. Bacallado, D. N. Nguyen, J. Fuller, R. Alvarez, A. Borodovsky, T. Borland, R. Constien, A. de Fougerolles, J. R. Dorkin, K. N. Jayaprakash, M. Jayaraman, M. John, V. Koteliansky, M. Manoharan, L. Nechev, J. Qin, T. Racie, D. Raitcheva, K. G. Rajeev, D. W. Y. Sah, J. Soutschek, I. Toudjarska, H.-P. Vornlocher, T. S. Zimmermann, R. Langer and D. G. Anderson, Nat. Biotechnol., 2008, 26, 561–569 CrossRef CAS PubMed.
- K. A. Whitehead, J. R. Dorkin, A. J. Vegas, P. H. Chang, O. Veiseh, J. Matthews, O. S. Fenton, Y. Zhang, K. T. Olejnik, V. Yesilyurt, D. Chen, S. Barros, B. Klebanov, T. Novobrantseva, R. Langer and D. G. Anderson, Nat. Commun., 2014, 5, 4277 CrossRef CAS PubMed.
- K. T. Love, K. P. Mahon, C. G. Levins, K. A. Whitehead, W. Querbes, J. R. Dorkin, J. Qin, W. Cantley, L. L. Qin, T. Racie, M. Frank-Kamenetsky, K. N. Yip, R. Alvarez, D. W. Sah, A. D. Fougerolles, K. Fitzgerald, V. Koteliansky, A. Akinc, R. Langer and D. G. Anderson, Proc. Natl. Acad. Sci. U. S. A., 2010, 107, 1864–1869 CrossRef CAS PubMed.
- M. A. Maier, M. Jayaraman, S. Matsuda, J. Liu, S. Barros, W. Querbes, Y. K. Tam, S. M. Ansell, V. Kumar, J. Qin, X. Zhang, Q. Wang, S. Panesar, R. Hutabarat, M. Carioto, J. Hettinger, P. Kandasamy, D. Butler, K. G. Rajeev, B. Pang, K. Charisse, K. Fitzgerald, B. L. Mui, X. Du, P. Cullis, T. D. Madden, M. J. Hope, M. Manoharan and A. Akinc, Mol. Ther., 2013, 21, 1570–1578 CrossRef CAS PubMed.
- K. P. Mahon, K. T. Love, K. A. Whitehead, J. Qin, A. Akinc, E. Leshchiner, I. Leshchiner, R. Langer and D. G. Anderson, Bioconjugate Chem., 2010, 21, 1448–1454 CrossRef CAS PubMed.
- L. Miao, L. Li, Y. Huang, D. Delcassian, J. Chahal, J. Han, Y. Shi, K. Sadtler, W. Gao, J. Lin, J. C. Doloff, R. Langer and D. G. Anderson, Nat. Biotechnol., 2019, 37, 1174–1185 CrossRef CAS PubMed.
- S. Sabnis, E. S. Kumarasinghe, T. Salerno, C. Mihai, T. Ketova, J. J. Senn, A. Lynn, A. Bulychev, I. McFadyen, J. Chan, Ö. Almarsson, M. G. Stanton and K. E. Benenato, Mol. Ther., 2018, 26, 1509–1519 CrossRef CAS PubMed.
- F. Ferraresso, A. W. Strilchuk, L. J. Juang, L. G. Poole, J. P. Luyendyk and C. J. Kastrup, Mol. Pharm., 2022, 19, 2175–2182 CrossRef CAS PubMed.
- C. B. Roces, G. Lou, N. Jain, S. Abraham, A. Thomas, G. W. Halbert and Y. Perrie, Pharmaceutics, 2020, 12, 1095 CrossRef CAS PubMed.
- J. Viger-Gravel, A. Schantz, A. C. Pinon, A. J. Rossini, S. Schantz and L. Emsley, J. Phys. Chem. B, 2018, 122, 2073–2081 CrossRef CAS PubMed.
- M. I. Henderson, Y. Eygeris, A. Jozic, M. Herrera and G. Sahay, Mol. Pharm., 2022, 19, 4275–4285 CrossRef CAS PubMed.
- M. Y. Arteta, T. Kjellman, S. Bartesaghi, S. Wallin, X. Wu, A. J. Kvist, A. Dabkowska, N. Székely, A. Radulescu, J. Bergenholtz and L. Lindfors, Proc. Natl. Acad. Sci. U. S. A., 2018, 115, E3351–E3360 CAS.
- J. A. Kulkarni, D. Witzigmann, J. Leung, Y. Y. C. Tam and P. R. Cullis, Nanoscale, 2019, 11, 21733–21739 RSC.
- M. L. Brader, S. J. Williams, J. M. Banks, W. H. Hui, Z. H. Zhou and L. Jin, Biophys. J., 2021, 120, 2766–2770 CrossRef CAS PubMed.
- A. K. K. Leung, I. M. Hafez, S. Baoukina, N. M. Belliveau, I. V. Zhigaltsev, E. Afshinmanesh, D. P. Tieleman, C. L. Hansen, M. J. Hope and P. R. Cullis, J. Phys. Chem. C, 2012, 116, 18440–18450 CrossRef CAS PubMed.
- A. K. K. Leung, Y. Y. C. Tam, S. Chen, I. M. Hafez and P. R. Cullis, J. Phys. Chem. B, 2015, 119, 8698–8706 CrossRef CAS PubMed.
- K. An, D. Kurek, M. Mahadeo, Y. Zhang, J. L. Thewalt, P. R. Cullis and J. A. Kulkarni, Langmuir, 2022, 38, 14036–14043 CrossRef CAS PubMed.
- L. Cui, S. Pereira, S. Sonzini, S. van Pelt, S. M. Romanelli, L. Liang, D. Ulkoski, V. R. Krishnamurthy, E. Brannigan, C. Brankin and A. S. Desai, Nanoscale, 2022, 14, 1480–1491 RSC.
- W. Wang, S. Feng, Z. Ye, H. Gao, J. Lin and D. Ouyang, Acta Pharm. Sin. B, 2022, 12, 2950–2962 CrossRef CAS PubMed.
- A. I. Järvelin, M. Noerenberg, I. Davis and A. Castello, Cell Commun. Signaling, 2016, 14, 9 CrossRef PubMed.
- B. D. Burgute, V. S. Peche, A.-L. Steckelberg, G. Glöckner, B. Gaßen, N. H. Gehring and A. A. Noegel, Nucleic Acids Res., 2014, 42, 3177–3193 CrossRef CAS PubMed.
- T. A. de Souza, A. S. Soprano, N. P. Vieira de Lira, A. J. C. Quaresma, B. A. Pauletti, A. F. P. Leme and C. E. Benedetti, PLoS One, 2012, 7, 1–13 Search PubMed.
- S. Li, Y. Hu, A. Li, J. Lin, K. Hsieh, Z. Schneiderman, P. Zhang, Y. Zhu, C. Qiu, E. Kokkoli, T.-H. Wang and H.-Q. Mao, Nat. Commun., 2022, 13, 5561 CrossRef CAS PubMed.
- A. P. Dabkowska, C. S. Niman, G. Piret, H. Persson, H. P. Wacklin, H. Linke, C. N. Prinz and T. Nylander, Nano Lett., 2014, 14, 4286–4292 CrossRef CAS PubMed.
- G. Sauerbrey, Z. Phys., 1959, 155, 206–222 CrossRef CAS.
- O. Arnold, J. C. Bilheux, J. M. Borreguero, A. Buts, S. I. Campbell, L. Chapon, M. Doucet, N. Draper, R. Ferraz Leal, M. A. Gigg, V. E. Lynch, A. Markvardsen, D. J. Mikkelson, R. L. Mikkelson, R. Miller, K. Palmen, P. Parker, G. Passos, T. G. Perring, P. F. Peterson, S. Ren, M. A. Reuter, A. T. Savici, J. W. Taylor, R. J. Taylor, R. Tolchenov, W. Zhou and J. Zikovsky, Nucl. Instrum. Methods Phys. Res., Sect. A, 2014, 764, 156–166 CrossRef CAS.
- D. Richard, M. Ferrand and G. J. Kearley, J. Neutron Res., 1996, 4, 33–39 CrossRef.
- A. R. J. Nelson and S. W. Prescott, J. Appl. Crystallogr., 2019, 52, 193–200 CrossRef CAS PubMed.
- A. R. McCluskey, A. J. Caruana, C. J. Kinane, A. J. Armstrong, T. Arnold, J. F. K. Cooper, D. L. Cortie, A. V. Hughes, J.-F. Moulin, A. R. J. Nelson, W. Potrzebowski and V. Starostin, J. Appl. Crystallogr., 2023, 56, 12–17 CrossRef CAS PubMed.
- K. Makasewicz, S. Wennmalm, B. Stenqvist, M. Fornasier, A. Andersson, P. Jönsson, S. Linse and E. Sparr, ACS Chem. Neurosci., 2021, 12, 2099–2109 CrossRef CAS PubMed.
- P. Jönsson, M. P. Jonsson, J. O. Tegenfeldt and F. Höök, Biophys. J., 2008, 95, 5334–5348 CrossRef PubMed.
- A. Edelstein, N. Amodaj, K. Hoover, R. Vale and N. Stuurman, Curr. Protoc. Mol. Biol., 2010, 92, 14.20.1–14.20.17 Search PubMed.
- I. Ermilova and J. Swenson, Phys. Chem. Chem. Phys., 2020, 22, 28256–28268 RSC.
- M. Ibrahim, J. Gilbert, M. Heinz, T. Nylander and N. Schwierz, Nanoscale, 2023, 15, 11647–11656 RSC.
- A. D. Becke, J. Chem. Phys., 1993, 98, 5648–5652 CrossRef CAS.
- R. A. Kendall, T. H. Dunning Jr. and R. J. Harrison, J. Chem. Phys., 1992, 96, 6796–6806 CrossRef CAS.
- W. D. Cornell, P. Cieplak, C. I. Bayly and P. A. Kollman, J. Am. Chem. Soc., 2002, 115, 9620–9631 CrossRef.
- J. Tomasi, B. Mennucci and E. Cancès, J. Mol. Struct.: THEOCHEM, 1999, 464, 211–226 CrossRef CAS.
- W. L. Jorgensen and C. Jenson, J. Comput. Chem., 1998, 19, 1179–1186 CrossRef CAS.
- R. Y. Patel and P. V. Balaji, J. Phys. Chem. B, 2005, 109, 14667–14674 CrossRef CAS PubMed.
- C. Anezo, A. H. de Vries, H.-D. Höltje, D. P. Tieleman and S.-J. Marrink, J. Phys. Chem. B, 2003, 107, 9424–9433 CrossRef CAS.
- G. Bussi, D. Donadio and M. Parrinello, J. Chem. Phys., 2007, 126, 014101 CrossRef PubMed.
- W. F. Van Gunsteren and H. J. Berendsen, Mol. Simul., 1988, 1, 173–185 CrossRef.
- S. Páll and B. Hess, Comput. Phys. Commun., 2013, 184, 2641–2650 CrossRef.
- B. Hess, H. Bekker, H. J. Berendsen and J. G. Fraaije, J. Comput. Chem., 1997, 18, 1463–1472 CrossRef CAS.
- B. Hess, J. Chem. Theory Comput., 2008, 4, 116–122 CrossRef CAS PubMed.
- C. Kutzner, S. Páll, M. Fechner, A. Esztermann, B. L. de Groot and H. Grubmüller, J. Comput. Chem., 2019, 40, 2418–2431 CrossRef CAS PubMed.
- B. Hess, C. Kutzner, D. Van Der Spoel and E. Lindahl, J. Chem. Theory Comput., 2008, 4, 435–447 CrossRef CAS PubMed.
- N. Safaee, A. M. Noronha, D. Rodionov, G. Kozlov, C. J. Wilds, G. M. Sheldrick and K. Gehring, Angew. Chem., Int. Ed., 2013, 52, 10370–10373 CrossRef CAS PubMed.
- W.-F. Chen, S. Rety, H.-L. Guo, Y.-X. Dai, W.-Q. Wu, N.-N. Liu, D. Auguin, Q.-W. Liu, X.-M. Hou and S.-X. Dou, et al. , Structure, 2018, 26, 403–415 CrossRef CAS PubMed.
- C. A. Keller and B. Kasemo, Biophys. J., 1998, 75, 1397–1402 CrossRef CAS PubMed.
- R. P. Richter, R. Bérat and A. R. Brisson, Langmuir, 2006, 22, 3497–3505 CrossRef CAS PubMed.
- I. Ermilova and J. Swenson, Chem. Phys. Lipids, 2023, 253, 105294 CrossRef CAS PubMed.
- S. Tristram-Nagle, H. I. Petrache and J. F. Nagle, Biophys. J., 1998, 75, 917–925 CrossRef CAS PubMed.
- J. F. Nagle and M. C. Wiener, Biochim. Biophys. Acta, Biomembr., 1988, 942, 1–10 CrossRef CAS PubMed.
- M. Jayaraman, S. M. Ansell, B. L. Mui, Y. K. Tam, J. Chen, X. Du, D. Butler, L. Eltepu, S. Matsuda, J. K. Narayanannair, K. G. Rajeev, I. M. Hafez, A. Akinc, M. A. Maier, M. A. Tracy, P. R. Cullis, T. D. Madden, M. Manoharan and M. J. Hope, Angew. Chem., Int. Ed., 2012, 51, 8529–8533 CrossRef CAS PubMed.
- M. J. Carrasco, S. Alishetty, M.-G. Alameh, H. Said, L. Wright, M. Paige, O. Soliman, D. Weissman, T. E. Cleveland, A. Grishaev and M. D. Buschmann, Commun. Biol., 2021, 4, 956 CrossRef CAS PubMed.
- M. I. Zarudnaya, I. M. Kolomiets, A. L. Potyahaylo and D. M. Hovorun, J. Biomol. Struct. Dyn., 2019, 37, 2837–2866 CrossRef CAS PubMed.
- M. Zarudnaya, Mol. Biol., 1998, 32, 417–422 CAS.
- M. Zarudnaya and N. Zheltovskii, Mol. Biol., 1995, 29, 611–615 CrossRef PubMed.
- J. C. Thrierr, M. Dourlent and M. Leng, J. Mol. Biol., 1971, 58, 815–830 CrossRef CAS PubMed.
- P. C. Bevilacqua, L. E. Ritchey, Z. Su and S. M. Assmann, Annu. Rev. Genet., 2016, 50, 235–266 CrossRef CAS PubMed.
- M. Egli, A. Flavell, A. M. Pyle, W. D. Wilson, S. I. Haq, B. Luisi, J. Fisher, C. Laughton, S. Allen, J. Engels, G. M. Blackburn, M. J. Gait, D. Loakes and D. M. Williams, Nucleic Acids in Chemistry and Biology, The Royal Society of Chemistry, 2006, pp. i–470 Search PubMed.
- A. Michanek, M. Björklund, T. Nylander and E. Sparr, Soft Matter, 2012, 8, 10428–10438 RSC.
- A. Michanek, N. Kristen, F. Höök, T. Nylander and E. Sparr, Biochim. Biophys. Acta, Biomembr., 2010, 1798, 829–838 CrossRef CAS PubMed.
- R. Marty, C. N. N′soukpoé-Kossi, D. M. Charbonneau, L. Kreplak and H.-A. Tajmir-Riahi, Nucleic Acids Res., 2009, 37, 5197–5207 CrossRef CAS PubMed.
- TriLink Biotechnologies, Product Insert: CleanCapTM Erythropoietin mRNA, [Online], https://www.trilinkbiotech.com/media/folio3/productattachments/productinsert/L7209_Insert.pdf.
- Sigma Aldrich, Product Infomation: Polyuridylic acid potassium salt, [Online], https://www.sigmaaldrich.com/deepweb/assets/sigmaaldrich/product/documents/181/457/p9528pis.pdf.
- S. Bottaro, G. Bussi, G. Pinamonti, S. Reißer, W. Boomsma and K. Lindorff-Larsen, Rna, 2019, 25, 219–231 CrossRef CAS PubMed.
- L. A. Clifton, N. Paracini, A. V. Hughes, J. H. Lakey, N.-J. Steinke, J. F. K. Cooper, M. Gavutis and M. W. A. Skoda, Langmuir, 2019, 35, 13735–13744 CrossRef CAS PubMed.
- C. Scomparin, S. Lecuyer, M. Ferreira, T. Charitat and B. Tinland, Eur. Phys. J. E: Soft Matter Biol. Phys., 2009, 28, 211–220 CrossRef CAS PubMed.
- Z. V. Feng, T. A. Spurlin and A. A. Gewirth, Biophys. J., 2005, 88, 2154–2164 CrossRef CAS PubMed.
- R. Glazier and K. Salaita, Biochim. Biophys. Acta, Biomembr., 2017, 1859, 1465–1482 CrossRef CAS PubMed.
- A. G. Petrovic and P. L. Polavarapu, J. Phys. Chem. B, 2005, 109, 23698–23705 CrossRef CAS PubMed.
- J. Gilbert, Ph.D. thesis, Lund University, 2023.
Footnote |
| † Electronic supplementary information (ESI) available: Table of values used for SLD calculations; description of fitting method and models for NR data; partial charges for ionised DLin-MC3-DMA simulation model; change in frequency and dissipation for lipid layers alone and after addition of NAs using 7th overtone only; mass density profiles for the lipid layers alone and after addition of NAs, comparison of fits for different possible NR models for data for the lipid layers alone and after addition of NAs; simulation snapshots for lipid layers after addition of NAs; evolution of dihedrals for polyA and polyU over simulation time; partial mass density profiles for the lipid layers after addition of NAs; radial distribution functions for the lipid layers after addition of NAs; comparison of hydrogen bonds for the lipid layers alone and after addition of NAs. See DOI: https://doi.org/10.1039/d3nr03308b |
| This journal is © The Royal Society of Chemistry 2024 |