
 Open Access Article
 This Open Access Article is licensed under a Creative Commons Attribution-Non Commercial 3.0 Unported Licence
Beam-profile compensation for quantum yield characterisation of Yb–Tm codoped upconverting nanoparticles emitting at 474 nm, 650 nm and 804 nm†
J. S.
Matias
 *ab,
K.
Komolibus
a,
W. K.
Kiang
a,
S.
Konugolu-Venkata-Sekar
a and
S.
Andersson-Engels
ab
*ab,
K.
Komolibus
a,
W. K.
Kiang
a,
S.
Konugolu-Venkata-Sekar
a and
S.
Andersson-Engels
ab
aBiophotonics@Tyndall, IPIC, Tyndall National Institute, Cork, Ireland. E-mail: smatias.jean@gmail.com
bDepartment of Physics, University College Cork, Cork, Ireland
First published on 26th January 2024
Abstract
Upconverting nanoparticles (UCNPs) have found widespread applications in biophotonics and energy harvesting due to their unique non-linear optical properties arising from energy transfer upconversion (ETU) mechanisms. However, accurately characterising the power density-dependent efficiency of UCNPs using the internal quantum yield (iQY) is challenging due to the lack of methods that account for excitation beam-profile distortions. This limitation hinders the engineering of optimal UCNPs for diverse applications. To address this, this work present a novel beam profile compensation strategy based on a general analytical rate-equations model, enabling the evaluation of iQY for ETU processes of arbitrary order, such as ETU2, ETU3, and beyond. The method was applied to characterise the ETU2 and ETU3 processes corresponding to the main emission peaks (474 nm, 650 nm, and 804 nm) of a Yb–Tm codoped core–shell β-UCNP. Through this approach, the transition power density points (which delimit the distinct non-linear regimes of the upconversion luminescence (UCL)), and the saturation iQY values (which are reached at high excitation power densities above the transition points) were determined. The ETU2 process exhibits a single transition power density point, denoted as ρ2, while the ETU3 processes involve two transition points, ρ2 and ρ3. By compensating for the beam profile, we evaluate the iQY of individual lines across a wide dynamic range of excitation power densities (up to 105 W cm−2), encompassing both non-linear and linear regimes of UCL. This study introduces a valuable approach for accurately characterising the iQY of UCNPs, facilitating a deeper understanding of the upconversion and its performance. By addressing excitation beam-profile distortions, this method provides a comprehensive and reliable assessment of the power density-dependent iQY. The results highlight the applicability and effectiveness of this beam profile compensation strategy, which can be employed for a wide range of UCNPs. This advancement opens new avenues for the tailored design and application of UCNPs in various fields, especially for biophotonics.
1 Introduction
In the last decades, upconverting nanoparticles (UCNPs) have been extensively studied due to their unique ability to convert low-energy to high-energy light, an anti-Stokes process involving multi-photon absorption followed by the emission of a single photon with shorter wavelength.1–3 This unique property makes UCNPs interesting for several applications, from renewable energy to biophotonics. UCNPs have been successfully applied to light harvesting,4,5 photodynamic therapy (PDT),6 diffuse optical imaging,7 optogenetics,8,9 biosensors,10 and temperature sensing.11,12 The near-infrared (NIR) wavelength range, involved in the processes of absorption and/or emission, offers a substantial tissue penetration depth.13 Additionally, the long wavelength used to excite UCNPs does not induce cellular autofluorescence.3,14 Furthermore, photostability,15 chemical stability,16 lack of blinking phenomena, low cytotoxicity,17 and surface functionalisation18 are additional attributes that make UCNPs stand out among other fluorescent probes. Despite their potential, their internal quantum yield (iQY) – used as a figure of merit to characterise UCNPs, defined as the ratio of number of emitted photons to the number of absorbed ones19–21 – remains low, and its accurate evaluation can be challenging, especially at the low excitation power densities required for biological applications.The most efficient UCNPs contain a rare-earth element, known as the sensitiser, which absorbs the excitation photons and transfers the absorbed energy to another rare-earth element, known as the activator. After a series of energy transfers, the activator relaxes to the ground state by emitting upconverted light completing the process known as energy transfer upconversion (ETU). The order of the ETU process is determined by the number of absorbed photons involved in the upconversion (UC), and as a result, the upconversion luminescence (UCL) exhibits non-linear behaviour with respect to the excitation power density. Recently, this non-linearity caused by an avalanche effect present in certain UCNPs has led to breakthroughs in super-resolution microscopy. Researchers achieved approximately 70 nm imaging resolution and sub-Å localisation super-resolution enabling to distinguish single nanoparticles by utilising their giant non-linear response.22–24 However, the non-linearity of the UCL implies a power density dependence of the iQY of UCNPs, which requires its evaluation over a wide dynamic range of the excitation power density while accounting for the beam profile of the excitation beam. This is because minor variations in the beam can cause major emission changes as a response of their extreme non-linearity. Characterisation of iQY without beam-profile compensation can underestimate the value by up to 75% compared to compensated iQY characterisation.21 Moreover, different beam profiles with the same total power can lead to different UCL results, which makes it difficult to compare different measurements (especially those performed at different laboratories25,26), understand the underlying UC properties of the material, and consequently impedes precise engineering of optimal UCNPs.
An attempt to compensate for the iQY of an ETU2 process for the excitation beam profile was presented by May and Berry. The authors studied different approaches to defining the radius of a Gaussian profile of the excitation beam to calculate the area of its cross-section, and finally compute the excitation power density. They showed that defining the radius taken at 1.8 times the standard deviation of the cross-section, instead of the conventional full-width-at-half-maximum (FWHM), is a way to compensate the QY for an ETU2 process in its non-linear regime, where the power density dependence of the UCL is quadratic.26 However, the issue with this strategy is that the power density dependence of the UCL changes for different power density ranges, which are delimited by transition power density points.27 Moreover, UCNPs typically have multiple wavelength emission, typically involving ETU processes with different orders of power density dependence.28 For example, the UCL of an ETU3 process has a cubic behaviour at low power densities and becomes linear at high excitation, transiting to intermediate values within a power density range between transition power density points.27 Another approach for compensation is to measure the excitation beam profile and utilise a model that describes the behaviour of the UCL. This method was firstly reported for an ETU2 process by Mousavi et al., and further explored by Matias et al.21,29 Matias et al.'s study focused on a two-photon process to characterise the iQY of UCNPs over a wide dynamic range of the excitation power densities – 106 (from 0.003 W cm−2 to 1050 W cm−2).21 This strategy is advantageous as it considers the different regimes presented by an ETU process, including the transition power density ranges between them. To date, research on the beam-profile-compensation has primarily focused on ETU processes of second-order due to the lack of an analytical model capable of accurately describing higher-order ETU. However, a recent publication introduced a general analytical model for arbitrary-order ETU, providing a crucial step towards characterising and compensating iQY for these processes.27 This prior research laid essential groundwork for understanding the UCL for an arbitrary-order processes. The authors presented a model, which offered valuable insights into the QY assessment of UCNPs, including, for instance, the examination of UCNP emissions at two distinct wavelengths – 804 nm (corresponding to an ETU2) and 474 nm (an ETU3 process). While this study contributed significantly, it did not incorporate the crucial element of excitation beam profile compensation as its main focus was on understanding the UC process itself. Building upon these two prior works – the generalised model and the beam profile compensation approach for an ETU2 – here we introduce a novel general beam profile compensation method to encompass arbitrary-order processes.
This novel method extends the capability to characterise ETU processes of orders higher than two, significantly broadening the range of UCNPs amenable to this technique. Such an expansion is of paramount importance for the comprehensive evaluation of UCNPs in various biophotonic applications. For instance, the 804 nm emission, governed by an ETU2 process in the NIR range, plays a critical role in diverse imaging methodologies like widefield imaging and confocal microscopy. In contrast, third-order process, such as the 474 nm emission, and higher-order processes find application in optogenetics and PDT. These applications rely on the upconverted photon density, inherently influenced by excitation power density. Given the varying power density of light within living tissues, dependent on optical properties and depth, precise knowledge of the iQY nanoparticle and local excitation power densities is indispensable. This information proves invaluable in simulating specific configurations, including laser modulation for pulsed excitation and employment of spatial light modulators (SLMs) for wavefront shaping to optimise upconverted photon density delivery. Moreover, the generalised model, parameterised with data from accurate UCNP beam-profile-compensated iQY characterisation, stands as a benchmark for complex simulations elucidating the UC processes of UCNPs with analogous behaviour, such as simulations investigating the energy transfer process30 and the giant nonlinearity induced by the avalanche effect for super resolution microscopy.23 Furthermore, the iQY gives the efficiency of the material itself rather than the efficiency dependent on external factors or the surrounding environment. This allows researchers to compare UCNPs from different batches, compositions, laboratories, synthesis methods, etc. Other properties more relevant for applications, such as brightness for imaging, can be derived from the iQY. This level of analysis is made achievable through the comprehensive model and precise UCNPs characterisation, which incorporates beam profile compensation.
We demonstrate the effectiveness of our method by accurately characterising the iQY of the 474 nm, 650 nm, and 804 nm emission peaks of a Yb–Tm-codoped β-UCNP. The beam-profile-compensated iQY of the ETU2 and ETU3 processes were obtained over a wide range of excitation power densities using our compensation method in conjunction with two distinct excitation beam profiles, as previously reported.21 The iQY characterisation covers a wide range of excitation power densities, from the highly non-linear regime below the power density transition points, to the linear regimes at high power densities above the transition points. This work represents a significant advance towards the standardisation of UCNPs characterisation for a range of biophotonic applications. Of particular importance is the ability to characterise ETU processes of orders higher than 2, which are essential for optogenetics applications. Our method provides a powerful tool for accurately characterising UCNPs with any sensitiser or activator, enabling the optimisation of these materials for various biophotonic applications, including emerging uses in optogenetics.
2 Materials and methods
The core–shell β-NaYF4 codoped with Yb3+ and Tm3+ UCNPs, which exhibit visible and near-infrared (NIR) emission wavelengths, were procured from Creative Diagnostics and prepared according to the experimental requirements. Firstly, the nanoparticles were subjected to scanning transmission electron microscopy (STEM) to determine their morphology, size, and dispersion. Subsequently, the emission spectra, luminescence, and absorption characteristics of the UCNPs were studied using a modified QY system described in the ESI,† which is based on a previously reported method.31 Finally, the luminescence data were analysed by fitting them with the beam-profile-compensation equation. This approach enabled us to obtain the iQY curves for a wide range of excitation power densities. The experimental details, along with the theoretical background on the development of the beam-profile-compensation method, are presented in the following sections.2.1 Sample characterisation
For morphology, size, and dispersion characterisation, the sample solution was drop-cast over a 5 mm silicon and brought to the STEM for image acquisition in the transmission mode. For the emission spectra, luminescence, and absorption characterisation, the sample was prepared according to the following steps, which are based on a procedure reported elsewhere.21 First, 1 ml of the as-purchased UCNPs was transferred to a four-cleared-window quartz cuvette and sonicated for 15 minutes. The sample was allowed to rest for an additional 15 minutes to reach thermal equilibrium and to ensure that any residual aggregation could settle to the bottom of the cuvette. The cuvette containing the UCNPs was placed inside CH1, and another identical cuvette containing only toluene (blank cuvette) was placed inside CH2 as a reference for absorption measurements. The laser beam was shaped to a narrow waist by keeping the mirrors FM3 and FM4 flipped down, and beam profile images were taken with the CMOS camera and labelled as BP1. Emission spectra were then collected for a range of power densities between 200–3000 W cm−2. The power density was determined by the ratio between the excitation power at the centre of the cuvette and the area of the cross-section of the beam, with the radius taken as the FWHM. Transmission and luminescence data for the 804 nm and 474 nm peaks were collected simultaneously for several excitation powers between 0–100 mW. This step was repeated for the 650 nm emission peak, replacing a 700 nm long-pass filter with a 650 nm band-pass filter in front of the APD1. The UCL signal of the 474 nm peak was also acquired simultaneously with the 650 nm as a reference to the previous measurement. This procedure for the three wavelengths was repeated for the large beam profile, labelled as BP2. Next, the UCL data was plotted versus the excitation power at the centre of the cuvette, Pc [W], which was obtained by taking the square root of the product between the incident power Po [W] and the transmitted power P [W], as given by (eqn (1)), | (1) |
The incident power Po was obtained by running measurements (for BP1 and BP2) with empty cuvette holders. The experimental data were fitted with a beam-profile dependent UCL equation, which is described in detail below.
2.2 QY evaluation and theoretical background
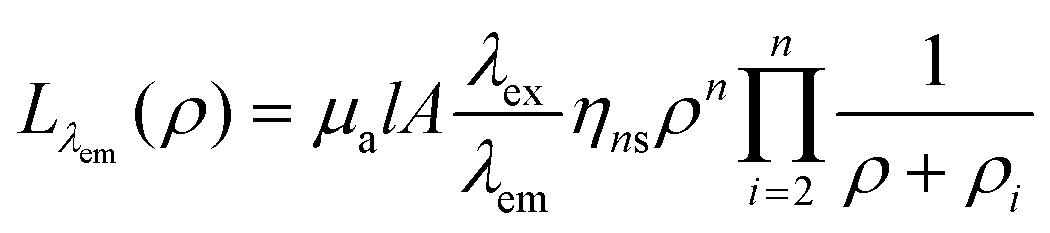
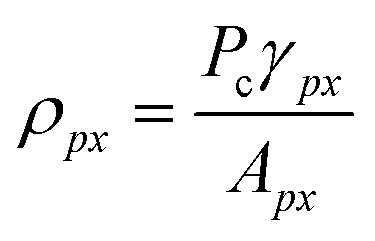
The beam profile compensation method utilised in this study is based on a rate-equations-general-model for an ETU process of arbitrary order, which was recently reported in the literature.27 The method involves determining the iQY saturation and the transition power density points of the UCL and iQY by fitting luminescence curves versus excitation power with an equation that takes into account the excitation beam profile. The fitting equation for a general ETU process was determined based on a previous report in the literature for an ETU2 process.21 By definition, the iQY is the ratio of emitted photons to absorbed photons by the material. This relationship can be expressed in terms of power and wavelengths of excitation and emission using the eqn (2),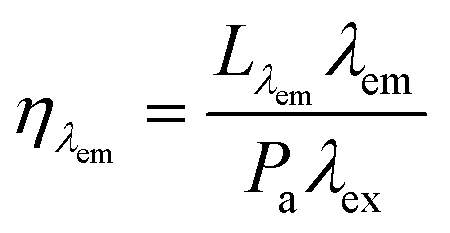 | (2) |
| Pa = μalρA | (3) |
 | (4) |
 | (5) |
![[thin space (1/6-em)]](https://www.rsc.org/images/entities/char_2009.gif) r [W] is represented by eqn (6),
r [W] is represented by eqn (6), | (6) |
 | (7) |
 | (8) |
r(Pc) [W], is given by the (eqn (9)), | (9) |
3 Results
The UCNPs exhibited a hexagonal morphology with an average size of 16 ± 2 nm, as demonstrated by the STEM image in Fig. 1. The size distribution, shown in the inset of Fig. 1, was determined by analysing 100 randomly selected nanoparticles from the STEM image. The particles exhibited good dispersion, and no significant aggregation was observed.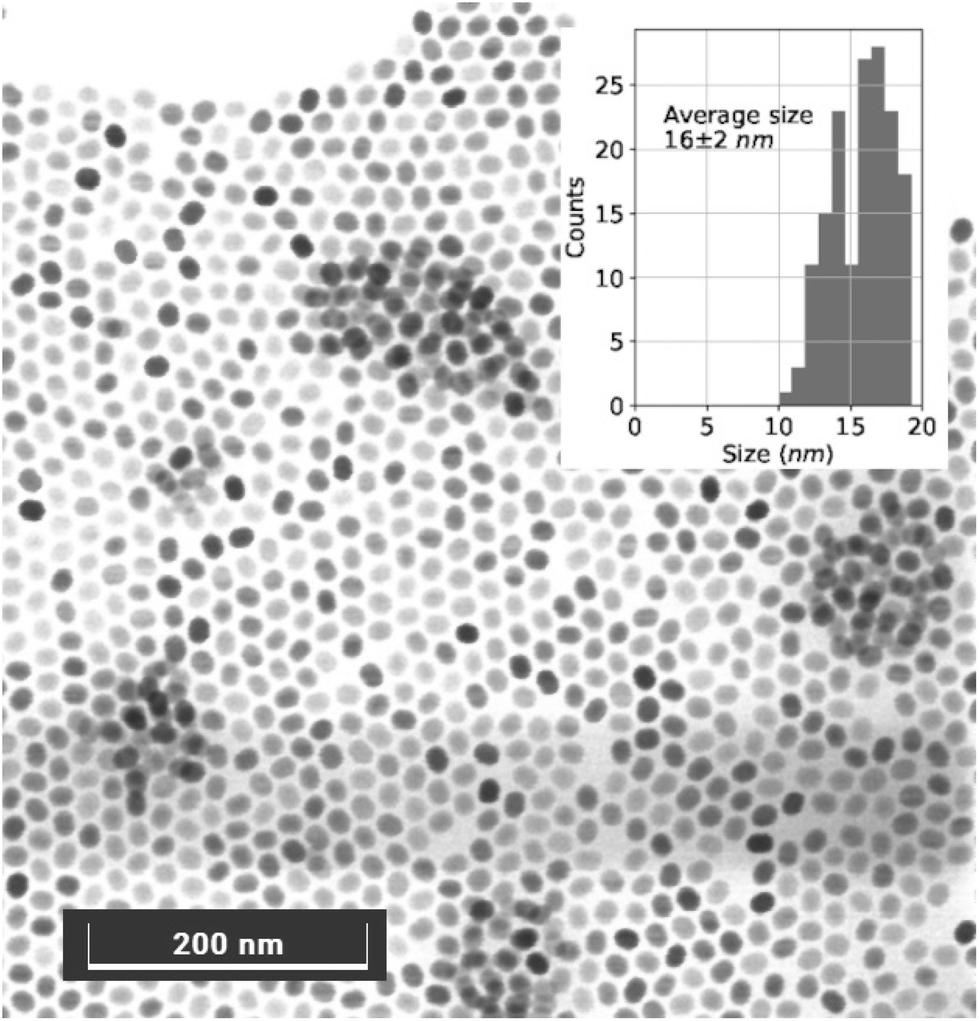 | ||
| Fig. 1 STEM image acquired in transmission mode, revealing the hexagonal morphology of the UCNPs with an average size of 16 ± 2 nm. The inset displays the size distribution histogram obtained from the analysis of 160 nanoparticles selected randomly. | ||
Fig. 2a displays an energy level diagram highlighting the electronic transitions responsible for each emission peak in the emission spectra of the UCNPs, shown in Fig. 2b. The spectra exhibit prominent peaks at 450 nm, 474 nm, 650 nm, and 804 nm, which are typical emission peaks of the ion Tm3+.25 The emission peak at 450 nm could only be observed at power densities exceeding 1000 W cm−2 due to the less probable electronic transition decay from the excited state 1D2 to the ground state 3H6, which corresponds to an ETU4 process. Due to its lower intensity compared to the other peaks, the UCL at the 450 nm wavelength was not measured. On the other hand, the 474 nm and 650 nm emission peaks originate from ETU3 processes, resulting from electronic decay transitions from the same excited state to the ground state (1G4 → 3H6) and to an intermediate excited state (1G4 → 3F4), respectively. Finally, the 804 nm emission corresponds to an ETU2 process, representing the electronic decay from the excited state 3H4 to the ground state 3H6.
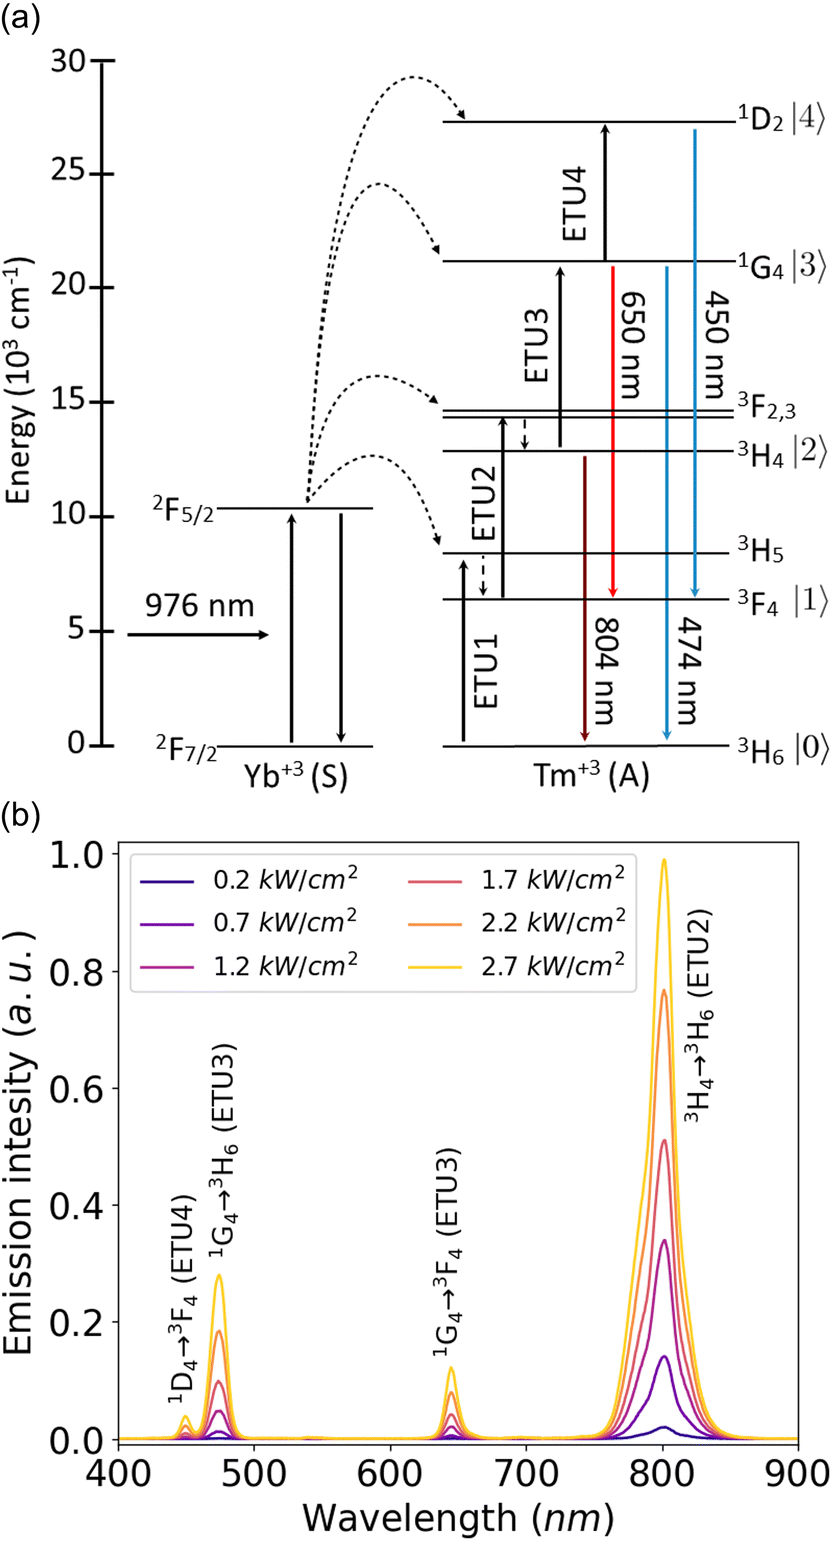 | ||
| Fig. 2 Emission spectra of the UCNPs recorded under various excitation power densities. Panel (a) illustrates an energy level diagram showcasing the electronic transitions corresponding to the observed emission peaks. Panel (b) shows the UCNPs’ primary emission peak at 804 nm, along with weaker peaks at 474 nm and 650 nm, which were detected within the investigated range of power densities. | ||
On the left side of Fig. 3, the profiles of the excitation beams are presented, with BP1 shown at the top in panel (a) and BP2 displayed at the bottom in panel (b). On the right side, three plots depict the UCL curves in relation to the measured excitation powers under the BP1 and BP2 profiles. In panel (c), the UCL for the 474 nm peak is shown, while panel (d) displays the UCL for the 650 nm peak. At the bottom in panel (e), the UCL plot for the 804 nm emission peak is presented. To fit the UCL data, the (eqn (9)) was employed with the corresponding beam profiles, where l represents the aperture of the slit (0.1 cm), and μa is the absorption coefficient (0.05 cm−1). The value of n was replaced by the order of the respective ETU processes for each emission peak. The continuous lines in Fig. 3 represent the fitted curves obtained from the fittings of the UCL curves. The best-fitted parameters for the transition power density points and the iQY saturation constants are provided in Table 1.
 | ||
| Fig. 3 Absolute UCL measured under different beam profiles: (a) narrow beam profile (BP1) with a width of 100 μm (FWHM) and (b) large beam profile (BP2) with a width of 300 μm. The UCL curves for the (c) 474 nm, (d) 650 nm, and (e) 804 nm emission peaks are shown. | ||
| Beam profile | λ em (nm) | ρ 2 (W cm−2) | ρ 3 (W cm−2) | η S (%) |
|---|---|---|---|---|
| BP1 | 474 | 31 | 3.7 × 10² | 0.30 |
| BP1 | 650 | 31 | 3.6 × 10² | 0.14 |
| BP1 | 804 | 31 | — | 0.82 |
| BP2 | 474 | 31 | 4 × 10² | 0.28 |
| BP2 | 650 | 31 | 4 × 10² | 0.14 |
| BP2 | 804 | 33 | — | 0.78 |
Finally, the beam-profile-compensated iQY curves were obtained by applying the (eqn (4)) using the constants obtained from Table 1. These curves were plotted as a function of excitation power densities measured at the pixels of the CMOS camera. Fig. 4 presents the iQY results for the three emission peaks in a double-logarithmic representation. This highlights the iQY results at low excitation power densities. The high dynamic range of excitation power densities (105) and of iQY values (108) is evident as a result of combining the dynamic range of the camera with the dynamic range of laser power and power-meter. The vertical dashed lines in the plot represent the transition power density points (ρ2 and ρ3), while the horizontal dashed lines indicate the iQY saturation levels for the three curves.
 | ||
| Fig. 4 Beam-profile-compensated iQY data for the 804 nm, 650 nm and 474 nm emission peaks versus the local excitation power densities measured at the pixels of the CMOS camera. The horizontal dashed lines represent the iQY saturation levels of the three curves. The vertical dashed lines represent the transition power density points, ρ2 common for all the curves, and ρ3 only affecting the iQY curves for the ETU3 processes (650 nm and 474 nm emission peaks). A sample of these results is shown in a table, which is available in the ESI.† | ||
4 Discussion
As with any quantum process, ETU is probabilistic, and the UCL depends on the population densities of the energy levels. Higher-order ETU processes occur only if lower-order ETU processes have already occurred. Thus, as the excited energy level at which the electrons decay becomes higher, the probability of the event decreases. This can be observed by comparing the heights of the peaks in the emission spectra shown in Fig. 2. The ETU4 peak at 450 nm exhibits the lowest intensity and was only detected for power densities above 1000 W cm−2, while the other emission peaks were detected at power densities as low as a few mW cm−2. The ETU3 processes show higher intensities than the 450 nm peak but lower intensities than the 804 nm peak, which corresponds to an ETU2 process. When comparing the heights of the 474 nm and 650 nm peaks, which both result from decays from the same excited state, it can be observed that the 650 nm peak shows lower intensities. This preference for electronic transitions to lower energy levels indicates that transitions to the ground state are more likely to occur. These findings align with those reported by Meijer et al. in their investigation of the absolute QY of UCNPs containing the same dopants (Yb3+ and Tm3+) but embedded in a different host matrix (LiYF4).25 Despite the variations in host matrix, the authors examined the QY of UCNPs with similar dopant compositions and presented a comparison of absolute QY measurements conducted at different research centres. Their results exhibited a main emission peak at 794 nm, followed by peaks at 451 nm, 480 nm, and 649 nm, which closely resemble the peaks observed in this study. The main difference lies in the higher intensity observed at 451 nm compared to 480 nm in their results. Additionally, their emission spectra displayed broader peaks with secondary peaks, indicating a potential stronger influence of the crystal field resulting from the LiYF4 host matrix on the energy levels of the activator ions. Furthermore, a systematic study of the influence of Tm3+ concentrations on the excitation power-dependent UCL of similar UCNPs, i.e. same host matrix and same dopants, was reported by Kraft et al.32 Interestingly, our results exhibit emission spectra that closely resemble their sample with low Tm3+ concentration (0.2%), matching most of the observed peaks and their intensities. At low Tm3+ concentrations the 700 nm emission peak is suppressed and the relative intensity of the 450 nm peak is reduced, as shown in their results. Although, more accurate comparison with Kraft et al.'s work could not established, because the exact concentration of Tm3+ and Yb3+ ions were not provided by the manufacturer.Comparing the absolute UCL values of these transitions, as shown in Fig. 3, allows for a similar analysis. Under the same beam profile and excitation power, the UCNPs exhibit higher UCL at 804 nm compared to 474 nm and 650 nm, with the 650 nm wavelength having the lowest intensity. The dependence of the UCL curves on the beam profile is clearly evident. Each wavelength exhibits a higher intensity when excited by the BP1 beam profile compared to the BP2 profile, despite both profiles having the same excitation power. Although BP1 illuminates a smaller volume of the sample, containing fewer nanoparticles compared to the volume illuminated by BP2, the higher power density experienced by the UCNPs excited by BP1 leads to increased luminescence. This effect is a direct result of the non-linear power density characteristics of UC. The effect is particularly pronounced for the ETU3 processes, which exhibit a cubic power density dependence at power density ranges below their power density transition points, while the ETU2 process displays quadratic behaviour. Additionally, it is worth noting that the 804 nm UCL curve under BP1 reaches linearity at lower excitation powers compared to the curve under BP2. This difference arises from the overall higher power density associated with BP1 in comparison to BP2. These observations align with findings in the literature21,29,33 and underscore the significance of beam-profile compensation in accurately characterising the iQY of non-linear UC.
The UCL curves for the 474 nm and 650 nm exhibit identical shapes under the same excitation beam profile. This is because the UCL is proportional to the population density of the excited energy state from which the electrons decay. However, their absolute intensity values differ due to the iQY saturation constants, which depend on the radiative decay rates of the respective processes.27 Since the electrons end up in different energy levels, their decay rates differ, consequently, their iQY saturation constants are distinct. In contrast, the 804 nm UCL curve shows a noticeably different shape. This is a result of the varying number of power density transition points associated with different ETU processes. As an ETU3 process, the 474 nm and 650 nm UCL curves share the same transition power density points, ρ2 and ρ3, while the 804 nm UCL curve depends solely on one power density transition point, ρ2.
The results obtained from fitting the parameters in Table 1 reveal very similar values for the transition power density points across all the experimental UCL curves. The value of ρ2 was found to be 31 W cm−2 for the ETU3 processes, regardless of the excitation beam profile, and for the ETU2 process under BP1. For the ETU2 process under BP2, ρ2 was slightly higher at 33 W cm−2. The values of ρ3 were determined as 370 W cm−2 and 360 W cm−2 for the 474 nm and 650 nm UCL curves under BP1, respectively. Under BP2, both fittings yielded the same value of 400 W cm−2 for ρ3. Despite minor deviations, these values are consistent with the theoretical expectation that the transition power density points are independent of the beam profile and the order of the ETU process or emission wavelength. In contrast, the iQY saturation levels are wavelength-dependent but independent of the excitation beam profile, as confirmed by fitting the experimental results. The 804 nm UCL exhibits the highest iQY saturation, 0.82% and 0.78% for the BP1 and BP2 curves, respectively. The 474 nm UCL follows with iQY saturation values of 0.30% and 0.28% for BP1 and BP2, respectively. Finally, the iQY saturation for the 650 nm UCL falls in between, with a value of 0.14% for both excitation beam profiles. These results align with the probabilistic interpretation of the ETU processes discussed earlier. Furthermore, the excellent agreement between the fitted curves and the experimental UCL data in Fig. 3 confirms the robustness of the general model in explaining the ETU processes. Therefore, the transition power density points and the iQY saturation constants accurately and consistently represent the power density-dependent iQY of these UCNPs for all the wavelengths analysed, as shown in Fig. 4. At power densities below the transition points, the UCNPs exhibit maximum UCL non-linearity, with the iQY of the ETU2 process being proportional to power density, ρ, while the iQY of the ETU3 process is proportional to ρ2. As the excitation power density increases beyond ρ2, the iQY transitions to saturation for the ETU2 process and to linear power density dependence (ρ) for the ETU3 processes. Moreover, the iQYs of the ETU3 processes tend to saturate at excitation power densities above the ρ3 transition point. However, the ETU2 process does not undergo further changes beyond this point, as its iQY is independent of ρ3 (eqn (4)).
A comparison of the iQY values for the dominant emission peak (∼800 nm) under 5 W cm−2 excitation reveals notable differences between the results obtained in this study and those reported by Meijer et al. The results presented by Meijer et al. exhibits an approximately one order of magnitude higher quantum yield, approximately 2%, compared to the 0.1% iQY determined in our measurements. It should be noted, however, that Meijer et al.'s sample has different host matrix (LiYF4 as mentioned previously), the dopants concentrations are probably different, and their sample is optimised for the NIR emission. Additionally, their reported values do not account for beam-profile compensation.25 Contrasting to that, the iQY saturation level summed for all emission wavelengths, around 1.2%, falls between the results reported by Kraft et al. for the samples with 0.2% and 0.5% the Tm3+ concentrations, which is consistent to the analysis comparing the emission spectra reported by the authors and this work. Although, their result suggest that the QYs reach saturation level around 70 W cm−2,32 which is below of what was found here, around 100 W cm−2 for the most intense emission wavelength, 804 nm.
Another relevant comparison is with Mousavi et al.'s work. Mousavi et al. conducted measurements of beam-profile-compensated iQY at 800 nm emission for similar core–shell β-NaYF4 codoped with Yb3+ and Tm3+ UCNPs. Their results indicated a iQY saturation of 0.78% for the measured beam profile and 0.8% for the perfect Gaussian compensation method. These findings closely align with the results presented in our work for the 804 nm UCL, which show an iQY saturation of 0.82% and 0.78% for BP1 and BP2, respectively. Regarding the transition power density point ρ2, it can be compared with their balancing point ρb, as stated by Matias et al.27ρ2 was found to be around 30 W cm−2, while ρb was reported as 14 W cm−2. The divergence in these results can be related to a number of parameters, such as the size of UCNPs, concentration of the dopants, thickness of the shell, or even for the fact that their model neglects the energy transfer transitions related to the ETU3 process. This comparison is particularly relevant as the samples in both experiments share the same structural composition, our QY system is an extension of Mousavi et al.'s setup, as reported by Konugolu-Venkata-Sekar et al.,31 and the beam profile compensation methods in both works share similar characteristics.21 An important aspect of Mousavi et al.'s work is their comparison of beam-profile-compensated QY results for UCNPs at 800 nm emission with QY measurements obtained absolutely using an integrating sphere, following the protocol established by the International Union of Pure and Applied Chemistry (IUPAC) for measuring the QY of fluorescent materials in aqueous solutions.21,29,34
The findings for both ETU2 and ETU3 processes also align with Matias et al.'s study, which introduced the generalised analytical model utilised in this paper. The previous paper, which did not consider the beam profile compensation, reported lower transition power density points (ρ2 = 20 W cm−2 and ρ3 = 150 W cm−2).27 These lower values further highlight the importance of accounting for beam profile compensation in accurately characterising iQY, as previously emphasised.21,29 On the other hand, the iQY saturation levels 0.24% and 0.78% for the 474 nm and 804 nm emissions, respectively, were found to be similar with the findings in this paper. This comparison indicates that the saturation constants are less dependent on the excitation beam profile than the transition power density points. This is related to the fact that the UCL is in the linear regime at high power densities where the iQY saturates.
Further direct comparison of the ETU3 process with the existing literature is challenging, since this study represents the first report of beam-profile-compensated iQY for a third order process. These novel method and results, especially for the third order process, represent a major contribution to applications in biophotonics. The 800 nm UCL is broadly utilised for deep-tissue imaging techniques due to its low scattering and low absorption in living tissues. Additionally, the 474 nm emission is significant for applications involving UCNPs in optogenetics, where this wavelength range is used to trigger neuronal activities.
5 Conclusion
In conclusion, this study presents a novel beam-profile compensation method based on a comprehensive analytical rate-equations-based model for the characterisation of the iQY of ETU processes of any order, encompassing various UCL wavelengths. The model's applicability extends beyond the specific sample analysed in this paper, as it can be employed for UCNPs with different codopants. In this study, the model was successfully applied to analyse the UCL peaks at 474 nm, 650 nm, and 804 nm in a core/shell Yb–Tm-codoped β-UCNP. By fitting the theoretical model to the experimental UCL data acquired under two distinct beam profiles, precise determination of the transition power density points and iQY saturation levels for the ETU2 and ETU3 processes was achieved.The excellent agreement between the model fitting and experimental data, along with the consistent results of the transition power density points, highlight the robustness of the proposed model in precisely evaluating the power density-dependent iQY of UCNPs, regardless of the excitation beam profile. Given the low QY of UCNPs, which limits their potential for biomedical applications, the evaluation of iQY as an intrinsic property is crucial for standardising the characterisation of these materials and facilitating the engineering of optimal nanoparticles.
This work contributes to advancing the understanding of UC processes and provides a valuable tool for accurately assessing the iQY of UCNPs. The developed beam-profile compensation method has the potential to enhance the efficiency and reliability of future studies involving UCNPs, leading to the design and development of more efficient and tailored upconverting nanomaterials for a wide range of applications, especially the ones in biophotonics.
Author contributions
Conceptualisation, J. S. M., K. K. and S. A.-E.; data curation, J. S. M.; formal analysis, J. S. M.; funding acquisition, S. A.-E.; investigation, J. S. M. and K. K.; methodology, J. S. M.; project administration, K. K., W. K. K., S. K.-V.-S. and S. A.-E.; software, J. S. M.; supervision, K. K. and S. A.-E.; validation, J. S. M., K. K., W. K. K. and S. K.-V.-S.; visualisation, J. S. M.; writing – original draft, J. S. M.; writing – review & editing, J. S. M., K. K., W. K. K., S. K.-V.-S. and S. A.-E.Conflicts of interest
The authors declare that they have no conflict of interest.Acknowledgements
The authors thank Michael Schmidt and Davinder Singh, for acquiring the STEM images of the UCNPs, and for their prompt response. This project is funded by SFI/15/RP/2828.References
- F. E. Auzel, Proc. IEEE, 1973, 61, 758–786 CAS.
- F. E. Auzel, C. R. Acad. Sci., 1966, 262, 1016–1019 Search PubMed.
- F. Auzel, Chem. Rev., 2004, 104, 139–173 CrossRef CAS PubMed.
- J. De Wild, J. K. Rath, A. Meijerink, W. G. Van Sark and R. E. Schropp, Sol. Energy Mater. Sol. Cells, 2010, 94, 2395–2398 CrossRef CAS.
- T. F. Schulze and T. W. Schmidt, Energy Environ. Sci., 2015, 8, 103–125 RSC.
- N. M. Idris, M. K. Gnanasammandhan, J. Zhang, P. C. Ho, R. Mahendran and Y. Zhang, Nat. Med., 2012, 18, 1580–1585 CrossRef CAS PubMed.
- C. T. Xu, P. Svenmarker, H. Liu, X. Wu, M. E. Messing, L. R. Wallenberg and S. Andersson-Engels, ACS Nano, 2012, 6, 4788–4795 CrossRef CAS PubMed.
- A. Bansal, H. Liu, M. K. G. Jayakumar, S. Andersson-Engels and Y. Zhang, Small, 2016, 12, 1732–1743 CrossRef CAS PubMed.
- T. Xia, Sci. Bull., 2018, 63, 405–407 CrossRef CAS PubMed.
- Y. Wang, L. Bao, Z. Liu and D. W. Pang, Anal. Chem., 2011, 83, 8130–8137 CrossRef CAS PubMed.
- B. Dong, B. Cao, Y. He, Z. Liu, Z. Li and Z. Feng, Adv. Mater., 2012, 24, 1987–1993 CrossRef CAS PubMed.
- E. Martínez, C. Brites, L. Carlos, A. García-Flores, R. Urbano and C. Rettori, Adv. Funct. Mater., 2019, 29, 1807758–1807769 CrossRef.
- N.-N. Dong, M. Pedroni, F. Piccinelli, G. Conti, A. Sbarbati, J. Ramirez, L. Martinez Maestro, M. Iglesias-de la Cruz, F. Sanz-Rodriguez, A. Juarranz, F. Chen, F. Vetrone, J. Capobianco, J. Solé, M. Bettinelli, D. Jaque and A. Speghini, ACS Nano, 2011, 5, 8665–8671 CrossRef CAS PubMed.
- J. Xu, A. Gulzar, P. Yang, H. Bi, D. Yang, S. Gai, F. He, J. Lin, B. Xing and D. Jin, Coord. Chem. Rev., 2019, 381, 104–134 CrossRef CAS.
- N. M. Idris, Z. Li, L. Ye, E. K. Wei Sim, R. Mahendran, P. C. L. Ho and Y. Zhang, Biomaterials, 2009, 30, 5104–5113 CrossRef CAS PubMed.
- S. Wilhelm, M. Kaiser, C. Würth, J. Heiland, C. Carrillo-Carrion, V. Muhr, O. S. Wolfbeis, W. J. Parak, U. Resch-Genger and T. Hirsch, Nanoscale, 2015, 7, 1403–1410 RSC.
- L. Xiong, T. Yang, Y. Yang, C. Xu and F. Li, Biomaterials, 2010, 31, 7078–7085 CrossRef CAS PubMed.
- B. Zhou, B. Shi, D. Jin and X. Liu, Nat. Nanotechnol., 2015, 10, 924–936 CrossRef CAS PubMed.
- S. Fischer, B. Fröhlich, K. W. Krämer and J. C. Goldschmidt, J. Phys. Chem. C, 2014, 118, 30106–30114 CrossRef CAS.
- S. Fischer, N. J. Johnson, J. Pichaandi, J. C. Goldschmidt and F. C. Van Veggel, J. Appl. Phys., 2015, 118, 193105–193117 CrossRef.
- J. S. Matias, K. Komolibus, S. Konugolu-Venkata-Sekar and S. Andersson-Engels, Nanoscale, 2022, 14, 2230–2237 RSC.
- C. Lee, E. Z. Xu, Y. Liu, A. Teitelboim, K. Yao, A. Fernandez-Bravo, A. M. Kotulska, S. H. Nam, Y. D. Suh, A. Bednarkiewicz, B. E. Cohen, E. M. Chan and P. J. Schuck, Nature, 2021, 589, 230–235 CrossRef CAS PubMed.
- C. Chen, L. Ding, B. Liu, Z. Du, Y. Liu, X. Di, X. Shan, C. Lin, M. Zhang, X. Xu, X. Zhong, J. Wang, L. Chang, B. Halkon, X. Chen, F. Cheng and F. Wang, Nano Lett., 2022, 22, 7136–7143 CrossRef CAS PubMed.
- C. Lee, E. Z. Xu, K. W. C. Kwock, A. Teitelboim, Y. Liu, H. S. Park, B. Ursprung, M. E. Ziffer, Y. Karube, N. Fardian-Melamed, C. C. S. Pedroso, J. Kim, S. D. Pritzl, S. H. Nam, T. Lohmueller, J. S. Owen, P. Ercius, Y. D. Suh, B. E. Cohen, E. M. Chan and P. J. Schuck, Nature, 2023, 618, 951–958 CrossRef CAS PubMed.
- M. S. Meijer, P. A. Rojas-Gutierrez, D. Busko, I. A. Howard, F. Frenzel, C. Würth, U. Resch-Genger, B. S. Richards, A. Turshatov, J. A. Capobianco and S. Bonnet, Phys. Chem. Chem. Phys., 2018, 20, 22556–22562 RSC.
- P. S. May and M. Berry, Methods Appl. Fluoresc., 2019, 7, 023001–023015 CrossRef CAS PubMed.
- J. S. Matias, K. Komolibus, K. W. Kho, S. Konugolu-Venkata-Sekar and S. Andersson-Engels, Nanoscale Adv., 2023, 5, 3279–3286 RSC.
- M. Kaiser, C. Würth, M. Kraft, I. Hyppänen, T. Soukka and U. Resch-Genger, Nanoscale, 2017, 9, 10051–10058 RSC.
- M. Mousavi, B. Thomasson, M. Li, M. Kraft, C. Würth, U. Resch-Genger and S. Andersson-Engels, Phys. Chem. Chem. Phys., 2017, 19, 22016–22022 RSC.
- P. Villanueva-Delgado, K. W. Krämer and R. Valiente, J. Phys. Chem. C, 2015, 119, 23648–23657 CrossRef CAS.
- S. Konugolu-Venkata-Sekar, J. S. Matias, G. Dumlupinar, L. Niemitz, M. Mousavi, K. Komolibus and S. Andersson-Engels, Opt. Express, 2022, 30, 16572–16584 CrossRef PubMed.
- M. Kraft, C. Würth, E. Palo, T. Soukka and U. Resch-Genger, Methods Appl. Fluoresc., 2019, 7, 2–8 Search PubMed.
- H. Liu, C. T. Xu, D. Lindgren, H. Xie, D. Thomas, C. Gundlach and S. Andersson-Engels, Nanoscale, 2013, 5, 4770–4775 RSC.
- C. Würth, M. Grabolle, J. Pauli, M. Spieles and U. Resch-Genger, Nat. Protoc., 2013, 8, 1535–1550 CrossRef PubMed.
Footnote |
| † Electronic supplementary information (ESI) available. See DOI: https://doi.org/10.1039/d3nr03103a |
| This journal is © The Royal Society of Chemistry 2024 |