DOI:
10.1039/D4NJ01933D
(Paper)
New J. Chem., 2024,
48, 15402-15413
A highly specific benzothiazole-based Schiff base for the ratiometric detection of hypochlorite (ClO−) ions in aqueous systems: a real application in biological imaging†
Received
26th April 2024
, Accepted 1st August 2024
First published on 3rd August 2024
Abstract
This study describes the rational development and synthesis of a benzothiazole-salicylaldehyde Schiff base probe 1. This probe is designed to function as a ratiometric fluorescent probe specifically for detecting ClO− ions, utilizing the imine bond as the fluorophore unit. Upon interaction with ClO− ions, probe 1 exhibits a redshift in its absorption spectrum from 435 nm to 450 nm. Moreover, in its emission spectrum, there is a ratiometric emission enhancement observed at 610 nm, providing a clear indication of the presence of ClO− ions. The sensitivity of probe 1 for detecting ClO− ions is quantified, revealing a lowest detection limit of 5.5 μM, indicating its potential for sensitive detection even at low concentrations of ClO− ions. Additionally, it has been successfully utilized for biological imaging purposes, demonstrating low cytotoxicity, which is crucial for its applicability in biological systems.
1. Introduction
Hypochlorite ions are commonly used in everyday products like disinfectants and household bleach, and in cyanide treatment.1 They are typically utilized within a concentration range of 10−2–10−5 M. Higher concentrations of hypochlorite solutions pose a potential health hazard to living systems, indicating the importance of proper handling and dilution.2 Hypochlorite ions are categorized as reactive oxygen species (ROS),3,4 along with other molecules like hydroxyl radicals, hydrogen peroxide, and superoxide radicals. ROS play significant roles in living systems, but their imbalance can lead to oxidative stress and damage.5–7 Hypochlorous acid (HOCl) and hypochlorite ions (ClO−, a conjugate base) are essential reactive oxygen species, generated endogenously during microbial invasion in vivo, particularly through the catalytic action of the myeloperoxidase (MPO) enzyme in leukocytes.8–11 ClO− exhibits antibacterial activity and aids in tissue repair when tissues are injured.12 However, excessive levels can lead to tissue damage and contribute to various diseases such as arthritis, cancer, cardiovascular disease, kidney disease, and environmental pollution.13–18 Given the importance of maintaining ClO− concentrations within a balanced range, there's a need to develop effective techniques for determining ClO− concentration in physiological functions induced by ClO− in living systems.
Fluorescence probes offer high selectivity, sensitivity and real-time monitoring for detecting ClO− ions, making them effective tools for accurate measurement even at low concentrations. The use of fluorescence probes offers a straightforward detection procedure, simplifying the experimental process.19–21 Organic fluorescence probes, in particular, are highlighted for their fast reaction time, simple synthesis, and fluorescence output signal, which make them suitable for real-time investigation of ClO− levels.22–25 Small molecular probes, including organic fluorescence probes, are extensively utilized in chemical analysis and environmental detection due to their effectiveness and practicality. Additionally, these probes find applications in medicine, underscoring their significance in various fields beyond environmental monitoring.26,27
Numerous fluorescent probes capable of sensing ClO− ions have been reported. These probes vary in their targeting, including some designed to interact with subcellular organelles. Fluorescence probes for ClO− ions can be categorized based on their binding mechanisms and binding sites. Examples include probes utilizing C![[double bond, length as m-dash]](https://www.rsc.org/images/entities/char_e001.gif) C unsaturated bonds as recognition groups28–31 and those containing nitrogen atoms and chalcogenide elements (sulfur, selenium, tellurium, etc.).32–34 Developing and synthesizing probes for ClO− ions poses several challenges. One major obstacle is the short lifespan of ClO− ions in complex cellular environments, necessitating real-time detection methods. There is a high demand for real-time detection of ClO− ions to better understand their roles in significant biological processes. To meet the demands of biological research, an ideal probe for ClO− ions should possess characteristics such as high specificity, low detection limit, rapid response time, and minimal cytotoxicity. However, numerous options still exhibit drawbacks, including complex synthetic processes and challenges in conducting in vivo experiments. Therefore, it is imperative to design easily accessible colorimetric and fluorescent chemosensors for detecting ClO− in biological systems. Nonetheless, certain alternatives suffer from poor water solubility and high toxicity in vivo.35
C unsaturated bonds as recognition groups28–31 and those containing nitrogen atoms and chalcogenide elements (sulfur, selenium, tellurium, etc.).32–34 Developing and synthesizing probes for ClO− ions poses several challenges. One major obstacle is the short lifespan of ClO− ions in complex cellular environments, necessitating real-time detection methods. There is a high demand for real-time detection of ClO− ions to better understand their roles in significant biological processes. To meet the demands of biological research, an ideal probe for ClO− ions should possess characteristics such as high specificity, low detection limit, rapid response time, and minimal cytotoxicity. However, numerous options still exhibit drawbacks, including complex synthetic processes and challenges in conducting in vivo experiments. Therefore, it is imperative to design easily accessible colorimetric and fluorescent chemosensors for detecting ClO− in biological systems. Nonetheless, certain alternatives suffer from poor water solubility and high toxicity in vivo.35
The synthesized probe is based on the benzothiazole unit, which likely contributes to its selectivity and sensitivity for ClO− ions. The introduction of the –NEt2 group induces an inductive effect, leading to the generation of a δ+ charge on the carbon atom of the imine bond. This structural modification likely facilitates hydrolysis by HOCl, enabling the detection of ClO− ions. This probe exhibits excellent selectivity and high sensitivity for ClO− ions, allowing for accurate detection even in mixed aqueous solutions. The emission maximum of the probe shows quenching with a small red shift in the band upon the addition of ClO− ions, indicating its responsiveness to ClO− concentration changes. The lowest detection limit for ClO− ion detection with probe 1 is determined to be 5.5 μM, indicating its capability to detect low concentrations of ClO− ions. Probe 1 is effectively utilized for biological imaging, suggesting its potential utility in visualizing ClO− ions within biological systems. Additionally, the probe exhibits low cytotoxicity, which is crucial for its application in biological imaging without causing harm to living cells.
2. Experimental section
2.1. Materials and characterizations
All the reactions were carried out using the commercially available reagents obtained from Sigma-Aldrich and Spectrochem Pvt. Ltd, India and used without any purification unless stated otherwise. Reactions were monitored using thin-layer chromatography (TLC), which was performed on silica plates coated with silica gel HF-254 purchased from Spectrochem Pvt. Ltd, India. TLCs were seen with UV light (254 or 365 nm) or I2 staining. Purifications were carried out by column chromatography using SiO2 (60–120 mesh). 1H and 13C NMR spectra were recorded on a Bruker 400 MHz spectrometer (1H NMR at 400 MHz, 13C NMR at 100 MHz). Chemical Shifts were expressed in parts per million with TMS as an internal reference and residual peaks for deuterated solvents are CDCl3 at 7.26 ppm, and DMSO-d6 at 3.33 ppm or 2.50 ppm. The following abbreviations are used to represent the NMR data (s, singlet; d, doublet; t, triplet; q, quartet; dd, doublet of doublets; m, multiplet). The mass spectrum of the synthesized molecule was carried out using an XEVO G2-XS QTOF spectrometer.
The stock solution of probe 1 was prepared in CH3CN at 10−3 M concentration and was further diluted as required for photophysical studies. The absorption studies were carried out on a SHIMADZU-2600 machine using a quartz cell of 1 cm path length. The fluorescence studies were performed on a Varian Carey Eclipse spectrophotometer using slit width (excitation-5 nm, emission-5 nm) at the stated excitation. All absorption and emission scans were saved as ACS files and later converted in excel™ to produce the graphs. The DFT studies were performed in Gaussian 16 software using the B3LYP/6-31G* basis set. Stock solutions for the anions of 10−1 M concentration, viz. F−, CN−, Cl−, Br−, I−, SCN−, AcO−, NO3−, P2O74−, H2PO4−, and HSO4−, were prepared from their tetrabutyl ammonium salts in deionized water and these were also further diluted as per the requirement. The deionized water was used for the preparation of HEPES buffer (10 mM) solution.
 |
| | Scheme 1 Synthesis of probe 1. | |
Ham's F1-2 medium, fetal bovine serum, 100 × penicillin–streptomycin solutions, and 3-(4,5-dimethylthiazol-2-yl)-2.5-diphenyltetrazolium bromide (MTT) were purchased from Himedia, India. Molecular biology grade chemicals such as sodium hydroxide, formaldehyde, dimethyl sulphoxide, hydrochloric acid, sodium bicarbonate, etc., were purchased from Loba Chemie, India.
2.2. Synthesis of probe 1
Compound 1a36 and N,N-diethylamino salicylaldehyde were refluxed in ethanol for 8 h (Scheme 1). On completion, the reaction mixture was cooled and the solid was filtered, and further washed with ethanol to get a yellowish green colored solid of probe 1 in 80% yield. M.pt. 275–280 °C. 1H NMR (CDCl3-d6, 400 MHz): δ (ppm) 12.6 (bs, 1H, OH), 8.45 (s, 1H, CH), 7.96 (d, 1H, J = 8 Hz, ArH), 7.89 (d, 1H, J = 8 Hz, ArH), 7.67 (d, 1H, J = 8 Hz, ArH), 7.51 (t, 1H, J = 16 Hz, ArH), 7.40 (t, 1H, J = 16 Hz, ArH), 7.17 (d, 1H, J = 8 Hz, ArH), 6.93 (d, 1H, J = 4 Hz, ArH), 6.85 (dd, 1H, J1 = 8 Hz, J2 = 12 Hz, ArH), 6.27 (dd, 1H, J1 = 4 Hz, J2 = 8 Hz, ArH), 6.18 (d, 1H, J = 4 Hz, ArH), 3.43 (q, 4H, J = 12 Hz, eth-CH2), 1.22 (t, 6H, J = 8 Hz, eth-CH3) (Fig. S1, ESI†). 13C NMR (DMSO-d6, 100 MHz): δ (ppm) 191.2, 180.8, 179.1, 177.6, 174.3, 173.4, 163.9, 162.8, 160.8, 157.4, 154.3, 151.8, 151.5, 140.1, 137.7, 132.7, 126.0, 73.2, 41. 2 (Fig. S2, ESI†). ESI-MS: m/z 418.16 (M+ + 1) (Fig. S3, ESI†).
2.3. NMR titration procedure
1H NMR titrations of probe 1 against NaOCl were carried out in CD3OD-d4 at 5 mM concentration using a JEOL ECS-400MHz spectrophotometer. All the recorded data were then processed in Mestronova software to draw the stacking data of probe 1 and probe 1 + NaOCl at different concentrations.
2.4. Detection limits
The detection limit (DL) is determined from the following eqn (1):| |  | (1) |
2.5. Cell viability assay
The cytotoxicity of probe 1 and NaOCl was checked using the MTT assay, where the A549 lung cancer cell line (ATCC No. CCL-185) was cultured in Ham's F-12 media and supplemented with 10% fetal bovine serum (FBS), antibiotics, and anti-fungal. These cells were maintained at 37 °C with 5% CO2 and humidified conditions in T25 cell culture flasks.37,38 Later, these cells were seeded in 96 well plates at a cell density of 3 × 10⁴ cells per well and incubated with different concentrations of probe 1 (1, 5, 10, 25, 50 μM) and NaOCl (1, 10, 25, 50, 100 μM) alone or in combination for 24 h. For combination, various concentrations of probe 1 (10, 25, and 50 μM) were incubated in combination with sodium hypochlorite (5, 10, 25, 50 μM). After incubation, 10 μl of MTT solution was added to each well at a concentration of 0.2 mg ml−1 and incubated for another 3 h. The purple-colored formazan crystals formed were then dissolved in DMSO, and the absorbance was measured using an ELISA plate reader (PowerWave XS2, BioTek) at 570 nm.39 All the data were taken from the mean of 3 independent experiments, and % cell viability was calculated using eqn (2).| |  | (2) |
2.6.
In vitro bio-imaging
The in vitro bio-imaging for the sensing of hypochlorite was done using the A549 cell line. To start with, A549 cells were seeded on sterile glass coverslips on 35 mm cell culture dishes at a cell density of 5 × 10⁵ cells per ml and incubated overnight in Ham's F12 media.40 For the treatment, aqueous NaOCl solution was used as an extrinsic hypochlorite (ClO−) source where the cells were pre incubated with different concentrations of hypochlorite (1.0, 2.5, 5.0, 7.5, 10.0 μM). The pretreated cells were later treated with probe 1 (30 μM) in Ham's F12 media containing 10% fetal bovine serum. The experiment was performed in triplicate and the treated cells were incubated for 3 h at 37 °C in the presence of 5% CO2. The cells were later washed with 1× PBS buffer and fixed in 2% formaldehyde solution. The change in fluorescence was checked under the microscope using violet and green excitation light at 20× magnification. Images were captured using a Dwinter Inverted Fluorescence Microscope, Italy. The pixel intensity of green and red fluorescence obtained was calculated using Image J software, and further processing was done using Microsoft Excel. Repeated measures ANOVA followed by Tukey's HSD posthoc test were performed where a 10 × 10 pixel area of the image was measured and the pixel intensity values were used for the repeated measures to check the change in fluorescence pattern. Two measurements were considered statistically significant if the corresponding p-value was <0.01.41
3. Results and discussion
3.1. Photophysical studies of probe 1
At ambient temperature, the UV-Vis and fluorescence spectra of probe 1 (20 μM) were recorded in different polar, nonpolar, protic and aprotic solvents. The probe 1 showed absorption and emission maxima at 410 nm and 500 nm, respectively (Fig. 1a). In all the solvents, probe 1 showed an absorption band in the range of 380–450 nm due to π–π* transition (Fig. 1b). Probe 1 showed red shift of 70 nm in the absorption intensity from 380 nm to 450 nm on increasing the polarity of the solvent (Fig. 2a). Similarly, probe 1 showed an emission band in the range of 500–510 nm in all the solvents. As the polarity of the solvent is increased, the fluorescence intensity also increases with a slight red shift in the emission maxima from 500 nm to 510 nm (Fig. 2b), associated with visible emission color changes under UV light (Fig. 2, inset). The slight variation in the emission band could be due to the differential stabilization of the emission band by different solvents in the excited state.
 |
| | Fig. 1 (a) Normalized absorption and emission spectra of probe 1 (20 μM, CH3CN; λex = 410 nm) and (b) optimized structure of probe 1. | |
 |
| | Fig. 2 (a) Absorption and (b) emission spectra of probe 1 in different polarity solvents; Inset: The color change image of probe 1 in different polarity solvents under UV light. | |
3.2 Ground state structure, electronic distribution, and intramolecular proton transfer or charge transfer
We optimized probe 1 and examined the possibilities of different configurations. Potential energy curves were constructed for CN rotation (imine center connection). Torsional rotation around the CN unit has an energy barrier of 1.73 kcal mol−1 in the S0 state, which is less than the thermal energy of 5 kcal mol−1 and thus, signifies the coexistence of probe 1-C1 and probe 1-C2 configurations that can be interconvertible in the S0 state (Fig. 3a). The Boltzmann populations were determined to be 34%, and 66% for probe 1-C1, and probe 1-C2 configurations. Probe 1-C1 and probe 1-C2 have no imaginary frequencies and slightly twisted geometry in the S0 state. The interconvertible nature of the configurations was also determined through PEC in the S1 state and it was found that the energy barriers have high values in the S1 state and thus, do not allow interconversion.
 |
| | Fig. 3 (a) Energy profile for the torsional rotation optimized structure and (b) frontier molecular orbitals for S0 → S1 excitation. | |
This study has been done with optimized probe 1 and different configurations were explored, focusing on CN rotation. The potential energy curves showed a 1.73 kcal mol−1 energy barrier in the S0 state (which is less than thermal energy of 5 kcal mol−1), indicating co-existence and interconvertible configurations. The determined Boltzmann populations were 34% and 66% for probe 1-C1 and probe 1-C2, respectively. Interconvertibility was determined through PEC in the S1 state, but the energy barriers were high, preventing interconversion.
Furthermore, three low-lying probe 1 excitations, corresponding to the S0 geometry, were calculated to investigate the absorption spectra source, with a summary in Table 1. Probe 1-C1 exhibits an oscillation strength of 2.0153 at 346 nm, indicating 84% orbital transition contribution from the highest occupied molecular orbital to the lowest unoccupied molecular orbital. The study focuses on the S0 → S1 excitation at 288 nm and 272 nm, as the second and third excitations have weak oscillation strength (Table 1).
Table 1 Summary of excitation spectra of probe 1 for the probe 1-C1 and probe 1-C2 configuration
| S0 → Sn |
Probe 1-C1
|
Probe 1-C2
|
|
λ (nm) |
F
|
Molecular orbital |
λ (nm) |
f
|
Molecular orbital |
|
λ = estimated excitation wavelength (nm); H = HOMO; L = LUMO. |
| S0 → S1 |
346.79 |
2.0602 |
H → L (66%) |
345.25 |
2.0679 |
H → L (65%) |
| H−1 → L (14%) |
H−1 → L (14%) |
| S0 → S2 |
296.25 |
0.0091 |
H−1 → L (52%) |
295.99 |
0.0231 |
H−1 → L (50%) |
| H → L+1 (20%) |
H → L+1 (20%) |
| S0 → S3 |
272.49 |
0.0459 |
H−2 → L (32%) |
272.92 |
0.0559 |
H−2 → L+1 (25%) |
| H−1 → L+1 (30%) |
H−2 → L (25%) |
| H → L+4 (17%) |
H−3 → L (17%) |
The electron density in the relevant molecular orbitals changed from the benzothiazole unit (HOMO) to the Schiff base unit (LUMO) (Fig. 3b). The subsequent orbital composition also supported the electron density shift from the HOMO (majorly localized over S8 (49.42%), C2 (6.25%), C4 (7.75%), C6 (6.32%), and C9 (7.97%)) to the LUMO (S8 (3.41%), C2 (0.23%), C4 (0.84%), C6 (2.49%), C9 (2.83%), C10 (6.58%), C17 6.46%, C19 (8.18%), N21 (7.65%), C22 (20%), and C24 (8.22%), and C28 (6.60%)) evoking intramolecular charge transfer from the benzothiazole unit to the Schiff base and diethylamino units. Additionally, the hole–electron analysis showed a small overlap integral (Sr = 0.5191) and significantly distant (D = 5.836 Å) hole–electron centroid, suggesting an intramolecular charge transfer process. The Probe 1-C2 configuration also showed a similar pattern of behavior, as shown in Fig. 3b and Table 1.
Furthermore, the study identifies the presence of two types of asymmetrical intramolecular hydrogen bonding (IraHB) in probe 1, O30H43⋯N7 and O29H42⋯N21, with a short distance of 1.741 Å and 1.718 Å, respectively, which are essential for understanding the probe's behavior in the ESIPT process (Fig. 4a). Furthermore, the proton transferred tautomeric forms (EE, EK1, EK2, KK) were optimized and corrected for zero-point energy. It was determined that the enol form was found to be the most stable form in the S0 and S1 state for both the probe 1-C1 and probe 1-C2 configurations. The energy profile established a relationship of EE (0 kcal mol−1) > EK1 (0.02 kcal mol−1) > EK2 (6.54 kcal mol−1) > KK (6.06 kcal mol−1) in the S0 state and EE (68.25 kcal mol−1) < EK1 (68.61 kcal mol−1) < EK2 (72.65 kcal mol−1) < KK (72.0 kcal mol−1) in the S1 state for probe 1-C1. Similarly for probe 1-C2, the energy relationship of EE (0 kcal mol−1) > EK1 (0.05 kcal mol−1) > EK2 (6.95 kcal mol−1) > KK (6.18 kcal mol−1) in the S0 state and EE (69.23 kcal mol−1) < EK1 (69.45 kcal mol−1) < EK2 (74.43 kcal mol−1) < KK (74.08 kcal mol−1) in the S1 state was established. The above mentioned energy relationship rejects the existence of an ESIPT process for probe 1 in both configurations. The non-existence of the ESIPT process was measured due to the increase of the atomic contribution of O29 and H42 (0.11% → 0.99% for O29 and 0.027% → 0.071% for H42), for O29H42⋯N21 and the decrease of N7 (3.30% → 1.96%) for O30H43⋯N7 on HOMO → LUMO transition, that do not allow proton efficiency.
 |
| | Fig. 4 Energy profile of tautomeric conversion and rotation at the diethylamino center in the S0 and S1 states. | |
Probe 1 exhibited intramolecular charge transfer characteristics that could occur via planar or twisted intramolecular charge transfer. The possibility of twisted intramolecular proton transfer was determined through PECs via torsional rotation at C–N rotations (at diethylamino unit connections). Twisted forms have high energy and require energy as a barrier for conversion, allowing only planar intramolecular charge transfer. This was confirmed through PECs via torsional rotation at C–N rotations. The twisted forms, with their high energy, require energy as a barrier for conversion, allowing only planar intramolecular charge transfer.
3.3. UV-Vis response of probe 1 towards anions
In order to determine the sensing ability of chromogenic detection of probe 1, UV-Vis spectra of probe 1 (20 μM) in the absence and presence of different anions (F−, CN−, Br−, I−, SCN−, AcO−, ClO−, ClO4−, NO3−, P2O74−, H2PO4−, HSO4−, H2O2 and SO42−) were recorded in CH3OH![[thin space (1/6-em)]](https://www.rsc.org/images/entities/char_2009.gif) :H2O (9:1, [v/v], pH = 7.04). Probe 1 showed its absorption maximum at 435 nm. Upon addition of ClO− (1000 μM) to the solution of probe 1, a red shift along with an increase in absorption intensity was observed (Fig. 5a). However, in the presence of competing anions, no significant change in the absorption spectra was observed. With the gradual addition of ClO− ions to probe 1, the absorption band at 450 nm increases (Fig. 5b) and a plateau was observed after the addition of 0–200 μM of ClO− ions. The detection limit of probe 1 for ClO− ions was found to be 1.5 × 10⁻⁶ M.
:H2O (9:1, [v/v], pH = 7.04). Probe 1 showed its absorption maximum at 435 nm. Upon addition of ClO− (1000 μM) to the solution of probe 1, a red shift along with an increase in absorption intensity was observed (Fig. 5a). However, in the presence of competing anions, no significant change in the absorption spectra was observed. With the gradual addition of ClO− ions to probe 1, the absorption band at 450 nm increases (Fig. 5b) and a plateau was observed after the addition of 0–200 μM of ClO− ions. The detection limit of probe 1 for ClO− ions was found to be 1.5 × 10⁻⁶ M.
 |
| | Fig. 5 Absorption spectra of probe 1 (20 μM) CH3OH:H2O (9:1, [v/v], pH = 7.04), (a) in the presence of different anions (1000 μM) and (b) with incremental addition of 0–200 μM of ClO− ions. | |
3.4. Fluorescence response of probe 1 towards anions
To further investigate the sensing ability, the fluorescence response of probe 1 towards different anions (F−, CN−, Br−, I−, SCN−, AcO−, ClO−, ClO4−, NO3−, P2O74−, H2PO4−, HSO4−, H2O2 and SO42−) was examined in CH3OH:H2O (9:1, [v/v], pH = 7.04) at 20 μM concentration. The free probe 1 solution showed blue fluorescence at 500 nm on excitation at 435 nm, which could be due to the radiation-less deactivation by fast imine bond isomerization. The probe 1 showed fluorescence quenching behavior after the addition of ClO− ions with a bathochromic shift to 615 nm over the other tested anions (Fig. 6a). A plateau in the fluorescence spectra was observed after the addition of 300 μM of ClO− ions (Fig. 6b). To further test whether probe 1 can selectively detect ClO− ions even in the presence of other anions, a competitive ion experiment was carried out. Probe 1 was treated with other anions in the presence of ClO− ions. The results indicated that the other ions do not lead to any significant change in the fluorescence intensity and the ClO− ions showed the same spectral change even in the presence of other competitive anions. The fluorescence response to the addition of ClO− ions was not affected by the presence of other commonly coexisting anions, indicating the selectivity of probe 1 towards ClO− ions (Fig. S4, ESI†).
 |
| | Fig. 6 Emission spectra of probe 1 (20 μM) CH3OH:H2O (9:1, [v/v], pH = 7.04), (a) in the presence of different anions (1000 μM) and (b) with incremental addition of 0–300 μM of ClO− ions. | |
3.5. Sensitivity of probe 1 towards ClO− ions
To further check the sensitivity of probe 1 towards ClO− ions, we determined the lowest detection limit of probe 1 with ClO− ions. The lowest detection limit for the probe 1-ClO− complex was 5.5 × 10⁻⁶ M.
3.6.
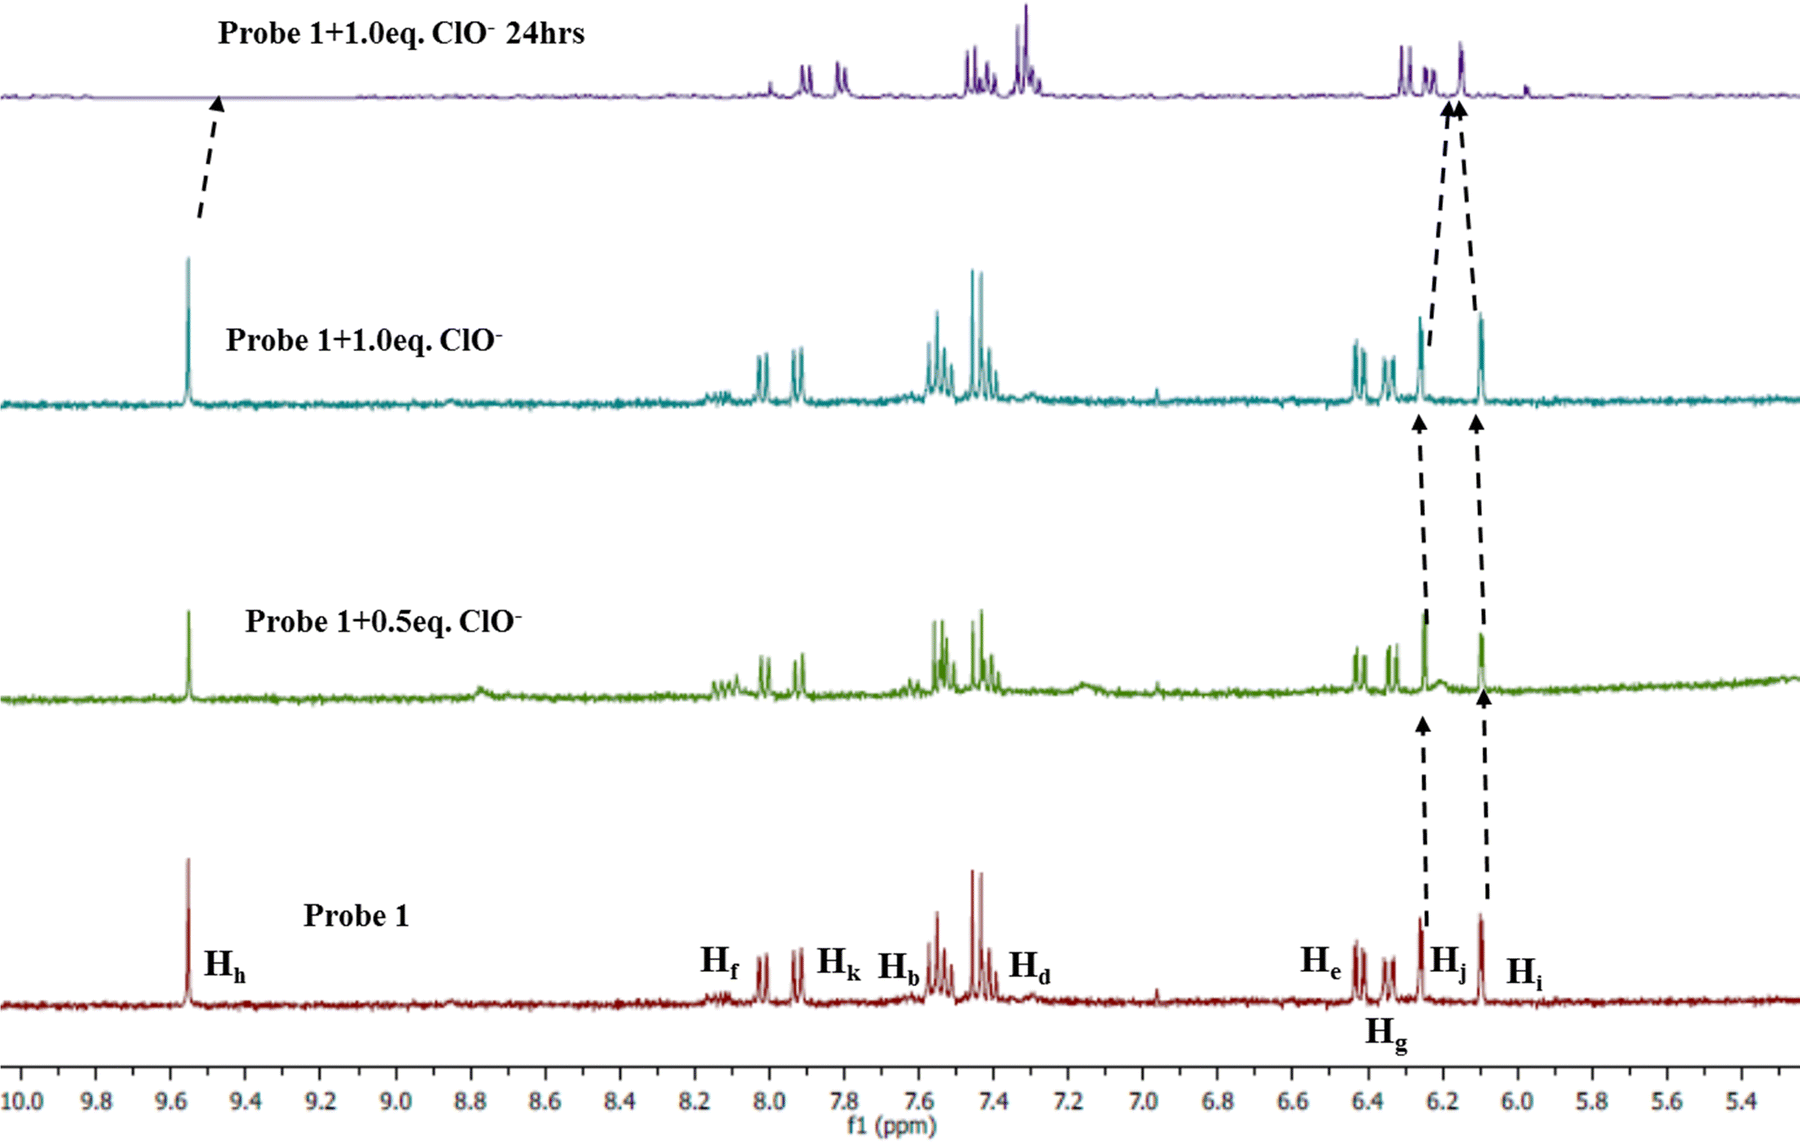
1H NMR titrations
In order to investigate the binding behavior of probe 1 towards ClO− ions, we performed 1H NMR titrations in CD3OD-d4. Upon addition of 1.0 eq. of ClO− to the solution of probe 1, the spectrum was not affected but after 24 h the imine peak at δ 9.56 ppm disappeared, which confirmed the hydrolysis of the Schiff base (Fig. 7). The aromatic protons also showed a downfield shift upon addition of 1.0 eq. of ClO− ions with slight splitting of the signals. The 1H NMR titrations clearly showed that the fluorescence quenching of probe 1 is due to the ClO− prompted hydrolysis leading to the cleavage of the imine bond to generate an aldehyde and amine. To further confirm the hydrolysis mechanism, we took the absorption and emission spectra of the amine formed and this supported the hydrolysis mechanism (Fig. 8 and Fig. S5, ESI†). The 1H NMR titrations clearly showed that the fluorescence quenching of probe 1 is due to ClO− prompted hydrolysis leading to the cleavage of the imine bond to generate aldehyde and amine (Scheme 2). The HRMS peaks at 243.0593 due to amine and 194.1180 due to aldehyde also confirmed the hydrolysis mechanism (Fig. S6, ESI†).
 |
| | Fig. 7 Stacked 1H NMR spectra of probe 1 (5 × 10⁻³ M) upon addition of 1.0 eq. of ClO− ions in CD3OD-d4. | |
 |
| | Fig. 8 Emission spectra of probe 1, probe 1 + ClO− complex and 1a′. | |
 |
| | Scheme 2 Plausible sensing mechanism of ClO− by probe 1. | |
3.7. ClO− detection in the solid state
Based on the above outcomes, we postulated that probe 1 in the presence of ClO− ions in CH3OH:H2O (9:1, [v/v]) underwent a hydrolysis process. So, we predicted that on addition of ClO− ions to probe 1, it should undergo some morphological changes in the solid state. The self-assemblies of probe 1 and probe 1 + ClO− mixture in CH3OH:H2O (9:1, [v/v]) were studied using microscopic techniques to determine any such impact on probe 1 in the solid state owing to the addition of ClO− ions. Field emission scanning electron microscopy (FESEM) images of a thin coating on carbon tape prepared by the drop cast method of probe 1 in CH3OH:H2O (9:1, [v/v]) revealed fibre-like aggregates all over the surface (Fig. 9a and b). These fibre-like aggregates showed an average size of 865 nm. On the other hand, the FESEM images of probe 1 + ClO− mixture in CH3OH:H2O (9:1, [v/v]) demonstrated a flower-shaped aggregate morphology with a particle size of 955 nm (Fig. 9d and e).
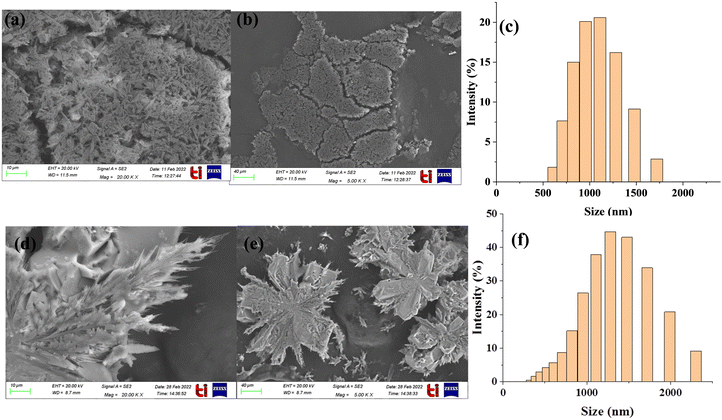 |
| | Fig. 9 (a) and (b) FE-SEM images for self-assembled fibre-like aggregates of probe 1 (20 μM) in CH3OH:H2O (9:1); (c) DLS analysis of probe 1 (20 μM) in CH3OH:H2O (9:1) solution; (d) and (e) FE-SEM images of morphological changes in probe 1 (20 μM) after the addition of ClO− ions in CH3OH:H2O (9:1) solution; (f) DLS analysis of probe 1 (20 μM) after the addition of ClO− ions in CH3OH:H2O (9:1) solution. | |
The dynamic light scattering (DLS) technique further supported the increase in the particle size of probe 1 and the probe 1 + ClO− mixtures. The DLS of probe 1 (20 μM) in CH3OH:H2O (9:1, [v/v]) showed that the average particle size is 500–1500 nm approximately (Fig. 9c) whereas the average particle size of the probe 1 + ClO− mixture in CH3OH:H2O (9:1, [v/v]) is 200–2000 nm approximately (Fig. 9f).
3.8. Effect of pH on probe 1
We also checked the pH stability of probe 1 and its complex with the ClO− ions. To check the pH stability, we performed acid–base titration. It is clear that probe 1 was stable in the pH range from 5–10. The stability of probe 1 in the pH range 5–10 establishes its applicability for rapid monitoring in environmental and biological backgrounds (Fig. 10). The complex of probe 1 and ClO− ions was also stable in the pH range from 3–11, so the detection of these ions using probe 1 could be well performed in this pH range.
 |
| | Fig. 10 Effect of pH on emission spectra of probe 1 (20 μM) and its complex with ions in CH3OH:H2O (9:1, [v/v]) at 520 nm. | |
3.9. Time-correlated single photon counting (TCSPC) study
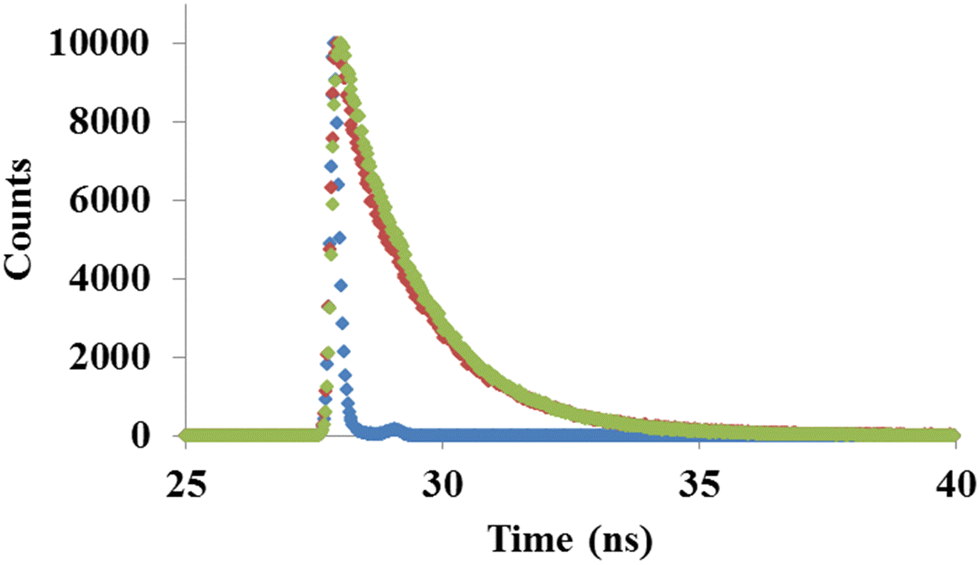
To get further insight of probe 1 behavior towards ClO− ions we performed time resolved fluorescence spectroscopy at 500 nm wavelength. The decay behavior of probe 1 and its ClO− ion complex is best fitted in the third exponential function. The average decay time for probe 1 was found out to be 0.05 ns and it has three lifetime components of 0.77 ns (∼28.75%), 2.86 ns (∼18.3%) and 0.03 ns (∼52.95%). After the addition of ClO− ions, the average lifetime increased to 0.71 ns with three lifetime components of 0.93 ns (∼12.45%), 1.61 ns (∼83.77%) and 0.05 ns (∼3.78%) (Fig. 11). The increase in the average lifetime of probe 1 after binding with ClO− ions suggests the dynamic quenching behavior.
 |
| | Fig. 11 Time resolved fluorescence decay of probe 1 and probe 1 + ClO−. | |
3.10. Cell viability
We examined the in vitro detection of ClO− ions using a cell-based system in the A549 lung cancer cell line for the possible biological applicability of probe 1 and to determine whether the probe 1 can specifically detect ClO− ions under physiological conditions. We chose lung cancer cells (A549) since they are responsible for the greatest number of cancer related deaths. The cell viability experiment was performed to check the cytotoxicity of probe 1 on the cancer cell line. The cell viability assay showed that probe 1 is statistically non-significantly cytotoxic in nature, where 0.6%, 4.2%, 6.1%, 6.5% and 8.9% less cell survival/growth was found due to the treatment of 1, 5, 10, 25 and 50 μM concentrations of probe 1, respectively. Hypochlorite is known for its cytotoxic effect and showed up to a 17.6% loss of cell viability at 100 μM hypochlorite concentration. Probe 1 was also checked for toxicity in combination with hypochlorite where different concentrations (5, 10, 25 and 50 μM) of hypochlorite were treated with 10, 25 and 50 μM concentrations of probe 1 (Fig. 12). A slight decrement in the cell viability was observed where the viability of cells decreased from 91.5% to 76.1% with increasing hypochlorite concentration at 25 μM probe 1 concentration. A similar trend was observed for the probe 1 concentration at 50 μM where the viability of the cells decreased from 98.6% to 77.5% with increasing hypochlorite (ClO−) concentration.
 |
| | Fig. 12 Biocompatibility of probe 1 and NaOCl. | |
3.11.
In vitro bioimaging
It has been observed that cancer cells have elevated levels of oxidative stress and hence have more ClO− levels when compared with normal cells. Lung carcinoma epithelial cell lines (A549) were used to study the effect of probe 1 where the cells were cultured until they reached a confluency of 70–80% and then incubated with probe 1 (30 μM) and ClO− (0–100 μM) for 3 h. Cellular imaging shows the good permeability of probe 1 with bluish-green fluorescence in the cytosol, which is localized near the nucleus, with pixel intensity of 2.47 × 10⁵ and very little red fluorescence with pixel intensity of 0.67 × 10⁵ which was observed due to the presence of intrinsic hypochlorite (Fig. 13A). On addition of extrinsic hypochlorite in the form of NaOCl, the red fluorescence increased with maximum pixel intensity of 3.1 × 10⁵ at ClO− concentration of 100 μM and bluish-green fluorescence first increases with pixel intensity up to 4.0 × 10⁵ at 5 μM ClO− concentration and then decreases, showing pixel intensity of 1.6 × 10⁵ at 100 μM ClO− concentration. An exponential increase in red fluorescence was observed with pixel intensity of 3.08 × 10⁵ up to 10 μM ClO− concentration and thereby saturation was observed (Fig. 13B–I).
 |
| | Fig. 13
In vitro biosensing of hypochlorite using probe 1 (Scheme 1) (A–I) at different concentrations and (J) exponential increase in red fluorescence. | |
Pixel intensity was measured for the bluish-green and red fluorescence, which showed an increase in bluish-green fluorescence with increasing ClO− concentration. After 5 μM, a decrease in intrinsic fluorescence was observed. On the other hand, an exponential increase in red fluorescence was observed up to 10 μM ClO− concentration after which saturation was observed (Fig. 13J). The minimum detection limit of hypochlorite was observed at 2.5 μM for 30 μM probe 1 concentration, where quenching in green fluorescence was observed at 25 μM. The results clearly showed that probe 1 can detect ClO− ions in A549 at concentrations as low as 2.5 μM.
4. Conclusion
In conclusion, we have designed and synthesized a Schiff base probe 1 for the detection of hypochlorite (ClO−) ions with high selectivity and sensitivity in CH3OH–H2O solution. Probe 1 displayed an absorption peak at 410 nm and weak emission peak at 500 nm. The absorption and emission bands of probe 1 showed a bathochromic shift after the addition of ClO− ions. The lowest detection limit for ClO− ions was calculated to be 5.5 μM. The probe 1 has good application in biological imaging with very low cytotoxicity. The sensing mechanism was also investigated using 1H NMR titrations.
Author contributions
Aastha Palta: data curation; formal analysis; methodology; software; roles/writing – original draft; Gulshan Kumar: theoretical studies, software, writing – original draft; Sunidhi Sharma: data curation; formal analysis; methodology; software; roles/writing – original draft; Diptiman Choudhury: conceptualization, supervision; validation; visualization; writing – review & editing. Vijay Luxami: conceptualization; funding acquisition; investigation; project administration; supervision; validation; visualization; writing – review & editing.
Ethical approval
This dataset is not applicable.
Data availability
The data supporting this article have been included as part of the ESI.†
Conflicts of interest
The authors declare no competing financial interest.
Acknowledgements
VL thanks, SERB, New Delhi (EMR/2016/002464) for financial assistance. We are thankful to SAI labs, Thapar Institute of Engineering and Technology, Patiala for NMR. Thapar Institute of Engineering and Technology, Patiala is also acknowledged for the FESEM and HRMS (DST-FIST(SR/FST/CS-II/2018/69) facilities.
References
- T. Aoki and M. Munemori, Anal. Chem., 1983, 55, 209–212 CrossRef CAS.
- E. T. Chouchani, L. Kazak, M. P. Jedrychowski, G. Z. Lu, B. K. Erickson, J. Szpyt, K. A. Pierce, D. Laznik-Bogoslavski, R. Vetrivelan and C. B. Clish, Nature, 2016, 532, 112–116 CrossRef CAS.
- X. He, H. Chen, C. Xu, J. Fan, W. Xu, Y. Li, H. Deng and J. Shen, J. Hazard. Mater., 2020, 388, 122029 CrossRef CAS PubMed.
- Y. Zhu, Y. Ma, Y. Liu, Z. Liu, S. Ma, M. Xing, D. Cao and W. Lin, Sens. Actuators, B, 2021, 327, 128848 CrossRef CAS.
- S. Di Meo, S. Iossa and P. Venditti, J. Endocrinol., 2017, 233, R15–R42 CAS.
- Z. Liang, T.-H. Tsoi, C.-F. Chan, L. Dai, Y. Wu, G. Du, L. Zhu, C.-S. Lee, W.-T. Wong and G.-L. Law, Chem. Sci., 2016, 7, 2151–2156 RSC.
- F. C. Fang, Nat. Rev. Microbiol., 2004, 2, 820–832 CrossRef CAS.
- D. Vara and G. Pula, Curr. Mol. Med., 2014, 14, 1103–1125 CrossRef CAS.
- A. Strzepa, K. A. Pritchard and B. N. Dittel, Cell. Immunol., 2017, 317, 1–8 CrossRef CAS.
- C. L.-L. Chiang, L. E. Kandalaft, J. Tanyi, A. R. Hagemann, G. T. Motz, N. Svoronos, K. Montone, G. M. Mantia-Smaldone, L. Smith and H. L. Nisenbaum, Clin. Cancer Res., 2013, 19, 4801–4815 CrossRef CAS PubMed.
- M. Ren, K. Zhou, L. He and W. Lin, J. Mater. Chem. B, 2018, 6, 1716–1733 RSC.
- D. Cao, Z. Liu, P. Verwilst, S. Koo, P. Jangjili, J. S. Kim and W. Lin, Chem. Rev., 2019, 119, 10403–10519 CrossRef CAS PubMed.
- Y. L. Pak, S. J. Park, Q. Xu, H. M. Kim and J. Yoon, Anal. Chem., 2018, 90, 9510–9514 CrossRef CAS.
- X.-L. Hao, L. Zhang, D. Wang, C. Zhang, J.-F. Guo and A.-M. Ren, J. Phys. Chem. C, 2018, 122, 6273–6287 CrossRef CAS.
- T. Fukuyama, B. Martel, K. Linder, S. Ehling, J. Ganchingco and W. Bäumer, Clin. Exp. Allergy, 2018, 48, 78–88 CrossRef CAS PubMed.
- M. Boncler, B. Kehrel, R. Szewczyk, E. Stec-Martyna, R. Bednarek, M. Brodde and C. Watala, Int. J. Biol. Macromol., 2018, 107, 2701–2714 CrossRef CAS PubMed.
- R. Jeelani, D. Maitra, C. Chatzicharalampous, S. Najeemuddin, R. T. Morris and H. M. Abu-Soud, J. Pineal Res., 2018, 64, e12463 CrossRef PubMed.
- I. Q. Tantry, S. Waris, S. Habib, R. H. Khan, R. Mahmood and A. Ali, Int. J. Biol. Macromol., 2018, 106, 551–558 CrossRef CAS PubMed.
- H. Feng, Z. Zhang, Q. Meng, H. Jia, Y. Wang and R. Zhang, Adv. Sci., 2018, 5, 1800397 CrossRef PubMed.
- X. He, C. Wu, Y. Qian, Y. Li, F. Ding, Z. Zhou and J. Shen, Talanta, 2019, 205, 120118 CrossRef CAS PubMed.
- S. Feng, D. Liu, W. Feng and G. Feng, Anal. Chem., 2017, 89, 3754–3760 CrossRef CAS PubMed.
- S. Xu, H.-W. Liu, X. Yin, L. Yuan, S.-Y. Huan and X.-B. Zhang, Chem. Sci., 2019, 10, 320–325 RSC.
- B. Yun, K. D. Roberts, P. E. Thompson, R. L. Nation, T. Velkov and J. Li, Sensors, 2017, 17, 2598 CrossRef PubMed.
- K. Kumar, S. Kaur, S. Kaur, G. Bhargava, S. Kumar and P. Singh, J. Mater. Chem. B, 2020, 8, 125–135 RSC.
- L. Chen, S. J. Park, D. Wu, H. M. Kim and J. Yoon, Dyes Pigm., 2018, 158, 526–532 CrossRef CAS.
- S. Sun, K. M. Błażewska, A. P. Kadina, B. A. Kashemirov, X. Duan, J. T. Triffitt, J. E. Dunford, R. G. G. Russell, F. H. Ebetino and A. J. Roelofs, Bioconjugate Chem., 2016, 27, 329–340 CrossRef CAS PubMed.
- J. Zhang, K.-L. Wong, W.-K. Wong, N.-K. Mak, D. W. Kwong and H.-L. Tam, Org. Biomol. Chem., 2011, 9, 6004–6010 RSC.
- Q. Zhang, P. Zhang, Y. Gong and C. Ding, Sens. Actuators, B, 2019, 278, 73–81 CrossRef CAS.
- J. Zha, B. Fu, C. Qin, L. Zeng and X. Hu, RSC Adv., 2014, 4, 43110–43113 RSC.
- Y. Wu, J. Wang, F. Zeng, S. Huang, J. Huang, H. Xie, C. Yu and S. Wu, ACS Appl. Mater. Interfaces, 2016, 8, 1511–1519 CrossRef CAS.
- B. Wang, F. Zhang, S. Wang, R. Yang, C. Chen and W. Zhao, Chem. Commun., 2020, 56, 2598–2601 RSC.
- J. Gong, M. Yu, C. Wang, J. Tan, S. Wang, S. Zhao, Z. Zhao, A. Qin, B. Tang and X. Zhang, Chem. Commun., 2019, 55, 10768–10771 RSC.
- C. Duan, M. Won, P. Verwilst, J. Xu, H. S. Kim, L. Zeng and J. S. Kim, Anal. Chem., 2019, 91, 4172–4178 CrossRef CAS PubMed.
- Y. Koide, Y. Urano, K. Hanaoka, T. Terai and T. Nagano, J. Am. Chem. Soc., 2011, 133, 5680–5682 CrossRef CAS PubMed.
- S. Enbanathan, S. Manickam, S. Munusamy, D. Jothi, S. M. Kumar and S. K. Iyer, New J. Chem., 2022, 46, 6570–6576 RSC.
- E. Barni, P. Savarino, M. Marzona and M. Piva, J. Heterocycl. Chem., 1983, 20, 1517–1521 CrossRef CAS.
- R. Mehta, P. Kaur, D. Choudhury, K. Paul and V. Luxami, J. Photochem. Photobiol., A, 2019, 380, 111851 CrossRef CAS.
- S. Sharma, V. Goel, P. Kaur, K. Gadhave, N. Garg, L. D. Singla and D. Choudhury, Exp. Parasitol., 2023, 253, 10859 CrossRef PubMed.
- P. Kaur and D. Choudhury, J. Drug Targeting, 2021, 29, 541–550 CrossRef CAS PubMed.
- P. Kaur, S. Sharma, S. D. Choudhury, D. Singh, S. Sharma, K. Gadhave, N. Garg and D. Choudhury, Colloids Surf., B, 2020, 188, 110785 CrossRef CAS PubMed.
- V. Goel, S. Sharma, N. K. Chakroborty, L. D. Singla and D. Choudhury, Heliyon, 2023, 9, e13699 CrossRef CAS PubMed.
|
| This journal is © The Royal Society of Chemistry and the Centre National de la Recherche Scientifique 2024 |
Click here to see how this site uses Cookies. View our privacy policy here. 
 Open Access Article
 This Open Access Article is licensed under a Creative Commons Attribution-Non Commercial 3.0 Unported Licence
 b,
Diptiman
Choudhary
b,
Diptiman
Choudhary