
 Open Access Article
 This Open Access Article is licensed under a Creative Commons Attribution-Non Commercial 3.0 Unported Licence
Direct biogas reforming to turquoise H2 and carbon material in a catalytic fluidised-bed reactor†
Valentin
L’hospital
 ,
Leandro Goulart
de Araujo
,
Yves
Schuurman
,
Nolven
Guilhaume
and
David
Farrusseng
*
,
Leandro Goulart
de Araujo
,
Yves
Schuurman
,
Nolven
Guilhaume
and
David
Farrusseng
*
Universite Claude Bernard Lyon 1, CNRS, IRCELYON, UMR 5256, Villeurbanne, F-69100, France. E-mail: david.farrusseng@ircelyon.univ-lyon1.fr
First published on 30th April 2024
Abstract
The conversion of methane or natural gas into turquoise H2 and carbon represents a promising pathway towards decarbonised energy. The pyrolysis of biogas (mainly a mixture of methane and CO2) is considered to be a negative carbon-emission technology, as the carbon source comes from biomass and the carbon is captured in solid form. In addition, the presence of CO2 in the gas mixture enables the dry reforming of methane into syngas. In this study, we show that direct biogas conversion in a fluidised catalytic reactor can produce a syngas whose composition meets the requirements for methanol synthesis or for liquid hydrocarbon production via the Fischer–Tropsch process. Confirmed by thermodynamic analysis, we show that the reaction proceeds at temperatures above 900 °C to produce carbon materials, whereas at lower temperatures the carbon is converted to CO by the Boudouard reaction. At 950 °C, very high methane and CO2 conversions are achieved (>90% and 99%, respectively), accompanied by high hydrogen yield (>90%) and the sequestration of carbon into a turbostratic structure. We believe that the direct catalytic reforming of biogas in a fluidised bed, when combined in series with an FTS process, could allow the production of liquid fuels with no need for costly gas separation units, in particular those implemented for CO2 capture.
Introduction
The production of biogas, a mixture containing mainly CH4 and CO2, is a priority in Europe for the provision of sustainable energy. The European energy production derived from biogas was about 190 TWh in 2022 and is expected to double by 2030.1 The dry reforming of biogas is seen as a sustainable pathway to produce decarbonised hydrogen, although it is accompanied by CO2 emissions.2 On the other hand, the cracking of methane can produce CO2-free hydrogen, since the carbon is stored in solid form.3–7 The feedstock of methane can be natural gas (NG) or biogas, which would need to be treated through separation processes to remove CO2, notably to obtain biomethane.8,9 There are two main approaches for methane cracking: plasma pyrolysis10 and catalytic pyrolysis.11–13 However, the thermal decomposition of methane is also being investigated,14 although the temperatures are much higher and therefore less interesting than with a catalyst. Because of thermodynamic and technological constraints, very high methane conversion is difficult to achieve in a steady state. As a result, an H2 separation unit has to be placed downstream to allow unconverted methane to be recycled and methane to be purified.15 Hence, from a global process point of view, the pyrolytic conversion of biogas into H2 would require two major separation steps: an upstream CH4/CO2 separation and a downstream CH4/H2 separation.Here we investigate the direct catalytic cracking of biogas, which means that both methane cracking (1) and methane dry reforming (2) are involved.
| CH4(g) → C(s) + 2H2(g) ΔH298K = 74.9 kJ mol−1 | (1) |
| CH4(g) + CO2(g) → 2CO(g) + 2H2(g) ΔH298K = 247.3 kJ mol−1 | (2) |
| C(s) + CO2(g) → 2CO(g) ΔH298K = 172.4 kJ mol−1 | (3) |
The objective of this work was to investigate the direct catalytic cracking of biogas in a fluidised-bed reactor19–24 to achieve high CH4 conversion and H2 yield with carbon storage in a solid form.25,26 We show that at temperatures above 900 °C, the fluidised bed reactor produces carbon materials, whereas at lower temperatures, the carbon is gasified to CO by the Boudouard reaction. Whereas nickel-based catalysts are the most active catalysts for low-temperature pyrolysis and enable the production of higher-value carbon nanotubes (CNTs),19,27,28 iron-based catalysts are more appropriate for high reaction temperatures.29,30 Here we describe the development of an iron@carbon catalyst that can be fluidised for several hours of time on stream without deactivation.
Experimental
Thermodynamic study
A thermodynamic equilibrium analysis employing Gibbs free energy minimisation was performed using HSC Chemistry software (version 4.1, Outokumpu Research Oy, Helsinki, Finland). Initial conditions were configured with 0.667 mol of CH4, 0.333 mol of CO2 and 1 mol of C (amorphous), under 1 bar and from 0 °C to 1000 °C. Due to the insensitivity of biogas reforming performance to pressure variations, the analysis was performed under ideal gas conditions, deliberately ignoring the effect of pressure on thermodynamic properties.31Catalytic set-up
The fluidised catalytic bed consisted of a quartz tube (ID 16 mm) filled with Fe@carbon catalyst (11 g, h = 5 cm). The synthetic biogas was a mixture of CH4![[thin space (1/6-em)]](https://www.rsc.org/images/entities/char_2009.gif) :CO2 in a 2:1 ratio (99.995%, Air Liquide, France). Flow rates were managed using mass flow controllers (F-201CV, Bronkhorst, France). The fluidised-bed quartz reactor was heated with an electrical furnace (TSVH 12/40/305, Elite Thermal Systems Limited, Merket Horborough, United Kingdom). Additional information can be found in ESI† as well as the scheme of the experimental setup (Fig. S1, ESI†).
:CO2 in a 2:1 ratio (99.995%, Air Liquide, France). Flow rates were managed using mass flow controllers (F-201CV, Bronkhorst, France). The fluidised-bed quartz reactor was heated with an electrical furnace (TSVH 12/40/305, Elite Thermal Systems Limited, Merket Horborough, United Kingdom). Additional information can be found in ESI† as well as the scheme of the experimental setup (Fig. S1, ESI†).
Two type of experiments were carried out: (i) as a function of temperature, and (ii) as a function of time on stream (TOS). For the former, the temperature was varied between 750 and 950 °C, with 50 °C steps (10 °C min−1) and isothermal dwells of 30 minutes during which the catalyst performances were assessed. The reaction was carried out under a pressure of 1 bar with a 300 mL min−1 total inlet flow rate (CH4/CO2/N2 2:1:1). For the latter study, the reactor was heated to 950 °C in the same conditions as previously. Methane conversion (in the absence of CO2) was studied under the same flow and temperature conditions for comparison purposes.
Hydrogen mass balances were calculated for each experiment and were all above 98%. The gas mixtures were analysed online using a micro gas chromatograph (MicroGC 990, Agilent Technologies, France) equipped with two capillary columns: an MS5A SS column (10 m × 0.25 mm × 30 μm) for the analysis of H2, O2, N2, CH4 and CO, and a Poraplot Q UM column (10 m × 0.25 mm × 8 μm) for the analysis of CO2 and hydrocarbons. N2 was used as internal standard for quantitative analysis. Gases from both columns were analysed with a thermal conductivity detector (TCD).
The weight hourly space velocity (WHSV) was determined by dividing the total flow rate (cm3 h−1) by the catalyst mass (g). Equations defining WHSV are provided in Table S1 (ESI†) for clarity. The conversions (4) and (5), hydrogen yield (6) carbon balance (7) and hydrogen balance (8) of individual gas components were calculated using the following equations:
 | (4) |
 | (5) |
 | (6) |
 | (7) |
 | (8) |
 represents the C2+ hydrocarbons (C ≥ 2 atoms) outlet flow (actually negligible).
Catalyst preparation
The Fe@carbon catalyst was prepared by a thermal process involving iron powder (Shanghai Laiwu Powder Material Co. Ltd, China) and methane (Air Liquide, France). An amount of 30 g of iron powder was placed in a quartz reactor (16 mm ID) that was heated at 950 °C under CH4. After 3 hours under flow, the reaction was stopped, and the material was recovered, lightly crushed and sieved to a size less than 200 μm, which allows appropriate fluidisation for the catalytic pyrolysis of biogas.Catalyst characterisation
The C, H, N, (O) and S contents were measured using a Thermo Scientific Flash 2000 series CHNS/O Analyzer equipped with a thermal conductivity detector (TCD). Thermogravimetric analysis (TGA) was carried out in air (30 mL min−1) on a Mettler Toledo TGA/DSC 1 STARe System with a 5 °C min−1 heating ramp. X-ray diffraction analysis of catalysts and recovered carbon materials was carried out on powders using a Bruker D8 Advance A25 diffractometer in Bragg–Brentano configuration equipped with a Cu anode (Cu Kα radiation: 0.154184 nm) and a LynxEye 1-D detector.Specific surface areas were measured by nitrogen adsorption at 77 K using a Belsorp Mini X instrument from BEL MicrotracBel Corp. Prior to measurements, materials were degassed at 250 °C for one night. The specific surface areas were calculated according to the Brunauer, Emmett and Teller method (BET).
H2O vapour adsorption was determined using a BelsorpMax2 instrument (MicrotracBel) at 293 K. The adsorption temperature was carefully controlled with a thermostatic bath (DyneoDD-300F) with an uncertainty of ±0.1 K. Prior to measurements, materials were degassed at 250 °C for one night.
Raman spectra were recorded at ambient temperatures on a LabRAM HR Evolution spectrometer (HORIBA) equipped with a CCD detector. A laser with a wavelength of 532 nm was used for excitation, and the spectra were calibrated by means of the Raman peak of Si at 521 cm−1. The acquisition time was adjusted according to the intensity of the Raman scattering.
SEM analyses were carried out with a Zeiss Sigma Field Emission SEM with an Oxford INCA PentaFETx3 EDS system (model 8100). Analyses were conducted on a fresh, uncrushed Fe@carbon catalyst.
Results and discussion
Catalytic results
From 800 to 950 °C, the fluidised bed exhibited pulsating behaviour within the column, suggesting a bubbling regime (see movie in ESI†). This effect is attributed to the temperature increase, leading to the expansion of introduced gases, greater production of reactive gases and, consequently, bubble formation in the fluidised bed. This behaviour is intensified by the use of small catalyst particles with a pseudo-uniform distribution in the reactor and also by the production of carbon. The accumulation of carbon could promote different hydrodynamic resistances, influencing the fluidisation pattern and contributing to the piston effect. Moreover, the fluidisation pattern is markedly influenced by the gas flow rate and the minimum fluidisation velocity of the system.19,32 It is observed that when the gas flow rate exceeds the minimum fluidisation velocity, bubbles can form and grow with increasing ratio.33 The observed fluidisation looks very similar to that which is visible in the video made by Dadsetan et al.,26 who, however, used activated carbon as catalysts.At 750 °C, methane conversion is negligible and increases rapidly as the temperature increases. The CO2 conversion increases with temperature also, but remains high (>80%) regardless of temperature due to sub-stoichiometric CO2 in the inlet mixture. At 950 °C, the conversion of methane and CO2 achieves maximum levels of 91 and 99%, respectively (Fig. 1).
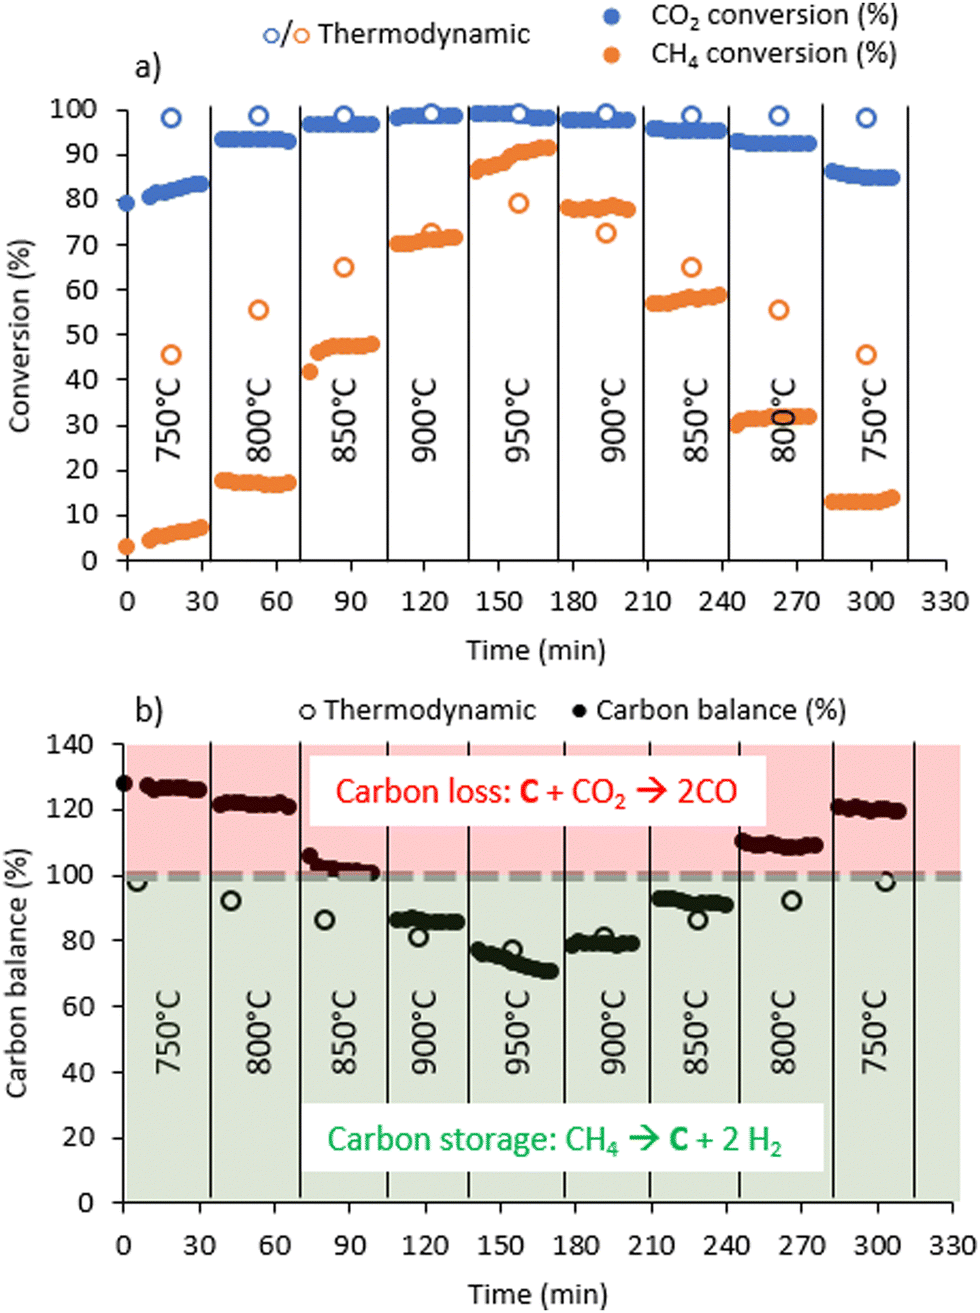 | ||
| Fig. 1 (a) Methane and CO2 conversion as a function of temperature, (b) carbon balance estimated from gas-phase reactants and products. Carbon balance values above 100% indicate carbon loss from the catalyst; values below 100% indicate an accumulation of solid carbon. Inlet flow: 300 mL min−1 CH4/CO2/N2 2:1:1. | ||
We can also observe that after 150 min, when the temperature is decreased, the conversion level is higher than that obtained at the same temperature at the beginning of the experiment, which indicates an activation phenomenon with time on stream. This is particularly visible at 800 °C, for which the conversion is 20% when the temperature ramps up and 30% when it ramps down.
The carbon balance is calculated from a quantitative analysis of the gaseous reactants and products. Hence, a carbon balance below 100% implies that a lesser quantity of C-containing compounds is found at the reactor outlet in the gas phase than in the inlet feed, i.e., solid carbon is formed. Conversely, when the carbon balance is above 100%, a greater quantity of C-containing gas-phase compounds is found at the reactor outlet than in the inlet feed, which corresponds here to the gasification of solid carbon into CO. The evolution of the carbon balance as a function of temperature clearly indicates carbon loss, i.e., production of CO(g) from solid carbon below 850 °C and carbon formation from gaseous reactants above 850 °C.
Methane conversions in biogas as a function of temperature are slightly higher than the conversion of pure methane at similar temperatures (Fig. 2). Actually, dry methane reforming (CH4 + CO2) occurs during the reaction, resulting in higher methane conversion in the presence of CO2. In pure methane cracking (Fig. S2, ESI†), the carbon balance never exceeds 100%, indicating that carbon is not gasified in the absence of CO2. As the temperature increases, the carbon balance decreases to a minimum of 17% at 950 °C, indicating that most of the methane is converted to solid carbon on the catalyst.
 | ||
| Fig. 2 Comparison of carbon balance (%) and CH4 conversion (%) for biogas reforming (CH4/CO2/N2 2:1:1) and methane cracking (CH4/N2 1:1) at T = 950 °C, 1 bar, 300 mL min−1. A carbon balance of less than 100% (grey dotted line) indicates carbon storage, while above 100% there is carbon gasification. | ||
Hydrogen yield (Fig. 3a) as a function of temperature follows the profile of methane conversion, reaching a maximum yield of 91% at 950 °C. The H2 productivity increases with the temperature and reaches about 950 mmolH2 gcat−1 min−1 for this yield. C2 and C3 hydrocarbons are observed in trace concentrations.
 | ||
| Fig. 3 (a) Hydrogen yield (%) and productivity (mmolH2 gcat−1 min−1) over time and (b) H2/CO ratio as a function of H2 yield (%). | ||
The evolution of the H2/CO ratio as a function of H2 yield is shown in Fig. 3b. Interestingly, as the temperature increases, the H2/CO ratio increases linearly with the H2 yield. The same trend is observed in the thermodynamic study (Fig. 4). Compared to the H2 productivity, the CO productivity is less affected by temperature. This can be explained by the ability of the carbon from the catalyst to shift the equilibrium of the Boudouard reaction, increasing the CO concentration in the reaction and reversing the trend.
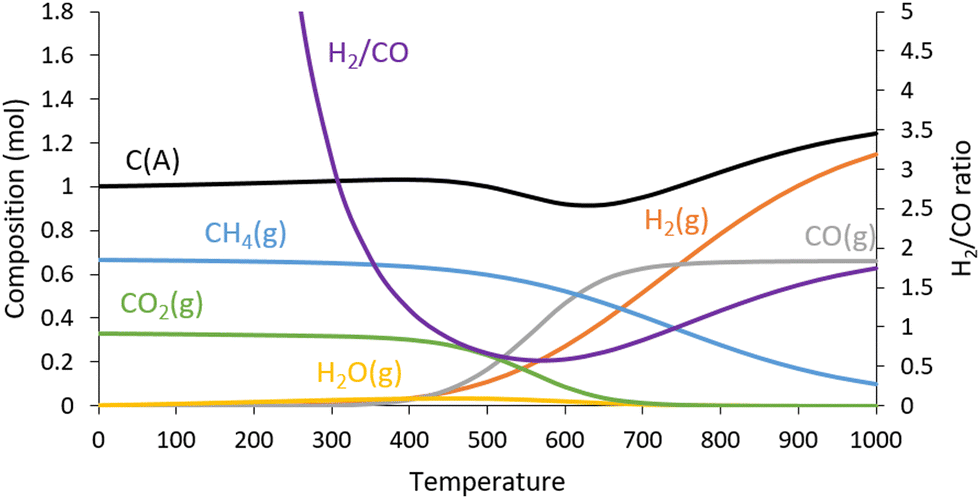 | ||
| Fig. 4 Thermodynamic equilibrium for biogas decomposition as a function of temperature. Conditions: CH4 = 0.667 mol, CO2 = 0.333 mol, C(A) = 1.000 mol, 1 bar. | ||
The Fe@carbon catalyst also showed stability over for 2 hours on stream at 950 °C with biogas (Fig. S3, ESI†) and more than 3h for pure methane (Fig. S4, ESI†). The methane conversion showed a slight activation in the first tens of minutes, then was stable and progressively decreases after 2 h on stream, accompanied by an increase in carbon balance (Fig. S3a, ESI†), as observed by Lim et al.34 At long TOS, less H2 was produced, while CO production remained constant. During this long time-on-stream test, a mass gain of 9 g was observed (carbon storage) and the catalytic bed volume was four times higher than for the fresh catalyst (Fig. S5, ESI†). The apparent density of the Fe@carbon catalyst decreased from 1.22 g cm−3 (fresh) to 0.38 g cm−3 (spent). As the reaction proceeds, some lighter catalyst particles (1.94 g) escape from the top of the fluidised bed which could explain in part the decrease of methane conversion. Several studies have shown that the catalyst can be regenerated with different gas streams such as CO2, air and H2O vapor.32 This could prevent catalyst deactivation over a TOS reaction period. Under the same WHSV and temperature conditions, the catalyst developed by Lim et al.34 shows lower CO2 and CH4 conversions. In other studies, notably the work of Torres et al.,33 an iron-based catalyst has been tested under similar conditions to ours (e.g. WHSV and temperature) and presents a lower activity range.
The fluidisation method possesses significant advantages by circumventing the inherent heat transport limitations often encountered in traditional reaction systems. A detailed study of fluidised systems in comparison to others is given elsewhere.35 These include the superior temperature uniformity throughout the reactor, thereby eliminating the occurrence of hot spots and avoid the reactor plugging during the carbon production. However, operating at temperatures as high as 950 °C presents challenges as catalysts can sinter and prevent effective fluidisation. Tackling these constraints is critical to optimizing the performance and efficiency of this process in future research and scale-up efforts.
Thermodynamic aspects
Methane cracking and biogas reforming are endothermic equilibrated reactions, so increasing the reaction temperature shifts the equilibrium towards the production of H2. In our case, we should keep in mind that the fresh Fe@carbon catalyst contains about 20% of its weight in carbon (Fig. S6, ESI†). Hence, under certain conditions it can produce CO by carbon or coke gasification (with CO2), while under other conditions it can accumulate solid carbon deposits, most likely by coking of the iron surface. Below 850 °C, the carbon previously deposited onto the iron is gasified to CO by the Boudouard reaction (C(s) + CO2(g) → 2CO(g)) (Fig. 1). This indicates that carbon formation by methane cracking (CH4(g) → C(s) + 2H2(g)) is slower than carbon gasification by the Boudouard reaction. In contrast, at temperatures above 850 °C, solid carbon is produced, because the methane cracking reaction produces more carbon than does gasification by the Boudouard reaction. These results are consistent with the thermodynamic study (Fig. 4). Indeed, the thermodynamic equilibrium is achieved by considering the carbon on the catalyst, denoted C(A) for amorphous carbon.In this equilibrium system, the carbon composition decreases from 500 °C onwards, in favour of CO (gasification of carbon with CO2via the Boudouard reaction). Beyond 650 °C, the amount of carbon increases, while the amount of CH4 decreases. Above 900 °C, thermodynamic calculations show that the concentrations of CH4, CO2 and water vanish and the composition reaches a plateau consisting of 1.15 mol of H2, 0.66 mol of CO and 1.24 mol of solid carbon. The experimental conversions at 900–950 °C match with thermodynamic estimates, especially the carbon yield (Fig. 1). Also, the experimental H2/CO ratio is 1.9:1 at 950 °C, while the thermodynamic estimate is 1.7:1 (Fig. 4). Thus, we can confirm that at 950 °C the thermodynamic equilibrium is reached with a H2:CO ratio close to 2, which is ideal for FTS, MeOH and DME synthesis,36,37 while the carbon is stored in solid form.
Our results at high temperature are in agreement with the work of Li et al.18 As a matter of fact, the CH4 and CO2 conversions obtained are very close after 900 °C. That said, the H2/CO ratio is higher in our case.
Catalyst and carbon product characterisation
TGA of the fresh Fe@carbon, carried out in air between 25 and 1000 °C (5 °C min−1), shows that the catalyst contains 20 wt% carbon and 74 wt% of a mixture of iron and iron oxide (Fig. S6, ESI†). A slight increase in mass can be seen at 500 °C (followed by another around 750–900 °C), corresponding to the different stages of Fe oxidation.38 The carbon on the catalyst has a decomposition temperature under air of around 630 °C, corresponding to a form of pyrolytic graphitic carbon. By comparing the TGA of the fresh and spent catalysts, we can see that the amount of carbon has increased from a mass of 20% to a mass of 74%.XRD analysis of fresh and spent catalysts shows several characteristic graphite lines (Fig. S7, ESI†), including the main graphite line at 26.6°. The characteristic lines of metallic iron can also be seen, with the most intense line at 44.7°. By comparing the diffractograms of the fresh and spent catalysts, we can see that the intensity of the characteristic graphite line on the catalyst increases after the test.
Raman spectroscopy is a relevant technique for characterising local orders in carbonaceous materials, thanks to the ID/IG ratio (Fig. S8, ESI†). The G band (1580 cm−1) represents the vibrational mode associated with the asymmetric stretching of all sp2 carbon atoms, while the D band is attributed to the breathing mode in the aromatic rings of Poly Aromatic Hydrocarbons (PAHs).39,40 The presence of the D band (1350 cm−1) in these materials is attributed to structural defects. It has been shown that the intensity of the D band relative to that of the G band increases with the amount of disorder.41–43 In this study, the carbon deposits before and after biogas cracking present the same ID/IG ratio (≈0.42). This ratio is similar to the one determined by Charisiou et al.44 This indicates that the two different carbon deposits have the same local order or degree of crystallinity which correspond to turbostratic carbon class. The spent catalyst has a specific surface area (SSA) of 11 m2 g−1, compared to 2 m2 g−1 for the fresh catalyst (with a pore volume of 26.6 cm3 g−1 and 6.8 cm3 g−1, respectively)(Table S2, ESI†). This additional surface and pore volume is caused by carbon deposition during biogas conversion. (Fig. S9, ESI†). H2O physisorption on the fresh and spent catalyst clearly indicates that the two samples are hydrophobic (Fig. S10, ESI†) and adsorb very low amount of water (Table S3, ESI†). However, Fe/C spent catalyst presented a higher amount than fresh Fe/C catalyst, and can be explain because of the higher surface area of the catalyst determined by N2 physisorption.
SEM was used to study the morphology of the fresh and spend Fe@carbon (Fig. 5). The carbon particles on the fresh catalyst appear as in the form of thin, smooth plates, similar to the findings of Rew et al.45 The particles of spent catalyst after biogas reforming appear as carbon filaments with heavier particles on their ends corresponding to iron particles, which may give an indication of Carbon Nanotubes (CNTs) formation during the biogas reforming. However, the quantity of CNT is too small to be detected by Raman spectroscopy between 120 and 350 cm−1 as shown by the work of Dresselhaus et al.46
 | ||
| Fig. 5 SEM picture of the (a) fresh Fe/C catalyst and (b) spent Fe/C catalyst. | ||
Conclusions
In this work we have demonstrated the development of a Fe@carbon catalyst that is very easy to manufacture and that can be used as a fluidised catalyst for biogas pyrolysis. Catalytic performances are very stable for at least 2 hours of TOS. We show that in the catalytic conversion of biogas, temperatures in excess of 850 °C are required for carbon production; otherwise, the carbon is gasified into CO. Compared to pure methane cracking, biogas reforming can be achieved with very high methane conversion (90% vs. 83%) at 950 °C, thanks to the additional dry reforming reaction. Equally important is the H2:CO ratio approaching 2:1, an ideal ratio for Fisher-Tropsch or MeOH synthesis. As a result, this technology would allow the production of a syngas directly from biogas with an integrated carbon capture in the form of solid carbon. Indeed, at 950 °C, the outlet gas concentration would be H2 (62%) and CO (33%), with lower concentrations in CH4 (4%) and CO2 (1%), while the carbon production would be 0.3 kg−1 kgcatalyst−1 h−1.
This work opens up the prospect of converting biogas into liquid hydrocarbons in two catalytic steps, without the need for gas separation (e.g., CH4/CO2) or recycling (CH4/H2) at low expenditure and environmental costs, taking also advantage of the availability and non-toxicity of iron ores. As part of our EU grant program (TITAN), we plan to scale up the reactor for a comprehensive techno-economic analysis, assessing H2 production costs, greenhouse gas emissions and environmental impacts to guide future industrial implementation and sustainable energy innovation.
Author contributions
Valentin L’hospital: investigation, validation, visualization, writing – original draft. Leandro Goulart de Araujo: writing – review & editing. Yves Schuurman: writing – review & editing. Nolven Guilhaume: project administration, writing – review & editing. David Farrusseng: supervision, project administration, writing – review & editing,Conflicts of interest
There are no conflicts to declare.Acknowledgements
We thank the European Union for supporting the TITAN Horizon Europe program under GA no. 101069474. The views and opinions expressed are, however, those of the authors only, and do not necessarily reflect those of the EU. Neither the EU nor the granting authority can be held responsible for them.Notes and references
- C. Bumharter, D. Bolonio, I. Amez, M. J. García Martínez and M. F. Ortega, J. Clean. Prod., 2023, 388, 135867 CrossRef CAS.
- M. Boscherini, A. Storione, M. Minelli, F. Miccio and F. Doghieri, Energies, 2023, 16, 6375 CrossRef CAS.
- N. Sánchez-Bastardo, R. Schlögl and H. Ruland, Ind. Eng. Chem. Res., 2021, 60, 11855–11881 CrossRef.
- S. R. Patlolla, K. Katsu, A. Sharafian, K. Wei, O. E. Herrera and W. Mérida, Renew. Sustainable Energy Rev., 2023, 181, 113323 CrossRef CAS.
- L. Zhou, L. R. Enakonda, S. Li, D. Gary, P. Del-Gallo, C. Mennemann and J. M. Basset, J. Taiwan Inst. Chem. Eng., 2018, 87, 54–63 CrossRef CAS.
- N. Sánchez-Bastardo, R. Schlögl and H. Ruland, Chem. Ing. Tech., 2020, 92, 1596–1609 CrossRef.
- C. Fukuhara, Y. Matsui, M. Tanebayashi and R. Watanabe, Chem. Eng. J. Adv., 2021, 5, 100057 CrossRef CAS.
- M. Tagliabue, D. Farrusseng, S. Valencia, S. Aguado, U. Ravon, C. Rizzo, A. Corma and C. Mirodatos, Chem. Eng. J., 2009, 155, 553–566 CrossRef CAS.
- S. Timmerberg, M. Kaltschmitt and M. Finkbeiner, Energy Convers. Manage.: X, 2020, 7, 100043 CAS.
- W. C. Chung and M. B. Chang, Renew. Sustainable Energy Rev., 2016, 62, 13–31 CrossRef CAS.
- L. Chen, Z. Qi, S. Zhang, J. Su and G. A. Somorjai, Catalyst, 2020, 10, 858 CrossRef CAS.
- L. Alves, V. Pereira, T. Lagarteira and A. Mendes, Renew. Sustainable Energy Rev., 2021, 137, 110465 CrossRef CAS.
- S. M. R. Mirkarimi, S. Bensaid, V. Negro and D. Chiaramonti, Renew. Sustainable Energy Rev., 2023, 187, 113747 CrossRef CAS.
- T. Marquardt, S. Wendt and S. Kabelac, ChemEng, 2021, 5, 1–14 Search PubMed.
- L. Weger, A. Abánades and T. Butler, Int. J. Hydrogen Energy, 2017, 42, 720–731 CrossRef CAS.
- L. E. Sandoval-Diaz, R. Schlögl and T. Lunkenbein, Catalysts, 2022, 12(5), 465 CrossRef CAS.
- X. Zhang, C. S. M. Lee, D. M. P. Mingos and D. O. Hayward, Catal. Lett., 2003, 88, 129–139 CrossRef CAS.
- L. Li, K. Yan, J. Chen, T. Feng, F. Wang, J. Wang, Z. Song and C. Ma, Sci. Total Environ, 2019, 657, 1357–1367 CrossRef CAS PubMed.
- K. K. Lee, G. Y. Han, K. J. Yoon and B. K. Lee, Catal. Today, 2004, 93–95, 81–86 CrossRef CAS.
- D. Y. Kim, H. Sugime, K. Hasegawa, T. Osawa and S. Noda, Carbon, 2011, 49, 1972–1979 CrossRef CAS.
- N. Shah, S. Ma, Y. Wang and G. P. Huffman, Int. J. Hydrogen Energy, 2007, 32, 3315–3319 CrossRef CAS.
- Q. Weizhong, L. Tang, W. Zhanwen, W. Fei, L. Zhifei, L. Guohua and L. Yongdan, Appl. Catal., A, 2004, 260, 223–228 CrossRef.
- J. X. Qian, L. R. Enakonda, W. J. Wang, D. Gary, P. Del-Gallo, J. M. Basset, D. Bin Liu and L. Zhou, Int. J. Hydrogen Energy, 2019, 44, 31700–31711 CrossRef CAS.
- H. T. Jang and W. S. Cha, Korean J. Chem. Eng., 2007, 24, 374–377 CrossRef CAS.
- M. Keller, A. Matsumura and A. Sharma, Chem. Eng. J., 2020, 398, 125612 CrossRef CAS.
- M. Dadsetan, M. F. Khan, M. Salakhi, E. R. Bobicki and M. J. Thomson, Int. J. Hydrogen Energy, 2023, 48, 14565–14576 CrossRef CAS.
- Q. Liu, P. Wu, J. He, C. Liu and W. Jiang, Chem. Eng. Res. Des., 2020, 163, 96–106 CrossRef CAS.
- W. Qian, T. Liu, F. Wei, Z. Wang and Y. Li, Appl. Catal., A, 2004, 258, 121–124 CrossRef CAS.
- M. S. Vlaskin, A. V. Grigorenko, A. A. Gromov, V. Kumar, A. O. Dudoladov, O. V. Slavkina and V. I. Darishchev, Results Eng., 2022, 15, 100598 CrossRef CAS.
- K. Bae, D. Kim, P. A. Dung, D. Lee, B. Hwang, K. S. Go, W. Kim, J. K. Lee, J. S. Im, S. C. Kang and S. H. Lee, J. Ind. Eng. Chem., 2024, 63(2), 930–941 CrossRef CAS.
- M. J. Park, H. M. Kim, Y. J. Gu and D. W. Jeong, Energy, 2023, 265, 126273 CrossRef CAS.
- A. M. Amin, E. Croiset and W. Epling, Int. J. Hydrogen Energy, 2011, 36, 2904–2935 CrossRef CAS.
- D. Torres, S. De Llobet, J. L. Pinilla, M. J. Lázaro, I. Suelves and R. Moliner, J. Nat. Gas Chem., 2012, 21, 367–373 CrossRef CAS.
- M. S. Lim and Y. N. Chun, Energy Fuels, 2017, 31, 13761–13768 CrossRef CAS.
- N. Muradov, Thermocatalytic CO2-free production of hydrogen from hydrocarbon fuels, 2003, 1–105 Search PubMed.
- D. Pakhare and J. Spivey, Chem. Soc. Rev., 2014, 43, 7813–7837 RSC.
- F. Dadgar, R. Myrstad, P. Pfeifer, A. Holmen and H. J. Venvik, Catal. Today, 2016, 270, 76–84 CrossRef CAS.
- R. Y. Chen and W. Y. D. Yuen, Oxid. Met., 2003, 59, 433–468 CrossRef CAS.
- T. Aumond, I. Batonneau-Gener, Y. Pouilloux, L. Pinard, D. Wisser, M. Moreau, H. Vezin, A. Moissette and A. Sachse, Mater. Today Chem., 2022, 26, 101053 CrossRef CAS.
- M. S. Dresselhaus, A. Jorio and R. Saito, Annu. Rev. Condens. Matter Phys., 2010, 1, 89–108 CrossRef CAS.
- F. Tuinstra and J. L. Koenig, J. Chem. Phys., 1970, 53, 1126–1130 CrossRef CAS.
- L. Bokobza, J.-L. Bruneel and M. Couzi, C, 2015, 1, 77–94 Search PubMed.
- A. C. Ferrari and J. Roberston, Phys. Rev. B: Condens. Matter Mater. Phys., 2000, 61, 14095–14107 CrossRef CAS.
- N. D. Charisiou, L. Tzounis, V. Sebastian, S. J. Hinder, M. A. Baker, K. Polychronopoulou and M. A. Goula, Appl. Surf. Sci., 2019, 474, 42–56 CrossRef CAS.
- Y. Rew, A. Baranikumar, A. V. Tamashausky, S. El-Tawil and P. Park, Constr. Build. Mater., 2017, 135, 394–404 CrossRef CAS.
- M. S. Dresselhaus, G. Dresselhaus, R. Saito and A. Jorio, Phys. Rep., 2005, 409, 47–99 CrossRef.
Footnote |
| † Electronic supplementary information (ESI) available. See DOI: https://doi.org/10.1039/d4nj00846d |
| This journal is © The Royal Society of Chemistry and the Centre National de la Recherche Scientifique 2024 |