
 Open Access Article
 This Open Access Article is licensed under a
 Creative Commons Attribution 3.0 Unported Licence
Photoluminescence properties of europium-activated double layered perovskite Sr3Ti2O7 for high-quality lighting applications†
Dhananjay Kumar
Singh
 *ab,
Shriya
Sinha
ac and
Manoj Kumar
Mahata
*d
*ab,
Shriya
Sinha
ac and
Manoj Kumar
Mahata
*d
aDepartment of Physics, Indian Institute of Technology (Indian School of Mines), Dhanbad-826004, India. E-mail: drdksingh.physics@gmail.com
bDepartment of Physics, Government Polytechnic Siwan, Bihar – 841203, India
cDepartment of Physics, Shahid Chandrashekhar Azad Govt. P. G. College, Jhabua, Madhya Pradesh – 457661, India
dThird Institute of Physics, Georg-August-Universität Göttingen, Friedrich-Hund-Platz 1, Göttingen-37077, Germany. E-mail: mmahata@phys.uni-goettingen.de
First published on 13th May 2024
Abstract
We present a comprehensive investigation into the concentration and temperature-dependent photoluminescence (PL) properties of europium ion (Eu3+) activated double-layered perovskite Sr3Ti2O7 materials. We conducted thorough analyses to assess their phase purity, crystal structure, surface morphology, and optical properties to gain a complete understanding. The double-layered perovskite Sr3Ti2O7:Eu3+ exhibited a tetragonal phase with space group I4/mmm. When excited by 395 nm ultraviolet (UV) light, the prepared materials exhibited a firm red emission peak at 616 nm, indicating the hypersensitive electric dipole transition 5D0 → 7F2 in Eu3+ ions. The quantum yield of the optimized sample was estimated to be 18%. To explore the temperature-dependent behavior of the photoluminescence, measurements were carried out over a wide range of temperatures from 300 K to 450 K. Notably, the phosphors demonstrated significant thermal stability, with 75% of the emission intensity retained at 420 K compared to 300 K. These findings signify the material's ability to maintain its luminescent properties at elevated temperatures. The photometric characterization of Sr3Ti2O7:Eu3+ further validated its red emission capability. Moreover, we employed the Judd–Ofelt approach to examine the radiative intensity parameters (Ω2, Ω4, Ω6). The obtained results provide substantial support for the promising prospects of this perovskite material in the rapidly growing field of solid-state lighting and display devices.
Introduction
In recent decades, the scientific community has been confronted with concerns about meeting energy demands. As a result, researchers have been incessantly exploring luminescent materials in search of novel technologies that can address these challenges, particularly in display technology and lighting systems.1–3 Notably, there has been a surge of interest in white light-emitting diodes (W-LEDs) as a potential next-generation solid-state lighting solution, surpassing the traditional fluorescent and incandescent lamps. This interest stems from the superior attributes of W-LEDs, including enhanced energy efficiency, environmental compatibility, high luminous efficiency, compact form factor, rapid response time, and extended operational lifespan.4,5 Thus far, the realization of W-LEDs has commonly relied on the integration of a blue-emitting gallium nitride (GaN) light-emitting diode in combination with yellow light-emitting materials such as yttrium aluminum garnet doped with cerium ions Y3Al5O12:Ce3+.6 However, the resulting devices exhibit a highly correlated color temperature (CCT) and a low color rendering index (CRI < 80) due to the inadequate contribution of red light, thereby limiting their applicability in certain contexts.7,8 Consequently, it becomes imperative to address this issue by developing highly luminescent red phosphors possessing exceptional spectral characteristics that can be efficiently activated in the near-UV range. The enhancement of red-emitting materials has emerged as a prominent area of research within lighting applications, particularly for applications necessitating high-quality color rendering and full-color displays.Among the array of red-emitting species, the Eu3+ ion has garnered significant attention as an excellent doping candidate for W-LEDs. The Eu3+ ion possesses an electronic configuration of [Xe]4f6, wherein the 4f orbitals are effectively shielded from external influences by the closed outer shells of 5s2 and 5p6. Notably, the ground state energy level 7F0 and the highly significant excited state energy level 5D0 of Eu3+ are nondegenerate and remain unaffected by the crystal-field effect exerted by the host material. This important characteristic simplifies the interpretation of experimental absorption and luminescence spectra associated with Eu3+. Consequently, Eu3+ ions have gained recognition as efficient activators, exhibiting narrow emission profiles and superior optical properties due to f–f and f–d transitions. Numerous reports have demonstrated the intense photoluminescence behavior of Eu3+ ions in various host materials, primarily attributed to the 5D0 → 7Fj (j = 0–6). Remarkably, when Eu3+ ions occupy non-centrosymmetric sites, they emit vibrant red light corresponding to the 5D0 → 7F2 transitions.9,10 It is well-established that the optical properties of luminescent materials doped with rare earth ions are profoundly influenced by the characteristics of the host matrix.11 The majority of previous research has focused on the optical properties of rare-earth ion-activated perovskite ATiO3 (A = Ca, Sr, Ba) hosts,11–16 with various applications.17,18 To achieve superior optical properties, it is crucial for the host material, in addition to an appropriate activator, to exhibit chemical and physical stability and low phonon energy. Low-phonon host materials are highly appreciated for enhancing luminescence efficiency by minimizing non-radiative decay losses. These losses, where energy is dissipated as heat rather than light emission, are significantly reduced in materials with low-phonon energy. Consequently, such materials exhibit a higher probability of radiative transitions and longer excited-state lifetimes, resulting in enhanced luminescence efficiency and higher quantum yields. Therefore, host materials with low lattice vibrational energy enable more efficient energy conversion into luminescence. The specific arrangement of Sr and Ti layers in Sr3Ti2O7 influences phonon modes, contributing to an overall lower phonon energy (∼760 cm−1) compared to other materials.19 Thus, Sr3Ti2O7 is an ideal host material for rare-earth ions, facilitating efficient energy transfer processes and supporting the desired optoelectronic properties.
Structurally, Sr3Ti2O7 is closely related to the cubic phase SrTiO3 and represents one of the intergrowth phases, known as Ruddlesden–Popper-RP phases, derived from SrTiO3 with a general formula Sr2(Srn−1TinO3n+1) where n = 2.18,20 Above all, layered perovskite compounds offer the advantage of accommodating higher doping concentrations of rare-earth ions due to the increased distance between layers. Consequently, these compounds serve as excellent host materials for dopants. Zhang et al. initially studied this material and focussed on the charge compensation mechanism and its effect on the luminescence property with the introduction of K+ ions in the lattice of Sr3Ti2O7:Eu3+.21 In the case of Sr3Ti2O7, the material exhibits a tetragonal structure with a specific layer arrangement, comprising three layers of SrO followed by two layers of TiO2. This distinctive structure results in an increased distance between layers compared to SrTiO3. On the other hand, SrTiO3 consists of a more straightforward, single-layer structure with alternating SrO and TiO2 layers.22,23
Thus, this study aims to comprehensively investigate the structural, optical, and spectroscopic properties of layered perovskite Sr3Ti2O7: Eu3+. The ultimate objective of this research is to explore the potential of layered perovskite Sr3Ti2O7: Eu3+ for use in W-LEDs, particularly as a suitable candidate for near-UV LED chips.
Experimental
All the samples were synthesized using the conventional solid-state reaction method, employing stoichiometric relationships of Sr3(1−x)Ti2O7:xEu3+ (x = 0, 1, 2, 3, 5, 7 mol%). The starting precursors, namely SrCO3 (99%, Merck), TiO2 (99%, Merck) and Eu2O3 (99.9% Otto) were of standard grade and were used without further purification. To ensure homogeneity, the chemicals were ground in the presence of ethanol for 2 h using an agate mortar. Subsequently, the mixture was annealed at 1300 °C for 3 h within a programmable electric furnace. Finally, the resulting materials were naturally cooled to room temperature and ground into a fine powder form to facilitate further structural and optical characterizations.The crystalline phases of the prepared perovskite Sr3(1−x)Ti2O7:xEu3+ were determined using a powder X-ray diffractometer (D8 advanced, Brucker) equipped with a Cu tube with Kα radiation (λ = 0.15406 nm), with scanning conducted in the 20°–80° 2θ range. The surface characteristics of the fabricated materials were investigated by using a field emission scanning electron microscope (FESEM), employing the 55-Supra instrument from Germany. Photoluminescence measurements, including decay kinetics, were performed using the Agilent Technologies Cary Eclipse Fluorescence Spectrophotometer. The temperature-dependent photoluminescence spectra were also recorded using the same spectrophotometer equipped with an Optistate DN2 (Oxford Cryostat) for precise temperature control. The quantum yield of the optimized phosphor was determined using the Horiba Acton 2500 Spectrophotometer, with excitation provided by a xenon arc lamp.
Results and discussion
Structural studies: phase purity and morphological analysis
In the present study, investigation of the phase purity and crystal structure of Sr3(1−x)Ti2O7:xEu3+ phosphors was carried out using X-ray diffraction (XRD) analysis. As depicted in Fig. 1(a), the obtained results revealed that the diffraction peaks observed in the prepared samples perfectly matched the Joint Committee on Powder Diffraction Standards (JCPDS) card no. 78-2479. This correspondence indicates that the crystal structure of Sr3Ti2O7 belongs to the space group I4/mmm, characterized by tetragonal symmetry. Within the unit cell of Sr3Ti2O7, two cubic perovskite (SrTiO3) layers are separated by a single SrO layer.18 It is worth mentioning that certain Sr ions occupy positions between the perovskite layers, which are 9 oxygen-ion coordinated sites with C4v symmetry. The distances between the strontium and oxygen atoms, denoted as d (Sr–O) values, were measured to be 0.249 nm, 0.265 nm, and 0.277 nm.20 | ||
| Fig. 1 (a) X-ray diffraction pattern of undoped Sr3Ti2O7 and 5 mol% Eu3+ doped Sr3Ti2O7 with standard JCPDS data. (b) Williamson–Hall plots of undoped Sr3Ti2O7 and 5 mol% Eu3+ doped Sr3Ti2O7. | ||
Additionally, other Sr occupy positions at the center of the perovskite layer, which are 12 oxygen-ion coordinated sites with D4h symmetry. The corresponding d (Sr–O) values for these positions were 0.2760 nm and 0.2764 nm.20 The XRD analysis revealed that the prominent peaks observed at 2θ = 31.72° and 32.41° could be indexed to the Miller indices (105) and (110), respectively. These peaks are particularly noteworthy among the others detected in the diffraction pattern. Notably, the results indicated that introducing Eu3+ dopants did not significantly alter the crystallinity of Sr3Ti2O7. Moreover, the XRD patterns displayed no indications of any additional phases or impurities present in the samples. This observation suggests that the Eu3+ ions were uniformly dispersed throughout the host lattice. The ionic radii of Eu3+ and Sr2+ ions are 1.12 Å and 1.31 Å, respectively, with a coordination number of 9. The ionic radius of the Eu3+ ion is smaller than the ionic radius of Sr2+ ions. So, it would be successfully incorporated into the Sr3Ti2O7 matrix. Thus, we can infer that the Eu3+ ions would occupy the sites of Sr2+ ions in the Sr3Ti2O7 host lattices.21,24 Moreover, a shift toward higher angles in the diffraction peaks was observed due to substituting Sr2+ ions by smaller Eu3+ ions.
The average crystallite size of undoped Sr3Ti2O7 and 5 mol% Eu3+ doped Sr3Ti2O7 was performed utilizing two established equations: the Debye–Scherrer formula and Williamson–Hall (W–H) equation.25,26
The Debye–Scherrer formula, which is widely employed for calculating crystallite size in XRD patterns, and the Williamson–Hall equation, which incorporates additional parameters to account for strain broadening effects, are given by:
 | (1) |
Here, D represents the mean crystallite size, β denotes the full-width half-maxima (FWHM), λ stands for the wavelength of incident X-ray radiation, θ represents the Bragg's angle of diffraction, and ε signifies the micro-strain.
Fig. 1(b) presents the Williamson–Hall plots for Sr3(1−x)Ti2O7:xEu3+ phosphors, which offer valuable insights into the structural parameters. The crystallite size and micro-strain values were calculated using the Debye–Scherrer and Williamson–Hall equations, respectively. A summary of these parameters can be found in Table 1.
| Concentration (mol %) | Crystallite size | Micro-strain (10−3) | ||
|---|---|---|---|---|
| Debye–Scherrer (nm) | Williamson–Hall (nm) | |||
| Eu3+ 0 mol % | 22–55 | 22 | 7.78 | |
| Eu3+ 5 mol % | 21–58 | 29 | 8.16 | |
It is worth noting that there is a slight difference in the crystallite size between the undoped Sr3Ti2O7 and 5 mol% Eu3+ doped Sr3Ti2O7. This disparity can be attributed to the mismatch in ionic radii between the Eu3+ and Sr2+ ions. Introducing Eu3+ ions into the crystal lattice may cause subtle alterations in the crystallite size due to this mismatch.
The surface morphology and microstructure analysis of the undoped Sr3Ti2O7 and 5 mol% Eu3+ doped Sr3Ti2O7 materials were characterized using FESEM. The obtained results are presented in Fig. 2(a and b).
 | ||
| Fig. 2 FESEM image of (a) undoped Sr3Ti2O7 and (b) 5 mol% Eu3+ doped Sr3Ti2O7; (c) and (d) histogram plot of particles distribution of undoped Sr3Ti2O7 and 5 mol% Eu3+ doped Sr3Ti2O7. | ||
In the case of the undoped Sr3Ti2O7 sample, it was observed that the particles exhibited an irregular and agglomerated spherical shape. The average size of these particles was determined to be approximately 180 nm. However, the morphology showed minimal changes upon introducing 5 mol% Eu3+ dopants into the Sr3Ti2O7 lattice. The particle size slightly increased to an average of 225 nm. This variation in particle size can be attributed to the uncontrolled heat flow during the annealing process of the samples. The 5 mol% Eu3+ doped Sr3Ti2O7 had a larger particle size than the undoped Sr3Ti2O7. A histogram was presented to visualize particle distribution, as depicted in Fig. 2(c and d). This representation provides a clear understanding of the particle distribution within the samples.
Overall, the FESEM analysis revealed the surface morphology and particle characteristics of the undoped Sr3Ti2O7 and 5 mol% Eu3+ doped Sr3Ti2O7, highlighting the impact of Eu3+ doping on the particle size and morphology.
Optical properties and Judd–Ofelt analysis
 | ||
| Fig. 3 (a) Variation of the PL emission spectra of Sr3Ti2O7:xEu3+ at various concentrations of Eu3+. The inset shows the PL excitation spectra of 5 mol% doped Sr3Ti2O7. (b) PL decay time profile at three different concentrations of Eu3+. | ||
The excitation spectra of the prepared phosphors were observed while monitoring the emission at 616 nm, corresponding to the 5D0 → 7F2 transition. The excitation spectra exhibited two distinct regions, with the first region corresponding to the charge transfer band (CTB) between the host material and Eu3+ ions, observed at lower wavelengths. In contrast, the second region represented the f–f transitions within the Eu3+ ions, which were visible in the higher wavelength region of the spectrum.
Specifically, the charge transfer band (O2 → Eu3+) appeared at 250 nm, indicating a sufficient covalency between the oxygen 2p orbitals (O2−) and the partially filled f orbital of the Eu3+ ion.
Moreover, the excitation spectra displayed several sharp peaks in the higher wavelength region, attributed to the characteristic f–f transitions of Eu3+ ions.27 These peaks originated from transitions between the ground state 7F0 and various excited states of the Eu3+ ion upon absorption of UV light. These transitions were centered at 382 nm (7F0 → 5L7), 395 nm (7F0 → 5L6), 415 nm (7F0 → 5D3), and 464 nm (7F0 → 5D2).28 Among these sharp and intense peaks, the most prominent one was centered at 395 nm, corresponding to the transition 7F0 → 5L6. This observation suggests that the 5L6 level is highly populated when excited with UV light at 395 nm. Additionally, the excitation spectra of the layered perovskite Sr3Ti2O7:Eu3+ aligned well with near UV LEDs and blue chips, indicating that a 395 nm excitation wavelength is suitable for monitoring the photoluminescence emission spectra of Eu3+ activated Sr3Ti2O7.
Fig. 3(a) depicts the photoluminescence emission spectra of Sr3(1−x)Ti2O7:xEu3+ for various concentrations of Eu3+ ions. The emission spectra were obtained by monitoring the most intense excitation transition 7F0 → 5L6 at 395 nm and recorded in the 450 to 750 nm range. The spectra exhibit a characteristic emission profile attributed to the Eu3+ ions, which consists of 5D0 → 7FJ (J = 1, 2, 3, 4) transitions. Among these transitions, the most prominent peak corresponds to the 5D0 → 7F2 transition at 616 nm. Additionally, several other peaks located at 470, 520, 540, 559, 596, 654, and 701 nm can be assigned to optical transitions 5D2 → 7F0, 5D2 → 7F3, 5D1 → 7F1, 5D1 → 7F2, 5D0 → 7F1, 5D0 → 7F3 and 5D0 → 7F4, respectively.29 The 596 nm transition from 5D1 → 7F1 is known as a magnetic dipole transition, while the 616 nm transition from 5D0 → 7F2 is attributed to the forced electric dipole transition. These transitions are sensitive to the crystal field's symmetry and the local environment.25 The transition from 5D0 → 7F2 is categorized as a “hypersensitive transition”, adhering to the selection rules |S| = 0, |L| ≤ 2, and |J| ≤ 2. Its intensity is significantly influenced by the local symmetry of the Eu3+ ion and the nature of the ligands compared to other electric dipole transitions.30
When the Eu3+ ions occupy a site with low symmetry, the red emission from the 5D0 → 7F2 transition is dominant. On the contrary, if the ions are situated at a site with inversion symmetry, the magnetic dipole transition, denoted as 5D0 → 7F1, assumes a more prominent and influential role. The asymmetry ratio, as shown in Table 2, which measures the ratio of the integrated area of the electric dipole transition 5D0 → 7F2 to the magnetic dipole transition 5D0 → 7F1, indicates that the Eu3+ ion is situated at a site without inversion symmetry, as the ratio is greater than 1. On the other hand, if the magnetic dipole transition 5D0 → 7F1 dominates over the electric dipole transition 5D0 → 7F2, it suggests that the Eu3+ ion is located at a site with inversion symmetry.28,30Fig. 3(a) reveals that as the concentration of Eu3+ ions increases in the layered Sr3Ti2O7 host, the intensity of the 5D0 → 7F2 transition initially increases, reaching its maximum value at 5 mol% of Eu3+ and subsequently decreasing. This decrease in emission intensity is attributed to the phenomenon of concentration quenching. Concentration quenching is observed at higher doping concentrations of Eu3+. Typically, non-radiative energy transfer is responsible for concentration quenching, which can occur because of exchange interactions, light re-absorption, or multipole–multipole interactions. The exact nature of these interactions can be examined using Blasse's equation.31
 | (2) |
| Concentration (mol%) | Ω 2 (pm2) | Ω 4 (pm2) | Transitions | A 0–2,4 (s−1) | A 0–1 (s−1) | A T (s−1) | τ (ms) | β (%) | Asy. Ratio (Rasy) |
|---|---|---|---|---|---|---|---|---|---|
| 1 | 0.784 | 0.017 | 5D0 → 7F1 | 50 | 146.87 | 6.80 | 34.04 | 1.85 | |
| 5D0 → 7F2 | 95.81 | 65.23 | |||||||
| 5D0 → 7F4 | 1.06 | 0.72 | |||||||
| 2 | 0.760 | 0.019 | 5D0 → 7F1 | 50 | 144.16 | 6.93 | 34.68 | 1.79 | |
| 5D0 → 7F2 | 92.97 | 64.49 | |||||||
| 5D0 → 7F4 | 1.19 | 0.82 | |||||||
| 3 | 0.757 | 0.017 | 5D0 → 7F1 | 50 | 145.31 | 6.88 | 34.40 | 1.81 | |
| 5D0 → 7F2 | 94.27 | 64.87 | |||||||
| 5D0 → 7F4 | 1.04 | 0.66 | |||||||
| 5 | 0.741 | 0.016 | 5D0 → 7F1 | 50 | 141.64 | 7.59 | 35.30 | 1.74 | |
| 5D0 → 7F2 | 90.65 | 64.00 | |||||||
| 5D0 → 7F4 | 0.99 | 0.67 | |||||||
| 7 | 0.730 | 0.015 | 5D0 → 7F1 | 50 | 140.15 | 7.13 | 35.67 | 1.72 | |
| 5D0 → 7F2 | 89.20 | 63.65 | |||||||
| 5D0 → 7F4 | 0.95 | 0.67 |
Here, Rc denotes the critical separation distance between Eu3+–Eu3+ ions, V represents the unit cell volume, C represents the optimal concentration of Eu3+ ions, and N signifies the number of Sr2+ ions in the unit cell.
Using V = 310 Å3, C = 0.05 and N = 2 for the Sr3Ti2O7 host, Rc was obtained as ∼18 Å. This Rc value (>5 Å) suggested that the concentration quenching phenomenon is exclusively attributed to the multipole–multipole interaction.
Time-resolved decay measurements were conducted with an excitation wavelength of 395 nm, targeting the electric dipole transition 5D0 → 7F2 of Eu3+. Fig. 3(b) shows the decay curves at three different concentrations of Eu3+ (3 mol%, 5 mol% and 7 mol%) doped Sr3Ti2O7 phosphors. All the decay transients were effectively matched using a bi-exponential formula, as represented by eqn (3):
 | (3) |
I(t) represents the intensities at time t, and A1 and A2 are the weighting constant parameters. τ1 and τ2 correspond to the associated lifetimes. The mean decay time can be delineated using these factors as per ref. 32 and 33:
 | (4) |
The presence of a bi-exponential decay can be attributed to two main possible explanations. Firstly, it could be due to a difference in the non-radiative probability of decay for rare-earth ions at or near the surface and rare-earth ions in the core of the particles. Another is the inhomogeneous distribution of the rare-earth ions in the host material, leading to the variation in the local concentration.32 The decay times for 3 mol%, 5 mol% and 7 mol% Eu3+ doped Sr3Ti2O7 were determined as 0.50 ms, 0.37 ms and 0.27 ms, respectively. Introducing Eu3+ ions into Sr3Ti2O7 during the doping process creates certain defects that function as trapping centers for charge carriers. Consequently, the obtained decay time results suggest that the depth of these traps is relatively shallow, facilitating a rapid escape of charge carriers from the traps. This quick escape leads to a fast recombination rate within the millisecond range (ms).
The expression for the radiative emission rate is stated as follows:
 | (5) |
In this context, I0→j denotes the integrated emission intensity, and hυ0→j represents the energy associated with the 5D0 → 7Fj (j = 1, 2, 4). In the scenario of a magnetic dipole transition, its characteristics remain unaltered by the crystal field. Therefore, the magnetic dipole radiative transition rate, denoted A0→1, is regarded as the s constant at 50 s−1.
The spontaneous emission rate as a function of J–O parameters can be expressed as:
 | (6) |
Here, e denotes the elementary charge, and χ = n (n2 + 2)2/9 represents the Lorentz local field correction factor, which is dependent on the host's refractive index n (with a value of 2.25). The square reduced matrix elements that are not equal to zero are 〈5D0|U(2)|7F2〉2, which is 0.0032, and 〈5D0|U(4)|7F4〉2, which is 0.0023, and it typically does not depend on the host.35,36 Consequently, the Judd–Ofelt parameters for experimental intensity can be computed by analyzing the intensity ratio related to the transition 5D0 → 7F2,4.
By utilizing the equation below, the total radiative transition probability, denoted as AT, can be computed:
 | (7) |
Furthermore, the radiative lifetime of an excited state in terms of AT, is given by:
 | (8) |
The branching ratio, denoted as β(ψJ), assesses the proportion of emission attributed to a particular transition from a state in comparison to all other transitions originating from that state. It can be calculated using the following expression:
 | (9) |
The J–O analysis reveals a consistent trend across all compositions of Sr3(1−x)Ti2O7:xEu3+, indicating that Ω2 > Ω4. This trend demonstrates the covalence between Eu3+ and O2− and the notable asymmetry present at the Eu3+ site. A higher value of β(ψJ) suggests that the 5D0 → 7F2 transition (electrical dipole) shows increased sensitivity. This validates the enhanced and intense red emission observed in this layered perovskite material. For a comprehensive overview, the J–O parameters are summarized in Table 2.
Fig. 4 illustrates the temperature-dependent PL emission of Sr3Ti2O7 phosphors doped with 5 mol% Eu3+. The measurements were performed using a 395 nm UV excitation over a wide temperature range of 300–450 K. It is widely recognized that thermal quenching mechanisms vary across different luminescent materials. The rapid decline in PL emission intensity with increasing temperature can be attributed to non-radiative processes. As the temperature rises, these non-radiative pathways become more dominant, reducing the luminescent output.
 | ||
| Fig. 4 Temperature-dependent PL emission spectra of 5 mol% doped Sr3Ti2O7 phosphor upon 395 nm UV excitation source. | ||
The probability of non-radiative transitions is directly proportional to the absolute temperature. Consequently, higher temperatures lead to an increased probability of non-radiative transitions, resulting in a decrease in PL emission intensity. Notably, the emission intensity of Sr3Ti2O7 doped with 5 mol% Eu3+ exhibits remarkable retention, maintaining 75% of its initial value at 420 K compared to that at 300 K, as shown in Fig. 5(a). At room temperature, the radiative transition from the excited state 5D0 to the ground state 7F0 remains independent of temperature. However, as the temperature rises, the excited electrons acquire sufficient thermal energy to reach the crossover point between the 5D0 excited state and the CTB, and subsequently relax to another crossover point between the 7F0 state and the CTB. From this point, they undergo non-radiative transitions to reach the ground state.37 The occurrence of non-radiative transitions increases at the crossover point, which represents the intersection between the ground state and the excited state of the Eu3+ ion.
 | ||
| Fig. 5 (a) Variation of emission intensity as a function of temperature within 300–450 K for 5 mol% doped Sr3Ti2O7 phosphor and (b) the Arrhenius plot for calculating activation energy. | ||
To comprehend the thermal quenching behavior of the layered Sr3(1−x)Ti2O7:xEu3+ materials, the activation energy serves as an important parameter. It can be estimated using the Arrhenius equation,25,37 which is expressed as follows:
 | (10) |
Emission intensity at different temperatures (T) is denoted by IT, I0 represents the intensity at the starting temperature, A denotes the frequency factor, ΔEa represents the activation energy, and k is the Boltzmann constant. By plotting ln[I0/IT − 1] against 1/T, as shown in Fig. 5(b), the slope of the graph is equal to (−ΔEa/k), allowing the calculation of the activation energy. In this instance, the determined activation energy was identified to be 0.10 eV. The thermally activated nonradiative transition rate is inversely proportional to the activation energy (ΔEa). Therefore, with an activation energy of 0.10 eV, it serves as a potential barrier for the electrons, preventing the occurrence of thermal quenching phenomena.
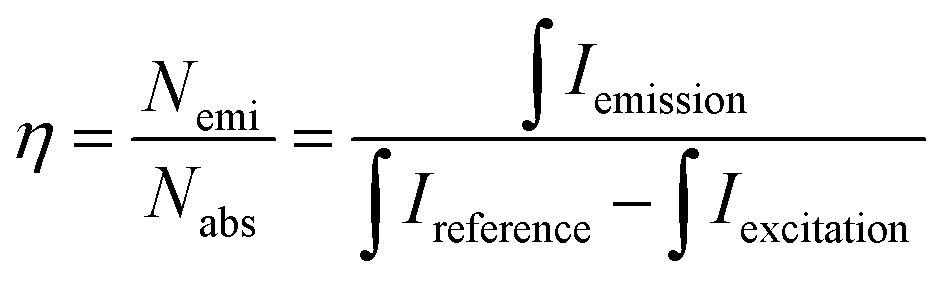
Furthermore, the absolute quantum yield is a significant characteristic reflecting light-emitting materials' performance and suitability for solid-state lighting applications. The quantum yield (η) quantifies the proportion of emitted photons (Nemi) relative to the absorbed photons (Nabs) in a specimen.38,39 The subsequent equation has been employed for computing the value of ‘η’:
 | (11) |
In this equation, Iemission represents the integral of the emission curve for the sample, Ireference is the integral of the emission curve obtained by scanning over the excitation peak in the absence of the fluorescence sample, and Iexcitation corresponds to the integral of the excitation peak in the presence of the sample. The evaluations were conducted utilizing an integrating sphere to measure the sample. The quantum yield was calculated for optimized 5 mol% Eu3+ doped Sr3Ti2O7 phosphor using a 395 nm UV light source. The quantum yields of various other Eu3+ doped phosphors are presented in Table 3.40–49
| Materials | Excitation wavelength (nm) | Emission wavelength (nm) | Quantum yield (%) | Ref. |
|---|---|---|---|---|
| BaZrO3:Eu3+ | 279 | 625 | 14 | 40 |
| 0.8ZnO–0.2SrO–Al2O3:Eu3+ | 393 | 620 | 12 | 41 |
| ZrO2:Eu3+ | 395 | 606 and 615 | 4.8 | 42 |
| AlPO4:Eu3+ | 392 | 594 | 22 | 43 |
| SrVO3:Eu3+ | 420 | 500 | 14.36 | 44 |
| CaMoO4:Eu3+ | 395 | 616 | 12.78 | 45 |
| Dy3+ doped Ca2ZnSi2O7:Eu3+ | 394 | 615 | 12.88 | 46 |
| GdBO3:Eu3+ | 391 | 591 | 14.3 | 47 |
| YVO4:Eu3+ | 310 | 619 | 55.5 | 48 |
| Y2O3:Eu3+ | 395 | 623 | 23 | 49 |
| Sr3Ti2O7:Eu3+ | 395 | 616 | 18 | This work |
The phosphor demonstrates a notable quantum efficiency of 18%. In comparison, the widely known-Eu3+ doped Y2O3 and YVO4 phosphors have a higher quantum yield.48,49 For rare earth-doped YVO4, a special benefit of host sensitization is obtained, as evidenced by our previous works.50–52 Based on the provided data, it can be inferred that the Sr3Ti2O7:5 mol% Eu3+ phosphor exhibits characteristics conducive to solid-state lighting applications.
![[x with combining macron]](https://www.rsc.org/images/entities/i_char_0078_0304.gif) (λ), ȳ(λ) and
(λ), ȳ(λ) and ![[z with combining macron]](https://www.rsc.org/images/entities/i_char_007a_0304.gif) (λ), which are referred to as color-matching functions. These functions play a crucial role in determining the color of a light source. The CIE tristimulus values are computed by mathematically integrating the spectral data, providing a means to determine the color coordinates.
(λ), which are referred to as color-matching functions. These functions play a crucial role in determining the color of a light source. The CIE tristimulus values are computed by mathematically integrating the spectral data, providing a means to determine the color coordinates.
 | ||
| Fig. 6 Absorption spectra in the UV-visible range, obtained through diffuse reflectance mode of undoped Sr3Ti2O7 and 5 mol% Eu3+ doped Sr3Ti2O7 phosphors. The inset in the figure displays Kubelka–Munk plots used for determining the optical band gap energy of the two samples. | ||
The tristimulus values X, Y, and Z are expressed by the following equations:
 | (12) |
The CIE color co-ordinate can be calculated by using the tristimulus values through the following relationships53
 | (13) |
The CIE image shown in Fig. S2(a) (ESI†) indicates that the CIE color coordinates for layered Sr3(1−x)Ti2O7:xEu3+ shift towards the pure red region as the doping concentration of Eu3+ increases. This shift is observed from the coordinates (0.62, 0.34) to (0.64, 0.31), corresponding to the characteristic emission region of Eu3+ ions.
However, when subjected to elevated temperatures, as shown in Fig. S2(b) (ESI†), the optimized composition of 5 mol% Eu3+ doped Sr3Ti2O7 exhibits consistent color coordinates. At 300 K, the coordinates are (0.57, 0.38), and at 450 K, they remain the same (0.57, 0.38). This indicates that the prepared phosphor demonstrates remarkable thermal stability even at elevated temperatures. To assess the quality of the emitted light, it is important to estimate the correlated color CCT values of the prepared samples. The CCT values are determined using the McCamy empirical relationship,54,55 given by:
| CCT = −437n3 + 3601n2 − 6861n + 5514.31 | (14) |
(xe, ye) represents the epicenters of the convergence. By calculating the CCT values using the CIE chromaticity coordinates obtained from the PL emission spectra, it was found that the values range from 2412 to 3452 K for the layered Sr3(1−x)Ti2O7:xEu3+. The optimized composition of 5 mol% Eu3+ doped Sr3Ti2O7 exhibits a CCT value of 3452 K.
Typically, warm light used in home appliances has CCT values below 5000 K, while CCT values above 5000 K are suitable for cold light.56 Therefore, the prepared phosphors can be considered as candidates for warm light emission.
Furthermore, the purity of the red color emitted from the layered Sr3(1−x)Ti2O7:xEu3+ was evaluated using the following relationship:16
 | (15) |
| Concentration/Temperature | Color coordinate | CCT (K) | Color purity (%) | |
|---|---|---|---|---|
| X | Y | |||
| 1 mol% | 0.62 | 0.34 | 2412 | 84.02 |
| 2 mol% | 0.64 | 0.34 | 2693 | 89.41 |
| 3 mol% | 0.64 | 0.33 | 3027 | 89.25 |
| 5 mol% | 0.64 | 0.32 | 3452 | 89.18 |
| 7 mol% | 0.64 | 0.31 | 3027 | 89.25 |
| 300 K | 0.57 | 0.38 | 1710 | 72.34 |
| 330 K | 0.57 | 0.38 | 1710 | 72.34 |
| 360 K | 0.56 | 0.38 | 1715 | 69.72 |
| 390 K | 0.56 | 0.37 | 1710 | 69.10 |
| 420 K | 0.57 | 0.38 | 1717 | 73.03 |
| 450 K | 0.57 | 0.38 | 1710 | 69.10 |
The electronic properties can be understood by investigating their band gap, which is a crucial parameter for optoelectronic device applications. To determine the optical band gap for layered Sr3(1−x)Ti2O7:xEu3+, the Kubelka–Munk method57,58 is employed using the DR spectra. The Kubelka–Munk function [F(Rα)] can be expressed in terms of Rα as:
 | (16) |
Here, Rα represents the ratio of the sample's reflectance (Rsample) to the reference's reflectance (Rreference), and K and S denote the absorption and scattering coefficients, respectively. The Tauc equation58 establishes a connection between the absorption coefficient (α) and the incident photon energy (hυ) for determining the optical bandgap. It is expressed as:
| αhυ = C(hυ − Eg)n/2 | (17) |
In this context, υ denotes the frequency of the incident photon, Eg represents the ascertained optical band gap of the samples, C is a constant independent of energy, and assuming a direct allowed transition, n is considered to be 1. In the case of perfect diffuse scattering, it is assumed that, K = 2α and S remains constant throughout the wavelength of measurement.
To make the Tauc equation compatible with the Kubelka–Munk function and the associated absorption parameters, it can be modified as follows58,59:
| F(R∞)hυ = C(hυ − Eg)n/2 | (18) |
The inset of Fig. 6 illustrates the plot of [F(Rα)hυ]2vs. hυ, where the Kubelka–Munk function and frequency are squared. By extrapolating the linear region of the plot to [F(Rα)hυ]2 = 0, the optical band gap can be estimated. For both Sr3Ti2O7 and 5 mol% Eu3+ doped Sr3Ti2O7 materials, the obtained band gaps were found to be 3.03 eV and 3.07 eV, respectively, demonstrating their close proximity to each other.
Conclusions
The experimental results obtained in this study reveal that layered perovskite Sr3(1−x)Ti2O7:xEu3+ has a tetragonal crystal structure with space group I4/mmm. When excited with 395 nm light, Sr3(1−x)Ti2O7:xEu3+ exhibits strong photoluminescence behavior attributed to the transitions 5D0 → 7Fj (j = 0–6) in the Eu3+ ion. Notably, when Eu3+ ions occupy the non-centrosymmetric sites, they emit intense and sharp light at 616 nm, corresponding to the hypersensitive transitions 5D0 → 7F2. The observed value of Rc (∼18 Å) confirms the concentration quenching phenomenon, indicating that multipole interactions play a role in the reduction of luminescence intensity with increasing dopant concentration. The optimized 5 mol% Eu3+ doped Sr3Ti2O7 sample's quantum yield was 18%, indicating its suitability for efficient light emission.The material also demonstrates favorable thermal stability, retaining 75% of the emission intensity at 420 K. The activation energy, determined to be 0.10 eV, indicates the energy barrier that prevents thermal quenching phenomena. Furthermore, the Judd–Ofelt analysis reveals a trend where Ω2 > Ω4 for all compositions of Sr3(1−x)Ti2O7:xEu3+, indicating covalence between Eu3+ and O2− ions as well as a high degree of asymmetry at the Eu3+ sites. Additionally, the materials exhibit a millisecond-level lifetime for the 5D0 state, stable CIE chromaticity coordinates, high color purity, and a CCT value suitable for lighting applications. These characteristics collectively suggest that the prepared layered perovskite Sr3(1−x)Ti2O7:xEu3+ has great potential as a candidate for various lighting applications.
Author contributions
Dhananjay Kumar Singh: Conceptualization, Formal analysis, Investigation, Methodology, Writing – original draft. Shriya Sinha: Methodology, Formal analysis, Writing – review & editing. Manoj Kumar Mahata: Formal analysis, Supervision, Writing – review & editing.Conflicts of interest
The authors declare no conflicts of interest regarding this article.Acknowledgements
M. K. M. gratefully acknowledges the support from the Alexander von Humboldt (AvH) Foundation, Germany.Notes and references
- M. A. Triana, E. L. Hsiang, C. Zhang, Y. Dong and S. T. Wu, Luminescent Nanomaterials for Energy-Efficient Display and Healthcare, ACS Energy Lett., 2022, 7, 1001–1020 CrossRef CAS.
- J. Meyer and F. Tappe, Photoluminescent Materials for Solid-State Lighting: State of the Art and Future Challenges, Adv. Opt. Mater., 2015, 3, 424–430 CrossRef CAS.
- S. Sinha, M. K. Mahata and K. Kumar, Up/down-converted green luminescence of Er3+–Yb3+ doped paramagnetic gadolinium molybdate: a highly sensitive thermographic phosphor for multifunctional applications, RSC Adv., 2016, 6, 89642–89654 RSC.
- L. Chen, C. C. Lin, C. W. Yeh and R. S. Liu, Light Converting Inorganic Phosphors for White Light-Emitting Diodes, Materials, 2010, 3, 2172–2195 CrossRef CAS.
- R. Zhang, H. Lin, Y. yu, D. Chen, J. Xu and Y. Wang, A new-generation color converter for high-power white LED: transparent Ce3+: YAG phosphor-in-glass, Laser Photonics Rev., 2014, 8, 158–164 CrossRef CAS.
- X. He, X. Liu, R. Li, B. yang, K. Yu, M. Zeng and R. Yu, Effects of local structure of Ce3+ ions on luminescent properties of Y3Al5O12: Ce nanoparticles, Sci. Rep., 2016, 6, 22238 CrossRef CAS PubMed.
- S. K. Gupta, R. M. Kadam and P. K. Pujari, Lanthanide spectroscopy in probing structure-property correlation in multi-site photoluminescent phosphors, Coord. Chem. Rev., 2020, 420, 213405 CrossRef CAS.
- D. K. Singh, K. Mondal and J. Manam, Improved photoluminescence, thermal stability and temperature sensing performances of K+ incorporated perovskite BaTiO3:Eu3+ red emitting phosphors, Ceram. Int., 2017, 43, 13602–13611 CrossRef.
- X. Gong, H. Jiang, M. Cao, Z. Rao, X. Zhao and A. Vomiero, Eu-doped ZnO quantum dots with solid-state fluorescence and dual emission for high-performance luminescent solar concentrators, Mater. Chem. Front., 2021, 5, 4746–4755 RSC; P. Du, W. Ran, Y. Hou, L. Luo and W. Li, Eu3+-Activated NaGdF4 Nanorods for Near-Ultraviolet Light-Triggered Indoor Illumination, ACS Appl. Nano Mater., 2019, 2(7), 4275–4285 CrossRef CAS.
- N. Katumo, G. Gao, F. Laufer, B. S. Richards and I. A. Howard, Smartphone-based luminescent thermometry via temperature-sensitive delayed fluorescence from Gd2O2S: Eu3+, Adv. Opt. Mater., 2020, 8, 2000507 CrossRef CAS; R. Chatterjee, S. Saha, D. Sen, K. Panigrahi, U. K. Ghorai, G. C. Das and K. K. Chattopadhyay, Neutralizing the Charge Imbalance Problem in Eu3+-Activated BaAl2O4 Nanophosphors: Theoretical Insights and Experimental Validation Considering K+ Co-doping, ACS Omega, 2018, 3, 788–800 CrossRef PubMed.
- D. K. Singh and J. Manam, Investigation of structural, spectral and photometric properties of CaTiO3:Dy3+ nanophosphors for the lighting applications, Electron. Mater. Lett., 2017, 13, 292–301 CrossRef CAS.
- M. K. Mahata, K. Kumar and V. K. Rai, Structural and optical properties of Er3+/Yb3+ doped barium titanate phosphor prepared by co-precipitation method, Spectrochim. Acta, Part A, 2014, 124, 285–291 CrossRef CAS PubMed.
- P. P. Sukul, M. K. Mahata, U. K. Ghorai and K. Kumar, Crystal phase induced upconversion enhancement in Er3+/Yb3+ doped SrTiO3 ceramic and its temperature sensing studies, Spectrochim. Acta, Part A, 2019, 212, 78–87 CrossRef CAS PubMed.
- M. K. Mahata, T. Koppe, K. Kumar, H. Hofsäss and U. Vetter, Upconversion photoluminescence of Ho3+–Yb3+ doped barium titanate nanocrystallites: Optical tools for structural phase detection and temperature probing, Sci. Rep., 2020, 10, 8775 CrossRef CAS PubMed.
- S. P. Tiwari, M. K. Mahata, K. Kumar and V. K. Rai, Enhanced temperature sensing response of upconversion luminescence in ZnO–CaTiO3: Er3+/Yb3+ nano-composite phosphor, Spectrochim. Acta, Part A, 2015, 150, 623–630 CrossRef CAS PubMed.
- D. K. Singh and J. Manam, Optical spectroscopic and thermal quenching behaviour of perovskite SrTiO3:Sm3+ orange emitting phosphors for lighting applications, J. Mater. Sci.: Mater. Electron., 2018, 29, 5588 Search PubMed.
- L. Zhang, B. Sun, Q. Liu, N. Ding, H. Yang, L. Wang and Q. Zhang, Novel layered perovskite Sr3Ti2O7:Eu3+ phosphor with high-efficiency luminescence enhanced by charge compensation, J. Alloys Compd., 2016, 657, 27–31 CrossRef CAS.
- V. Jeyalakshmi, R. Mahalakshmy, K. Ramesh, P. V. C. Rao, N. V. Choudary, G. S. Ganesh, K. Thirunavukkarasu, K. R. Krishnamurthy and B. Viswanathan, Visible light driven reduction of carbon dioxide with water on modified Sr3Ti2O7 catalysts, RSC Adv., 2015, 5, 5958 RSC.
- S. Kamba, P. Samoukhina, F. Kadlec, J. Pokorný, J. Petzelt, I. M. Reaney and P. L. Wise, Composition dependence of the lattice vibrations in Srn+1TinO3n+1 Ruddlesden–Popper homologous series, J. Eur. Ceram. Soc., 2003, 23(14), 2639–2645 CrossRef CAS.
- Y. Inaguma, D. Nagasawa and T. Katsumata, Photoluminescence of Praseodymium-Doped Srn+1TinO3n+1 (n = 1, 2, ∞), Jpn. J. Appl. Phys., 2005, 44, 761 CrossRef CAS.
- L. Zhang, B. Sun, Q. Liu, N. Ding, H. Yang, L. Wang and Q. Zhang, Novel layered perovskite Sr3Ti2O7: Eu3+ phosphor with high-efficiency luminescence enhanced by charge compensation, J. Alloys Compd., 2016, 657, 27–31 CrossRef CAS.
- W. Ge, C. Zhu, H. An, Z. Li, G. Tang and D. Hou, Sol–gel synthesis and dielectric properties of Ruddlesden–Popper phase Srn+1TinO3n+1 (n = 1, 2, 3, ∞), Ceram. Int., 2014, 40, 1569–1574 CrossRef CAS.
- M. Tang, P. Fuierer, P. Dickens and E. Fu, Irradiation study on Srn+1TinO3n+1 Ruddlesden-Popper phases synthesized by hot-forging, Phys. Status Solidi C, 2013, 10, 216–220 CrossRef CAS.
- R. Ganguly, V. Siruguri, I. K. Gopalakrishnan and J. V. Yakhmi, Stability of the layered Sr3Ti2O7 structure in La1.2(Sr1−xCax)1.8Mn2O7, J. Phys.: Condens. Matter, 2000, 12, 1683–1689 CrossRef CAS.
- D. K. Singh, K. Mondal and J. Manam, Efficient dual emission mode of green emitting perovskite BaTiO3: Er3+ phosphors for display and temperature sensing applications, Ceram. Int., 2017, 43, 13602–13611 CrossRef.
- S. Sinha, M. K. Mahata and K. Kumar, Enhancing the upconversion luminescence properties of Er3+–Yb3+ doped yttrium molybdate through Mg2+ incorporation: effect of laser excitation power on temperature sensing and heat generation, New J. Chem., 2019, 43, 5960–5971 RSC.
- Q. Lv, X. ma, Y. Dong, Y. Li, B. Shao, C. Wang, S. Yang and C. Wang, Blue light-excitable Eu-doped yellow emitting borate KSr4B3O9 phosphor for white light-emitting diodes, J. Am. Ceram., 2022, 105, 7374–7383 CrossRef CAS.
- M. Rajendran and S. Vaidyanathan, A Novel Highly Efficient Host-Sensitized Red Emitting (Ba2YV3O11:
![[thin space (1/6-em)]](https://www.rsc.org/images/entities/char_2009.gif) Eu3+) Phosphor for Hybrid White LEDs, Chemistry Select, 2020, 5, 5128–5136 CAS.
Eu3+) Phosphor for Hybrid White LEDs, Chemistry Select, 2020, 5, 5128–5136 CAS. - J. Petry, R. Komban, C. Gimmler and H. Weller, Simple one pot synthesis of luminescent europium doped yttrium oxide Y2O3: Eu nanodiscs for phosphor converted warm white LEDs, Nanoscale Adv., 2022, 4, 858–864 RSC.
- R. Bajaj, A. S. Rao and G. V. Prakash, Linear and nonlinear photoluminescence from thermally stable KYF4:Eu3+ cubic nanocrystals, J. Alloys Compd., 2021, 885, 160893 CrossRef CAS.
- G. Blasse, Energy transfer between inequivalent Eu2+ ions, J. Solid State Chem., 1986, 62, 207–211 CrossRef CAS.
- S. Dutta, S. Som and S. K. Sharma, Excitation spectra and luminescence decay analysis of K+ compensated Dy3+ doped CaMoO4 phosphors, RSC Adv., 2015, 5, 7380–7387 RSC.
- S. Sinha and K. Kumar, Studies on up/down-conversion emission of Yb3+ sensitized Er3+ doped MLa2(MoO4)4 (M = Ba, Sr and Ca) phosphors for thermometry and optical heating, Opt. Mater., 2018, 75, 770–780 CrossRef CAS.
- C. A. Kodaira, H. F. Brito and M. C. F. C. Felinto, Luminescence investigation of Eu3+ ion in the RE2(WO4)3 matrix (RE = La and Gd) produced using the pechini method, J. Solid State Chem., 2003, 171, 401–407 CrossRef CAS.
- V. Mahalingam and J. Thirumalai, Facile hydrothermal synthesis and pulsed laser deposition of Ca0.5Y1−x(WO4)2: xEu3+ phosphors: investigations on the luminescence, Judd–Ofelt analysis and charge compensation mechanism, New J. Chem., 2017, 41, 493–502 RSC.
- D. L. Shruthi, A. J. Reddy, G. N. A. Kumar and C. K. Jayasankar, Judd Ofelt theoretical analysis, Photoluminescence properties of Eu3+ activated LiGd(WO4)2 phosphors, J. Lumin., 2020, 222, 111167 CrossRef.
- F. Chen, M. N. Akram and X. Chen, Improved Photoluminescence Performance of Eu3+-Doped Y2(MoO4)3 Red-Emitting Phosphor via Orderly Arrangement of the Crystal Lattice, Molecules, 2023, 28, 1014 CrossRef CAS PubMed.
- B. P. Singh, A. K. Parchur, R. S. Ningthoujam, A. A. Ansari, P. Singh and S. B. Rai, Dalton Trans., 2014, 43, 4779–4789 RSC.
- N. Verma, M. M. Domanska, T. Ram, J. Kaur, A. K. Misra, V. Dubey, N. Dubey, K. Tiwari and M. C. Rao, Optimizing the luminescence efficiency of an europium (Eu3+) doped SrY2O4 phosphor for flexible display and lighting applications, RSC Adv., 2023, 13, 20217–20228 RSC.
- S. K. Gupta, H. Abdou, C. U. Segre and Y. Mao, Nanomaterials, 2022, 12, 3028 CrossRef CAS PubMed.
- Revupriya, P. S. Anjana, N. Gopakumar and M. S. Anju, Mater. Res. Express, 2020, 7, 026203 CrossRef.
- A. A. Nashivochnikov, A. I. Kostyukov, A. V. Zhuzhgov, M. I. Rakhmanova, S. V. Cherepanova and V. N. Snytnikov, Opt. Mater., 2021, 121, 111620 CrossRef CAS.
- Y. Liu, Z. Yang and Q. Yu, J. Alloys Compd., 2011, 509, L199–L202 CrossRef CAS.
- M. R. Patel, T. J. Park and S. K. Kailasa, J. Photochem. Photobiol., A, 2024, 449, 115376 CrossRef CAS.
- F. B. Cao, L. S. Li, Y. W. Tian, Y. J. Chen and X. R. Wu, Thin Solid Films, 2011, 519, 7971–7976 CrossRef CAS.
- K. Mondal and J. Manam, J. Lumin., 2018, 195, 259–270 CrossRef CAS.
- Z. Leng, N. Zhang, Y. Liu, L. Li and S. Gan, Appl. Surf. Sci., 2015, 330, 270 CrossRef CAS.
- L. Yang, G. Li, M. Zhao, J. Zheng, X. Guan and L. Li, Preparation and morphology-sensitive luminescence properties of Eu3+-doped YVO4: a defect chemistry viewpoint of study, CrystEngComm, 2012, 14, 3227–3235 RSC.
- D. Stefańska, M. Stefański and P. J. Dereń, Synthesis and spectroscopic characterization of the K4BaSi3O9:Eu3+, Opt. Mater., 2014, 37, 410–413 CrossRef.
- M. K. Mahata, T. Koppe, K. Kumar, H. Hofsäss and U. Vetter, Demonstration of temperature dependent energy migration in dual-mode YVO4: Ho3+/Yb3+ nanocrystals for low temperature thermometry, Sci. Rep., 2016, 6, 36342 CrossRef PubMed.
- M. K. Mahata, K. Kumar and V. K. Rai, Er3+–Yb3+ doped vanadate nanocrystals: A highly sensitive thermographic phosphor and its optical nanoheater behaviour, Sens. Actuators, B, 2015, 209, 775–780 CrossRef CAS.
- M. K. Mahata, S. P. Tiwari, S. Mukherjee, K. Kumar and V. K. Rai, YVO4: Er3+/Yb3+ phosphor as multifunctional applications, J. Opt. Soc. Am. B, 2014, 31, 1814–1821 CrossRef CAS.
- J. P. C. do Nascimento, F. F. do Carmo, M. X. Facanha, J. E. V. de Morais, A. J. M. Sales, H. D. de Andrade, I. S. Q. Junior and A. S. B. Sombra, Visible and near-infrared luminescent properties of Pr3+/Yb3+ co-doped lanthanum ortho-niobate phosphors, Opt. Mater., 2019, 97, 109399 CrossRef CAS.
- C. S. McCamy, Correlated color temperature as an explicit function of chromaticity coordinates, Color Res. Appl., 1992, 17, 142–144 CrossRef.
- M. K. Raju, R. K. Samudrala, P. Yadav and A. Azeem, Color-Tunable Eu3+, Eu2+-Activated CaSiO3 Nano Phosphor Extract from Agricultural-Recycling-Food-Waste Materials for Display Applications, Adv. Photonics Res., 2023, 4, 2200266 CrossRef.
- A. Ghosh, P. Selvaraj, S. Sundaram and T. K. Mallick, The colour rendering index and correlated colour temperature of dye-sensitized solar cell for adaptive glazing application, Sol. Energy, 2018, 163, 537–544 CrossRef CAS.
- P. Kubelka, New Contributions to the Optics of Intensely Light-Scattering Materials. Part I, J. Opt. Soc. Am., 1948, 38, 448–457 CrossRef CAS PubMed.
- A. E. Morales, E. S. Mora and U. Pal, Use of diffuse reflectance spectroscopy for optical characterization of un-supported nanostructures, Rev. Mex. Fis. S, 2007, 53, 18–22 CAS.
- M. K. Mahata, T. Koppe, T. Mondal, C. Brusewitz, K. Kumar, V. K. Rai, H. Hofsass and U. Vetter, Incorporation of Zn2+ ions into BaTiO3:Er3+/Yb3+ nanophosphor: an effective way to enhance upconversion, defect luminescence and temperature sensing, Phys. Chem. Chem. Phys., 2015, 17, 20741 RSC.
Footnote |
| † Electronic supplementary information (ESI) available. See DOI: https://doi.org/10.1039/d4nj00551a |
| This journal is © The Royal Society of Chemistry and the Centre National de la Recherche Scientifique 2024 |