 Open Access Article
Regulating the particle sizes of NaA molecular sieves toward enhanced heavy metal ion adsorption†
WenLi
Cui‡
a,
Ke
Tang‡
a,
Yunqiang
Chen
b,
Zhou
Chen
 a,
Yihong
Lan
b,
YuBin
Hong
*b and
WeiGuang
Lan
*ab
aXiamen University Center for Membrane Application and Advancement, College of Materials, Xiamen University, Xiamen 361005, Fujian, China. E-mail: wglan@xmu.edu.cn
bSuntar Membrane Technology (Xiamen) Co., Ltd., Xiamen 361022, Fujian, China. E-mail: hongyb@suntar.com
First published on 26th March 2024
Abstract
Heavy metal ions have a serious effect on humans and the ecosystem. Molecular sieves have attracted significant attention in heavy metal ion adsorption with distinct microporosity and uniform pore size. In this paper, we successfully synthesized nano-sized NaA molecular sieves in the presence of an organic templating agent while aluminum isopropoxide and silica sol were used as the aluminum and silica sources. To synthesize molecular sieves of the ideal size, the anionic cation concentration and templating agent were adjusted. The findings of Cu(II) and Pb(II) adsorption on NaA molecular sieves showed that under the ideal conditions of adsorption time at 90 minutes, pH = 5, adsorption temperature at 25 °C, and starting adsorbent concentration at 100 mg g−1, the optimal adsorbing capacity could reach 230 mg g−1 and 600 mg g−1, respectively. Isotherm, kinetic, thermodynamic and reusability studies of heavy metal ion adsorption on NaA molecular sieves were carried out to investigate the adsorption kinetics. This work provides a new avenue to regulate the particle sizes of molecular sieves to enhance the adsorption capacity of heavy metal ions.
1. Introduction
Heavy metal ions, which are widely employed as crucial raw materials in industrial production, including printing, electroplating, metallurgy, textiles, metal processing, ceramics, and many other industries, pose a serious threat to the environment and human health. Because heavy metal ions cannot be broken down by organisms, they persist for a long time in the human body. High levels of copper in the body can cause headaches, vomiting, nausea, liver and kidney failure, respiratory problems and abdominal pain.1 Furthermore, lead damages the kidneys, liver, reproductive system and brain function.2 A buildup of heavy metal ions can harm the body and its internal organs,3,4 and it can even result in cancer.5 Therefore, it is essential to explore ways to treat heavy metal ion pollutants in wastewater.Various processes have been used to remove heavy metal ions, including membrane separation, coagulation, ultrafiltration, nanofiltration, adsorption, chemical precipitation, and solvent extraction.6–11 These systems, however, have drawbacks such as high costs, high energy consumption, and poor metal ion removal in certain situations.6 Adsorption is one of the most promising strategies for removing heavy metal ions,12,13 with considerable advantages in terms of cost, environmental protection, and procedure. The most common adsorbents are molecular sieves, activated carbon, chitosan, hydrogels, and various biosorbents.14–18 Niu et al. improved the adsorption capacity and adsorption selectivity of activated carbon for heavy metals by introducing dithiocarbamate functional groups. The maximum adsorption of Pb(II), Cd(II) and Cu(II) by DTC–AC was 203.36 mg g−1, 102.89 mg g−1 and 53.13 mg g−1, respectively.3 Jin et al. synthesized l-cysteine functionalized magnetic hollow MnFe2O4 nanorods (H-MnFe2O4-Cys) for the purpose of removing heavy metal ions, specifically Cr6+ and Pb2+ from aqueous solutions. The adsorption capacities of H-MnFe2O4-Cys for Cr6+ and Pb2+ were determined to be 268.86 mg g−1 and 291.07 mg g−1, respectively. These findings suggest that H-MnFe2O4-Cys nanorods exhibit significant potential for the efficient removal of heavy metal ions from contaminated water sources.4
Compared to these adsorbents, the advantages of molecular sieves in terms of low cost, high cation exchange capacity, non-emission of toxic compounds, and high selectivity have attracted much attention in the fields of heavy metal ions adsorption. Molecular sieves are crystalline microporous materials composed of aluminum silicate, and are categorized as either natural or synthetic. Synthetic molecular sieves exhibit higher purity, smaller particle sizes, and superior adsorption capabilities compared to their natural counterparts. Because of their distinctive microporosity and consistent pore size, molecular sieves are preferred for practical adsorption applications (SSZ-13). As a result, researchers have conducted extensive research on the synthesis of molecular sieves. Li et al. used fly ash from a power plant in Inner Mongolia as a raw material and desiliconization with sodium hydroxide as a silicon source. Utilizing P123 as the template, SBA-15 mesoporous molecular sieves were prepared, through a hydrothermal method. The adsorption equilibrium was reached within 60 min at 30 °C, pH = 5, and an initial concentration of Pb2+ of 100 mg L−1. The removal of Pb2+ reached 97.22%, with 131 mg g−1 of saturation adsorption capacity.19 Liang et al. synthesized zeolite NaX from coal gangue, a byproduct of coal extraction, and studied its ability to remove Cd2+ and Cu2+. The highest adsorption of Cd2+ and Cu2+ by zeolite NaX was 100.11 mg g−1 and 95.29 mg g−1, respectively.20 Wang et al. produced CS–ZIF-8 molecular sieves by synthesizing ZIF-8 in situ using acid solubilization/alkali immobilization with chitosan as a carrier. The theoretical maximum adsorption of Cu(II) and Pb(II) by CS–ZIF-8 was 165.7 mg g−1 and 131.4 mg g−1, respectively, with an optimal adsorption pH of 5, and the equilibrium time of adsorption of Cu(II) was 5 h and the equilibrium time for adsorption of Pb(II) was 2 h.21 Currently, most molecular sieves are in the micrometer size range, which results in a lower saturated adsorption capacity and poor adsorption efficiency. The size of the molecular sieve has a great influence on its adsorption performance,22–24 the adsorption performance tends to be limited by their relatively small specific surface area, less exposed crystalline cells, and longer transport paths; the smaller the particle size of the molecular sieve, the greater the pressure drop, while the larger the particle size, the lower the efficiency. Therefore, it is highly urgent to develop synthetic methods for nanoscale molecular sieves in order to improve adsorption efficiency.
In this study, nanoscale NaA molecular sieves were produced using a hydrothermal technique with tetramethylammonium hydroxide. By changing the exact synthesis settings, NaA-type molecular sieves with homogeneous forms and sizes 10 times smaller than those of industrial molecular sieves were produced. The properties of the products were investigated using a variety of techniques, including X-ray diffraction (XRD), field emission scanning electron microscopy (SEM), X-ray photoelectron spectroscopy (XPS), and energy spectrum analysis. The adsorption performance of molecular sieves on Cu(II) and Pb(II) was investigated, the reusability of NaA molecular sieves explored and the appropriate adsorption conditions and mechanism were optimized, providing the theoretical framework and technological support for the research of heavy metal ion removal from wastewater using molecular sieves.
2. Materials and methods
2.1. Materials and chemicals
Aluminum isopropoxide (C9H21AlO3), silicone sols (SiO2), nitric acid (HNO3), and tetramethylammonium hydroxide (C4H13NO) were purchased from Shanghai McLean Company. Copper nitrate (Cu(NO3)2), lead nitrate (Pb(NO3)2), ethylenediaminetetraacetic acid (EDTA) and sodium hydroxide (NaOH) were purchased from Ciron Scientific.2.2. Synthesis of nano-sized NaA molecular sieves
In this study, NaA molecular sieves were synthesized through the hydrothermal method using silica sol as the silicon source, aluminum isopropoxide as the aluminum source, sodium hydroxide to adjust the pH of the reaction system, and tetramethylammonium hydroxide as a template agent, and the molar ratio of the reaction system was 1Al2O3![[thin space (1/6-em)]](https://www.rsc.org/images/entities/char_2009.gif) :
:![[thin space (1/6-em)]](https://www.rsc.org/images/entities/char_2009.gif) 2SiO2
2SiO2![[thin space (1/6-em)]](https://www.rsc.org/images/entities/char_2009.gif) :
:![[thin space (1/6-em)]](https://www.rsc.org/images/entities/char_2009.gif) xNa2O
xNa2O![[thin space (1/6-em)]](https://www.rsc.org/images/entities/char_2009.gif) :
:![[thin space (1/6-em)]](https://www.rsc.org/images/entities/char_2009.gif) y(TMA)2O
y(TMA)2O![[thin space (1/6-em)]](https://www.rsc.org/images/entities/char_2009.gif) :
:![[thin space (1/6-em)]](https://www.rsc.org/images/entities/char_2009.gif) 350H2O. x represents the Na2O molar ratio, and y represents the (TMA)2O molar ratio. x = 0.15, 0.3, 0.45, 0.6, and 0.75 were labelled A1, A2, A3, A4, and A5, respectively. The y-values for A1 to A5 were all 6, and x were all 0.3. y = 4, 8, and 10 were labelled A6, A7, and A8, respectively. The detail synthesis parameters are listed in Table S1 (ESI†).
350H2O. x represents the Na2O molar ratio, and y represents the (TMA)2O molar ratio. x = 0.15, 0.3, 0.45, 0.6, and 0.75 were labelled A1, A2, A3, A4, and A5, respectively. The y-values for A1 to A5 were all 6, and x were all 0.3. y = 4, 8, and 10 were labelled A6, A7, and A8, respectively. The detail synthesis parameters are listed in Table S1 (ESI†).
In order to fabricate NaA molecular sieves, a certain amount of sodium hydroxide was dissolved in deionized water. Then a quantity of tetramethylammonium hydroxide was added, and the solution was divided into two equal parts of equal volume. Subsequently, the aluminate solution was prepared by dissolving aluminum isopropoxide in one of the solutions, while the silica solution was prepared by adding silica sol to the other one. After both solutions were completely dissolved, the silicate solution was poured into the aluminate solution, stirred well and put into the reactor for hydrothermal heating. Finally, the NaA molecular sieves were obtained by repeated centrifugation, dispersion, washing the sample with deionized water, and then drying in an oven.
2.3. Heavy metal ion adsorption and desorption experiment
A particular amount of molecular sieve was added to a 50 mL conical flask containing a solution of metal ions, and stirred until the adsorption reaction was completed. Adsorption experiments were performed at 25 °C, pH = 5. Centrifugation was performed after the adsorption was completed and the supernatant was sampled for testing. The concentration of the retained metal ions was detected by the AA-1800 atomic absorption spectrometer to evaluate the adsorption performance of the NaA molecular sieve for the adsorption of heavy metal ions. The adsorption capacity for heavy metal ions on the NaA molecular sieve was determined using eqn (1).25–27 | (1) |
As for the desorption experiment, 10 mmol L−1 EDTA was used as the desorbent in this paper, and the molecular sieves adsorbed with heavy metal ions were put into the EDTA solution and stirred for 6 hours at 25 °C. After that, it was washed three times with deionized water, centrifuged and dried for preparation.
2.4. Characterization methods
X-ray diffraction (XRD, Bruker-axs, Germany) with a monochromatic Cu-Kα X-ray source was utilized to analyze the structure and crystallinity of NaA molecular sieves synthesized under different conditions. In situ FT-IR Spectrometer (FTIR, Bruker Vertex 70V) and XRD were utilized to study the NaA molecular sieves before and after the reaction. Microstructural characterization of NaA molecular sieves synthesized under different conditions was carried out using field emission scanning electron microscopy (FE-SEM, Hitachi SU-70, Japan). The elemental composition of NaA molecular sieves was analyzed by using energy dispersive X-ray spectroscopy (EDX). X-ray photoelectron spectroscopy (XPS, Thermo Scientific ESCALAB Xi+, USA) was used to study the elemental composition of the NaA molecular sieves before and after adsorption. Al-Kα radiation was used as the X-ray source, and the binding energies were referenced to the C 1s peak (284.8 eV). Absorption spectral characterization was carried out on a Mayan Analytical AA-1800 Atomic Absorption Spectrometer (AA-1800). Determination was carried out using the flame method at 283.31 nm and 324.75 nm, respectively.3. Results and discussion
3.1. Synthesis of nano-sized NaA molecular sieves
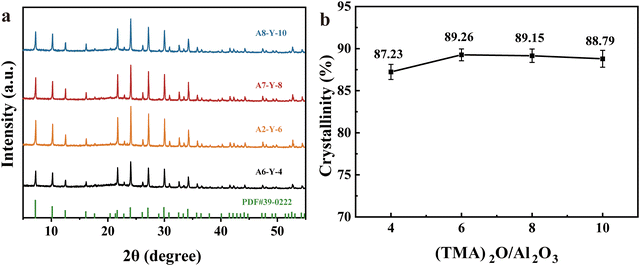
As can be seen from the XRD results in Fig. 1(a) and (b), the diffraction peaks from A1 to A8 all conform to the characteristic peaks of the standard PDF card (PDF#39-0222). This indicates the generation of cubic crystalline NaA molecular sieves. Moreover, it can be observed that changing the organic cation and inorganic templating agent did not affect the surface morphology of the molecular sieves, which indicates that the synthesized NaA molecular sieves have no heterogeneous phases.
 | ||
| Fig. 1 XRD patterns (a) and crystallinity (b) for NaA molecular sieves with different inorganic cation contents (A1–A5). | ||
To further investigate the influence of inorganic cations (Na2O) and organic templating (TMAOH) in the synthesis of NaA molecular sieves, the changes in crystallinity for different inorganic cation contents and organic templating agent contents are shown in Fig. 1(b) and 2(b). It is found that the crystallinity of NaA molecular sieves increased obviously when Na2O/Al2O3 increased from 0.15 to 0.3 but decreased when the concentration continued to increase. The crystallinity improved to 89.26% when the organic templating agent concentration was 6. However, a higher concentration did not further improve the crystallinity of NaA. As a result, the crystallinity was optimal at x = 0.3 and y = 6, respectively.
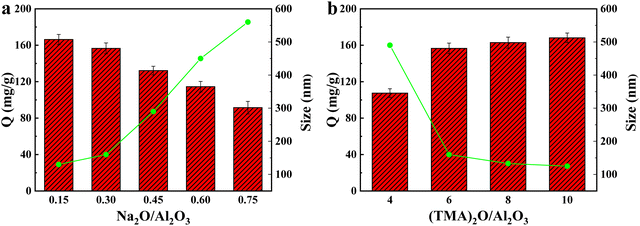 | ||
| Fig. 4 Adsorption capacity of Cu(II) by NaA molecular sieves with different anodic cation contents (a) and different organic templating agent contents (b). | ||
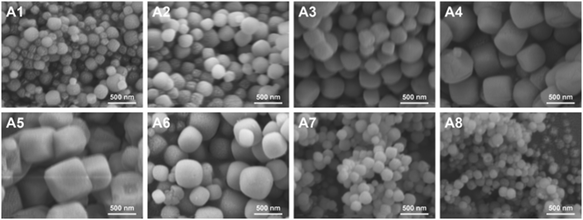
Therefore, combining the results of crystallinity analysis, SEM, XRD and adsorption capacity, we determine that X = 0.3, Y = 6 is the optimum content of anionic cation and organic templating agent for the synthesis of molecular sieves. Therefore, A2 was used for all subsequent experiments.
3.2. Effects of different parameters on Cu(II) and Pb(II) adsorption
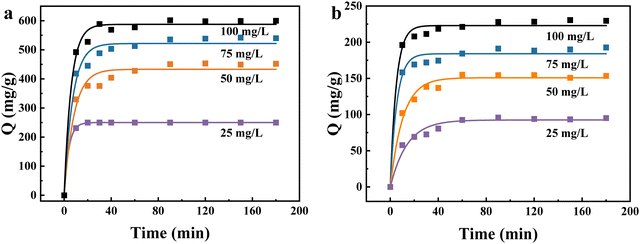
The possible reason for this trend is that the amount of NaA molecular sieves added to the adsorption process was not enough.17 At the early stage of adsorption, there were sufficient adsorption sites on the NaA molecular sieves, so the growth of adsorption capacity was relatively large. Then the growth of the adsorption amount was limited, which was most likely caused by heavy metal ion saturation of the adsorbent surfaces, followed by adsorption and desorption processes that occur following saturation.18,38 All adsorption experiments reached equilibrium within 90 min under different initial Cu(II) and Pb(II) concentrations.
 | ||
| Fig. 7 Adsorption properties of Pb(II) and Cu(II) on NaA molecular sieves at different temperatures. | ||
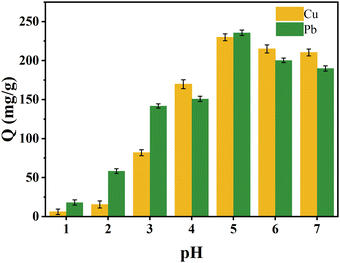
The adsorption amounts of Cu(II) and Pb(II) reached 230 mg g−1 and 600 mg g−1, respectively, at an initial adsorbent concentration of 100 mg L−1, an adsorption temperature of 25 °C, and pH = 5. Table S8 (ESI†) compares the adsorption amounts of NaA molecular sieves with those of the other adsorbents, and the adsorption amounts of NaA molecular sieves were more impressive.
3.3. Adsorption isotherms
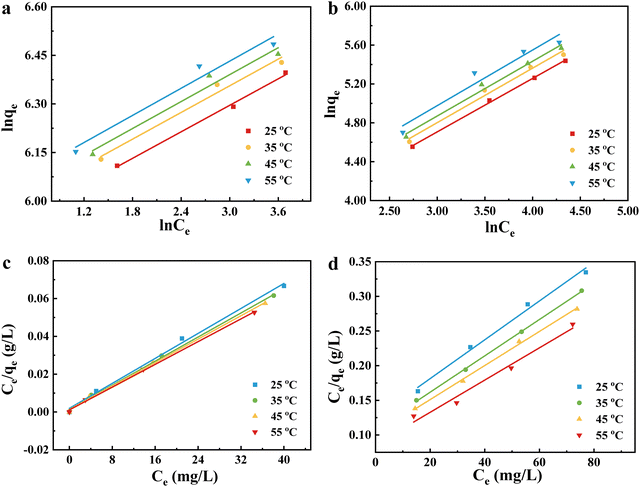
It is well known that Freundlich and Langmuir isotherms are the most commonly used to define the adsorption of components in solution.42,43 They are calculated as follows: | (2) |
 | (3) |
The equilibrium adsorption data for Pb(II) and Cu(II) at different temperatures were fitted to the isotherm equation. As shown in Fig. 8, the experimental data for both metal ions are consistent with the Langmuir isothermal model. Generally, the value of R2 determines the type of isotherm;44 the closer the value of R2 is to 1, the better the fit is. In Tables S2 and S3 (ESI†), the Langmuir isothermal showed better fitting. This indicates that the adsorption process of Cu(II) and Pb(II) on the surface of NaA molecular sieves is not a multilayer inhomogeneous adsorption.27,45,46
3.4. Adsorption kinetics
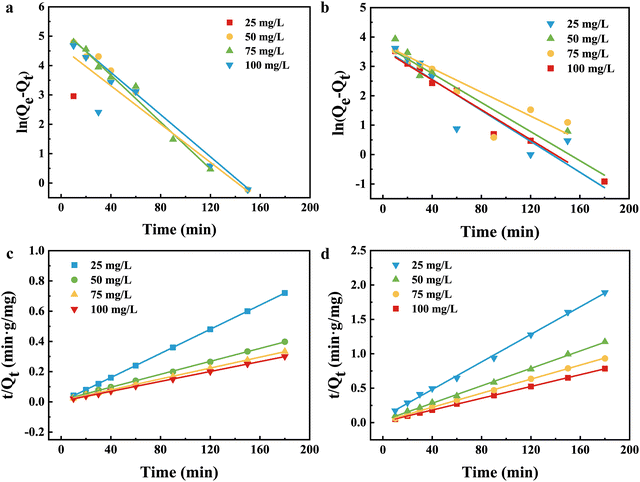
Two different kinetic models were used to simulate the kinetic behavior of Pb(II) and Cu(II) adsorption on NaA molecular sieves. The linear equations of the pseudo-first-order (PFO) and pseudo-second-order (PSO) kinetic models are shown in the following equations.18,47Eqn (4) is the pseudo-first-order (PFO) kinetic model
ln(qe − qt) = ln![[thin space (1/6-em)]](https://www.rsc.org/images/entities/char_2009.gif) qe − K1t qe − K1t | (4) |
Eqn (5) is the pseudo-second-order (PSO) kinetic model
 | (5) |
Fig. 9 shows the fitting of the quasi-primary kinetic model for Cu(II) and Pb(II) and the fitting of the quasi-secondary kinetic model. As shown in Fig. 9(a) and (b), the large difference indicates that the quasi-primary kinetic model cannot accurately represent the adsorption processes of Cu(II) and Pb(II) by NaA molecular sieves. The parameters of the quasi-primary kinetic model and the quasi-secondary kinetic model are shown in Tables S4 and S5 (ESI†), while the majority of the correlation coefficients R2 for the first kinetic model were below 0.9, and all of the values of R2 for the second kinetic model were over that threshold. At a starting Cu(II) concentration of 25 mg L−1, the correlation coefficient was just 0.7882. And the closer the correlation coefficient is to 1, the better the fit is represented. Summarizing the results mentioned above, the pseudo-second order model strongly fits the adsorption of two heavy metal ions. The adsorption modeling data of NaA molecular sieves implied that the adsorption of heavy metal ions may be chemisorption.48,49
3.5. Thermodynamic study
The effect of temperature on Cu(II) and Pb(II) adsorption by the NaA molecular sieve was studied at different temperatures including 298, 308, 318 and 328 K. The experiment used the following eqn (6)–(10). | (6) |
ΔG = −RT![[thin space (1/6-em)]](https://www.rsc.org/images/entities/char_2009.gif) ln ln![[thin space (1/6-em)]](https://www.rsc.org/images/entities/char_2009.gif) K K | (7) |
| ΔG = ΔH − TΔS | (9) |
 | (10) |
Fig. 10 is the thermodynamic fitting diagram, and the thermodynamic parameters are shown in Table S6 (ESI†). ΔH was positive for different temperatures and adsorbents, which indicated that the adsorption of Cu(II) and Pb(II) by NaA molecular sieves is a heat-absorbing process,50 and the increase of temperature was favorable for the adsorption, which also confirmed our previous conclusions. ΔS indicates the degree of disorder in the adsorption system, and ΔS > 0 indicates that the adsorption process proceeds in the direction of increasing disorder. In addition, ΔG was all negative, which indicated that both adsorption processes were spontaneous,51,52 and ΔG decreased with increasing temperature, which once again proved that increasing temperature promoted this adsorption process.53
3.6. Adsorption mechanism studies
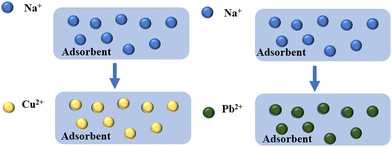
Fig. 11 shows SEM-EDX images of NaA molecular sieves before and after adsorption of heavy metal ions Cu(II) and Pb(II). Before adsorption, elements (O, Al, Si, Na) could be detected on the surface of NaA molecular sieves. After the adsorption of Cu(II) and Pb(II), Cu(II) and Pb(II) could be detected on the surface of the NaA molecular sieve, which proved that adsorption reaction occurred. In addition, the content of Na element almost disappeared after adsorption. This may be due to the ion exchange process of the NaA molecular sieve, where Na(I) was replaced by Cu(II) and Pb(II) and reduced. | ||
| Fig. 11 EDX energy spectra of NaA molecular sieves before adsorption (a), and after adsorption of Cu(II) (b) and Pb(II) (c). | ||
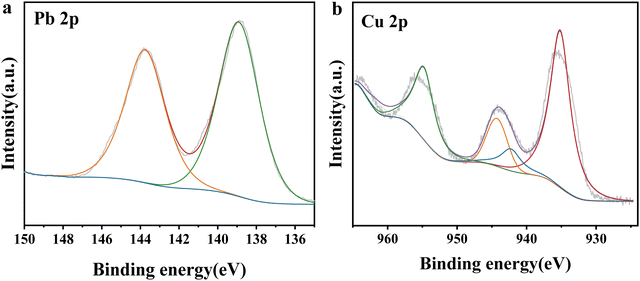
XPS analyses were carried out before and after adsorption to further explain the adsorption mechanism. The XPS full spectra of NaA molecular sieves before and after Cu(II) and Pb(II) adsorption are shown in Fig. S1 (ESI†). After adsorption, there was little change in the peaks of O 1s, Si 2p and Al 2p, and the appearance of the peaks of Cu 2p and Pb 4f confirmed the adsorption effect of NaA molecular sieves. The comparison of the full XPS spectra before and after adsorption revealed that the intensity of the peaks of Na 1s almost disappeared after adsorption, implying that Na and Cu(II) and Pb(II) were ion-exchanged. The fine spectra of Cu 2p and Pb 4f of the adsorbed samples are analyzed in Fig. 12(a), where the peaks at 935.6 eV and 955.25 eV correspond to the Cu 2p3/2 and Cu 2p1/2 orbitals, respectively, whereas the peaks at 942.35 eV, 944.65 eV, and 964.8 eV are satellite peaks induced by Cu(II).54 The peaks at 140.7 eV and 145.6 eV also correspond to Pb 4f5/2 and Pb 4f7/2 orbitals55 as shown in Fig. 12(b). These results proved that Cu(II) and Pb(II) were successfully adsorbed on NaA molecular sieves. Therefore, we can conclude that the adsorption mechanism of Cu(II) and Pb(II) may be the ion exchange between Na(I) and Cu(II) and Pb(II), and the adsorption mechanism is depicted in Fig. 13.
As shown in Fig. S2 (ESI†), the XRD peak signals became weaker when the Pb(II) and Cu(II) were adsorbed on the NaA molecular sieves, which may be due to the reduced amount of samples taken for testing.56 However, from the overall view, no new peaks were generated. This indicates that the cubic crystalline shape of the molecular sieves was not destroyed and no new crystalline shape was generated due to adsorption. We carried out Fourier transform infrared analysis of the molecular sieves before and after the adsorption of heavy metal ions, as shown in Fig. S3 (ESI†), and comparing the spectra of NaA, NaA–Pb and NaA–Cu the positions of the absorption peaks were basically the same, which indicated that there was no change in the chemical structure of the NaA molecular sieves after the adsorption of Pb and Cu. As shown in the Fig. S3 (ESI†), the peaks around 459–461 cm−1 and 541–547 cm−1 were the vibration peaks of the NaA molecular sieve skeleton. And the peaks at 967–973 cm−1 were the characteristic absorption peaks of Al–O and Si–O of the NaA molecular sieves.57–59
BET tests were conducted on NaA molecular sieves both before and after absorbing heavy metals. The NaA molecular sieves with absorbed Pb(II) were named NaA–Pb, while those with absorbed Cu(II) were labeled NaA–Cu. As shown in Fig. 14(a), the molecular sieves before and after adsorption showed obvious H3-type hysteresis loops,60 which exhibited the characteristics of mesoporous channels. Fig. 14(b) shows that NaA molecular sieves before and after adsorption of heavy metals exhibited large amounts of mesopores, except for a small number of mesopores before and after the adsorption of heavy metals on NaA molecular sieves. The specific surface area and pore size values of the molecular sieves before and after absorbing heavy metal ions are detailed in Table S9 (ESI†). The specific surface area of NaA decreased from 36.86 m2 g−1 to 21.86 m2 g−1 and 31.66 m2 g−1 after absorbing Pb(II) and Cu(II), respectively. The average pore size of NaA was 21.91 nm, while the pore sizes of NaA–Pb and NaA–Cu were 26.79 nm and 25.41 nm, respectively. The decrease in specific surface area and increase in pore size after absorption can be attributed to the exchange of two Na+ ions with one heavy metal ion, leading to larger pore sizes.61 And the exchanged heavy metal may bind the hydroxyl group and produce precipitation, covering in the pore channel of the molecular sieve, resulting in a smaller specific surface.62,63 And the specific surface area of NaA–Pb is much reduced compared with that of NaA–Cu, mainly because the NaA molecular sieve adsorbs more Pb(II), so more heavy metal ions accumulate in the molecular sieve pores.
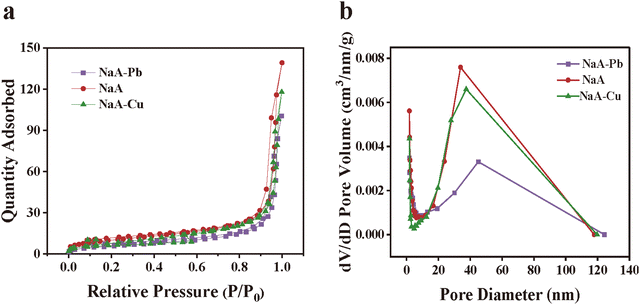 | ||
| Fig. 14 N2 adsorption and desorption isotherms of NaA molecular sieves before and after adsorption of heavy metal ions (a) and pore size distribution (b). | ||
3.7. NaA molecular sieves regeneration-cycle adsorption
Reusability is a crucial property of adsorbents. In this study, we explored the ability of NaA molecular sieves to repeatedly adsorb the heavy metal ions Cu and Pb. As illustrated in Fig. 15, over four cycles of desorption and re-sorption the molecular sieve's adsorption capacity for heavy metals decreased with each cycle. Before desorption, the adsorption of Pb(II) and Cu(II) by the molecular sieve was 230 mg g−1 and 600 mg g−1, respectively. By the fourth cycle, Cu(II) adsorption decreased to 403 mg g−1 and Pb(II) adsorption to 121 mg g−1. Despite the gradual decline, the molecular sieve retained a significant adsorption capacity after four cycles, demonstrating its strong reusability. | ||
| Fig. 15 The amount of Cu(II) and Pb(II) desorption and re-sorption cycle experiments on NaA molecular sieves. | ||
4. Conclusion
In this study, we significantly reduced the size of NaA molecular sieves and enhanced the adsorption capacity for heavy metal ions Pb and Cu by adjusting the ratio of metal cations and inorganic templating agents. The results revealed that by adjusting the ingredient ratio to Al2O3![[thin space (1/6-em)]](https://www.rsc.org/images/entities/char_2009.gif) :
:![[thin space (1/6-em)]](https://www.rsc.org/images/entities/char_2009.gif) SiO2
SiO2![[thin space (1/6-em)]](https://www.rsc.org/images/entities/char_2009.gif) :
:![[thin space (1/6-em)]](https://www.rsc.org/images/entities/char_2009.gif) Na2O
Na2O![[thin space (1/6-em)]](https://www.rsc.org/images/entities/char_2009.gif) :
:![[thin space (1/6-em)]](https://www.rsc.org/images/entities/char_2009.gif) (TMA)2O
(TMA)2O![[thin space (1/6-em)]](https://www.rsc.org/images/entities/char_2009.gif) :
:![[thin space (1/6-em)]](https://www.rsc.org/images/entities/char_2009.gif) H2O = 1
H2O = 1![[thin space (1/6-em)]](https://www.rsc.org/images/entities/char_2009.gif) :
:![[thin space (1/6-em)]](https://www.rsc.org/images/entities/char_2009.gif) 2
2![[thin space (1/6-em)]](https://www.rsc.org/images/entities/char_2009.gif) :
:![[thin space (1/6-em)]](https://www.rsc.org/images/entities/char_2009.gif) 0.3
0.3![[thin space (1/6-em)]](https://www.rsc.org/images/entities/char_2009.gif) :
:![[thin space (1/6-em)]](https://www.rsc.org/images/entities/char_2009.gif) 6
6![[thin space (1/6-em)]](https://www.rsc.org/images/entities/char_2009.gif) :
:![[thin space (1/6-em)]](https://www.rsc.org/images/entities/char_2009.gif) 350, the particle size of the molecular sieves was 10 times smaller than conventional commercial ones, but still with higher crystallinity. We examined the optimal adsorption pH, temperature, and equilibrium time through heavy metal ion adsorption experiments. The adsorption efficiency of Cu(II) and Pb(II) reached 230 mg g−1 and 600 mg g−1, respectively, at an initial adsorbent concentration of 100 mg L−1, an adsorption temperature of 25 °C, and pH = 5. The Langmuir isothermal model accurately characterizes the monolayer adsorption process of NaA molecular sieves on Cu(II) and Pb(II), while the thermodynamic analysis indicates ΔG < 0, suggesting a spontaneous heat absorption process during adsorption. In addition, the NaA molecular sieve shows strong structural and performance stability after being used four times. Therefore, this NaA molecular sieve presents as an efficient and reusable nanoscale molecular sieve with promising industrial potential.
350, the particle size of the molecular sieves was 10 times smaller than conventional commercial ones, but still with higher crystallinity. We examined the optimal adsorption pH, temperature, and equilibrium time through heavy metal ion adsorption experiments. The adsorption efficiency of Cu(II) and Pb(II) reached 230 mg g−1 and 600 mg g−1, respectively, at an initial adsorbent concentration of 100 mg L−1, an adsorption temperature of 25 °C, and pH = 5. The Langmuir isothermal model accurately characterizes the monolayer adsorption process of NaA molecular sieves on Cu(II) and Pb(II), while the thermodynamic analysis indicates ΔG < 0, suggesting a spontaneous heat absorption process during adsorption. In addition, the NaA molecular sieve shows strong structural and performance stability after being used four times. Therefore, this NaA molecular sieve presents as an efficient and reusable nanoscale molecular sieve with promising industrial potential.
Author contributions
K. T. and L. W. C. conceived the study and designed the experiments. K. T. and W. L. C. performed the experiments. W. L. C. wrote the article together. W. G. L, Z. C. and Y. B. H. revised the article. All authors approved the article for publication.Conflicts of interest
There are no conflicts to declare.Acknowledgements
This work was supported by Suntar Membrane Technology (Xiamen) Co., Ltd, Xiamen.References
- X. J. Hu, Y. G. Liu, H. Wang, A. W. Chen, G. M. Zeng, S. M. Liu, Y. M. Guo, X. Hu, T. T. Li, Y. Q. Wang, L. Zhou and S. H. Liu, Sep. Purif. Technol., 2013, 108, 189–195 CrossRef CAS.
- M. Cartró-Sabaté, P. Mayor, M. Orta-Martínez and A. Rosell-Melé, Nat. Sustainability, 2019, 2, 702–709 CrossRef.
- H.-Y. Niu, X. Li and J. Li, New J. Chem., 2022, 46, 5234–5245 RSC.
- C. Jin, G. Teng, Y. Gu, H. Cheng, S. Fu, C. Zhang and W. Ma, New J. Chem., 2019, 43, 5879–5889 RSC.
- E. Panousi, D. Mamais, C. Noutsopoulos, K. Antoniou, K. Koutoula, S. Mastrantoni, C. Koutsogiannis and A. Gkioni, J. Chem. Technol. Biotechnol., 2016, 91, 1681–1687 CrossRef CAS.
- J. Wang and X. Guo, Crit. Rev. Environ. Sci. Technol., 2023, 53, 1837–1865 CrossRef CAS.
- M. Z. Momcilovic, M. S. Randelovic, M. M. Purenovic, J. S. Dordevic, A. Onjia and B. Matovic, Sep. Purif. Technol., 2016, 163, 72–78 CrossRef CAS.
- A. Mojiri, J. L. Zhou, B. Robinson, A. Ohashi, N. Ozaki, T. Kindaichi, H. Farraji and M. Vakili, Chemosphere, 2020, 253 Search PubMed.
- L. Shi, B. Duan, Z. Zhu, C. Sun, J. Zhou and A. Walsh, Ultrason. Sonochem., 2020, 64 Search PubMed.
- X. Yin, Z. J. Zhang, H. Y. Ma, S. Venkateswaran and B. S. Hsiao, Sep. Purif. Technol., 2020, 242 Search PubMed.
- G. Li, X. Qi, N. Yang, X. Duan and A. Zhang, Chemosphere, 2022, 301 Search PubMed.
- R. Wang, L. Deng, X. Fan, K. Li, H. Lu and W. Li, Int. J. Biol. Macromol., 2021, 189, 607–617 CrossRef CAS PubMed.
- B. Y. Wang, J. M. Lan, C. M. Bo, B. L. Gong and J. J. Ou, RSC Adv., 2023, 13, 4275–4302 RSC.
- H. Y. Ren, H. Y. Shen and Y. Z. Liu, J. CO2 Util., 2022, 58 Search PubMed.
- Z. Y. Yang, D. C. Wang, Z. Y. Meng and Y. Y. Li, Sep. Purif. Technol., 2019, 218, 130–137 CrossRef CAS.
- A. B. Saralegui, V. Willson, N. Caracciolo, M. N. Piol and S. P. Boeykens, J. Environ. Manage., 2021, 289 Search PubMed.
- J. Shahrivar and M. Gharabaghi, Adv. Powder Technol., 2020, 31, 4648–4656 CrossRef CAS.
- K. Wang, L. Yang, H. Li and F. Zhang, ACS Appl. Mater. Interfaces, 2019, 11, 21815–21821 CrossRef CAS PubMed.
- G. Li, B. Wang, Q. Sun, W. Q. Xu and Y. Han, Microporous Mesoporous Mater., 2017, 252, 105–115 CrossRef CAS.
- Z. Liang, Q. Gao, Z. Wu and H. Gao, Environ. Sci. Pollut. Res., 2022, 29, 84651–84660 CrossRef CAS PubMed.
- C. Wang, Q. Sun, L. Zhang, T. Su and Y. Yang, J. Environ. Chem. Eng., 2022, 10 Search PubMed.
- V. Valtchev and L. Tosheva, Chem. Rev., 2013, 113, 6734–6760 CrossRef CAS PubMed.
- K. Zhu, J. Sun, J. Liu, L. Wang, H. Wan, J. Hu, Y. Wang, C. H. F. Peden and Z. Nie, ACS Catal., 2011, 1, 682–690 CrossRef CAS.
- G.-T. Vuong, V.-T. Hoang, D.-T. Nguyen and T.-O. Do, Appl. Catal., A, 2010, 382, 231–239 CrossRef CAS.
- Y. Ren, F. Wu, G. Qu, N. Ren, P. Ning, X. Chen, M. He, Y. Yang, Z. Wang and Y. Hu, J. Mater. Res. Technol., 2023, 23, 3023–3034 CrossRef CAS.
- Y. Chen, A. Armutlulu, W. Sun, W. Jiang, X. Jiang, B. Lai and R. Xie, Sci. Total Environ., 2020, 714 Search PubMed.
- J. Gao, Q. Lin, T. Yang, Y. C. Bao and J. Liu, Chemosphere, 2023, 341, 139741 CrossRef CAS PubMed.
- A. S. Huang and W. S. Yang, Sep. Purif. Technol., 2008, 61, 175–181 CrossRef CAS.
- C. S. Cundy and P. A. Cox, Chem. Rev., 2003, 103, 663–701 CrossRef CAS PubMed.
- S. Mintova, J.-P. Gilson and V. Valtchev, Nanoscale, 2013, 5 Search PubMed.
- M. T. Melchior, D. E. W. Vaughan and C. F. Pictroski, J. Phys. Chem., 1995, 99, 6128–6144 CrossRef CAS.
- S. Mintova, N. H. Olson, V. Valtchev and T. Bein, Science, 1999, 283, 958–960 CrossRef CAS PubMed.
- E. I. Ugwu, O. Tursunov, D. Kodirov, L. M. Shaker, A. A. Al-Amiery, I. Yangibaeva and F. Shavkarov, IOP Conf. Ser.: Earth Environ. Sci., 2020, 614, 012166 CrossRef.
- Z. Yang, J. Ma, F. Liu, H. Zhang, X. Ma and D. He, J. Colloid Interface Sci., 2022, 608, 864–872 CrossRef CAS PubMed.
- C. Feng, M. Huang and C.-P. Huang, Chem. Eng. J., 2023, 451 Search PubMed.
- R. Wang, L. Deng, X. Fan, K. Li, H. Lu and W. Li, Int. J. Biol. Macromol., 2021, 189, 607–617 CrossRef CAS PubMed.
- N. Esfandiar, R. Suri and E. R. McKenzie, J. Hazard. Mater., 2022, 423 Search PubMed.
- M. E. Argun, S. Dursun, C. Ozdemir and M. Karatas, J. Hazard. Mater., 2007, 141, 77–85 CrossRef CAS PubMed.
- X. Liu and R. Wang, J. Hazard. Mater., 2017, 326, 157–164 CrossRef CAS PubMed.
- B. Qiu, Q. Shao, J. Shi, C. Yang and H. Chu, Sep. Purif. Technol., 2022, 300, 121925 CrossRef CAS.
- N. K. Soliman and A. F. Moustafa, J. Mater. Res. Technol., 2020, 9, 10235–10253 CrossRef CAS.
- Z. Yang, D. Wang, Z. Meng and Y. Li, Sep. Purif. Technol., 2019, 218, 130–137 CrossRef CAS.
- D.-H. Vu, H.-B. Bui, X.-N. Bui, D. An-Nguyen, Q.-T. Le, N.-H. Do and H. Nguyen, Int. J. Environ. Anal. Chem., 2019, 100, 1226–1244 CrossRef.
- H. Xue, X. Gao, M. K. Seliem, M. Mobarak, R. Dong, X. Wang, K. Fu, Q. Li and Z. Li, Chem. Eng. J., 2023, 451 Search PubMed.
- L. Li, X. Liu, T. Duan, F. Xu, A. Abdulkhani and X. Zhang, Bioresour. Technol., 2023, 376 Search PubMed.
- H. Luo, W. W. Law, Y. Wu, W. Zhu and E.-H. Yang, Microporous Mesoporous Mater., 2018, 272, 8–15 CrossRef CAS.
- D. Huang, Y. Liu, Y. Liu, D. Di, H. Wang and W. Yang, New J. Chem., 2019, 43, 7243–7250 RSC.
- K. Li, J. Hu, Z. Liu, L. Chen and Y. Dong, J. Radioanal. Nucl. Chem., 2012, 295, 2125–2133 CrossRef.
- J. R. Koduru, L. P. Lingamdinne, S. K. Kailasa, T. Thenepalli, Y.-Y. Chang and J.-K. Yang, in Rare-Earth Metal Recovery for Green Technologies: Methods and Applications, ed. R. K. Jyothi, Springer International Publishing, Cham, 2020, pp. 87–109 Search PubMed.
- N. A. Alamrani, H. A. Al-Aoh, M. M. H. Aljohani, S. A. Bani-Atta, M. Sobhi, M. Syed Khalid, A. A. A. Darwish, A. A. Keshk, M. A. A. Abdelfattah and M. N. Nadagouda, J. Chem., 2021, 1–10 Search PubMed.
- H. Al-Johani and M. A. Salam, J. Colloid Interface Sci., 2011, 360, 760–767 CrossRef CAS PubMed.
- T. Adhikari and M. V. Singh, Geoderma, 2003, 114, 81–92 CrossRef CAS.
- X.-J. Hu, Y.-G. Liu, H. Wang, A.-W. Chen, G.-M. Zeng, S.-M. Liu, Y.-M. Guo, X. Hu, T.-T. Li, Y.-Q. Wang, L. Zhou and S.-H. Liu, Sep. Purif. Technol., 2013, 108, 189–195 CrossRef CAS.
- X. W. Du, S. P. Luo, H. Y. Du, M. Tang, X. D. Huang and P. K. Shen, J. Mater. Chem. A, 2016, 4, 1579–1585 RSC.
- D. Roy, S. Neogi and S. De, J. Hazard. Mater., 2021, 403 Search PubMed.
- J. Zhang, C. Tian, Y. Xu, J. Chen, L. Xiao, G. Wu and F. Jin, Sep. Purif. Technol., 2023, 305 CAS.
- Q. Du, H. Xu, Z. Yu, B. Liu, Q. Peng, D. Li, T. Ben and H. Yu, J. Phys.: Conf. Ser., 2022, 2168, 012026 CrossRef.
- W. Yuan, H. Chen, R. Chang and L. Li, Desalination, 2011, 273, 343–351 CrossRef CAS.
- K. Wang, F. Wang, F. Chen, X. Cui, Y. Wei, L. Shao and M. Yu, ACS Sustainable Chem. Eng., 2019, 7, 2459–2470 CrossRef CAS.
- P. A. Monson, Microporous Mesoporous Mater., 2012, 160, 47–66 CrossRef CAS.
- L. Lv, G. Tsoi and X. S. Zhao, Ind. Eng. Chem. Res., 2004, 43, 7900–7906 CrossRef.
- P. Maneechakr and S. Mongkollertlop, J. Environ. Chem. Eng., 2020, 8 Search PubMed.
- S. M. Hosseini, H. Alibakhshi, E. Jashni, F. Parvizian, J. N. Shen, M. Taheri, M. Ebrahimi and N. Rafiei, J. Hazard. Mater., 2020, 381, 120884 CrossRef CAS PubMed.
Footnotes |
| † Electronic supplementary information (ESI) available. See DOI: https://doi.org/10.1039/d3nj05924c |
| ‡ These authors contributed equally to this work. |
| This journal is © The Royal Society of Chemistry and the Centre National de la Recherche Scientifique 2024 |

