 Open Access Article
Creative Commons Attribution 3.0 Unported Licence
Elucidation of the structural features and photoluminescence properties of a hydrothermally-synthesized γ-KEu(MoO4)2 microcrystal phosphor with metastable orthorhombic structure and differences in the luminescence properties by structure transition due to Y3+-dilution†
Takuya
Hasegawa
 *a,
Suzuka
Noda
 a,
Wataru
Hikita
b,
Kenji
Toda
b,
Ayahisa
Okawa
a and
Shu
Yin
 ac
ac
aInstitute of Multidisciplinary Research for Advanced Material (IMRAM), Tohoku University, 2-1-1 Katahira, Aoba-ku, Sendai, Miyagi 980-8577, Japan
bGraduate School of Science and Technology, Niigata University, 8050 Ikarashi 2-nocho, Niigata 950-2181, Japan
cAdvanced Institute for Materials Research (WPI-AIMR), Tohoku University, 2-1-1 Katahira, Aoba-ku, Sendai, Miyagi 980-8577, Japan
First published on 5th April 2024
Abstract
Potassium europium molybdate, KEu(MoO4)2, is an intriguing material known for its efficient luminescence properties attributed to Eu3+ ions and its polymorphic nature. Despite its significance, research on the metastable γ-phase has been limited, with no prior reports on its structure, particle morphology, and luminescence characteristics. In this study, both the stable α-phase and the metastable γ-phase of KEu(MoO4)2 were synthesized using solid-state and hydrothermal reaction methods, and their crystal structures, particle morphologies, and luminescence properties were comprehensively investigated. X-Ray diffraction analysis confirmed the formation of the triclinic α-phase and the orthorhombic γ-phase, with factor analysis results consistent with theoretically optimized structures, facilitating accurate structural determination. Both phases exhibited typical photoluminescence (PL) spectra of Eu3+ ions. However, in the γ-phase, the 5D0 → 7F2 transition appeared as a non-split peak with minimal Stark effect, attributed to differences in structural symmetry between the phases. A red-shift in the PL excitation edge was observed in the α-phase, which was attributed to a narrowed band gap resulting from the broadening of the O-p orbital in the valence band, as indicated by density functional theory (DFT) calculations. Additionally, KEu(MoO4)2 was doped with Y3+ ions to form K(Eu,Y)(MoO4)2, revealing a solid solubility limit of 40% in the α-phase, while the γ-phase displayed no solid solution limit. The estimated critical distance of Eu3+ ions suggested that Eu–Eu interactions contributing to concentration quenching are minimal in the stacking direction but significant in the in-plane direction, operating in the second shell.
Introduction
In recent years, phosphor materials have become indispensable for solid-state lighting and displays, including white LEDs. Particularly, narrow-band luminescence is expected to be applied to high-definition displays, and active research is still underway.1 Narrow-band luminescence can be produced by a variety of luminescent ions, but the line spectra of materials containing trivalent lanthanides have been extensively studied due to the structural aspects of these materials. Lanthanide double molybdates, denoted as ALn(MoO4)2 (where A represents alkali metals and Ln denotes rare-earth metals), constitute an intriguing class of materials whose structures vary based on the ionic sizes of the incorporated lanthanide and alkali metal ions.2–5 In many instances within this group, compounds containing smaller alkali metal ions such as Li+ and Na+ adopt three-dimensional structures resembling scheelite, which is isostructural with CaMoO4.6–8 Conversely, with the introduction of larger ions like K+, Rb+, and Cs+, the structure predominantly adopts a two-dimensional layered arrangement.5,9,10 Despite sharing a basic layer framework of Ln(MoO4)2, the layered structures exhibit numerous structural variations due to symmetry and distortion dictated by the ionic sizes of the lanthanide metals, consequently leading to corresponding changes in their physical properties. Particularly noteworthy are europium-doped layered lanthanide molybdates, denoted as AEu(MoO4)2, which have garnered significant interest from researchers owing to their high luminescence efficiency and diverse structural characteristics.5,11 Despite complete substitution of the Eu3+ ion into the Ln site, these compounds exhibit remarkable luminescence efficiency attributed to the high optical absorption at the charge-transfer (CT) transition between O2p and Eu4f orbitals, along with direct Eu 4f–4f transitions, resulting in excellent photoluminescence properties. Additionally, the chemical tunability stemming from the layered structure holds promise for further modifications and applications.12,13It is well-documented that AEu(MoO4)2 phosphors adopt a layered structure when introduced by larger ions such as K+, Rb+, and Cs+. Specifically, the K-form of KEu(MoO4)2 exhibits polymorphism.5,11 The α-KEu(MoO4)2 phase, characterized by a triclinic structure, is the most stable, typically synthesized via conventional solid-state reaction (SSR) methods at temperatures ranging from approximately 650 to 900 °C.14–17 However, above this temperature range, α-KEu(MoO4)2 transforms into a monoclinic β-phase, belonging to the I![[1 with combining macron]](https://www.rsc.org/images/entities/char_0031_0304.gif) space group (with a superspace group notation of I2/b (αβ0)00), resulting in an incommensurately modulated structure;11 however, this β-phase has not been thoroughly studied in terms of its physical properties because of its unstable nature. The α-KEu(MoO4)2 material has undergone extensive investigation regarding its detailed structure, luminescence properties, and chemical modifications through post-treatment methods, such as protonation and nano-scroll formation.12,13 The simplicity of synthesis in the α-phase has facilitated these developmental studies. However, the SSR method employed for synthesis has limitations, particularly in controlling particle morphology and precisely tuning chemical compositions, including atomic defects. Given that luminescence properties are influenced by these factors, the conventional SSR method may not be optimal for enhancing luminescence efficiency. In this context, liquid-phase routes offer a more favorable approach for improving the properties of phosphor materials.
space group (with a superspace group notation of I2/b (αβ0)00), resulting in an incommensurately modulated structure;11 however, this β-phase has not been thoroughly studied in terms of its physical properties because of its unstable nature. The α-KEu(MoO4)2 material has undergone extensive investigation regarding its detailed structure, luminescence properties, and chemical modifications through post-treatment methods, such as protonation and nano-scroll formation.12,13 The simplicity of synthesis in the α-phase has facilitated these developmental studies. However, the SSR method employed for synthesis has limitations, particularly in controlling particle morphology and precisely tuning chemical compositions, including atomic defects. Given that luminescence properties are influenced by these factors, the conventional SSR method may not be optimal for enhancing luminescence efficiency. In this context, liquid-phase routes offer a more favorable approach for improving the properties of phosphor materials.
The hydrothermal reaction method, a typical solution process, enables the synthesis of specific crystal phases that may not be achievable through conventional solid-state reaction (SSR) methods at high temperatures. This method involves high-pressure water in a sealed vessel. In the case of KEu(MoO4)2, the hydrothermal reaction field has shown promise in producing the irregular γ-phase.5 This γ-phase shares a similar layer framework with the α-phase but differs in symmetry and stacking arrangement, resulting in its isostructural relationship with orthorhombic KY(MoO4)2.18 This new phase was discovered during the synthesis of a series of KY(MoO4)2:Eu phosphors;5 however, its structural determination and detailed characterization of luminescence properties, including comparison with the α-phase, remain insufficient.
In this study, we synthesized γ-KEu(MoO4)2 using the hydrothermal method and conducted a comprehensive characterization of its structural features and particle morphology. Additionally, we thoroughly investigated the photoluminescence properties of both α- and γ-phases, complementing our experimental findings with theoretical calculations. Furthermore, we explored the structural and optical changes of each phase by introducing Y3+ ions as diluents for Eu3+.
Experimental
Materials
The chemical materials used for the synthesis of KEu(MoO4)2 (KEM-HT) and K(Eu1−xYx)(MoO4)2 (KEM:Y-HT) were as follows: (NH4)6Mo7O24·4H2O (≥99.0%, Fujifilm Wako Pure Chem. Corp.), Eu2O3 (Nippon Denko Co., Ltd), KOH aq. solutions (1 M, analytical grade, Fujifilm Wako Pure Chem. Corp.), Y2O3 (Nippon Denko Co., Ltd), K2CO3 (≥99.5%, Fujifilm Wako Pure Chem. Corp.), MoO3 (≥99.0%, Wako Pure Chem. Co.), nitric acid, ethanol (EtOH; ≥99.5%, Kanto Chemical Co. Inc.) and acetone (≥99.5%, Kanto Chemical Co. Inc.). The Eu2O3 and Y2O3 were dissolved in nitric acid, and the acidic solutions were evaporated at 80 °C to obtain the Eu(NO3)3·nH2O and Y(NO3)3·nH2O, respectively. Stock solutions of 0.2 M Eu(NO3)3 and Y(NO3)3 were prepared from these nitrate precursors.Hydrothermal synthesis
The hydrothermal synthesis of KEu(MoO4)2 (KEM-HT) and K(Eu1−xYx)(MoO4)2 (KEM:Y-HT) phosphors followed literature procedures.5 For the synthesis of KEM-HT phosphor, the (NH4)6Mo7O24·4H2O (1.43 mmol) was dissolved in distilled water containing 10 mL of Eu-nitrate aqueous solution, maintaining a total volume of 30 mL. The colloidal solutions were magnetically stirred for 15 minutes at room temperature, then 13 mL of KOH aqueous solution was added to reach a total volume of 70 mL. After stirring for 30 minutes, the white colloidal suspensions were transferred to Teflon-lined stainless autoclaves with a volume of 100 mL and hydrothermally treated at 200 °C for 24 hours. After cooling to room temperature, the white precipitates were collected by centrifugation at 15![[thin space (1/6-em)]](https://www.rsc.org/images/entities/char_2009.gif) 000 rpm, washed three times with deionized water and once with ethanol, and finally dried at 60 °C in a vacuum oven overnight to obtain the white KEM-HT phosphor samples. To obtain Y-substituted KEM:Y-HT samples, a similar procedure was followed to the synthesis of KEM-HT, but Eu- and Y-nitrate mixed solutions with various concentration ratios of x = 0, 0.2, 0.4, 0.5, 0.6, 0.8, and 1 were used instead of the Eu-nitrate aqueous solution.
000 rpm, washed three times with deionized water and once with ethanol, and finally dried at 60 °C in a vacuum oven overnight to obtain the white KEM-HT phosphor samples. To obtain Y-substituted KEM:Y-HT samples, a similar procedure was followed to the synthesis of KEM-HT, but Eu- and Y-nitrate mixed solutions with various concentration ratios of x = 0, 0.2, 0.4, 0.5, 0.6, 0.8, and 1 were used instead of the Eu-nitrate aqueous solution.
Solid-state reaction synthesis
K2CO3, Eu2O3 and MoO3 were weighed in stoichiometric ratios, mixed in acetone for 15 minutes, and then dried. The mixtures were placed in an alumina boat and calcined at 700 °C for 6 hours in air. The obtained samples were crushed in a mortar to form homogeneous powders to obtain the KEu(MoO4)2 (KEM-SSR) powder sample. The K(Eu1−xYx)(MoO4)2 (KEM:Y-SSR) powders were synthesized by substituting Y2O3 for a portion of Eu2O3 in the given molar ratio used in the hydrothermal synthesis.Characterization
The crystal phase of the phosphor samples was determined using powder X-ray diffraction (XRD) with Cu-Kα radiation (λ = 1.54059 Å), utilizing D2 PHASER from Bruker and SmartLab 3G from Rigaku. The lattice parameters and phase fractions were refined by a Rietveld technique utilizing a RIETAN-FP program package.19 Particle morphology was observed using a field-emission scanning electron microscope (FE-SEM; SU6600, Hitachi Tech.) at an acceleration voltage of 15 kV, and transmission electron microscopy (TEM; JEM-2100plus, JEOL) operated at 200 kV. Diffuse reflectance (DR) spectra were recorded by a UV-vis-NIR spectrofluorometer (V-670, JASCO Corp.) with an integrating sphere attachment. Photoluminescence (PL) and PL excitation (PLE) measurements were conducted using a spectrofluorometer (FP-8500, JASCO Co.) equipped with a 150 W xenon lamp. The quantum efficiencies (QE) of the KEM:Y phosphors were also measured using the same spectrofluorometer with an optional unit for measurements. The PL decay curves of the phosphor samples were recorded using a time-correlated single photon counting spectrofluorometer (Quantaurus-Tau C11367-12, Hamamatsu Photonics) with a xenon flush lamp monochromatized at 280 nm as the pulse excitation source, and monitored at 614 nm. Temperature-dependent photoluminescence (PL) spectra were acquired using a custom-built PL measurement system. The samples under temperature control were excited by a 310 nm fiber LED with an output power of 30 mW (HQ401, Hamamatsu Quantum). The luminescence was captured by fiber multichannel spectrometers (FLAME-T-OW, Ocean Insight) equipped with long-pass filters (λT > 400 nm; FELH0400, Thorlabs). The PL spectra were automatically recorded at each temperature increment of approximately 2.5 °C, while scanning from approximately 10 to 300 °C, facilitated by a program-controlled temperature controller. The elemental ratio of Y and Eu in all KEM:Y samples was determined using X-ray fluorescence (XRF) measurements conducted with the EDX-800HS instrument from Shimadzu. Calibration curves were prepared using mixtures of K(Eu1−xYx)(MoO4)2 with varying values of x (0, 0.2, 0.4, 0.5, 0.6, 0.8, and 1) to establish the relationship between the elemental ratios and the measured XRF signals.Theoretical calculation
Theoretical calculations for two structures of α- and γ-KEu(MoO4)2 were performed using the Quantum Espresso code.20 The ionic core and core electrons were substituted with projected augmented wave (PAW) pseudopotentials from the SSSP Precision library.21 Both structures of KEu(MoO4)2 were optimized for atomic positions and crystal lattice parameters, maintaining the triclinic crystal system for the α-phase and the orthorhombic crystal system for the γ-phase, respectively. A generalized gradient approximation (GGA) exchange–correlation functional pseudopotential was employed, specifically the Perdew–Burke–Ernzerhof revised form for solids (PBEsol), for structural optimizations. For electronic structure calculations, the PBEsol+U method with U(Eu,Mo) = (7.0 eV, 4.0 eV) was utilized. In these calculations, the KEu(MoO4)2 structures were computed with several parameters, including a plane-wave cutoff energy of 40 Ry and a 2 × 2 × 2 grid Monkhorst–Pack k-point mesh. Theoretical calculations considered various factors such as the effect of strong electron correlations, with an energy convergence set at 1.0 × 10⁻⁶ eV per atom and a maximum force tolerance of 0.01 eV Å−1. The BFGS algorithm was employed to optimize the atomic positions and lattice parameters of the KEu(MoO4)2 crystal structure. Band structures for both KEu(MoO4)2 structures were calculated, taking spin polarization into account with respect to Eu, with initial values of 0.5 for the γ-phase and 0.25 for the α-phase, respectively.Results and discussion
KEu(MoO4)2 phosphors synthesized by different methods
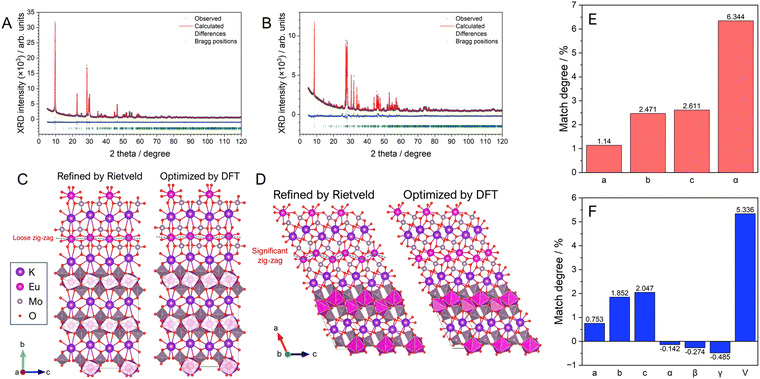
The stoichiometric phosphors of KEu(MoO4)2 (KEM) were synthesized using two different processes: conventional solid-state reaction and hydrothermal reaction methods. Elemental analysis was conducted via X-ray photoelectron spectroscopy (XPS) measurements, revealing that all metal-element ratios closely matched the stoichiometry (see Table S1, ESI†). The crystal phases of KEM phosphors were determined using powder X-ray diffraction (XRD) techniques. Quantitative determination of the crystal structure for both materials was carried out via Rietveld analysis using XRD profiles, as depicted in Fig. 1A and B. The reliability factors, crystallographic data, and atomic parameters are summarized in Table 1 and Table S2 (ESI†). The XRD patterns of both samples were well-fitted with simulated patterns of KEu(MoO4)2 with orthorhombic (SG:Pbcn; γ-phase) and triclinic (SG:P![[1 with combining macron]](https://www.rsc.org/images/entities/char_0031_0304.gif) ; α-phase) structures for KEM-HT and KEM-SSR samples, respectively. The resulting reliability factors of Rwp and S values were found to be 4.142% and 1.3318 for KEM-HT, and 7.062% and 2.0753 for KEM-SSR, respectively. These values indicate that the structure of the KEM sample was well-determined by the Rietveld method and can be properly considered concerning detailed structural and luminescence properties. Three polymorphisms of KEu(MoO4)2 have been reported, with the triclinic α-phase being the most well-known structure. The α-KEu(MoO4)2 phase is typically obtained via high-temperature reactions such as the solid-state reaction method, making it the most stable phase. On the other hand, the γ-KEu(MoO4)2 phase is metastable and can be obtained under special conditions in low-temperature reactions, such as hydrothermal reactions. It is expected to have isostructural properties with analogues of KY(MoO4)2, although its detailed structure has not been determined until now. The crystal structures of γ- and α-KEu(MoO4)2 are illustrated in Fig. 1C and D, respectively, respectively, using the VESTA program.22 Both structures consist of layered frameworks comprising Eu(MoO4)2 layers with K+ ions located in the interlayer spaces. These layered frameworks are composed of cluster units consisting of a network of one EuO8 polyhedron and two MoO4 tetrahedra. In the γ-phase, the cations are arranged almost on the same plane, while they exhibit a pronounced zig-zag arrangement in the α-phase. Additionally, both cations in the α-KEu(MoO4)2 lack symmetry elements, and similarly, the Mo atom in the γ-phase lacks symmetry elements, while the Eu atom occupies the 4c site with a twofold rotation symmetry along the b-axis (stacking direction), denoted as “.2.” in Hermann–Mauguin notation.23 This symmetric difference leads to the zig-zag chain in the layered structure of the α-phase. However, since both phases have low symmetry structures, structural optimization of both structures was performed through theoretical calculations using the density functional theory (DFT) method with PBE-sol pseudopotentials, which are considered appropriate for optimizing lattice constants. Table S3 (ESI†) summarizes the detailed structural parameters obtained from structural optimization via DFT calculations. The experimentally and theoretically estimated lattice constants of KEM-HT and KEM-SSR are compared in Fig. 1E and F, respectively. For both phases, the differences in all lattice constants were within ±3% of the range, indicating a good agreement between experimental and theoretical analyses.
; α-phase) structures for KEM-HT and KEM-SSR samples, respectively. The resulting reliability factors of Rwp and S values were found to be 4.142% and 1.3318 for KEM-HT, and 7.062% and 2.0753 for KEM-SSR, respectively. These values indicate that the structure of the KEM sample was well-determined by the Rietveld method and can be properly considered concerning detailed structural and luminescence properties. Three polymorphisms of KEu(MoO4)2 have been reported, with the triclinic α-phase being the most well-known structure. The α-KEu(MoO4)2 phase is typically obtained via high-temperature reactions such as the solid-state reaction method, making it the most stable phase. On the other hand, the γ-KEu(MoO4)2 phase is metastable and can be obtained under special conditions in low-temperature reactions, such as hydrothermal reactions. It is expected to have isostructural properties with analogues of KY(MoO4)2, although its detailed structure has not been determined until now. The crystal structures of γ- and α-KEu(MoO4)2 are illustrated in Fig. 1C and D, respectively, respectively, using the VESTA program.22 Both structures consist of layered frameworks comprising Eu(MoO4)2 layers with K+ ions located in the interlayer spaces. These layered frameworks are composed of cluster units consisting of a network of one EuO8 polyhedron and two MoO4 tetrahedra. In the γ-phase, the cations are arranged almost on the same plane, while they exhibit a pronounced zig-zag arrangement in the α-phase. Additionally, both cations in the α-KEu(MoO4)2 lack symmetry elements, and similarly, the Mo atom in the γ-phase lacks symmetry elements, while the Eu atom occupies the 4c site with a twofold rotation symmetry along the b-axis (stacking direction), denoted as “.2.” in Hermann–Mauguin notation.23 This symmetric difference leads to the zig-zag chain in the layered structure of the α-phase. However, since both phases have low symmetry structures, structural optimization of both structures was performed through theoretical calculations using the density functional theory (DFT) method with PBE-sol pseudopotentials, which are considered appropriate for optimizing lattice constants. Table S3 (ESI†) summarizes the detailed structural parameters obtained from structural optimization via DFT calculations. The experimentally and theoretically estimated lattice constants of KEM-HT and KEM-SSR are compared in Fig. 1E and F, respectively. For both phases, the differences in all lattice constants were within ±3% of the range, indicating a good agreement between experimental and theoretical analyses.
| KEM:xY-HT | KEM:xY-SSR | |||
|---|---|---|---|---|
| Y | Eu | Y | Eu | |
| x = 0 | 1 | 0 | 1 | 0 |
| x = 0.2 | 0.777 | 0.223 | 0.795 | 0.205 |
| x = 0.4 | 0.545 | 0.455 | 0.633 | 0.367 |
| x = 0.5 | 0.500 | 0.500 | 0.491 | 0.509 |
| x = 0.6 | 0.334 | 0.666 | 0.335 | 0.665 |
| x = 0.8 | 0.156 | 0.844 | 0.111 | 0.889 |
| x = 1 | 0 | 1 | 0 | 1 |
The particle morphology also influences the photoluminescence (PL) properties of phosphor materials. Fig. 2 depicts scanning electron microscope (SEM) and transmission electron microscope (TEM) images of typical KEM-HT and KEM-SSR samples. The hydrothermally synthesized KEM-HT phosphor exhibits a hexagonal-shaped plate-like morphology with submicron-level order in the lateral directions. This plate morphology reflects the layered crystal structure of the material. The selected area electron diffraction (SAED) pattern (Fig. S1, ESI†) shows clear spot patterns in the KEM-HT particle, indicating a single-crystal-like structure with high crystallinity and fewer defects.
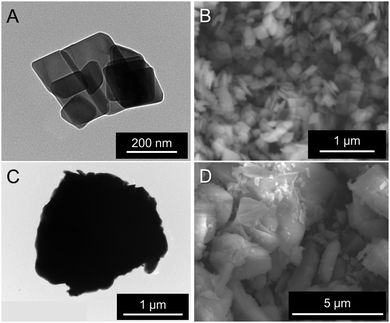 | ||
| Fig. 2 (A) and (C) TEM and (B) and (D) SEM images of KEM samples: (A) and (B) KEM-HT and (B) and (D) KEM-SSR. | ||
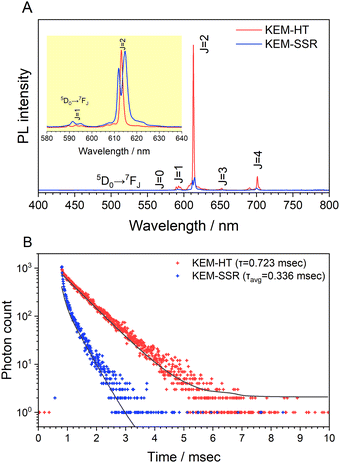
Fig. 3A illustrates the photoluminescence (PL) spectra of the KEM-HT and KEM-SSR samples excited at the charge transfer (CT) transition of 264 nm. In both KEM phosphors synthesized via different routes, narrow PL peaks attributed to specific 5D0 → 7FJ (J = 0–4) transitions between the 4f–4f orbitals of Eu3+ ions were observed. These transitions correspond to magnetic dipole and electric dipole transitions for J = 1,3 and J = 2,4, respectively.24 The 5D0 → 7F0 transition of Eu3+ is comparatively weaker than other transitions due to its sensitivity to extremely low symmetry fields.25 Consequently, this transition may not be readily observable in this instance as well. Additionally, the PL spectra under near-ultraviolet excitation of the 7F0 → 5L6 transition of Eu3+ showed no change (Fig. S2, ESI†). The PL peak intensity of the electric 5D0 → 7F2 transition is sensitive to the symmetry of the Eu3+ location, while that of the magnetic 5D0 → 7F1 transition is not affected by the surrounding environments of the Eu3+ ion.24,26,27 Specifically, the PL intensity ratio of 5D0 → 7F2/5D0 → 7F1 transitions depends on the inversion symmetry of the local Eu3+ site. The 5D0 → 7F2/5D0 → 7F1 ratios of KEM-HT and KEM-SSR phosphors were found to be 11.4 and 10.3, respectively, indicating no significant differences in the PL intensity ratio due to both having space groups with no inversion symmetry. However, while the KEM-HT sample exhibited a singlet PL band, the KEM-SSR sample displayed doublet PL bands, resulting in an obvious difference in the PL peak shape of the electric dipole 5D0 → 7F2 transition between the two samples. It is well-known that the inner core 4f orbital is less affected by the crystal field due to the shielding effect and is therefore less susceptible to spectral changes compared to d-electron transitions. However, it can still cause slight orbital splitting, known as the Stark effect, which originates from the lanthanide's site symmetry.28,29 The γ-KEu(MoO4)2 and α-KEu(MoO4)2 belong to the orthorhombic Pbcn and triclinic P![[1 with combining macron]](https://www.rsc.org/images/entities/char_0031_0304.gif) space groups, respectively. The Eu site of γ-type KEu(MoO4)2 has twice rotation symmetry along the b-axis, while that of α-type KEu(MoO4)2 has lacks symmetry. This structural difference explains why peak splitting of the 5D0 → 7F2 transition was observed in the higher Eu concentration side of the KEM-SSR phosphor, whereas the KEM-HT phosphor did not exhibit PL peak splitting (inset of Fig. 3A). The energy migration related to the excitons generated in the photoexcitation can be evaluated through photoluminescence (PL) lifetime measurements. Fig. 3B displays the PL decay curves of the KEM phosphors. The PL decay profiles for KEM-HT and KEM-SSR were well-fitted by single or double exponential functions as follows (eqn (1) and (2), respectively):24
space groups, respectively. The Eu site of γ-type KEu(MoO4)2 has twice rotation symmetry along the b-axis, while that of α-type KEu(MoO4)2 has lacks symmetry. This structural difference explains why peak splitting of the 5D0 → 7F2 transition was observed in the higher Eu concentration side of the KEM-SSR phosphor, whereas the KEM-HT phosphor did not exhibit PL peak splitting (inset of Fig. 3A). The energy migration related to the excitons generated in the photoexcitation can be evaluated through photoluminescence (PL) lifetime measurements. Fig. 3B displays the PL decay curves of the KEM phosphors. The PL decay profiles for KEM-HT and KEM-SSR were well-fitted by single or double exponential functions as follows (eqn (1) and (2), respectively):24
 | (1) |
 | (2) |
Here, τ, A, and I(t) represent the decay time, constant, and the PL intensity at time t, respectively. The average decay time (τavg) for the second exponential is typically found using the following equation:
 | (3) |
The PL decay times of KEM-HT and KEM-SSR were estimated to be in the sub-millisecond order, specifically 0.723 and 0.336 milliseconds, respectively. The luminescence of Eu3+ ions exhibits a long transition lifetime due to spin-forbidden transitions, particularly being the longest among all trivalent lanthanide ions.24 In different synthetic methods, the KEM-HT sample demonstrates significantly longer PL decay lifetimes compared to the KEM-SSR sample. This suggests that KEM-SSR contains more non-luminescent centers, as the PL lifetime tends to decrease with an increase in their concentration. The KEM-HT samples were synthesized through a liquid phase process, resulting in high ion homogeneity within the crystal and extremely few lattice defects, as evidenced by TEM images and SAED patterns. The luminescence emitted from these pure particles contributes to their long PL lifetime. In contrast, KEM-SSR consists of agglomerations of polycrystalline particles, as observed in the SAED patterns. Furthermore, the internal quantum efficiencies of KEM-HT and KEM-SSR were measured to be 9.8% and 2.5%, respectively, which reasonably explains the suppression of defects in KEM-HT. In addition, both crystal phases of KEu(MoO4)2 exhibited similar thermal quenching behavior as previously reported (see Fig. S3, ESI†).
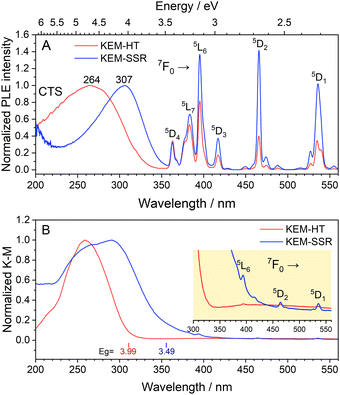
The photoluminescence excitation (PLE) spectra of KEM phosphors are depicted in Fig. 4A. In both synthesis methods, the PLE spectra comprised two types of transitions: narrow lines originating from intra-4f orbitals of Eu3+ ions and a broad band resulting from a charge-transfer (CT) transition between O2− and Mo6+/Eu3+ orbitals. Since the narrow lines represent specific spin-forbidden transitions of Eu3+ ions, their peak positions should be consistent across all host lattices. These narrow lines can be assigned as intra-4f transitions from the ground state 7F0 to the excited states of 5DJ (J = 1–4) and 5LJ (J = 6 and 7).17 Furthermore, the broad CT transitions from O2− to Mo6+/Eu3+ orbitals are located in the UV region around ∼350 nm. Additionally, the diffuse reflection (DR) spectra of the KEM phosphors are presented in Fig. 4B. Similar to the PLE spectra, both phosphors exhibited a broad band in the UV region along with weak narrow peaks. It is evident that this CT transition aligns well with the optical absorption of the host crystal, indicating that these broad excitation bands are attributed to host absorption. The optical band gaps of the KEM-HT and KEM-SSR phosphors were determined to be 3.99 eV and 3.49 eV, respectively.
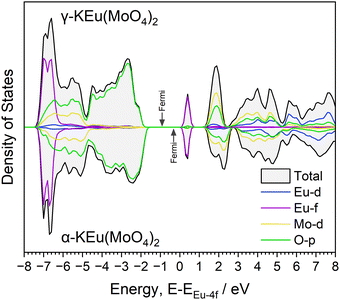
Although γ-KEu(MoO4)2 shares the same chemical composition and similar framework structure with α-KEu(MoO4)2, its absorption edge notably shifts to higher energy. To understand the reason behind this difference in the excitation band edge, theoretical calculations of structural optimization and density of states (DOSs) using the DFT method were performed. Considering the space group, the γ-KEu(MoO4)2 should exhibit weaker effects of Stark splitting of Eu4f and crystal field splitting of Mo4d orbitals compared to the α-phase due to its higher symmetry, as explained in the structure determination of KEM materials. Consequently, the spectral shift of the CT band in the PLE spectra might originate from these symmetric differences. Therefore, DOS calculations were conducted to investigate which effect contributed more significantly (refer to Fig. S4 and S5, ESI†). The typical up-spin DOSs were calculated based on the optimized structures, as illustrated in Fig. 5. Here, the DOS plot was normalized by the Eu-f orbital for ease of comparison. In these DOS plots, the K-s and K-p orbitals were located at lower energy regions of −28 and −12 eV, respectively, with each orbital of Eu, Mo, and O displayed. In both phases, the valence and conduction bands are primarily composed of the O-p and Mo-d orbitals, respectively. The Eu-d orbital was situated approximately 2–3 eV above the conduction band bottom, while the Eu-f orbitals were positioned at two parts of the valence band bottom and mid-gap state. Although no significant differences were observed between them, slight variances were noted in the O-p and Mo-d orbitals. In the α phase, both orbitals appeared widened, resulting in a valence band bottom at higher energies. This widening of the O-p orbitals in the α phase could be attributed to crystal field splitting due to its lower symmetry.
Dilution of KEu(MoO4)2 phosphors by Y3+-substitution
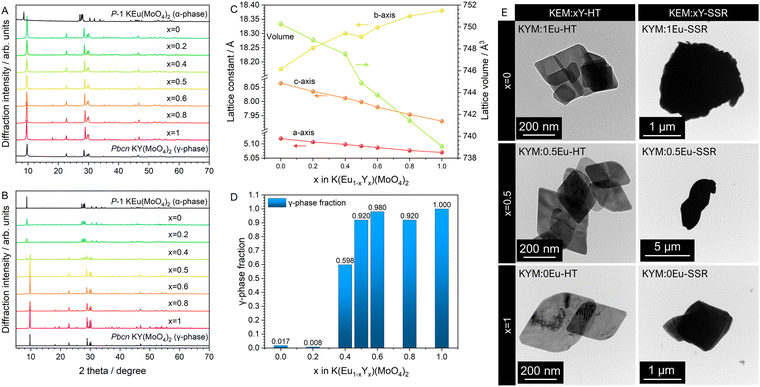
Although the stoichiometric phosphors of KEu(MoO4)2 with both α and γ phases possess layered structures, it is likely that concentration quenching occurs due to the introduction of a high concentration of Eu3+ ions. To investigate the concentration quenching behavior in each crystal phase, we plan to dilute them with Y3+, which has an ionic radius (1.019 Å; CN = 8)30 close to that of Eu3+ ion (1.066 Å; CN = 8).30 Determining the atomic ratio of Y and Eu ions in KEM:Y phosphors is crucial for evaluating the concentration quenching behavior. In this study, before phase determination, elemental analysis for Eu and Y ions in KEM:Y-HT and KEM:Y-SSR phosphors was conducted using X-ray fluorescence (XRF) technique, utilizing a calibration curve with different ratios of each atom. The results of the XRF analysis for the atomic ratio of Eu and Y are summarized in Table 1. It was found that the Eu and Y atomic ratios for KEM:Y phosphors doped with each Y3+ concentration were approximately close to the additive compositions, with an error of ±10 mol% in both synthesis routes of hydrothermal and solid-state reaction methods.Since the chemical composition of the samples was generally as expected, the crystal phases for KEM:Y phosphors were determined using the powder XRD technique. The XRD patterns of the KEM:Y-HT with all Eu contents are depicted in Fig. 6A. The hydrothermal synthesis of KEM:Y resulted in obtaining the γ-KY(MoO4)2 phase at all Y3+ concentrations. The lattice constants of a, b, c, and volume for all KEM:Y-HT phosphors were refined by Rietveld analysis technique, as shown in Fig. 6B. The in-plane directions of a and c-axes monotonically expanded with increasing the Eu concentration due to the relationship between the ionic radius of Eu3+ (1.066 Å, 8-fold) and Y3+ (1.019 Å, 8-fold) ions;30 whereas, the stacking direction of the c-axis shrunk. This anisotropic lattice change may originate from the relaxation of the connecting angle of the EuO8 polyhedron and MoO4 tetrahedron in the [Eu(MoO4)2]− layer. On the other hand, highly crystalline phases were obtained in all samples (Fig. 6C); however, the crystal phase changed from triclinic to orthorhombic at around x = 0.4. Particularly, the KEM:0.6Y sample formed a completely mixed phase of γ and α-phases. According to the quantitative analysis of the phase fractions in KEM:Y-SSR samples by Rietveld refinement (Fig. 6D), the γ-phase fraction was found to be approximately 0.6. However, the obtained phases below/above 0.4 are almost α- and γ-phases, respectively, indicating that the thermodynamically stable area of Y doping concentration for the γ-phase was around 0.4. Additionally, the TEM images of the typical KEM:xY-HT and KEM:xY-SSR (x = 0, 0.5, and 1) phosphors are shown in Fig. 6E. The hydrothermal synthesis of all KEM:Y phosphors resulted in forming hexagonal-shaped plate-like morphology with submicron ordering in the lateral directions, reflecting the layered crystal structure. Conversely, the KEM:Y-SSR sample formed aggregates with micron size, exhibiting a morphology distinct from plate-like structures.
Before discussing the PL and PLE properties, the optical absorption properties of these series of phosphors were measured and are shown in Fig. 7A as normalized Kubelka–Munk converted UV-vis absorption spectra. In both synthesis methods, strong broad absorptions were observed in the UV region, attributed to the charge transfer (CT) transitions from O2− to Mo6+/Eu3+. The KEM:Y-HT samples exhibited the CT band absorption edge at approximately 320 nm across all Y3+ concentrations; while the shoulder band at longer wavelengths around 380 nm disappeared in KEM:Y-SSR with high Y3+ doping. Particularly, the absorption spectra of KEM showed a maximum absorption peak at 360 nm, whereas KYM showed no absorption band at 380 nm, corresponding to a change in crystal phase based on the XRD results. Furthermore, the peak intensity of 4f–4f transitions was weaker than that of the CT band, attributed to the forbidden nature of these transitions. The band gap energies were determined by Tauc plots, as summarized in the inset of Fig. 7A. The band gap energy (Eg) of KEM:Y-HT samples ranged within 4.1–4.3 eV across the entire Y3+ concentration range. In KEM:Y-SSR, the Eg value was markedly higher at higher concentrations around x = 0.2, indicating a phase transition. This behavior also would originate from a phase transition. Fig. 7B shows the PLE spectra monitored at the 5D0 → 7F2 transition for KEM:Y phosphors prepared by both synthetic methods. The PLE spectra consisted of two types of transitions: narrow-lines of intra-4f orbitals of Eu3+ and a broad band due to the CT transition between O2− and Mo6+/Eu3+ orbitals, located at ∼350 nm across all Y doping concentrations, indicating almost no shift, consistent with the results of the optical absorption property. However, the KEM:Y-SSR samples showed a drastic change in the spectra of the CT band with Y3+ concentration. In particular, the α-phase on the lower Y3+ concentration side exhibited an excitation absorption edge on the longer wavelength side at ∼380 nm. Moreover, the optical absorption intensity of 4f–4f forbidden transitions of Eu3+ was remarkably weak compared to that of the CT band, while it was comparable to that of the CT transition in the PLE spectra. This is because the 4f–4f transitions generally have a high conversion efficiency of absorbed photons to luminescence photons (internal quantum efficiency; IQE), despite their low absorption efficiency. Indeed, in this case, the IQEs of the KEM-HT were calculated to be 18.6% excited at 264 nm and 43.5% excited at 395.5 nm, respectively.
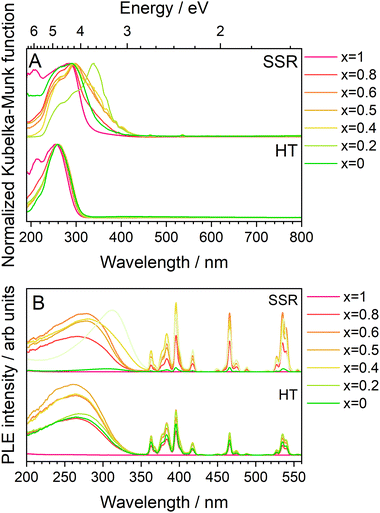 | ||
| Fig. 7 (A) UV-vis absorption spectra transferred by K–M function and (B) PLE spectra monitored at the 5D0 → 7F2 transitions of Eu3+ of KEM:Y phosphors: KEM:Y-HT and KEM:Y-SSR phosphors. | ||
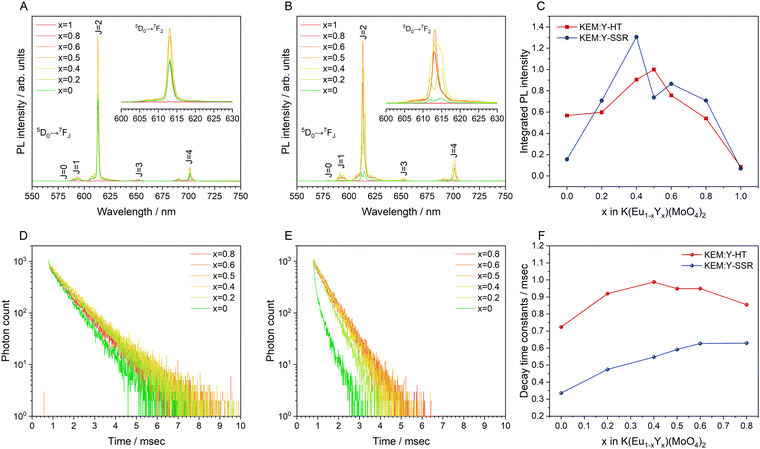
Fig. 8A and B display the photoluminescence (PL) spectra of the KEM:Y-HT and KEM:Y-SSR phosphors excited at 280 nm due to the charge transfer (CT) transition. In the KEM:Y-HT phosphors, the PL spectra consisted of numerous narrow PL peaks due to the specific 5D0 → 7FJ (J = 0–4) (J = 0–4) transitions between the 4f–4f orbitals of the Eu3+ ion, similar to the γ-KEM phosphor. Notably, there was no change in the KEM:Y-HT phosphor samples across all Y3+ concentrations. On the other hand, the PL spectra of KEM:Y-SSR phosphors depended on the Y3+ concentration. Specific two split 5D0 → 7F2 electric dipole transition peaks in the α-KEM were observed on the lower Y3+ concentration side up to x = 0.2, while they converged to a singlet peak at the higher concentration side above x = 0.5, which is a typical spectrum of the γ-KEM material. In the intermediate concentration ranges, at x = 0.4, several transition peaks with a mixture of these were observed, in good agreement with the phase fractions determined by Rietveld analysis from XRD patterns. The dependence plots of the integrated PL intensity on the Y3+ concentrations in KEM:Y-HT and KEM:Y-SSR phosphors are shown in Fig. 8C. The integrated PL intensity of KEM:Y-SSR decreased after x = 0.4; however, evidence of essential concentration quenching could not be obtained from the Eu concentration dependency of the integrated PL intensity because of the phase transition from α-phases (triclinic) to γ-(orthorhombic) in the KEM:Y-SSR with higher Y substitution. Particularly, its transition concentration was found to be x = 0.4–0.5. Therefore, the true critical concentration could not be determined from the Eu concentration dependency of KEM:Y-SSR phosphors. On the other hand, the KEM:Y-HT phosphors stably maintained the γ-phase even at any Y concentration. Therefore, the true Eu concentration quenching for γ-KEM:Y should be investigated using the hydrothermally synthesized KEM:Y phosphors. The integrated PL intensity of KEM:Y-HT increased with the amount of Y3+ until it reached a maximum at x = 0.5 and then decreased. Indeed, it can be confirmed that the optimum concentration differs depending on the synthesis methods. Additionally, it was estimated that the ratios of 5D0 → 7F2/5D0 → 7F1 transitions remained at 10–11, suggesting that the KEM:Y-HT phosphors have a similar central symmetry across the entire Y concentration region, consistent with previous reports.5
Fig. 8D and E depict the PL decay profiles of the KEM:Y-HT and KEM:Y-SSR phosphors, respectively, which were well fitted by the exponential functions of eqn (1) and (2), respectively. Additionally, the average decay constants for KEM:Y-SSR phosphors were calculated by eqn (3), similar to the case of the KEM-SSR phosphor. The decay constant (τ) is estimated to be in the sub-millisecond range, similar to the stoichiometric KEM phosphors, across all Y3+ concentrations. The dependency of the PL lifetimes on Y concentration is shown in Fig. 8F. The PL lifetime of KEM:Y-SSR samples decreases after x = 0.8, while the lifetime of the KEM:Y-HT samples remains almost constant up to x = 0.4, and finally shows a clear shortening of the PL lifetime at x = 0. This series of results provides an accurate estimate of the optimum concentration in total rate solid solution in the γ-phase KEu(MoO4)2:Y phosphors, which is achieved by hydrothermal synthesis rather than the well-studied solid-state reaction method.
As mentioned above, the optimal Eu concentration, denoted as x and referred to as the critical concentration, in K(Eu1−xYx)(MoO4)2 was experimentally determined to be 0.5. This value is significantly higher compared to conventional Eu3+-doped phosphor materials, where x typically ranges from 0.05 to 0.20 in many cases.31,32 To gain a better understanding of this phenomenon, we investigated the critical distance of the Eu3+ ion calculated from structural information. The critical distance, denoted as Rc, is generally determined using the following simple geometrical equation:33
 | (4) |
In the equation provided, x represents the critical concentration of the substituted luminescent ion (Eu), N denotes the number of luminescent ion substitution site atoms in the unit lattice considering multiplicity, and V signifies the lattice volume. Utilizing experimental data obtained from the XRD profile of the K(Eu0.5Y0.5)(MoO4)2 composition, where x = 0.5, N = 4, and V = 744.8941 Å3, respectively, the critical distance Rc is determined to be 8.927 Å. The behavior of concentration quenching is discussed in relation to the layered crystal structure with this critical distance. Fig. 9 illustrates the metal atomic arrangement within the layered structure. In this analysis, we consider the theoretical radial Eu–Eu interatomic distance with Eu as the central atom. Although the Eu site in the γ-KEu(MoO4)2 structure exhibits a slight shift with respect to the b-axis in the in-plane direction, they are predominantly located within the same plane. The Eu–Eu distance of the nearest first shell is estimated to range from approximately 3.94 to 5.06 Å, while the next neighbor (second) shell spans from 6.42 to 10.1 Å. Additionally, the Eu–Eu distance in the third shell exceeds 9.35 Å. Consequently, it is evident that Eu within the second shell strongly contributes to concentration quenching in the in-plane direction. In the stacking direction, the Eu atom in the first shell is positioned between the large K+ ion and two MoO4 layers. Consequently, even though the Eu–Eu distance in the first shell exceeds 9.23 Å, indicating that it is longer than the critical distance, the Eu–Eu interaction in the stacking direction contributes minimally to concentration quenching. In typical three-dimensional crystals, where there is no significant anisotropy in the interatomic distance, concentration quenching typically initiates at the lower concentration side. However, in the case of γ-KEu(MoO4)2:Y phosphors, the high critical concentration is achieved due to interactions solely in the in-plane direction, stemming from the anisotropy of interatomic distances inherent in the layered structure.
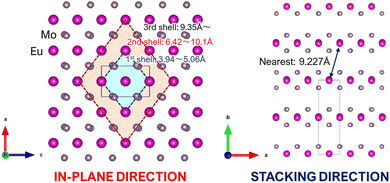 | ||
| Fig. 9 Schematic illustrations of the metal atomic arrangements of layered structure in γ-KEu(MoO4)2: (left) view from in-plane direction (b-axis) and (right) from stacking direction (c-axis). | ||
Conclusions
In this study, we synthesized potassium europium double molybdates (KEu(MoO4)2) with a predominant α-phase and a minor γ-phase using conventional solid-state reaction and hydrothermal reaction methods, respectively. We meticulously evaluated their structural properties and particle morphology and subsequently investigated the differences in photoluminescence (PL) properties based on these structural features. Analysis of the crystal structures determined via Rietveld analysis using XRD profiles revealed that the α-phase adopts a triclinic structure with the P![[1 with combining macron]](https://www.rsc.org/images/entities/char_0031_0304.gif) space group, while the γ-phase exhibits an orthorhombic structure with the Pbcn space group. These determined structures were in excellent agreement with the optimized structures obtained via density functional theory (DFT) simulations, indicating reliable structural determination. TEM and SEM observations revealed that α-phase particles form aggregates with a few micron-sized particles, whereas γ-phase particles exhibit a single-crystalline plate-like morphology with sub-micron dimensions. Both phases exhibit the typical red luminescence of Eu3+ ions, but a significant difference was observed in the PL intensity, with the γ-phase KEu(MoO4)2 displaying notably higher PL intensity than the α-phase. Additionally, the PL peak of the 5D0 → 7F2 transition of Eu3+ in the α-phase was split into a doublet band, whereas in the γ-phase, no split band was observed, which was attributed to the Stark effect resulting from the symmetry of the coordination field of the Eu3+ ions. Analysis of PL lifetime revealed a significant difference in decay constants between the α-phase (0.336 ms) and the γ-phase (0.723 ms), primarily due to the dominance of defects in the α-phase. Furthermore, in the PL excitation spectra of the γ-phase, the excitation edge of the charge transfer transitions between O-p and Mo-d orbitals was shifted towards the blue side compared to the α-phase, consistent with the band gap of the host structure and density of states (DOS) estimated from DFT calculations. In the series of Y-diluted samples (KEM:Y), hydrothermally synthesized KEM:Y phosphors consistently adopted the γ-phase structure regardless of the Y-diluted concentration. In contrast, in the solid-state reaction method, there existed a solid solubility limit of Y3+ ions, predominantly favoring the γ-phase at around 40 mol%. Both PL and PLE spectra of the Y-diluted samples depended on the crystalline phase, with both phases exhibiting the highest PL intensity near 50 mol%. From the structural data of the γ-phase and the critical distance of Eu–Eu within the structure, it was concluded that concentration quenching is not primarily due to interlayer Eu–Eu interactions but rather to a strong contribution of the second Eu–Eu shell within the in-plane direction. This study contributes fundamental insights into phosphor research in layered molybdate materials, which have garnered significant attention in recent years.
space group, while the γ-phase exhibits an orthorhombic structure with the Pbcn space group. These determined structures were in excellent agreement with the optimized structures obtained via density functional theory (DFT) simulations, indicating reliable structural determination. TEM and SEM observations revealed that α-phase particles form aggregates with a few micron-sized particles, whereas γ-phase particles exhibit a single-crystalline plate-like morphology with sub-micron dimensions. Both phases exhibit the typical red luminescence of Eu3+ ions, but a significant difference was observed in the PL intensity, with the γ-phase KEu(MoO4)2 displaying notably higher PL intensity than the α-phase. Additionally, the PL peak of the 5D0 → 7F2 transition of Eu3+ in the α-phase was split into a doublet band, whereas in the γ-phase, no split band was observed, which was attributed to the Stark effect resulting from the symmetry of the coordination field of the Eu3+ ions. Analysis of PL lifetime revealed a significant difference in decay constants between the α-phase (0.336 ms) and the γ-phase (0.723 ms), primarily due to the dominance of defects in the α-phase. Furthermore, in the PL excitation spectra of the γ-phase, the excitation edge of the charge transfer transitions between O-p and Mo-d orbitals was shifted towards the blue side compared to the α-phase, consistent with the band gap of the host structure and density of states (DOS) estimated from DFT calculations. In the series of Y-diluted samples (KEM:Y), hydrothermally synthesized KEM:Y phosphors consistently adopted the γ-phase structure regardless of the Y-diluted concentration. In contrast, in the solid-state reaction method, there existed a solid solubility limit of Y3+ ions, predominantly favoring the γ-phase at around 40 mol%. Both PL and PLE spectra of the Y-diluted samples depended on the crystalline phase, with both phases exhibiting the highest PL intensity near 50 mol%. From the structural data of the γ-phase and the critical distance of Eu–Eu within the structure, it was concluded that concentration quenching is not primarily due to interlayer Eu–Eu interactions but rather to a strong contribution of the second Eu–Eu shell within the in-plane direction. This study contributes fundamental insights into phosphor research in layered molybdate materials, which have garnered significant attention in recent years.
Conflicts of interest
All authors declare that there are no conflicts of interest.Acknowledgements
This work was supported by JSPS KAKENHI Grant Numbers 22K05264 and 20H00297, Nippon Sheet Glass Foundation for Materials Science and Engineering, the Feasibility Study for Young Researchers (FS) in “Crossover Alliance to Create the Future with People, Intelligence and Materials”, MEXT, Japan.Notes and references
- M. Zhao, Q. Zhang and Z. Xia, Mater. Today, 2020, 40, 246–265 CrossRef CAS.
- J. P. M. Van Vliet, G. Blasse and L. H. Brixner, J. Solid State Chem., 1988, 76, 160–166 CrossRef CAS.
- S. S. Perera, H. N. Munasinghe, E. N. Yatooma and F. A. Rabuffetti, Dalton Trans., 2020, 49, 7914–7919 RSC.
- G. Benoît, J. Véronique, A. Arnaud and G. Alain, Solid State Sci., 2011, 13, 460–467 CrossRef.
- Z. Xu, P. Du, Q. Zhu, X. Li, X. Sun and J.-G. Li, Dalton Trans., 2021, 50, 17703–17715 RSC.
- D. K. Amarasinghe, S. S. Perera and F. A. Rabuffetti, Cryst. Growth Des., 2020, 20, 3442–3448 CrossRef CAS.
- Y. Liu, Y. Wang, L. Wang, Y.-Y. Gu, S.-H. Yu, Z.-G. Lu and R. Sun, RSC Adv., 2014, 4, 4754–4762 RSC.
- T. Hasegawa, S. W. Kim, Y. Abe, M. Muto, M. Watanabe, T. Kaneko, K. Uematsu, T. Ishigaki, K. Toda, M. Sato, J. Koide, M. Toda and Y. Kudo, RSC Adv., 2017, 7, 25089–25094 RSC.
- V. V. Atuchin, A. S. Aleksandrovsky, B. G. Bazarov, J. G. Bazarova, O. D. Chimitova, Y. G. Denisenko, T. A. Gavrilova, A. S. Krylov, E. A. Maximovskiy, M. S. Molokeev, A. S. Oreshonkov, A. M. Pugachev and N. V. Surovtsev, J. Alloys Compd., 2019, 785, 692–697 CrossRef CAS.
- P. Shi, Z. Xia, M. S. Molokeev and V. V. Atuchin, Dalton Trans., 2014, 43, 9669–9676 RSC.
- V. A. Morozov, A. V. Arakcheeva, P. Pattison, K. W. Meert, P. F. Smet, D. Poelman, N. Gauquelin, J. Verbeeck, A. M. Abakumov and J. Hadermann, Chem. Mater., 2015, 27, 5519–5530 CrossRef CAS.
- M. Watanabe, K. Uematsu, S. W. Kim, K. Toda and M. Sato, J. Ceram. Process. Res., 2014, 15, 173–176 Search PubMed.
- T. Hasegawa, Y. Kanaoka, S. Noda, A. Okawa and S. Yin, Chem. Lett., 2024, 53, upad005 CrossRef.
- T. Wu, Y. Liu, Y. Lu, L. Wei, H. Gao and H. Chen, CrystEngComm, 2013, 15, 2761–2768 RSC.
- L. Macalik, P. E. Tomaszewski, R. Lisiecki and J. Hanuza, J. Solid State Chem., 2008, 181, 2591–2600 CrossRef CAS.
- C. Guo, S. Wang, T. Chen, L. Luan and Y. Xu, Appl. Phys. A: Mater. Sci. Process., 2009, 94, 365–371 CrossRef CAS.
- V. A. Morozov, S. M. Posokhova, D. V. Deyneko, A. A. Savina, A. V. Morozov, O. A. Tyablikov, B. S. Redkin, D. A. Spassky, J. Hadermann and B. I. Lazoryak, CrystEngComm, 2019, 21, 6460–6471 RSC.
- A. Volokitina, P. Loiko, E. Vilejshikova, X. Mateos, E. Dunina, A. Kornienko, N. Kuleshov and A. Pavlyuk, J. Alloys Compd., 2018, 762, 786–796 CrossRef CAS.
- F. Izumi and K. Momma, Solid State Phenom., 2007, 130, 15–20 CAS.
- P. Giannozzi, S. Baroni, N. Bonini, M. Calandra, R. Car, C. Cavazzoni, D. Ceresoli, G. L. Chiarotti, M. Cococcioni, I. Dabo, A. Dal Corso, S. de Gironcoli, S. Fabris, G. Fratesi, R. Gebauer, U. Gerstmann, C. Gougoussis, A. Kokalj, M. Lazzeri, L. Martin-Samos, N. Marzari, F. Mauri, R. Mazzarello, S. Paolini, A. Pasquarello, L. Paulatto, C. Sbraccia, S. Scandolo, G. Sclauzero, A. P. Seitsonen, A. Smogunov, P. Umari and R. M. Wentzcovitch, J. Phys.: Condens. Matter, 2009, 21, 395502 CrossRef PubMed.
- G. Prandini, A. Marrazzo, I. E. Castelli, N. Mounet and N. Marzari, npj Comput. Mater., 2018, 4, 72 CrossRef.
- K. Momma and F. Izumi, J. Appl. Crystallogr., 2008, 41, 653–658 CrossRef CAS.
- A. D. Dayan, International Tables for Crystallography, International Union of Crystallography, Chester, England, 2016, vol. A Search PubMed.
- S. Shionoya, W. M. Yen and H. Yamamoto, Phosphor handbook, CRC Press, 2018 Search PubMed.
- G. Jia, C. Wang and S. Xu, J. Phys. Chem. C, 2010, 114, 17905–17913 CrossRef CAS.
- A. Herrmann, S. Fibikar and D. Ehrt, J. Non-Cryst. Solids, 2009, 355, 2093–2101 CrossRef CAS.
- T. Hasegawa, N. Sato, S. W. Kim, T. Ishigaki, K. Uematsu, K. Toda and M. Sato, J. Ceram. Soc. Jpn., 2015, 123, 507–511 CrossRef CAS.
- O. L. Malta, S. J. L. Ribeiro, M. Faucher and P. Porcher, J. Phys. Chem. Solids, 1991, 52, 587–593 CrossRef CAS.
- J. Hölsä and P. Porcher, J. Chem. Phys., 1982, 76, 2790–2797 CrossRef.
- R. D. Shannon, Acta Crystallogr., 1976, A32, 751–767 CrossRef CAS.
- S. Wang, T. Wang, H. Zhang, L. Wang, W. Jia and C. Su, J. Lumin., 2020, 226, 4–10 Search PubMed.
- F. Lei, B. Yan and H. H. Chen, J. Solid State Chem., 2008, 181, 2845–2851 CrossRef CAS.
- A. Meijerink and G. Blasse, J. Lumin., 1989, 43, 283–289 CrossRef CAS.
Footnote |
| † Electronic supplementary information (ESI) available. See DOI: https://doi.org/10.1039/d3nj05866b |
| This journal is © The Royal Society of Chemistry and the Centre National de la Recherche Scientifique 2024 |

