 Open Access Article
Modulation of supported Ni catalysts with phosphorus for the hydrogenation of diethyl oxalate to ethyl glycolate†
Qihong
Xue
ab,
Zhikui
Jiang
c,
Chao
Wang
ab,
Xian
Kan
ab,
Jiaming
Wang
a and
Jiangang
Chen
 *a
*a
aState Key Laboratory of Coal Conversion, Institute of Coal Chemistry, Chinese Academy of Sciences, Taiyuan 030001, Shanxi, P. R. China. E-mail: chenjg@sxicc.ac.cn
bUniversity of Chinese Academy of Sciences, Beijing 100049, P. R. China
cChina Shenhua Coal to Liquid Chemical Co., Ltd, China
First published on 4th January 2024
Abstract
In this study, 13-Ni/ZrO2, 13-Ni3P/ZrO2, 13-Ni/SiO2, and 13-Ni3P/SiO2 catalysts were used in the hydrogenation of diethyl oxalate (DEO) to ethyl glycolate (Egly) to investigate the modulating effect of phosphorus. XRD, TEM, and FT-IR spectroscopy results indicated that phosphorus acts as a distributor of Ni metallic particles and thereby shows a segregation effect. The presence of P transformed the linkage of surface metals from an original Ni–Ni–Ni–Ni– to a P–Ni–P–Ni–P state, and FT-IR spectra showed that the former adsorbed CO in a combination of linear and bridging adsorption modes, whereas the latter predominantly in CO linear adsorption. Bridging adsorption occurs via dual sites and makes preliminary hydrogenation products less likely to detach from the catalyst surface, thus facilitating deep hydrogenation, while linear adsorption facilitates partial hydrogenation via rapid detachment of intermediate products such as Egly. Different loadings of Ni3P/SiO2 catalysts show incomplete phosphorylation with an increase in nickel loading, giving rise to a state of coexistence of Ni and Ni3P crystalline phases. This may lead to a coexistence of surface Ni–Ni–Ni–Ni and P–Ni–P–Ni–P and an increase in the corresponding bridging adsorption/linear adsorption ratios, making deep hydrogenation occur partially besides stepwise hydrogenation.
1. Introduction
Ethyl glycolate (Egly) is a kind of fine chemicals with considerable academic and commercial benefits. Owing to its unique molecular structure with α-H, hydroxyl, and ester groups, Egly can undergo carbonylation, oxidation, and hydrolysis.1 As a raw material, it is widely used in the synthesis of pharmaceuticals, fine chemicals, and perfumes. Recently, polyglycolic acid (PGA) as degradable plastic has attracted much attention.2 It has been reported that PGA not only has great significance for ecological health, owing to its excellent biocompatibility and biodegradability, but also has a large market potential owing to the independent supply of starch, whose scarcity restricted its wide application as degradable plastic feedstock.3 Therefore, the task of producing glycolate in an efficient and environment-friendly manner has become particularly urgent nowadays.There are many ways such as the carboxylation of formaldehyde4 and coupling of formaldehyde and methyl formate4b to produce glycolate, but these approaches are limited by harsh production conditions and low yields.5 However, the unique advantages of the “C1 chemical route”, namely, a wide range of products from feedstock sources (such as coal, natural gas, renewable biomass, and organic waste) to syngas exhibiting high yields, environmental friendliness, and atomic economy, offer us a new alternative route.6 Palladium-catalyzed CO coupling with nitrite for the synthesis of oxalate and the partial hydrogenation of oxalate to glycolate is considered to be the most promising route.3a,7 Oxalate hydrogenation is a successive reaction; typically, oxalate is initially hydrogenated to form glycolate, followed by further hydrogenation to ethylene glycol (EG), and finally EG hydrolysis to ethanol (EtOH) (Scheme 1).8 The thermodynamic constant of glycolate to EG is two orders of magnitude, which is larger than that of oxalate to glycolate.9 There is no doubt that achieving high selectivity in the initial hydrogenation of oxalate to a target product is challenging, and the most critical issue in this regard is the development of efficient, stable, and low-cost catalysts.
Catalysts for the initial hydrogenation of oxalate to glycolate are broadly classified into two main categories: homogeneous and heterogeneous. Among them, Ru-based catalysts are the typical representatives of homogeneous catalysts. Boardman et al.10 designed a catalyst utilizing a sulfur-based ligand [MeC(CH2SBu)3] for the selective hydrogenation of dimethyl oxalate (DMO) to methyl glycolate (MG), which shows 100% MG selectivity in a 136 h test. However, the high cost of ruthenium metal, the difficulty in separating the by-products, and the harsh reaction conditions have limited its commercialization. As far as we know, current research on heterogeneous catalysts for the initial hydrogenation of oxalate to MG has mostly focused on Cu- or Ag-based catalysts. The Cu-based catalysts were prepared in a simple way and several supports including activated carbon (AC),11 reduced graphene oxide (RGO),12 hydroxyapatite (HAP),13 ZrO2–SiO2,14 SBA-15,15 Ni-foams,16 and MgO17 were employed to achieve high activity and stability. For instance, our research group reported that 25 wt% Cu/RGO catalyst exhibited remarkable performance, with 100% DMO conversion and 98.8% selectivity of MG in a duration of 300 h at 210 °C.12 However, Cu-based catalysts suffer from the complex challenges of precise Cu0/Cu+ site regulation, poor stability, irreconcilable conversion and glycolate selectivity,3a,18 which still need to be further addressed. Ag-based catalysts have attracted much attention from researchers due to their relatively poor hydrogenation ability and relatively high MG selectivity in oxalate-to-glycolate processes compared to Cu-based catalysts. Chen et al.8 have found that the relatively weak Ag–SiO2 interaction makes Ag/SiO2 especially vulnerable to deactivation and poor stability, and doping with B2O3 can improve this condition. Nevertheless, Ag-based catalysts are limited in scale and practical application due to their precious metal properties and low activity.
Nickel phosphide catalysts exhibit properties like noble metals, showing unique physical properties such as high strength and hardness as well as high activity and stability in hydrogenated environments. They have attracted great attention and have been successfully applied to electrocatalysis, photocatalysis, and thermocatalysis.5,19 Recently, Chen et al.20 have found that Ni2P/TiO2 catalysts can provide 100% conversion of DMO and 76% selectivity to MG during the 3600 h time-on-stream under the reaction conditions of 230 °C, 3 MPa H2 and the weight space velocity (WHSV) of 0.1 h−1, achieving the first breakthrough of nickel phosphide in the hydrogenation of DMO to MG reaction. Furthermore, Zhu et al.6a reported that a Ni3P/Ni-foam catalyst can achieve almost full DMO conversion with a high MG selectivity of 95–97% and is stable for at least 1000 h without any sign of deactivation at 230 °C, 2.5 MPa and a WHSV of 0.44 h−1. Using density functional theory (DFT), they found that Ni3P has a higher electron density, which is favorable for MG adsorption in the molecular structure and suppresses the deep hydrogenation of MG to EG. Meanwhile, Zhao et al.3a reported that a Ni3P/RB-MSN catalyst is capable of fully converting DMO with 85.0% MG selectivity and stable for at least 500 h at 190 °C. The lack of Si–OH in RB-MSN diminishes the interaction of NiO and POx with Si–OH groups, which favors the formation of Ni3P and suppresses the formation of harmful irreducible POx species.
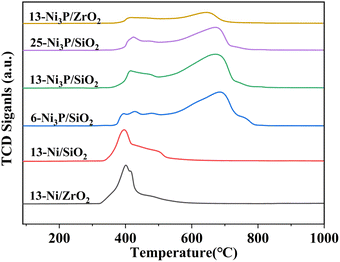
The previous studies made efforts to explain the outstanding effect of the electron density of Ni3P itself and investigate the role of the corresponding meso-SiO2 supports on the reaction performance. SiO2 is usually regarded as an inert support, whereas ZrO2 is functional due to its rich O vacancy. However, the effect of phosphorylation on the form of adsorption of substrate molecules (linear or bridging adsorption) and the role of P in Ni3P formed by phosphorylation (anti-agglomeration and segregation effects) during the nickel phosphide-catalyzed hydrogenation of diethyl oxalate (DEO) to Egly compared to pure Ni are not reported. In this work, we prepared 13-Ni/ZrO2, 13-Ni3P/ZrO2 and 13-Ni/SiO2 (13 is the weight percentage of Ni), and X-Ni3P/SiO2 (X represents the weight percentage of Ni: 6, 13, and 25, respectively) by an incipient wetness impregnation method and the subsequent hydrogen temperature-programmed reduction treatment. We found that both 13-Ni3P/SiO2 and 13-Ni/SiO2 catalysts achieved full conversion of DEO under identical reaction conditions, but the selectivity for Egly (55% vs. 32%), EtOH (40% vs. 62%), and EG (2.7% vs. 4.4%) differed dramatically. In addition, the 6,13,25-Ni3P/SiO2 catalyst gradually showed a deep hydrogenation performance inclined to that of the 13-Ni/SiO2 catalyst by decreasing the selectivity of Egly from 60% to 51% and increasing the selectivity of EG from 1% to 4% with the increase in metal loading. Compared with the 93% conversion of the 13-Ni3P/ZrO2 catalyst, the conversion of the 13-Ni/ZrO2 catalyst was only about 60% with a tendency of gradual deactivation. To elucidate the underlying physicochemical properties and surface adsorption mechanism and gain deep insights into the actual reaction process, we performed in situ DRIFT-IR spectroscopy using CO as a probe molecule in combination with XRD, XPS, TEM, H2-TPR, and N2 adsorption/desorption isotherm characterization.
2. Experimental
2.1. Catalyst preparation
The Ni3P catalyst was synthesized via the traditional temperature-programmed reduction method as previously reported with slight modifications.21 Silica-supported Ni3P catalysts were prepared by incipient wetness impregnation using nickel nitrate (Ni(NO3)2·6H2O – Sinopharm Chemical Reagent Co., Ltd, analytical reagent (AR)) as the nickel precursor and ammonium hydrogen phosphate ((NH4)2HPO4 – Tianjin Wind Ship Chemical Reagent Technology Co., Ltd, AR) as the phosphorus precursor. Taking Ni3P/SiO2 as an example, first, under vigorous stirring, Ni(NO3)2·6H2O (5.81 g) and (NH4)2HPO4 (0.88 g) were added to 20 ml of deionized water with a Ni/P molar ratio of 3. Next, an appropriate amount of HNO3 solution (65 wt%) was added to adjust the pH to 2–3 to obtain a clear solution, and the solution was used to impregnate silica (SiO2 – MACKLIN, SBET = 400 m2 g−1) by the incipient wetness method. After aging at room temperature for 12 h, the obtained samples were dried at 110 °C for 12 h and calcined in air at 500 °C for 4 h. The precursor particles were reduced to nickel phosphide under an H2 stream (80 ml min−1) as the temperature was increased from room temperature to 400 °C at a ramp of 5 °C min−1 and held at 400 °C for 1 h, followed by an increase from 400 °C to 650 °C at a ramp of 2 °C min−1 and held at 650 °C for 2 h. After reduction, the Ni3P/SiO2 catalyst (Ni loading of 13 wt%) was cooled to room temperature under an Ar stream and was passivated under a 1% O2/99%N2 stream for 2 h. A series of catalysts including 13-Ni/ZrO2 (ZrO2-aladdin) and 13-Ni/SiO2 (phosphorus-free, Ni loading of 13 wt%), 13-Ni3P/ZrO2 (Ni loading of 13 wt%), and 6,13,25-Ni3P/SiO2 were also prepared and reduced using the same procedures as described above.2.2. Catalyst characterization
X-ray diffraction (XRD) measurement was conducted to analyze the structure and crystallinity of the active phase of nickel phosphide. XRD patterns were obtained using a Shimadzu XRD-6000 diffractometer with Cu Kα radiation (λ = 1.5418 Å) in the 2θ range from 5° to 80° at a scanning rate of 4° min−1.Transmission electron microscopic (TEM) and high-resolution TEM (HRTEM) images were acquired using a JEM 2100F. Before imaging, the catalyst sample was ultra-sonically dispersed in ethanol and dropped onto a carbon-coated copper grid. Meanwhile, the elemental compositions of the catalysts were identified by an EDS mapping analysis.
The specific surface areas (SBET) were determined through Brunauer–Emmett–Teller (BET) measurements using a Tristar II3020 N2 adsorption analyzer. In addition, the average pore diameters and pore size distributions were analyzed by the Barrett–Joyner–Halenda (BJH) method.
X-ray photoelectron spectroscopy (XPS) measurements were carried out using a Thermo Scientific ESCALAB 250Xi to determine the surface composition and valence state of the elements. The binding energies (BEs) were calibrated referencing adventitious C 1s at 284.8 eV. The actual P and Ni loadings of catalysts were quantitatively determined by inductively coupled plasma-atomic emission spectroscopy (ICP-AES) using a 730/Agilent 7700.
H2-temperature-programmed reduction (H2-TPR) profiles of the catalyst precursors were obtained in a laboratory-built programmed-temperature reduction installation constructed with a gas chromatograph (GC-950) and an energy-efficient tubular resistance furnace (SKZ-25-BD), as well as a computer for data recording. First, 100 mg of catalyst was heated at a flow rate of 50 ml min−1 (H2/N2 = 5%) to 800 °C at a rate of 10° min−1. H2 consumption was recorded during this ramp-up process using a thermal conductivity detector (TCD).
For NH3-TPD, each sample of 0.1 g was first reduced in a temperature-programmed way under a 5 vol% H2/Ar flow (30 ml min−1) from 50 to 500 °C at a heating rate of 10 °C min−1 to remove the passivated layer, and after cooling down to 50 °C under a Ar flow (30 ml min−1), the sample was continuously treated under a 5 vol% NH3/Ar flow (30 ml min−1) at 50 °C for 0.5 h to fully adsorb NH3 followed by 30 min Ar purging at room temperature, and finally, the sample was heated from 50 to 600 °C under an Ar flow at a rate of 30 ml min−1 at a heating rate of 10 °C min−1.
In situ time-resolved diffuse reflectance Fourier transform infrared (DRIFT-IR) spectroscopy of CO adsorption was performed using a Bruker TENSOR27 FT-IR spectrometer equipped with an MCT detector. For CO adsorption, the sample in the cell was pre-treated at 450 °C for 1 h under a pure H2 flow (30 ml min−1) to remove the passivated layer and then cooled to 220 °C (simulation of actual reactant temperature) under an Ar flow, and the background spectrum was recorded at this time. Then, a 10% CO/90% N2 flow was introduced into the cell at a rate of 30 ml min−1 for 30 min. Finally, an Ar flow (30 ml min−1) was switched to remove the free CO molecules, and the spectrum of 1000–4000 cm−1 was recorded at 1, 5, 10, 15, 25, 35, 45, and 55 min.
2.3. Catalytic test
DEO gas-phase hydrogenation performance testing of nickel phosphide catalysts was performed using a fixed-bed reactor. The nickel phosphide catalyst was tested under the following conditions: T = 190–230 °C, WHSV = 1–2 h−1, H2/DEO = 40, 80, and 120, and P = 1.5, 2, and 2.5 MPa. A mass of 0.6 g of X-Ni3P/SiO2 or 1.0 g of 13-Ni3P/ZrO2 catalyst was placed in a 10 mm-diameter stainless steel reaction tube. The nickel phosphide catalyst was placed in the thermostatic zone of the reactor and the upper and lower ends were filled with quartz sand. Before the reaction starts, the nickel phosphide catalyst is reduced again to remove the passivated layer at 500 °C in a fixed bed under an H2 atmosphere of 80 ml min−1 for 2 h. DEO is pumped from the feedstock tank into the fixed bed reactor using a double plunger pump. A gasification unit with a temperature of 200 °C is installed between the pump outlet and the fixed bed reactor inlet. The analysis of the liquid phase products was performed using a gas chromatograph equipped with a capillary column (Agilent HP-INNOWAX) and an FID detector. The detection of small amounts of water in the samples was performed using a chromatograph equipped with a TCD detector and a TDX-101 column. DEO conversion and product selectivity were calculated as follows [eqn (1) and (2)]: | (1) |
 | (2) |
3. Results
3.1 Characterization of the catalysts
| Catalyst | S BET (m2 g−1) | V pore (cm3 g−1) | D pore (nm) | Contentd (wt%) | Bulk Ni/Pd | Surficial Ni/Pe | Crystal sizef (nm) | |
|---|---|---|---|---|---|---|---|---|
| Ni | P | |||||||
| a Specific surface area determined using the standard Brunauer–Emmett–Teller theory on the N2 adsorption isotherm. b Pore volume estimated from the amount of N2 adsorbed at P/P0 = 0.99. c Pore diameter determined using the Barrett–Joyner–Halenda (BJH) theoretical model. d Measured via ICP-OES analysis. e Measured via XPS analysis. f Calculated using the Scherrer equation from XRD patterns. | ||||||||
| 13-Ni/ZrO2 | 8 | 0.04 | 19.45 | 12.08 | — | — | — | 56.40 |
| 13-Ni3P/ZrO2 | 11 | 0.06 | 20.00 | 11.96 | 1.24 | 5.09 | 18.72 | 9.50 |
| 13-Ni/SiO2 | 262 | 0.71 | 10.56 | 12.92 | — | — | — | 27.30 |
| 6-Ni3P/SiO2 | 274 | 0.79 | 11.24 | 6.06 | 1.04 | 3.08 | 8.24 | 1.14 |
| 13-Ni3P/SiO2 | 240 | 0.70 | 11.19 | 12.56 | 2.17 | 3.05 | 4.37 | 15.30 |
| 25-Ni3P/SiO2 | 208 | 0.61 | 11.27 | 23.19 | 4.06 | 3.01 | 4.40 | 20.90 |
| ZrO2 | 8 | 0.03 | 14.40 | — | — | — | — | — |
| SiO2 | 400 | — | — | — | — | — | — | — |
The ICP-AES results indicate that the measured values of the Ni/P molar ratio in the synthesis catalyst are consistent with the theoretical values. However, the surface Ni/P molecular ratio values obtained by XPS are all significantly higher than the bulk phase values measured by ICP. This may be due to the fact that some of the P escapes as phosphine gas during the high-temperature reduction process and others present as phosphide that is more stabilized in the bulk phase. With the increase in nickel content, from 6, 13 to 25-Ni3P/SiO2 catalyst, SBET and Vp decreased. This may be due to the increase in particle size and incomplete phosphorylation. Naturally, ZrO2 is a low surface support, while the values of SBET, Vp, and Dp for 13-Ni/ZrO2 and 13-Ni3P/ZrO2 catalysts were greater than or equal to that of ZrO2. This may be caused by the small specific surface area of the carrier itself, and the active substances might form additional pore structures.
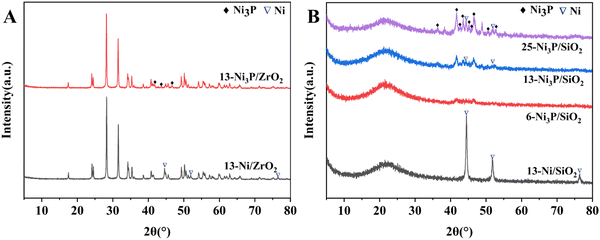
Ni3P diffraction peaks for 13-Ni3P/SiO2 and 25-Ni3P/SiO2 catalysts were stepwise stronger and Ni diffraction peaks started to appear in both of them, and the intensity of Ni diffraction peaks for 25-Ni3P/SiO2 catalyst was relatively strong. This pattern proves once again that phosphorus in Ni3P acts as a disrupter and shows a segregation effect, but it is clear that this effect (phosphorylation) is weakened with the increase in Ni loading and particle size.
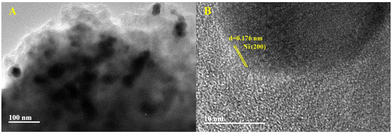
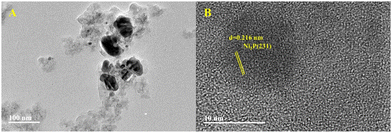
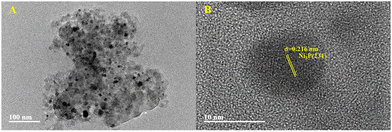
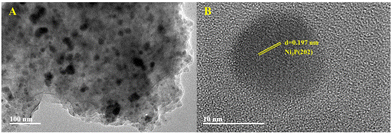
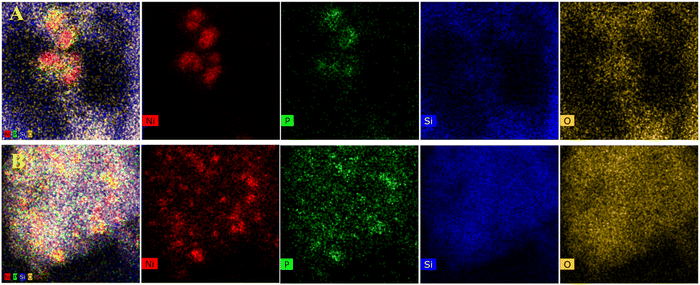
As shown in Fig. 2–5B, the HRTEM images confirmed the formation of Ni crystalline phases in Ni/SiO2 and Ni/ZrO2 (Fig. S1B, ESI†) catalysts and Ni3P crystalline phases in 13-Ni3P/ZrO2 (Fig. S2B, ESI†) and 6,13,25-Ni3P/SiO2 catalysts. The HRTEM images revealed that Ni particles with a lattice spacing of 0.176 nm are attributed to the (200) plane, while Ni3P particles with a lattice spacing of 0.216 nm are attributed to the (231) plane, and in particular Ni3P particles with a lattice spacing of 0.197 nm are attributed to the (202) plane as probed in the 25-Ni3P/SiO2 catalyst. Furthermore, the EDS mapping of Fig. 6A and B shows that Ni and P are homogeneously dispersed in the catalyst. This can also be verified from Table 1 crystal size calculations, where the average grain size is 56.4 nm for the 13-Ni/ZrO2 catalyst and decreased to 9.50 nm for the 13-Ni3P/ZrO2 catalyst. Similarly, the dimension is 27.30 nm for the 13-Ni/SiO2 catalyst and decreased to 15.30 nm for the 13-Ni3P/SiO2 catalyst. Meanwhile, with the increase in Ni loading of 6,13, 25-Ni3P/SiO2 catalysts, the grain size also increased sequentially (1.14, 15.30, and 20.90 nm), which was not favorable for phosphatization.
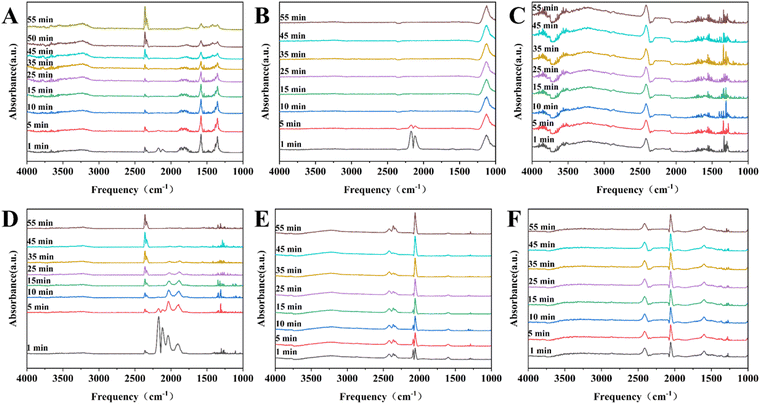
![[double bond, length as m-dash]](https://www.rsc.org/images/entities/char_e001.gif) O, is widely used as a probe molecule in the in situ DRIFT-IR technique to investigate the chemisorption properties of nickel sites on the catalyst surface.24 As shown in Fig. 8A and B, the time-resolved DRIFT-IR spectra for the 13-Ni/ZrO2 and 13-Ni3P/ZrO2 catalysts disclosed two intense bands at ca. 2115 and 2170 cm−1, due to the typical free or physisorbed CO molecules, which can be eliminated after 10 min with the purge of Ar flow.24,25 In Fig. 8D, it is shown that the bands at ca. 2077 and 1800–1900 cm−1 are attributed to linear and bridged adsorption of CO molecules, respectively,24,25 but the intensity gradually decreases upon Ar purging. After 55 minutes of purging, those peaks disappeared completely. It is a rather different story in the Ni3P case, where an intense band can be detected at ca. 2077 cm−1 (linear adsorption), its extinction coefficient is large and the adsorption peak remains well after 55 min of Ar purge (Fig. 8E and F). Fig. 8C does not show any form of adsorption peaks for CO, which could be attributed to the lower loading of the 6-Ni3P/SiO2 catalyst with good dispersion and smaller particle size, and hence, weaker adsorption strength.
O, is widely used as a probe molecule in the in situ DRIFT-IR technique to investigate the chemisorption properties of nickel sites on the catalyst surface.24 As shown in Fig. 8A and B, the time-resolved DRIFT-IR spectra for the 13-Ni/ZrO2 and 13-Ni3P/ZrO2 catalysts disclosed two intense bands at ca. 2115 and 2170 cm−1, due to the typical free or physisorbed CO molecules, which can be eliminated after 10 min with the purge of Ar flow.24,25 In Fig. 8D, it is shown that the bands at ca. 2077 and 1800–1900 cm−1 are attributed to linear and bridged adsorption of CO molecules, respectively,24,25 but the intensity gradually decreases upon Ar purging. After 55 minutes of purging, those peaks disappeared completely. It is a rather different story in the Ni3P case, where an intense band can be detected at ca. 2077 cm−1 (linear adsorption), its extinction coefficient is large and the adsorption peak remains well after 55 min of Ar purge (Fig. 8E and F). Fig. 8C does not show any form of adsorption peaks for CO, which could be attributed to the lower loading of the 6-Ni3P/SiO2 catalyst with good dispersion and smaller particle size, and hence, weaker adsorption strength.
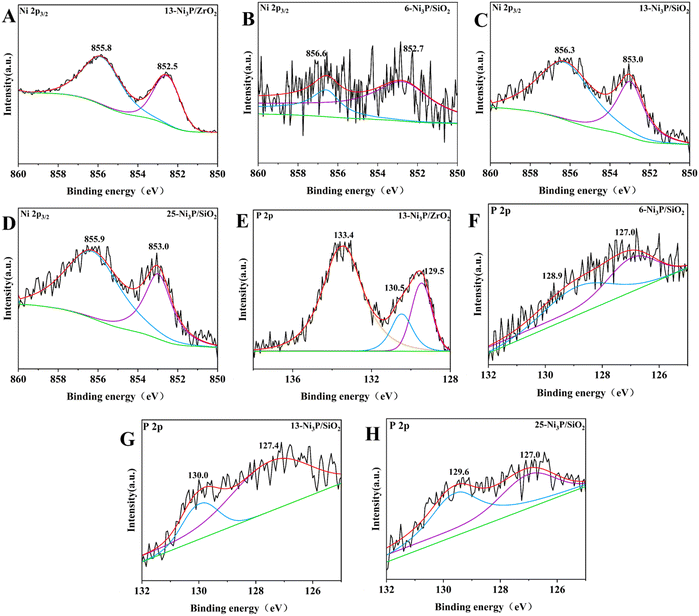
The XPS spectra of 13-Ni3P/ZrO2 and 6,13,25-Ni3P/SiO2 in the Ni 2p3/2 and P 2p regions are shown in Fig. 10. The peak at the binding energy (B.E.) of 852.5–853.0 eV is attributed to Niδ+, possibly in the form of Ni3P due to partial electron transfer from Ni to P.28 Compared with 13-Ni/ZrO2, the Niδ+ composition became larger in 13-Ni3P/ZrO2, suggesting phosphating aid to stabilize the low-valency Ni during passivation. The peaks of oxidized species at B.E.s of 855.9–856.6 eV for Ni2+ and 133.4 eV for P oxide might be associated with the surface oxidation of nickel phosphide in the passivation and subsequent exposure to air.29 Interestingly, the ratio of metallic Niδ+ to oxidized Ni2+ in the XPS spectra gradually decreases with the increase in nickel loading of the 6,13,25-Ni3P/SiO2 catalyst. This may be associated with the increased size of nickel particles and less phosphatization, leading to a larger proportion of metallic nickel present in the catalyst.
In the region of P 2p, two peaks of P 2p3/2 and P 2p1/2 at 129.5 and 130.5 eV were assigned to partially negative Pδ− (0 < δ < 2) in Ni3P.26a,d For 6,13,25-Ni3P/SiO2, two peaks at 127.0–127.4 and 128.9–130.0 eV appeared, and both were lower than those of elemental phosphorus (130.2 eV). The two peaks are assigned to reduced Pδ1− and Pδ2− (δ1 > δ2).27,30 Similarly, the total peak intensity of the two reduced P species was higher than that of the almost undetectable oxidized P species, suggesting that the Ni3P catalyst was present at a more reduced state.27 In other words, there is more nickel metal to provide electrons to phosphorus.
3.2. Catalytic performance of the catalysts
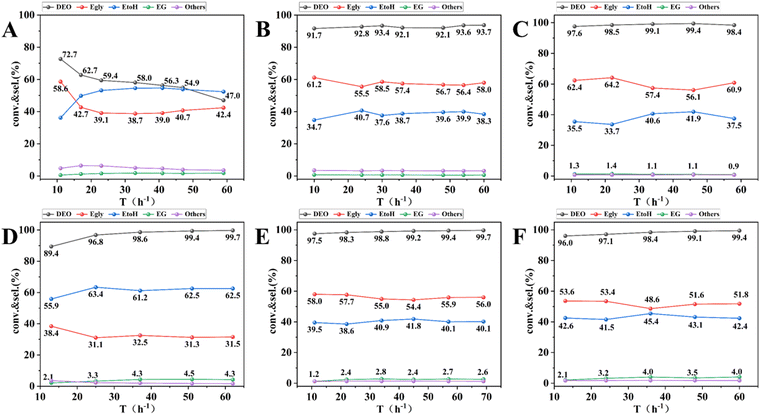
The catalytic performance of 13-Ni/ZrO2, 13-Ni3P/ZrO2, 13-Ni/SiO2, and 6,13,25-Ni3P/ZrO2 catalysts was tested in a continuous fixed-bed reactor using pure DEO raw materials, and the results are shown in Fig. 10. The 13-Ni/ZrO2 catalyst achieved 72% DEO conversion at the beginning of the reaction, however, the conversion started to decrease rapidly with the increase in the running time and showed obvious signs of deactivation (Fig. 11A). In contrast, the 13-Ni3P/ZrO2 catalyst achieved 93% DEO conversion and about 56% Egly selectivity without any signs of deactivation over the run time (Fig. 11B). For comparison, between the above two catalysts, the latter catalyst showed a great improvement in stability after phosphorylation. Over 13-Ni/SiO2, DEO conversion up to 99% was accompanied by a lower Egly selectivity of 31% and higher selectivities of 62% EtOH and 4.4% EG (Fig. 11D). Interestingly, the selectivities of Egly, EtOH, and EG were 55%, 40%, and 2.5%, respectively, over the 13-Ni3P/SiO2 catalyst at near-complete conversion of DEO (Fig. 11E). Compared with the catalytic performance of 13-Ni/SiO2 catalysts, the 13-Ni3P/SiO2 catalysts exhibited a weaker ability for deep hydrogenation, or phosphorylation was favorable to inhibit the catalyst's ability for deep hydrogenation. Such a phenomenon is also observed in Ni/ZrO2 systems. In addition, the catalysts on silica carriers (13-Ni/SiO2, 13-Ni3P/SiO2) are more highly dispersed and show stronger metal–support interaction than those on zirconium dioxide carriers (13-Ni/ZrO2 and 13-Ni3P/ZrO2) in terms of stability, activity, and selectivity.As shown in Fig. 11C, E and F, the increase in the nickel loading of the 6,13,25-Ni3P/SiO2 catalyst had little effect on the conversion of DEO, which again verified the excellent performance of the Ni3P active phase. The selectivity of Egly gradually decreased from 60% to 51%, which could be attributed to the combined effect of Ni and Ni3P active phases. As the loading increased, it is performance similar to that of 13-Ni/SiO2, showing more share of hydrogenation. This trend was more obvious for the EG selectivity, which increased from about 1% to about 4%.
Meanwhile, we also systematically investigated the effects of various reaction conditions on the performance of 13-Ni3P/SiO2 catalysts during the DEO hydrogenation reaction (see ESI†). The testing experiments were performed in the temperature range of 175–220 °C, WHSV range of 1.0–2.0 h−1, H2/DMO molar ratio range of 40–120, and pressure range of 1.5–2.5 MPa, with the results shown in Fig. S4 (ESI†). Remarkably, when the reaction temperature was decreased to 190 °C, 94% DEO conversion and 71% selectivity were still achieved for Egly. A further temperature drop to 185 °C (the boiling point of DEO is 185 °C) reduced the DEO conversion to 84%, and interestingly, at 175 °C, the catalyst still had 71% conversion (Fig. S4A, ESI†). The above performance demonstrates that the catalyst has a very wide operating window, which is important for the catalyst's large-scale application. In addition, the catalyst was more responsive to WHSV and H2/DEO, but did not seem to be very sensitive to the changes in reaction pressure.
4. Discussion
4.1. Effect of phosphatization on the Ni surface texture
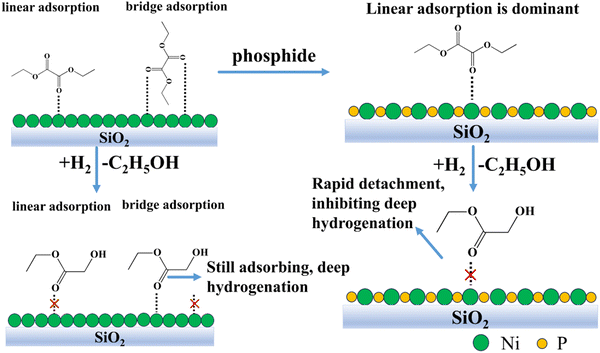
The role of phosphorus in nickel phosphide catalysts has been the subject of several studies. For example, Liu et al.22b suggested that the ensemble effect of P in nickel phosphide catalysts facilitates the decrease in the interaction between chlorine and nickel atoms, which promotes the hydrodechlorination reaction and the removal of chlorine ions from the catalyst surface. Similarly, Chen et al.20 also suggested that the ensemble effect of P prevents the sintering of Ni2P crystals and improves their stability at high temperatures. Cecilia et al.31 showed that catalysts with high phosphorus amounts do not deactivate at high oxygen concentrations, which may be due to the fact that water preferentially interacts with excess phosphorus on the surface of the catalysts, thus preventing the nickel phosphide particles from oxidation.In this work, for 13-Ni/ZrO2 and 13-Ni3P/ZrO2 catalysts, the introduction of phosphorus favors an increase in the dispersion of the active substance and a decrease in crystallite size. This is verified by the calculations of the Scherrer equation, for instance, the decline in grain size from 56.4 nm for 13-Ni/ZrO2 catalysts to 9.5 nm for 13-Ni3P/ZrO2 catalysts. This might explain the difference in stability and selectivity after phosphatization. This confirms the fact that the Ni3P phase is a better catalytic phase than pure Ni. Meanwhile, the larger particle size may also be an important reason for the rapid sintering deactivation of 13-Ni/ZrO2 catalysts. The large differences in the selectivity of Egly (31% vs. 55%), EtOH (62% vs. 40%), and EG (4.4% vs. 2.5%) for 13-Ni/SiO2 and 13-Ni3P/SiO2 at both DEO conversions close to 99% illustrate the important role of P inhibiting hydrogenation from a deeper level. To trace the reasons, on the one hand, we argue that the emergence of P acts as a segregator and breaks the Ni–Ni linkage, demonstrating the anti-agglomeration effect, which has similar implications to the overall effect of P as suggested by previous researchers. The above conclusion can be verified from the XRD characterization results, and the diffraction peaks of Ni crystal phase are stronger than that of Ni3P, indicating that the grain size of single nickel is significantly larger than that of Ni3P. Combined with the TEM characterization results, it can also be intuitively seen that the grain size of Fig. 2A is larger than that of Fig. 4A. In addition, the uniform distribution of nickel and phosphorus in the EDS mapping of Fig. 6B suggests that phosphorus may insert Ni3P lattice evenly. The role of surface P atoms is both beneficial and detrimental, as argued by Bui et al.19 The P atoms protect the stability of the nickel phosphide phase and destabilize the coke-producing Ni system. However, an excess of P atoms will overcover the exposed Ni sites and reduce the availability of active nickel sites. On the other hand, we suggest that Ni alone is prone to the surface metal structure of –Ni–Ni–Ni–Ni–, which is favorable for synergistic adsorption, i.e., the co-existence of linear and bridging adsorption. The presence of P makes the surface texture shift from –Ni–Ni–Ni–Ni– to P–Ni–P–Ni–P mode, and the surface atom assembly in the latter is favorable for linear adsorption (Fig. 12). Therefore, it is proposed that the diversity of the adsorption form comes from surface atom arrangement after phosphatization. Such a texture change dominates the reaction performance, with phosphide displaying partial hydrogenation ability and yielding a higher Egly selectivity than that of pure Ni.
4.2. Effect of phosphatization on chemical adsorption and reactivity
The form of substrate adsorption on the active substance has a large influence on the reaction performance, which was elucidated by FT-IR characterization. Fig. 8A and C show that the adsorption peaks of CO weakened after 10 min until it disappeared. Both 13-Ni/ZrO2 and 13-Ni3P/ZrO2 have a certain adsorption capacity for CO, but the adsorption strength is weak, which indicates that the activation of the active sites on the substrate is weak, so the conversion rate over ZrO2 is relatively poor, and the ability of deep hydrogenation is not very strong. The reason for this may be related to the poor dispersion of the active site itself, on the one hand, and the poor interaction between the carrier and the active substance, on the other hand.Fig. 8D and E show that 13-Ni/SiO2 and 13-Ni3P/SiO2 have strong adsorption capacity for CO, indicating that both of them have strong activation ability for the substrate, and hence, the DEO conversion of both of them is greater than 99%. It is worth noting that the diversity of adsorption forms (linear, bridged adsorption) plays a critical role. When in the bridged adsorption mode, the DEO molecule connects via two sites. This makes it more difficult for the initial hydrogenation products to detach from the catalyst surface, and thus, facilitates deep hydrogenation. In contrast, linear adsorption inhibits deep hydrogenation by rapid detachment from the catalyst surface after initial hydrogenation is complete (Fig. 12). This might explain the large difference in product selectivity between the catalysts before and after phosphatization.
The 6,13,25-Ni3P/SiO2 catalyst showed a trend of decreasing Egly selectivity and high EG selectivity with an increase in nickel loading. Wu,18 Ding32 and Zhu33et al. suggested that the surface acidic sites contribute to C![[double bond, length as m-dash]](https://www.rsc.org/images/entities/char_e001.gif) O/C–O bond breaking and selective hydrogenation. The NH3-TPD (Fig. S6c–f, ESI†) results indicated that weak acidity and a relatively low acid content contribute to C
O/C–O bond breaking and selective hydrogenation. The NH3-TPD (Fig. S6c–f, ESI†) results indicated that weak acidity and a relatively low acid content contribute to C![[double bond, length as m-dash]](https://www.rsc.org/images/entities/char_e001.gif) O/C–O bond activation. Therefore, the deep hydrogenation of Egly to EG and the dehydration between Egly and EtOH molecules are weak, and when the Ni content increases, both the surface acid strength and content increase in favor of C
O/C–O bond activation. Therefore, the deep hydrogenation of Egly to EG and the dehydration between Egly and EtOH molecules are weak, and when the Ni content increases, both the surface acid strength and content increase in favor of C![[double bond, length as m-dash]](https://www.rsc.org/images/entities/char_e001.gif) O/C–O bond activation. As a result, the Egly selectivity decreases and the EG selectivity increases, which is in agreement with the evaluation results. The XRD results indicated the coexistence of Ni and Ni3P crystalline phase with the increase in nickel loading, which indicated that there was a certain limit of the phosphatization effect when the Ni particle was relatively large. When the particles increase to a certain degree, the phenomenon of incomplete phosphatization occurs, and the TEM results also show that incomplete phosphatization leads to the phenomenon of decreasing dispersion and increasing particles. In addition, we believe that this result may lead to a gradual increase in the ratios of surface –Ni–Ni–Ni–Ni– and P–Ni–P–Ni–P with the increase in nickel loading, or the corresponding ratios of bridging/line adsorption gradually increased. Ultimately, due to the increase in the ratio of bridging adsorption, the initial hydrogenation products are not easy to detach and are prone to go to deep hydrogenation.
O/C–O bond activation. As a result, the Egly selectivity decreases and the EG selectivity increases, which is in agreement with the evaluation results. The XRD results indicated the coexistence of Ni and Ni3P crystalline phase with the increase in nickel loading, which indicated that there was a certain limit of the phosphatization effect when the Ni particle was relatively large. When the particles increase to a certain degree, the phenomenon of incomplete phosphatization occurs, and the TEM results also show that incomplete phosphatization leads to the phenomenon of decreasing dispersion and increasing particles. In addition, we believe that this result may lead to a gradual increase in the ratios of surface –Ni–Ni–Ni–Ni– and P–Ni–P–Ni–P with the increase in nickel loading, or the corresponding ratios of bridging/line adsorption gradually increased. Ultimately, due to the increase in the ratio of bridging adsorption, the initial hydrogenation products are not easy to detach and are prone to go to deep hydrogenation.
5. Conclusion
In summary, the differences in the properties of 13-Ni/ZrO2, 13-Ni3P/ZrO2, 13-Ni/SiO2, and 13-Ni3P/SiO2 suggest that the introduction of phosphorus favors the segmentation of the Ni–Ni linkage; thus, it acts as a delimiter and exhibits segregation effect. The results of FT-IR and XRD evidenced that the existence of P transformed the surface metal distribution state from –Ni–Ni–Ni–Ni– to P–Ni–P–Ni–P. The former adsorbed CO as a combination of linear and bridging adsorption, while the latter was mainly dominated by linear adsorption. Bridging adsorption makes the preliminary hydrogenation products less likely to detach from the catalyst surface, thus facilitating deep hydrogenation, while linear adsorption inhibits deep hydrogenation via rapid detachment after the initial hydrogenation. The difference in the performance of the product selectivity of the 6,13,25-Ni3P/SiO2 catalysts shows that the incomplete phosphorylation with the increase in nickel loading gives rise to a state of coexistence of Ni and Ni3P crystalline phases. This may lead to the coexistence of surface –Ni–Ni–Ni–Ni– and P–Ni–P–Ni–P and an increase in the corresponding bridging adsorption/linear adsorption ratios, making deep hydrogenation occur partially.Conflicts of interest
There are no conflicts to declare.Acknowledgements
This work was supported by the National Natural Science Foundation of China (22072175). Special thanks to the Chinese Academy of Sciences Strategic Pioneer Special Fund for a grant to support every experiment (XDA29030402).References
- B. W. Wang, Q. Xu, H. Song and G. H. Xu, J. Nat. Gas Chem., 2007, 16, 78–80 CrossRef CAS.
- Y. Sun, H. Wang, J. H. Shen, H. C. Liu and Z. M. Liu, Catal. Commun., 2009, 10, 678–681 CrossRef CAS.
- (a) G. F. Zhao, H. Li, J. Q. Si, Q. Nie, C. Meng, Y. Liu and Y. Lu, ACS Sustainable Chem. Eng., 2021, 9, 16719–16729 CrossRef CAS; (b) P. K. Samantaray, A. Little, D. M. Haddleton, T. McNally, B. W. Tan, Z. Y. Sun, W. J. Huang, Y. Ji and C. Y. Wan, Green Chem., 2020, 22, 4055–4081 RSC.
- (a) S. Y. Lee, J. C. Kim, J. S. Lee and Y. G. Kim, Ind. Eng. Chem. Res., 1993, 32, 253–259 CrossRef CAS; (b) F. E. Celik, H. Lawrence and A. T. Bell, J. Mol. Catal. A: Chem., 2008, 288, 87–96 CrossRef CAS.
- Z. L. Zhuang, Y. H. Li, F. Chen, X. K. Chen, Z. Li, S. Y. Wang, X. P. Wang, H. J. Zhu, Y. Tan and Y. J. Ding, Chem. Commun., 2022, 58, 1958–1961 RSC.
- (a) J. Zhu, L. Q. Cao, C. Y. Li, G. F. Zhao, T. Zhu, W. Hu, W. D. Sun and Y. Lu, ACS Appl. Mater. Interfaces, 2019, 11, 37635–37643 CrossRef CAS PubMed; (b) H. J. Huang, B. Wang, Y. Wang, Y. J. Zhao, S. P. Wang and X. B. Ma, Catal. Today, 2020, 358, 68–73 CrossRef CAS.
- A. Y. Yin, C. Wen, W. L. Dai and K. N. Fan, Appl. Catal., B, 2011, 108, 90–99 CrossRef.
- H. M. Chen, J. J. Tan, J. L. Cui, X. H. Yang, H. Y. Zheng, Y. L. Zhu and Y. W. Li, Mol. Catal., 2017, 433, 346–353 CrossRef CAS.
- J. Sun, J. F. Yu, Q. X. Ma, F. Q. Meng, X. X. Wei, Y. N. Sun and N. Tsubaki, Sci. Adv., 2018, 4 Search PubMed.
- B. Boardman, M. J. Hanton, H. van Rensburg and R. P. Tooze, Chem. Commun., 2006, 2289–2291 RSC.
- Y. Y. Cui, B. Wang, C. Wen, X. Chen and W. L. Dai, ChemCatChem, 2016, 8, 527–531 CrossRef CAS.
- M. Abbas, Z. Chen and J. G. Chen, J. Mater. Chem. A, 2018, 6, 19133–19142 RSC.
- C. Wen, Y. Y. Cui, X. Chen, B. N. Zong and W. L. Dai, Appl. Catal., B, 2015, 162, 483–493 CrossRef CAS.
- D. H. Wang, C. C. Zhang, M. Y. Zhu, F. Yu and B. Dai, ChemistrySelect, 2017, 2, 4823–4829 CrossRef CAS.
- Y. N. Wang, X. P. Duan, J. W. Zheng, H. Q. Lin, Y. Z. Yuan, H. Ariga, S. Takakusagi and K. Asakura, Catal. Sci. Technol., 2012, 2, 1637–1639 RSC.
- Y. F. Chen, L. P. Han, J. Zhu, P. J. Chen, S. Y. Fan, G. F. Zhao, Y. Liu and Y. Lu, Catal. Commun., 2017, 96, 58–62 CrossRef CAS.
- M. Abbas, J. Zhang, Z. Chen and J. G. Chen, New J. Chem., 2018, 42, 17553–17562 RSC.
- P. Wu, J. Zhang, Z. J. Huang and J. A. Chen, Fuel, 2022, 324 Search PubMed.
- P. P. Bui, S. T. Oyama, A. Takagaki, B. P. Carrow and K. Nozaki, ACS Catal., 2016, 6, 4549–4558 CrossRef CAS.
- H. M. Chen, J. J. Tan, Y. L. Zhu and Y. W. Li, Catal. Commun., 2016, 73, 46–49 CrossRef CAS.
- (a) S. T. Oyama, X. Wang, Y. K. Lee, K. Bando and F. G. Requejo, J. Catal., 2002, 210, 207–217 CrossRef CAS; (b) S. T. Oyama, X. Wang, Y. K. Lee and W. J. Chun, J. Catal., 2004, 221, 263–273 CrossRef CAS.
- (a) X. G. Liu, J. X. Chen and J. Y. Zhang, Catal. Commun., 2007, 8, 1905–1909 CrossRef CAS; (b) X. G. Liu, J. X. Chen and J. Y. Zhang, Ind. Eng. Chem. Res., 2008, 47, 5362–5368 CrossRef CAS.
- S. F. Yang, C. H. Liang and R. Prins, J. Catal., 2006, 237, 118–130 CrossRef CAS.
- H. Zhang, R. Zhang, W. Zhang, B. Gu, Q. Tang, Q. Cao and W. Fang, Appl. Catal., B, 2023, 330 CAS.
- H. Zhang, T. Y. Gao, Q. E. Cao and W. H. Fang, ACS Sustainable Chem. Eng., 2021, 9, 6056–6067 CrossRef CAS.
- (a) A. J. Wang, Z. Q. Yu, Y. Wang, G. Q. Zhang, Z. C. Sun, Y. Y. Liu, C. Shi and W. Wang, J. Catal., 2022, 410, 294–306 CrossRef; (b) S. Yang, G. B. Chen, A. G. Ricciardulli, P. P. Zhang, Z. Zhang, H. H. Shi, J. Ma, J. Zhang, P. W. M. Blom and X. L. Feng, Angew. Chem., Int. Ed., 2020, 59, 465–470 CrossRef CAS PubMed; (c) G. X. Li, J. G. Wang, J. Y. Yu, H. Liu, Q. Cao, J. L. Du, L. L. Zhao, J. Jia, H. Liu and W. J. Zhou, Appl. Catal., B, 2020, 261 Search PubMed; (d) Z. Q. Yu, K. B. Yao, Y. Wang, Y. L. Yao, Z. C. Sun, Y. Y. Liu, C. A. Shi, W. Wang and A. J. Wang, Catal. Today, 2021, 371, 179–188 CrossRef CAS.
- Z. Q. Yu, Y. Wang, Z. C. Sun, X. Li, A. J. Wang, D. M. Camaioni and J. A. Lercher, Green Chem., 2018, 20, 609–619 RSC.
- G. Huang, Z. C. Sun, Z. Q. Yu, Y. Y. Liu, Y. Wang, W. Wang, A. J. Wang and Y. K. Hu, J. Catal., 2023, 419, 37–48 CrossRef CAS.
- Z. Yu, Y. Yao, Y. Wang, Y. Li, Z. Sun, Y.-Y. Liu, C. Shi, J. Liu, W. Wang and A. Wang, J. Catal., 2021, 403, 194–202 CrossRef CAS.
- J. F. Li, Y. M. Chai, B. Liu, Y. L. Wu, X. H. Li, Z. Tang, Y. Q. Liu and C. G. Liu, Appl. Catal., A, 2014, 469, 434–441 CrossRef CAS.
- J. A. Cecilia, A. Infantes-Molina, E. Rodriguez-Castellon, A. Jimenez-Lopez and S. T. Oyama, Appl. Catal., B, 2013, 136, 140–149 CrossRef.
- J. Ding, Y. Liu, J. Zhang, M. Dong, Y. Wang, W. He, Z. Lang, K. Liu and J. Chen, Catal. Commun., 2017, 89, 106–110 CrossRef CAS.
- Y. Zhu, X. Kong, X. Li, G. Ding, Y. Zhu and Y.-W. Li, ACS Catal., 2014, 4, 3612–3620 CrossRef CAS.
Footnote |
| † Electronic supplementary information (ESI) available. See DOI: https://doi.org/10.1039/d3nj05483g |
| This journal is © The Royal Society of Chemistry and the Centre National de la Recherche Scientifique 2024 |


