
The evolution of immune profiling: will there be a role for nanoparticles?
Olga E.
Eremina
 ab,
Celine
Vazquez
ab,
Kimberly N.
Larson
ab,
Anthony
Mouchawar
ab,
Augusta
Fernando
*ab and
Cristina
Zavaleta
*ab
ab,
Celine
Vazquez
ab,
Kimberly N.
Larson
ab,
Anthony
Mouchawar
ab,
Augusta
Fernando
*ab and
Cristina
Zavaleta
*ab
aDepartment of Biomedical Engineering, University of Southern California, Los Angeles, California 90089, USA. E-mail: fernaug01@gmail.com; czavalet@usc.edu
bMichelson Center for Convergent Bioscience, University of Southern California, Los Angeles, California 90089, USA
First published on 10th September 2024
Abstract
Immune profiling provides insights into the functioning of the immune system, including the distribution, abundance, and activity of immune cells. This understanding is essential for deciphering how the immune system responds to pathogens, vaccines, tumors, and other stimuli. Analyzing diverse immune cell types facilitates the development of personalized medicine approaches by characterizing individual variations in immune responses. With detailed immune profiles, clinicians can tailor treatment strategies to the specific immune status and needs of each patient, maximizing therapeutic efficacy while minimizing adverse effects. In this review, we discuss the evolution of immune profiling, from interrogating bulk cell samples in solution to evaluating the spatially-rich molecular profiles across intact preserved tissue sections. We also review various multiplexed imaging platforms recently developed, based on immunofluorescence and imaging mass spectrometry, and their impact on the field of immune profiling. Identifying and localizing various immune cell types across a patient's sample has already provided important insights into understanding disease progression, the development of novel targeted therapies, and predicting treatment response. We also offer a new perspective by highlighting the unprecedented potential of nanoparticles (NPs) that can open new horizons in immune profiling. NPs are known to provide enhanced detection sensitivity, targeting specificity, biocompatibility, stability, multimodal imaging features, and multiplexing capabilities. Therefore, we summarize the recent developments and advantages of NPs, which can contribute to advancing our understanding of immune function to facilitate precision medicine. Overall, NPs have the potential to offer a versatile and robust approach to profile the immune system with improved efficiency and multiplexed imaging power.
 Olga E. Eremina | Olga E. Eremina is an Agilent postdoctoral fellow at the University of Southern California (USC), U.S. After earning an MS with honors in Chemistry, she completed her PhD in Analytical Chemistry at Moscow State University, where she focused on developing surface-enhanced Raman spectroscopy (SERS) and fluorescence-based sensors. In 2024, Olga was recognized as a CAS Future Leader by the American Chemical Society. Her current research centers on nanoparticle-based contrast agents aimed at achieving high targeting specificity and quantitative multiplexing capabilities for molecular imaging. She is particularly dedicated to advancing nanomedicine for precision medicine and improving patient outcomes. |
 Celine Vazquez | Celine Vazquez graduated with her Bachelors in Science from the University of Southern California. She worked as an undergraduate student researcher with the Zavaleta Laboratory throughout her entire collegiate career. Currently, Celine works as a Scientist II in Genentech's Developmental Sciences and Translational Medicine divisions. |
 Kimberly N. Larson | Kimberly Larson received her BS in Biomedical Engineering from the University of Southern California in 2021. She then served as a research and development engineer in the medical device industry. Currently, she is pursuing her medical degree at the University of Arizona College of Medicine Phoenix. |
 Anthony Mouchawar | Anthony Mouchawar received his BS in Biomedical Engineering from the University of Southern California in 2024. As an undergraduate, he performed research under Dr. Cristina Zavaleta, primarily focusing on gold nanoparticle imaging using multiphoton microscopy. He is currently working towards his MS in Molecular Microbiology and Immunology at USC while researching under Dr. Peter Wang. His current research involves CAR-T cell therapy, utilizing heat inducibility and cell signal manipulation to improve CAR-T cell infiltration into target tumors. |
 Augusta Fernando | Augusta Fernando received her basic degree in Microbiology and Applied Medical Sciences from the University of Mumbai and PhD degree in Biochemistry using molecular and immunological tools to study the transmission of tropical diseases. She further pursued a thesis in Cancer Biology towards her MPhil from the University of Portsmouth, England (2006). She has over 30 years experience in the field of biomedical research with primary focus on cancer therapeutics and diagnostics. Her current research interests include drug screening for 3D research models and exploring diagnostic tools in medicine. |
 Cristina Zavaleta | Dr Cristina Zavaleta received her Bachelor's degree in Nuclear Medicine at the University of Incarnate Word. Excited about the prospect to develop new nuclear-based contrast agents, she attended graduate school at the University of Texas Health Science Center in San Antonio. After completing her PhD, she began a postdoctoral fellowship at Stanford University, where she helped pioneer a new molecular imaging strategy that utilizes Raman nanoparticles for cancer detection. She is currently an Associate Professor in BME at the University of Southern California and focuses on providing physicians with new nano-based molecular imaging tools to improve cancer detection and treatment. |
1. Introduction
Immune profiling investigates the nature of complex immune dynamics revealed by the molecular signatures of immune cells in a patient's specimen. Immune cells undergo metabolic reprogramming in response to specific disease conditions to elicit an effective immune response.1 Personalized biomolecular expression profiles of immune cellular architecture are unique and influenced by multiple host factors, microbiota-derived products, infectious agents, and neoantigens.2 In recent years, researchers have embarked on more thorough and innovative investigations into the immune system, driven by its fundamental and extensive links to human health.Immune cells play a crucial role in disease prevention and progression due to their diverse functions and interactions within the immune system. They enable the body to defend against pathogens, regulate inflammation, perform cancer immunosurveillance, facilitate wound healing and tissue repair, and regulate allergic reactions.3 Immune profiling allows for the customization of treatments based on an individual's immune response. Understanding an individual patient's immune profile can allow healthcare providers to tailor treatments for maximum effectiveness and minimal side effects.4 In early disease diagnosis, changes in immune function can often precede the onset of clinical symptoms across various diseases. Immune profiling techniques can help detect these changes early, enabling timely intervention and potentially preventing the progression of diseases.5 Furthermore, immune profiling can help identify specific immune markers or signatures associated with diseases. This knowledge can guide the development of targeted immunotherapies designed to modulate the immune system's response against diseases such as cancer and autoimmune disorders.6,7 Additionally, identifying and quantifying immune cell populations can allow healthcare providers to monitor how a patient's immune system responds to a given treatment. This real-time information aids in assessing treatment efficacy and making necessary adjustments to optimize patient outcomes.8 Finally, by retrospectively analyzing immune profiles across various patient cohorts, researchers can identify trends and predict how individuals might respond to certain treatments. This combined with real-time information, aids in selecting the most appropriate treatment strategies, increasing the likelihood of successful outcomes.9
The diverse array of immune cells present in the body, each with specific functions and interactions, contributes to overall immune function and homeostasis. On one hand, the complexity and diversity of immune cells allow for effective immune responses. On the other hand, it is crucial to assess various immune cell types in detail for better prognosis, diagnosis, and selection of treatment options. This diversity of immune cell types requires multiplexed detection and imaging approaches to allow researchers and clinicians to simultaneously analyze multiple parameters within the same sample. Multiplexed biomarker profiling can reveal complex immune responses that involve numerous cell types, signaling molecules, and interactions. This, in turn, provides a more comprehensive understanding of immune cell populations, their activation states, and their interactions within the tissue microenvironment. Additionally, analyzing immune responses often requires the use of valuable and limited biological samples. Multiplexing approaches allow researchers to extract maximal information from minimal sample volumes by analyzing multiple targets simultaneously. This efficiency is particularly important when working with clinical samples or rare cell populations. Finally, multiplexed imaging permits researchers and clinicians to study spatial relationships among various immune cell types in the context of intact diseased tissue. Several novel approaches have been developed that allow multiplexed spatial profiling, such as multiplex immunofluorescence (mIF), immunohistochemistry (mIHC), in situ hybridization (ISH), mass spectrometry (MS)-based imaging, spatial transcriptomics.10 Each of these approaches utilizes various types of probes for immune profiling (e.g., fluorescent dyes, DNA barcodes, chromogens, metal tags, etc.).
In this article, we review the evolving field of immune profiling and offer a new perspective on leveraging the many advantages of nanoparticles (NPs) for identifying and localizing relevant immune biomarkers in patient samples. NP-based probes offer significant potential in immune profiling due to their high surface-to-volume ratio, versatile surface chemistry for active biomarker targeting, signal amplification capabilities, biocompatibility, and stability, along with their multiplexed imaging potential.
This review is organized as follows. In Section 2, we introduce the emerging field of immune profiling and its significance across various fields of medicine and biology. In Section 3, we introduce the technologies currently used for immune profiling. Section 4 discusses the potential of NP-based probes for enhancing immune profiling through improved multiplexing efficiency and tissue sample preservation. Specific examples, potential benefits, limitations, and optimizations of NP-based probes are also covered in Section 4. Conclusions and future directions for the field are provided in Section 5.
2. Immune profiling
The immune system is critical for detecting and eliminating transformed, e.g., damaged or aberrant, cells. Recently, scientists have embarked on a novel and captivating exploration of the immune system, driven by its crucial and widespread connections to human health. Beyond the significant advancements achieved in cancer immunotherapy over the past decade,11–15 researchers are now accumulating compelling data on the immune system's pivotal role in therapeutic approaches. This involvement spans diverse fields, including gastroenterology,16 neurology,17 vaccinology,18 cardiovascular disease,19 as well as obesity and metabolic disorders.20The term ‘immune profiling’ encompasses the comprehensive evaluation of the dynamic immune milieu characterizing a patient's immune health. Immune profiling involves delineating the expression patterns of immune-cell-associated genes and proteins, alongside the precise identification and characterization of constituent cell populations. Examining the immune system presents a relatively new and promising avenue for the development of new drugs and treatment approaches. A comprehensive understanding of the immune system could enable us to harness its capabilities to address a wide range of diseases. Specifically, over the past decade, cancer immunotherapy has emerged as an effective anti-tumor therapeutic approach among traditional modalities like chemotherapy, radiotherapy, and surgery.21 In the field of cancer, immune profiling becomes an essential tool in identifying the heterogeneous composition of immune cells, signaling molecules and extracellular matrix (ECM) components in the highly complex and dynamic tumor microenvironment (TME). The variability of immune responses to cancer and the spatial arrangement of cell subsets within tumors can serve as valuable indicators for characterizing cancer and directing treatment strategies. The characterization of the immune landscape in the TME can help predict therapeutic efficacy and response to novel immunotherapies, including immunogenic cell death (ICD),22 and promote the development of emerging targeted therapies for precision oncology.23
2.1. Immune profiling and aging
As people grow older, virtually every aspect of the immune system undergoes changes collectively referred to as ‘immunosenescence’. For instance, aging leads to a decrease in the number of naïve CD8+ T cells and a moderate reduction in the T-cell receptor (TCR) repertoire, along with impaired function of dendritic cells.24,25 Consequently, as individuals age, they become more vulnerable to a wide array of infectious pathogens. Aging also serves as a common risk factor for various complex diseases in which the immune system may play a significant role. However, unraveling its specific role in disease pathogenesis is often challenging due to its pervasive effects.To address this issue, Alpert et al. employed immune profiling techniques within an aging human cohort to gain a comprehensive understanding of the alterations occurring in the aging immune system.26 The authors quantified significant changes in immune population frequencies in human peripheral blood and introduced valuable tools for assigning an immunological age to individuals based on peripheral blood expression profiling. Remarkably, using peripheral blood samples collected from 135 individuals between 2007 and 2015 as they aged, the authors observed the impact of aging on 33 cellular subsets, including CD8+ T cells, monocytes, natural killer (NK) cells, B cells, and CD4+ T-cell subsets. This approach facilitated the investigation of the relationship between inflammation and complex diseases, particularly atherosclerosis and subsequent cardiovascular issues, in the aging cohort.
Utilizing immune profiling in clinical studies can enable researchers to comprehend the immune alterations in healthy individuals, the shifts induced by environmental exposures, and the interplay between the human immune system and diseases. Immune profiling technologies, such as flow cytometry, single-cell RNA sequencing, and newer high-dimensional imaging technologies, can offer a more comprehensive understanding of the aging immune system, including changes in immune subsets, function, modulation, and their impact on both healthy and diseased elderly individuals.
2.2. Tumor-immune microenvironment (TiME)
The TME encompasses the ecosystem surrounding a tumor within the body, incorporating immune cells, the ECM, blood vessels, and other cells like fibroblasts. This complex and dynamic TME, composed of a diverse array of cellular and non-cellular elements, represents the outcome of the intrinsic host response to the presence of the tumor. This includes cytokines, chemokines, and inflammation, reacting to perturbations in cancer behavior, tumor surface antigens, and mechanisms of cell defense and growth. The dynamic interaction between a tumor and its microenvironment continuously influences each other, either positively or negatively. Furthermore, the TME hosts various immune cells, creating a dynamic entity of the tumor–immune microenvironment (TiME).Lately, the advancement of targeted therapies for precision oncology, particularly in the field of immunotherapy, necessitates the discovery of biomarkers within tumors and cells of the TME. These biomarkers should be capable of predicting the effectiveness of therapy, and the identification of signaling pathways is crucial for comprehending the biological behavior of the tumor (Fig. 1). Therefore, understanding the TiME is key to optimizing immunotherapy and advancing new treatment strategies.
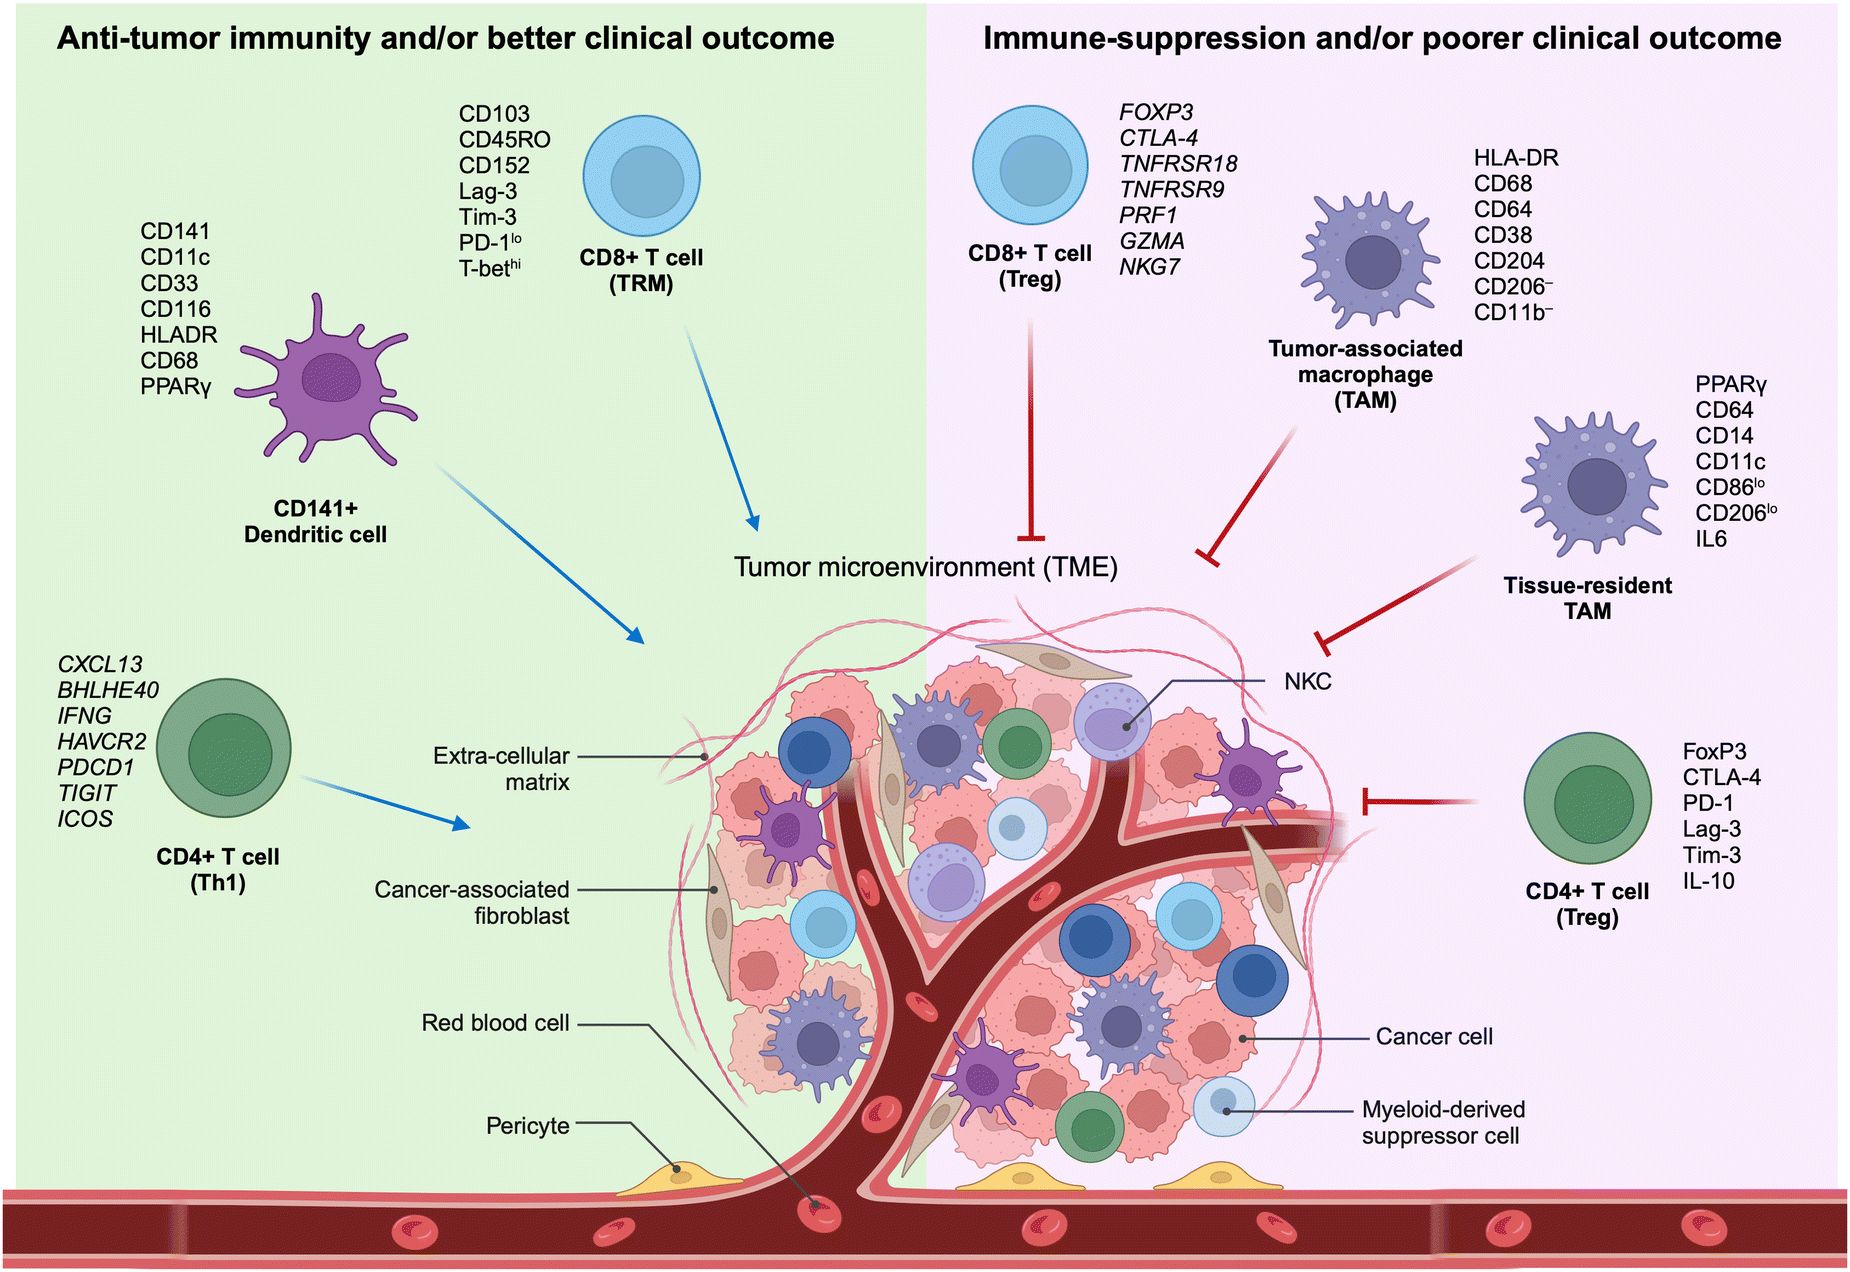 | ||
| Fig. 1 Characteristics of selective immune subsets important for antitumor immune activity as revealed by multidimensional immune profiling. (left) Immune cell types correlated with antitumor immunity and better clinical outcomes in patients with cancer.11–15,27 (right) Immune cell types correlated with immunosuppressive characteristics in the TME and poorer clinical outcomes in patients with cancer. TAM, tumor-associated macrophage; Th1, T-helper type 1 cells; TME, tumor microenvironment; Treg, regulatory T cells; TRM, tissue-resident memory cells (adapted from ref. 11. Copyright 2020, BMJ Publishing Group Ltd & Society for Immunotherapy of Cancer). | ||
Immune profiling has significantly contributed to the clinical management of many malignancies, particularly with the promising rise and success of cancer immunotherapies.28 Interaction between immune checkpoints and their ligands negatively affect T-cell function and the pathways involved in the physiological immune response to tumor-associated antigens (TAAs). Immune checkpoints and their ligands are commonly upregulated in the TME of many human malignancies, representing substantial barriers to the initiation of effective anti-tumor immune responses.29 Recognition and activation assays assess immune cell activation and enhancement in response to antigenic and allogeneic stimulation.30
Among the checkpoint-blocking approaches, the two most eminent are blocking cytotoxic-T-lymphocyte-associated protein 4 (CTLA-4, or CD152) and targeting the interaction between programmed cell death 1 (PD-1, or CD279) and programmed cell death ligand 1 (PD-L1, or CD274, or B7 homolog 1).31 Single-cell transcriptome, T-cell receptor, and proteome profiling of patients treated with PD-1 therapy, either before or after surgery and alongside neoadjuvant chemotherapy, revealed various immunophenotypes, shedding light on the heterogeneity in treatment response. Thus, periodic immune profiling aids in the stratification of patients within the treatment group and moves them towards more effective therapies.32 For instance, researchers effectively used CODEX technology to identify cellular neighborhoods and associate them with either effective or ineffective antitumor immunity in different patients’ TMEs, emphasizing the importance of immune profiling for disease prognosis.33
For a considerable time, tumor staging based on TNM guidelines has served as a reliable method for cancer classification. The TNM classification system was created to assist doctors in staging different types of cancer using standardized criteria. This system encompasses the tumor extent (T), the spread to lymph nodes (N), and the presence of metastasis (M). Despite providing insights into tumor burden, lymph node involvement,34 and metastasis, it has been acknowledged that clinical outcomes can vary among patients with the same disease stage. More recent research has started to emphasize the crucial role of the immune contexture of the primary tumor in predicting prognosis. Contrary to the view that disease progression depends solely on tumor cells, incorporating the immune response into disease classification is now considered essential.35
An illustrative measure of this concept is the ImmunoScore, a score ranging from 0 to 4, derived from the density of lymphocyte populations, such as CD3/CD45RO, CD3/CD8, or CD8/CD45RO, in the tumor core and margins.35 Validated globally in a multi-institutional study with a primary endpoint of time-to-recurrence, the ImmunoScore demonstrated a significantly longer time-to-recurrence for patients with a high ImmunoScore, irrespective of stage, sex, age, or tumor-sidedness.36 Specifically, quantifying CD3+ and CD8+ T-cell densities as part of the ImmunoScore in two discrete regions of colorectal carcinoma (CRC) tumors has been shown to outperform current tumor risk factors, such as differentiation, venous emboli, and lymphatic invasion, in predicting patient outcomes.37 Furthermore, the spatial relationship between T lymphocytes and tumor buds (TBs) was shown to hold prognostic significance in CRC, where patients with high numbers of lymphocytes surrounding TBs demonstrate better stage II CRC prognosis.38,39 Although the ImmunoScore has successfully predicted prognosis in various cancers, including colorectal, melanoma, breast, kidney, and lung, prospective studies are needed for it to be officially recognized as a predictive marker.35,40
2.3. Immune profiling in liquid biopsy
The immunology information extracted from liquid biopsy can be used for continuous monitoring, from early-stage disease screening, assisting diagnosis, personalized therapy selection, to recurrence monitoring. Liquid biopsy techniques offer a number of advantages over commonly used tissue biopsy, as they are less invasive and easier to repeat. In addition, the results from liquid biopsies are unaffected by the inconsistency issues present when studying resected tissue for diagnostic purposes over time.6,41 For instance, the TME exhibits a high degree of heterogeneity,42 particularly between the original tumor and metastases, which greatly complicates the assessment of the body's immune response to a tumor.41 Liquid biopsy serves as a non-invasive and holistic diagnostic tool to assess circulating tumor cell (CTC) populations and T cells, and bloodborne markers such as exosomes, circulating tumor DNA, and proteins. However, liquid biopsy lacks the ability to spatially present the cancer's immune profile within the tumor itself.The use of liquid biopsy has been successful in correlating Vδ2+ γδ T cell changes with lymph node invasion in breast cancer patients.41 γδ T cells have cytotoxic capabilities similar to their αβ CD8+ T cell counterparts. However, unlike αβ T cells, γδ T cells exhibit MHC-unrestricted antigen presentation and TCR activation, as well as NK cell-associated cytotoxic receptors, giving them a function more akin to NK cells. The Vδ2+ subtype is typically present in the peripheral blood but has been frequently observed in contact with breast tumor tissue. Using mass cytometry, 130 immune variables were quantified in newly diagnosed untreated breast cancer patients. BGA (between-group analysis) showed easily distinguishable variables between the healthy control samples and breast cancer samples, with healthy patients expressing high numbers of naïve Vδ2 + γδ, αβCD8 +, and αβCD4+ T cells. Breast cancer patients expressed differentiated T cells in high quantities, particularly CD45RA Vδ2 + γδ T cells, as well as high numbers of Vδ2 + γδ T, αβCD8+ T, and NK cells with inhibitory receptors. Differences in Vδ2 + γδ T cell expression provided the greatest contribution to variable disparity between breast cancer and healthy patients.41
Several immune cell markers can be considered as “immune checkpoints,” and patients with cancer may exhibit alterations in the expression of these molecules, i.e., PD-1, CTLA-4, LAG-3, TIM-3, etc.43 Using quantitative real-time polymerase chain reaction (qRT-PCR) on DNA and RNA extracted from patient blood samples, it was demonstrated that peripheral blood mononuclear cells (PBMCs) from CRC and primary breast cancer (PBC) patients show significant upregulation of the PD-1, CTLA-4, TIM-3, TIGIT and PD-L1 genes, while LAG-3 expression is downregulated.43 These markers also correlate with each cancer's TNM stage and histological grade, implying that such a blood test could offer insights into both detection and disease progression.43
The use of liquid biopsy for response prediction was demonstrated using cytometry by time-of-flight (CyTOF) to assess the immune profile of human epidermal growth factor receptor-2 (HER2)+ breast cancer patients.44 PBMCs were collected from patients before and after starting T-based neoadjuvant chemotherapy (NAC).44 The group that achieved a pathologic complete response (pCR) displayed higher counts of B cells, particularly naïve phenotypes, and effector memory CD8+ T cells at diagnosis, compared to patients who did not achieve pCR.44
Further use of immune profiling for evaluating treatment response assessment has been demonstrated using fluorescence-activated cell sorting (FACS).45 Upon treatment with IL-2 and IFN-α, patients with metastatic renal cell cancer showed a drastic increase in regulatory T cells (Tregs) count over the span of two weeks.45 After this period, patients were treated with bevacizumab, and upon further examination, patients who achieved a partial response or halted disease progression experienced no additional increase in Treg count, while non-responsive patients continued to increase counts at a constant rate.45 Liquid biopsy analysis using flow cytometry has been successfully applied for immune profiling of the peripheral blood of CRC patients.46 Choi et al. examined white blood cell (WBC) population differences between healthy individuals and patients with CRC, finding that CRC patients had higher neutrophil-to-lymphocyte ratios (NLR) than healthy individuals. Certain immune suppressive Treg and antitumor cytotoxic T cell phenotypes, namely CD4+CD25+, CD4+CD279+, CD4+CD152+, CD152+CD3+CD8+, and CD279+CD3+CD8+, were found in higher quantities in CRC patients compared to healthy individuals.46 Myeloid-derived suppressor cells, which function similarly to Treg cells, also accumulate significantly in CRC patients.46 The quantities of each cell type changed as cancer progressed, with the NLR and Th2 cell count increasing in later stages of CRC.46
3. Immune profiling technologies
Clinical trials focusing on oncology, aging, cardiovascular disease, autoimmune disorders, and infectious diseases could greatly benefit from immune profiling to improve health outcomes and advancing medical innovation. Immune profiling holds the potential to unveil profound insights into disease mechanisms paving the way for the development of targeted immunomodulatory therapies for complex diseases. In this section, we will discuss the various technologies used to profile the immune system and the rapid evolution that is currently underway to offer unprecedented insights into intact tissues. Assessing the expression of specific genes from peripheral blood, or targeting select biomarkers using flow cytometry, represents a more traditional detection-based approach to immune profiling. However, in the past decade, several new platform technologies have been further developed and commercialized to offer far more comprehensive options. Examining the spatial context of intact cellular architectures yields valuable insights into the functions within intricate biological systems. This is particularly crucial when studying the TME, which includes various neighborhoods across the tumor, each containing a diverse array of cell types: neoplastic cells, fibroblasts, vascular endothelial cells, and various subsets of immune cells.473.1. Detection-based immune profiling
Several detection-based techniques have been used by researchers to gain a better understanding of the cellular phenotypes of immune cells. Many of these techniques have driven extensive discovery, leading to increased precision in disease diagnosis and prognosis. Although these techniques do not offer spatial context for the data, they provide, they are still considered important tools for discovery in clinical medicine.48DNA microarrays, a specific type of detection-based technique, involve extracting mRNA from tissues and cells. This mRNA is then reverse-transcribed and labeled with a fluorescent dye before being hybridized onto the array, as illustrated in Fig. 2. The principle behind DNA microarrays is that the amount of fluorescence measured at a sequence-specific location directly correlates with the amount of mRNA with the complementary sequence in the analyzed sample.48 While microarrays do not provide the exact level of expression for a particular gene, the technique is still useful in comparing expression levels across different conditions and controls. Microarrays can be classified into three main types based on (i) probe lengths; (ii) manufacturing method; and (iii) number of samples that can be simultaneously analyzed.
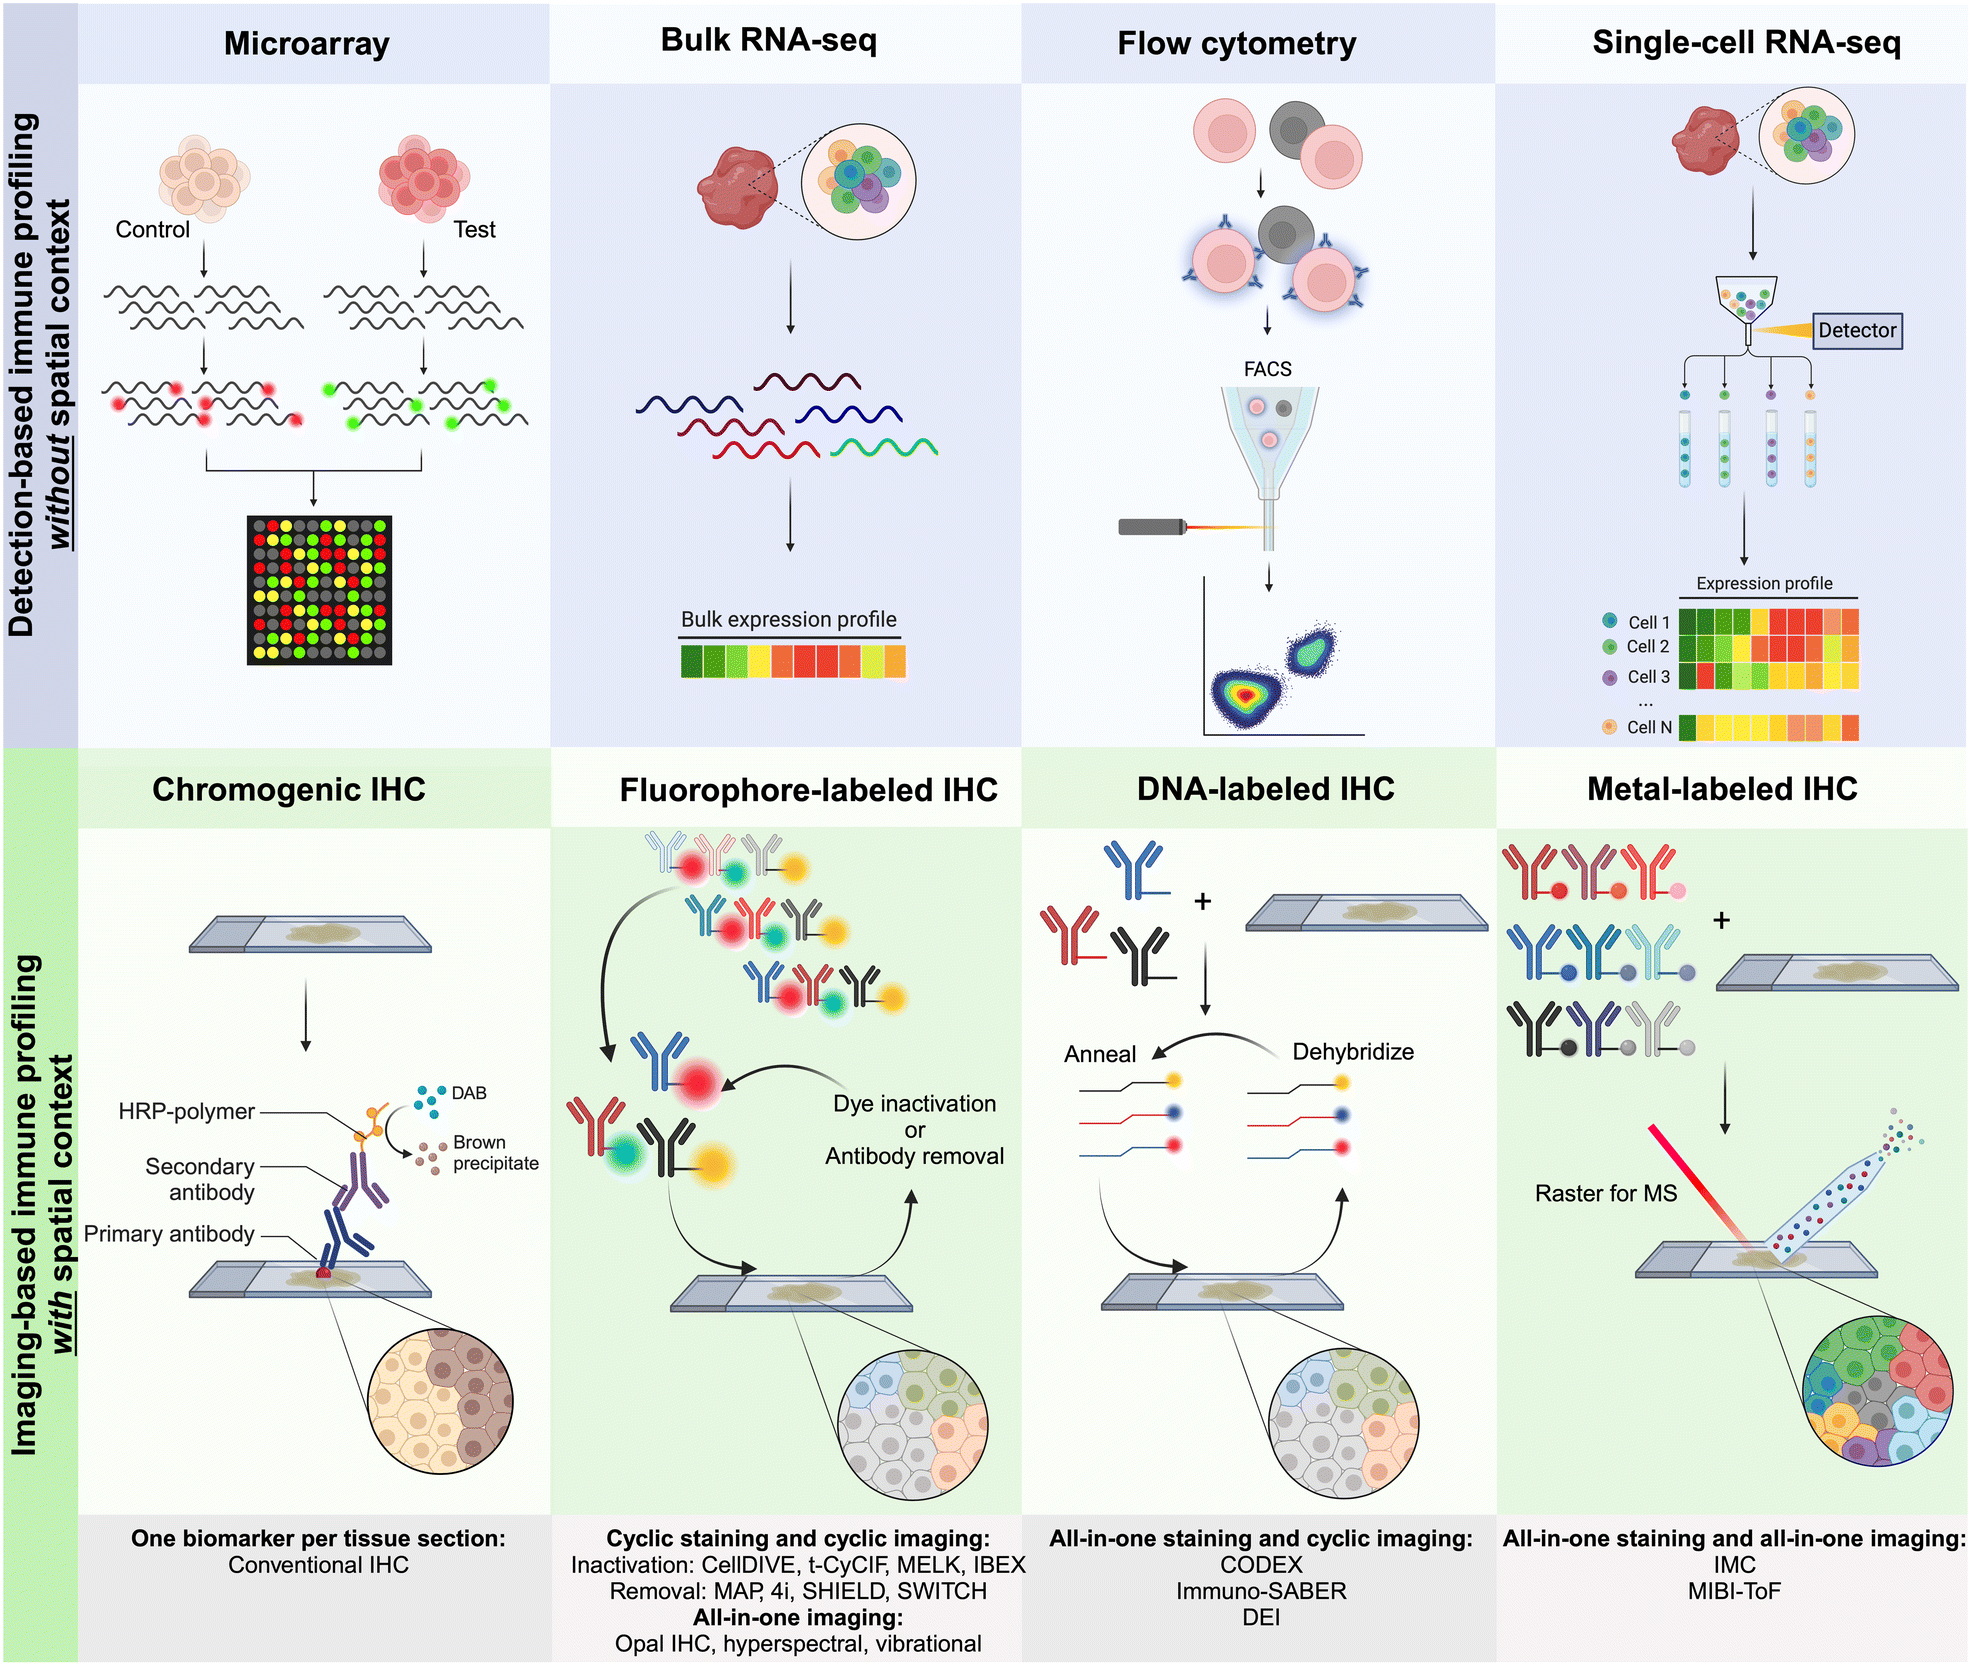 | ||
| Fig. 2 Graphical representation of the main approaches for multiplexed detection-based (without spatial context) and imaging-based (with spatial context) techniques used for immune profiling. For imaging-based techniques, antibodies are commonly labeled with metals, fluorophores, or DNA oligonucleotides for complementary binding of fluorescently tagged DNA probes.10 | ||
Bulk RNA sequencing is often used alongside single-cell RNA sequencing for onco-immunology applications. Bulk RNA sequencing can be performed on human tumor samples obtained from biopsies or surgeries.48 The steps involved in both single-cell and bulk RNA sequencing include reverse transcription, sequencing, mapping, data format transformation, and count table generation. Although combining single-cell and bulk RNA sequencing can be more expensive, this approach enhances the appreciation of tissue heterogeneity at the cellular level, enabling a more detailed analysis of specific cell populations (e.g., T cells, B cells, etc.).
Flow cytometry (FC) is another detection-based technique that offers unique information about immune phenotypes and cells. Both FC and fluorescence-activated cell sorting (FACS) offer high sensitivity for analyzing cell subtypes with standardized antibody panels.49 These techniques provide quantifiable data on the proportion of specific cell types present within a whole sample in solution and screen for biomarkers in cell population subsets. Both techniques are commonly used to study various conditions, including cancer and autoimmune disease. New molecular profiling technologies, such as RT-PCR, gene chips, protein chips, two-dimensional gel electrophoresis (2DE), and mass spectrometry (MS, including LC-MS), allow for the analysis of molecular signatures from an individual's homogenized tumor and to correlate a panel of biomarkers with clinical outcomes to better tailor personalized therapies.
However, most tumors are highly heterogeneous, containing a mixture of benign, cancerous, and stromal cells. This heterogeneity makes it challenging to use the detection-based methods for precise molecular profiling. Furthermore, homogenizing tissue specimens into a single homogeneous solution for these approaches results in the loss of valuable spatial information from the original tissue and complicates tracking trends or predicting therapeutic efficacy.
3.2. Imaging-based immune profiling
In the field of oncology, spatial information about the various immune cells present across the TME can provide valuable insights into the severity of a cancer patient's prognosis and inform clinicians about the patient's likelihood of responding to a given therapy. Spatial profiling of the TME can be summarized by four main characteristics: (i) spatial distribution and proportions of immune cells, (ii) distances between immune cells and other functionally related cellular neighbors, (iii) cell–cell interactions, and (iv) the activated or suppressed state of immune cells.50 While previously discussed detection-based RNA, DNA, and proteomic platforms are limited in the spatial information they can provide, recent multiplexing technologies have provided deep insight into the spatial biology domain of the TME. These advanced techniques, as summarized in Table 1, can reveal not only the what types of immune cells present in the TME but also their specific locations at a given time. Multiplexed spatial profiling enables correlating molecular and morphological information that is not available from traditional immunohistochemistry (IHC) and H&E stains. Such information has been studied and correlated with rates of patient survival, prognosis, and predicted responsiveness to treatment, all important details that have shown potential to further support precision medicine and the field of oncology as a whole.33,47,51–62| Company | Technology | Contrast probes/instrumentation | Summary | Plexity/application | Ref. |
|---|---|---|---|---|---|
| ICI – immune checkpoint inhibitor; IF – immunofluorescence; ToF – time-of-flight; FFPE – formalin-fixed paraffin-embedded; CTC – circulating tumor cell; CAR – chimeric antigen receptor; FISH – fluorescence in situ hybridization. | |||||
| Akoya Biosciences | Multi-cycle IF | DNA-encoded antibodies/phenocycler-fusion | Using oligonucleotide-conjugated antibodies and opal fluorescent reporters, PhenoCycler-Fusion can detect and image 100+ RNA and protein biomarkers with 5-plex base panels per a staining or/and imaging cycle | 56-Plex/immune cell topography for predicting response to PD-1 blockade in cutaneous T cell lymphoma | 33 |
| 101-Plex/spatial proteome of head and neck cancer | 51 | ||||
| Opal-conjugated antibodies/PhenoImager | 5-Plex/predicting ICI efficacy in solid tumors | 52 | |||
| NanoString | Fluorescence in situ hybridization (FISH) | Oligonucleotide probes to generate gene-specific fluorophore barcodes/GeoMx Digital Spatial Profiler (DSP) and CosMx Spatial Molecular Imager (SMI) | Allows visualization of both mRNA and protein markers. The device has been used to identify predictive biomarkers for immunotherapy but does not provide single-cell resolution | 44-Plex/validation for 44 proteins and 96 genes in lymphoid, colorectal tumor, and autoimmune tissue | 53 |
| 10X Genomics | Single-cell gene expression flex (RNA templated ligation (RTL) technology) applied to FFPE tissues (scFFPE-seq) | Fluorophore-labeled DNA probes to generate gene-specific fluorophore barcodes/Visium and Xenium In Situ | A spatially resolved transcriptomics (SRT) platform with fluidical frame, which allows for up to 1000-plex, only one sample can be assessed at a time | 313-Plex human breast panel | 54 |
| Canopy Biosciences (Bruker company) | Multi-cycle IF | Common fluorophores/CellScape and ChipCytometry | Utilizes microfluidics and repetitive staining and imaging cycles to combine RNA and protein multiplexed detection on FFPE tissue. The system allows for re-interrogation of tissue samples for additional markers at later points in time (up to 2 years) and works at single-cell resolution | 30-Plex/antibody panel validated for FFPE tissue staining | 55 |
| Lunaphore Technologies | Multi-cycle IF | Common fluorophores/COMET | Operates as a fully automated staining, imaging, and pre-processing platform. Utilizes microfluidics and can detect up to 40 protein biomarkers from one sample, in less than 1 day | 40-Plex/staining panel for immune-oncology applications | 56 |
| Standard BioTools | Imaging mass cytometry (IMC) | Metal-labeled antibodies/Hyperion coupled with Helios | The Hyperion imaging system is a laser system that ablates tissue section samples, providing material for the Helios system on a point-by-point basis. This allows for mass cytometry results to be resolved spatially. The imaging speed is 200 pixels per second | 45-Plex/phenotypes of cancer-associated fibroblasts (CAFs) for patient outcome in tumor microarrays (TMAs) of non-small cell lung cancer (NSCLC) | 57 |
| IONpath | Multiplexed ion beam imaging (MIBI) with secondary-ion mass spectrometry (SIMS) | Metal-labeled antibodies/MIBIscope | Uses ToF mass spectrometer and a cocktail of antibodies, each labeled with a unique metal isotope for a single-cycle staining for more than 40 biomarkers. The spatial resolution is 1 μm | 15-Plex/spatial distribution of immune and tumor cells | 47 |
| Miltenyi Biotec | MICS (MACSima imaging cyclic staining) | Fluorochrome-conjugated antibodies/MACSima Platform | Is based on cycles of staining, imaging, and erasure, using photobleaching of fluorescent labels of recombinant antibodies (REAfinity antibodies), or release of antibodies (REAlease antibodies) or their labels (REAdye_lease antibodies) | 47-Plex/investigation of potential targets for CAR T cell therapy | 58 |
| RareCyte | Sequencing physically interacting cells (PIC-seq) | Immunofluorescent antibodies/CyteFinder II | Utilizes automated multiparameter fluorescence staining, automated microscopic imaging analysis, and integrated single-cell retrieval | 30-Plex/profiling of cutaneous melanoma | 59 |
| Single-cycle IF | ArgoFluor-conjugated antibodies/Orion | Orion operates with ArgoFluor-dyes, which are bright and spectrally separated fluorophores. The Orion reagent portfolio of conjugated antibodies and conjugation kits cover imaging of more than 60 unique biomarkers (human and mouse) | 15-Plex/imaging of reactive lymphoid hyperplasia (RLH) | 60 | |
| Leica Microsystems | Multi-cycle IF | Common fluorophores/Cell DIVE | Offers automated biomarker quantification, direct antibody dye labeling, and single-cell analysis | 61-Plex/tumor heterogeneity of colorectal cancer | 61 |
| Rebus Bioscience | Single molecule FISH (smFISH) | Atto-dyes conjugated to oligonucleotides/Rebus Esper | The system integrates synthetic aperture optics (SAO), fluidics, and image processing. SAO allows for higher resolution without affecting throughput and ease of use. SAO improves a 20× NA 0.45 air lens to a conventional high NA oil immersion lens, enabling >10-fold improvement in FOV, depth of field, and working distance | 17-Plex with up to 3 genes per cycle/mapping the brain's blood vessels | 62 |
Currently, CODEX is one of the key technologies in the multiplexing industry developed by a group led by G.P. Nolan at Stanford University and acquired by Akoya Biosciences.66 The CODEX methodology involves tissue imaging with cocktails of DNA-barcoded antibodies, allowing for multiplexing capabilities of up to 100+ biomarkers in situ. The CODEX procedure involves four main steps: (i) antibody conjugation, (ii) validation and titration, (iii) cyclic tagging, and (iv) data analysis (Fig. 2). During the antibody conjugation step, antibodies are partially reduced and subsequently conjugated with a DNA oligonucleotide. This conjugate is then washed and recovered to be used in the second step for the antibody validation and titration. Here, tissue is prepared for antigen retrieval, stained with the antibody–oligonucleotide conjugate, and hybridized with a corresponding fluorescent oligonucleotide. The addition of these fluorophores allows for visualization of the sample's region of interest (ROI) with a fluorescence microscopy imaging system. The multiplexing capabilities of CODEX arise from a multi-cycle reaction, which involves chemical stripping the fluorescently tagged oligonucleotide from the tissue and iteratively repeating the process for all antibodies of interest in the designed antibody panel. Once this process is complete, data are analyzed with image processing, single-cell segmentation, cell-type annotation, and various spatial analysis techniques.66
Akoya's technology has heavily contributed to the understanding and development of cellular spatial relationships and single-cell biology, especially in relation to the field of immunology. The CODEX workflow was applied in a colon cancer study in which the cell-to-cell interaction and spatial organization of the TME were characterized. Phillips et al. profiled 56 protein markers across 140 ROIs from 35 different patients with CRC.33 The study utilized CODEX technology to evaluate patient prognosis, finding that the enriched population of PD-1+ CD4+ T cells within a granulocyte cellular neighborhood (CN) correlated with increased patient survival. Using this multiplexed spatial profiling approach, decreased survival rates were correlated with CNs in which tumor and immune cells were coupled, and T cells and macrophages were fragmented.33 Aside from assisting in patient prognosis, CODEX technology has been utilized to predict patient response to specific immunotherapies. CODEX's spatial profiling capabilities enabled the creation of topographic cellular maps that could predict patient response to PD-1 blockade in cutaneous T cell lymphoma (CTCL).67 Seventy tumor ROIs from 14 CTCL patients, some who responded to immunotherapy and others who did not, were sequenced utilizing Akoya's technology. No differences were found in the frequencies of immune or tumor cells between responders and non-responders, but topographical differences between PD-1+, CD4+ T cells, tumor cells, and immunosuppressive Treg cells were found. Such topographical differences were quantified using a SpatialScore, i.e., a calculation of the physical distance between a CD4+ T cell and a tumor cell or a Treg cell. A lower SpatialScore (indicating closer proximity of CD4+ T cells to tumor cells) suggested an increased patient response to immunotherapy, and a higher SpatialScore (indicating closer proximity of CD4+ T cells to Treg cells) suggested a decreased patient response to immunotherapy. This cellular topographical information can help guide clinicians on how a patient would potentially respond to specific immunotherapies.67 Most recently, Jhaveri et al. demonstrated 101-plex spatial proteomic profiling of FFPE tissue sections of head and neck squamous cell carcinoma (HNSCC) patients.51 All antibodies were assembled into an ultra-high plex panel of 101 markers. Three markers were imaged per cycle with a total of 38 cycles of reporter hybridization, imaging, and de-hybridization to reveal the spatial localization of all 101 proteins across the entire tissue section. These highly multiplexed images allowed uncovering a high degree of intra-tumoral heterogeneity intrinsic to HNSCC and provided unique insights into the biology of the disease. In particular, a CN analysis revealed the presence of 6 unique spatial neighborhoods enriched in functionally specialized immune subsets. In addition, functional phenotyping identified 4 distinct tumor regions with differential protein signatures. One of these regions was marked by infiltration of CD8+ cytotoxic T cells and overexpression of BAK gene, a proapoptotic regulator, suggesting strong immune activation and stress.
Other multi-cycle fluorescence imaging techniques have been developed in order to provide multiplexed immune profiling of patient tissue. Leica Microsystems, for example, integrated an MxIF method into their latest Cell DIVE instrument (Fig. 2).61 The MxIF workflow has the ability to quantitatively visualize 60+ antibodies with single-cell resolution through an iterative multi-cycle process that chemically inactivates fluorescent dyes instead of eluting attached antibodies, as seen with Akoya's CODEX technology. The main steps of the MxIF workflow involve antigen retrieval and repeated cycles of staining, imaging, and dye inactivation for 60+ biomarkers in a single FFPE tissue section.68 Prior to antibody staining, the tissue of interest (TOI) is stained with DAPI to visualize and mark genomic content in the cell nuclei. Subsequently, the tissue is imaged in all channels of interest to record background autofluorescence. Next, the tissue sample is stained with 4 fluorophore-conjugated antibodies and reimaged to capture antigen-specific signals. After completion of this first staining and capture, dyes undergo a chemical inactivation process to remove the signal, allowing for reuse of common dyes in an iterative staining process with different antibodies in the following imaging cycles. After all targets of interest have been imaged, all sequential images are accurately aligned by utilizing the DAPI-stained nuclei as fiducial points. The captured autofluorescence background signal is then subtracted from the biomarker signal to enhance quantification accuracy. Single-cell resolution and phenotyping are achieved through the segmentation of individual cells, including the plasma membrane, cytoplasm, nucleus, tumor, and various stromal regions of the TOI.61
Researchers have utilized Cell DIVE in various oncology studies, demonstrating the capabilities of the MxIF workflow in spatially understanding the immune contexture of the TME. One specific study used MxIF technology to identify biomarkers in 117 stage III CRC patients who had been treated with adjuvant fluoropyrimidine/oxaliplatin (FOLFOX) chemotherapy. Several biomarkers (CD45, CD3, CD4, CD8, FOXP3, PD1) were spatially analyzed on tissue microarrays (TMAs) utilizing the MxIF technology and were subsequently run through probabilistic classification algorithms and various statistical models (Fig. 3). The identified cell populations were correlated with disease-free survival (DFS) and overall survival (OS) of FOLFOX-treated patients. Additionally, the study identified that PD1− Treg cells were more heavily associated with survival than PD1+ Treg cells. The study thus effectively demonstrated Cell DIVE's ability to spatially profile the TiME of patients for accurate prognosis.69 Overall, as demonstrated, multi-cycle fluorescence imaging techniques have yielded promising capabilities for multiplexing technology in furthering immune profiling studies, even beyond oncology.
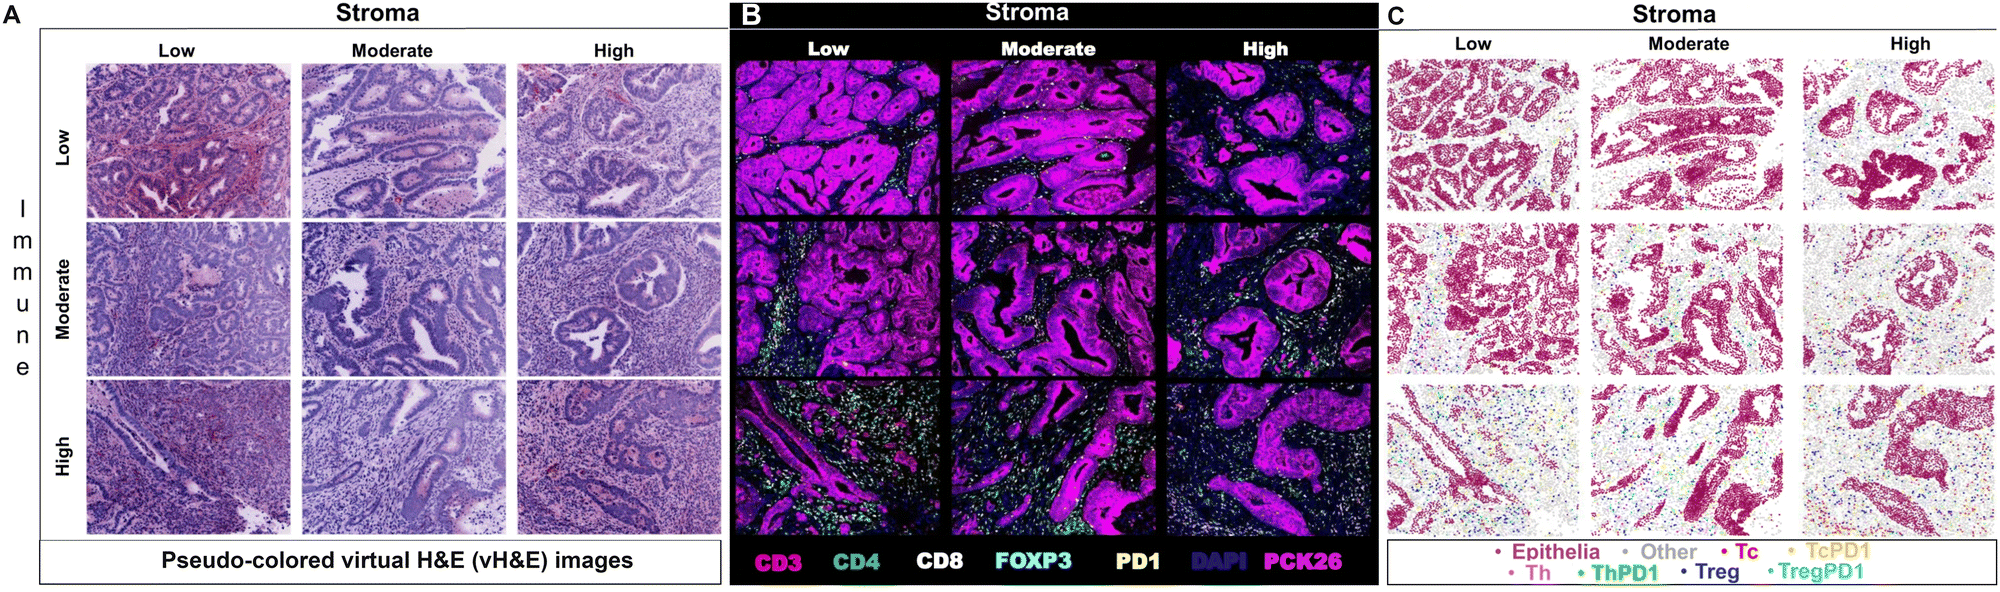 | ||
| Fig. 3 Example of multiplexed immune profiling for stratification of chemotherapy-treated stage III CRC patients with Cell DIVE. (A) Representative images of virtual H&E, (B) multiplexed IF images, and (C) tissue mappings with color-coded cell classifications. The top left image in each panel is a representative Immune-Low, Stroma-Low tissue core while the bottom right image is a representative Immune-High, Stroma-High tissue core (adapted from ref. 69. Copyright 2021, The Author(s)). | ||
While the sequential, or multi-cycle, IF approach offers a tried and tested ability to provide spatial, multiplexed cellular information about the TME, these techniques also present limitations that should be further researched and improved upon for studies hereafter. One such factor is the time required for imaging. The hands-on experimental time for antibody conjugation can be about 4.5 h, validation of antibodies can take about 6.5 h, preparation for the multi-cycle experiment can take about 8 h, and imaging can take about 45 min. Cyclical imaging also requires significant data processing, as multiple images need to be aligned, and tissue damage can become substantial after multiple cycles. Therefore, data processing could be improved by utilizing deep learning algorithms or other computational techniques. Additionally, CODEX lacks a signal amplification system, making the detection of low-abundance proteins more challenging. Currently, CODEX technology boasts a 100-plex ability, while Cell DIVE offers a capacity of 60-plex. CODEX technology enables multiplexed imaging of FFPE and fresh-frozen tissue sections, while Cell DIVE's protocols have been validated solely for FFPE specimens. Although Cell DIVE was initially optimized for FFPE tissues, users have also developed protocols for studying frozen tissues.
MIBI was developed by IONPath to fully characterize patients’ immune systems, including their TME. The three main steps of the technique involve staining, image acquisition, and analysis. Tissue staining for MIBI is quite similar to IHC staining.47 Once slides are prepared, they are loaded into the MIBI instrument, which is a secondary ion mass spectrometer (SIMS) with a time of flight (ToF) mass analyzer. As a rule, the MIBIscope utilizes a liquid gold (Au) metal ion gun as the primary ion source. The MIBIscope raster-scans a primary ion beam across the tissue, liberating secondary ions that are mass-filtered to preferentially enrich for the isotopes introduced by the staining of the tissue with the metal-conjugated antibodies (Fig. 2). An electrostatic analyzer within the MIBIscope acts as an energy filter, significantly biasing the ions detected toward monatomic species and reducing the transmission of polyatomics (hydrides, oxides, and organics). The masses of the secondary ions are determined using the orthogonal ToF mass spectrometer, and the detected species are assigned to target biomolecules given the known isotopic label of each antibody.
IMC technology from Standard BioTools represents a novel approach to spatially resolved single-cell analysis with metal-conjugated antibodies targeting specific proteins of interest. Each antibody is tagged with a unique metal isotope, allowing for multiplexed detection of multiple targets within the same tissue section. Stained tissue samples are ablated using a laser, allowing for the liberation of ions from the tissue surface. This release of ions can be analyzed by MS, with each metal isotope corresponding to specific antibody-targeted proteins. IMC thus generates a spatially resolved map of protein expression within the tissue sample. As an example, van Maldegem et al. validated a panel of 27 metal-tagged antibodies on human spleen FFPE tissue to interrogate the remodeling of the TME induced by a KRAS G12C inhibitor in an immunocompetent mouse orthotopic lung cancer model. The multiplexing capabilities of IMC allowed the authors to highlight the infiltration and activation of antigen-presenting cells and effector cells.71 The validated 27-plex panel enabled distinguishing a variety of immune cell types that are thought to play a role within the TME, such as lymphocytes and various subsets of myeloid cells (Fig. 4). In addition, this panel included markers to visualize the context of the tissue architecture, e.g. endothelium and fibroblasts, as well as phenotypic markers that describe the maturation and activation state of both tumor and immune cells.
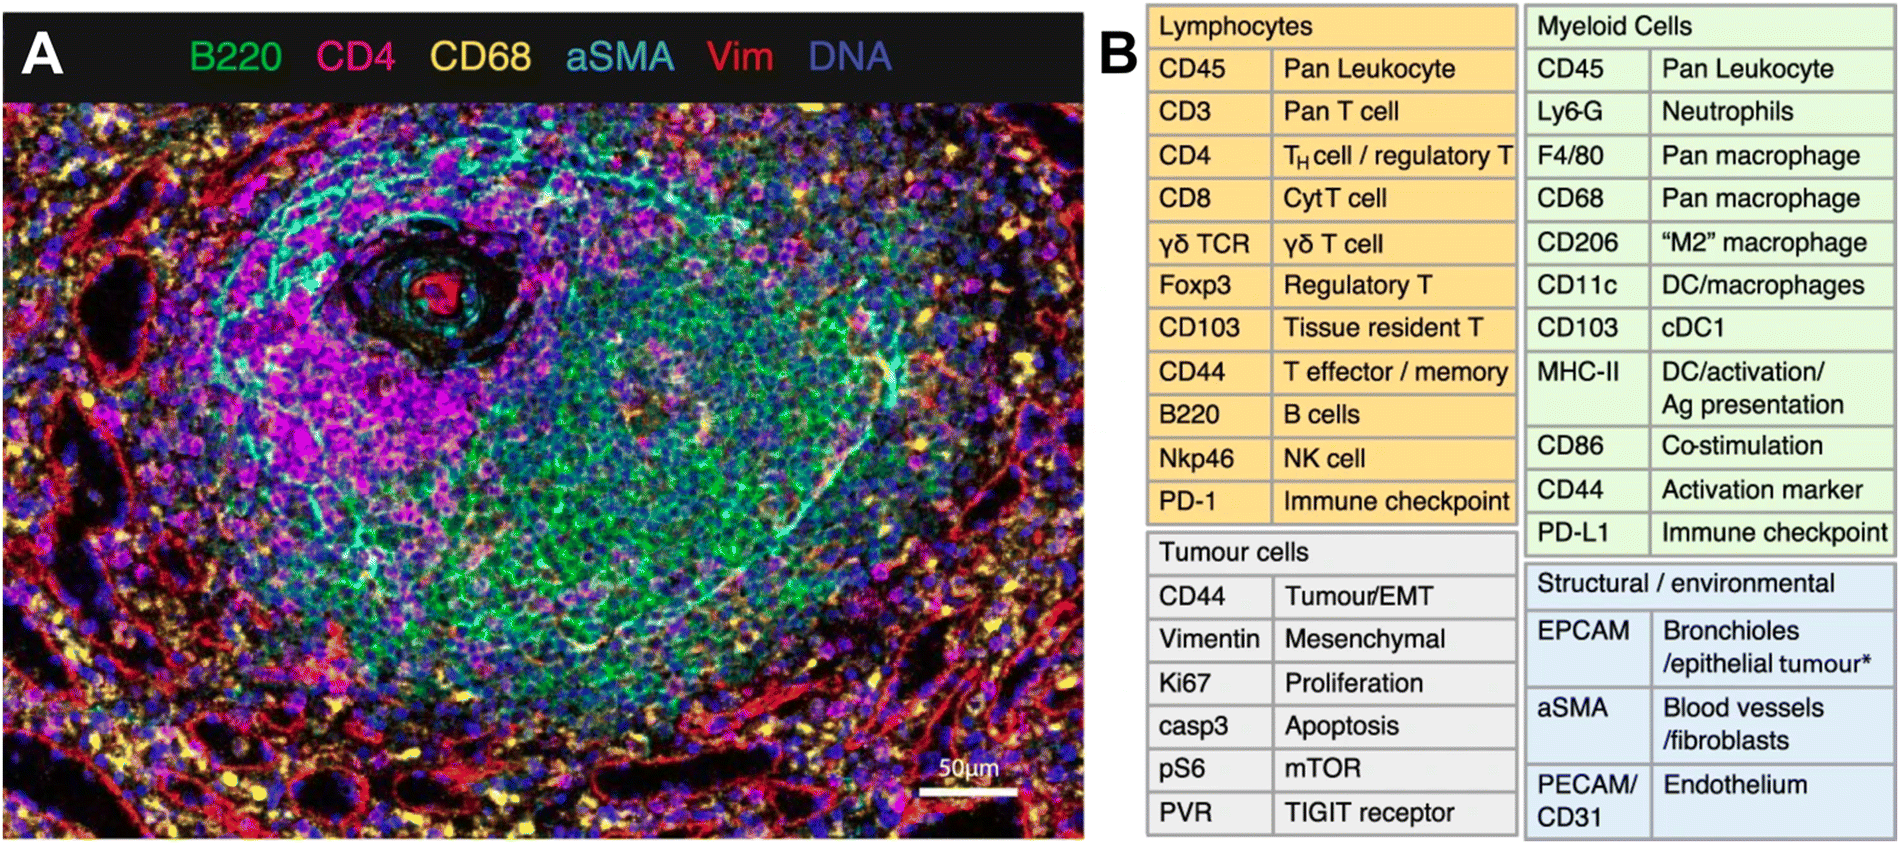 | ||
| Fig. 4 Example of IMC panel for multiplexed immune profiling. (A) Validation of antibodies in IMC using a follicle in the spleen; Ir191/193 (blue), B220 (green), CD4 (magenta), CD68 (yellow), αSMA (cyan), vimentin (red). (B) Panel of 27 antibodies that identify multiple cell types from lymphoid, myeloid, tumor, and stromal compartments, as well as markers of activation and proliferation status. DC dendritic cells, NK natural killer, EMT epithelial-to-mesenchymal transition, Ag antigen (adapted from ref. 71. Copyright 2021, The Author(s)). | ||
Although MS is a powerful technique for immune profiling through the identification and quantification of proteins, peptides, etc., it has limitations that can affect its strength as an immune profiling tool. Firstly, while MS has high sensitivity, it requires developing a high parameter panel, is expensive and time-consuming, and requires antibody validation and optimization. MS-based analysis destroys the tissue, inhibiting the ability to further interrogate the sample for multiomic analysis. Additionally, MS devices usually require increased specialized user training to operate effectively. Due to the complexity of MS-based techniques (sample preparation, instrument setup, data acquisition, etc.), these experiments are time-consuming and resource-intensive. Finally, MS instrumentation and reagents tend to be more expensive, making MS-based immune profiling studies a costly option for researchers.72
4. Nanotechnology potential for immune profiling
Nanoparticles (NPs) possess several advantageous characteristics that have made them well-suited for various biomedical applications. The rise of nanotechnology in medicine has brought about key advancements in diagnostic methods, drug and vaccine delivery, and medical imaging.73,74 One of the most impactful developments in nanomedicine is the ability to achieve active targeting, ensuring tissue and cell specificity.75 NPs can be functionalized with targeting ligands, including a multitude of peptides, aptamers, or antibodies to bind to biomarkers of a specific cell type.76 Expression levels of biomarkers or receptors on a cell are variable; for instance, overexpression can occur in response to tissue neoplasm or injury.77 However, the use of diagnostic biomarkers faces various challenges, such as low concentrations of biomarkers in biological samples and the heterogeneity in biomarker expression across patients. The utilization of NPs with an enhanced surface-to-volume ratio can offer increased sensitivity and specificity required for biomolecular diagnostics.Several advantages of NPs make them excellent candidates for the detection and imaging of immune cells in patient specimens. Firstly, NPs can be engineered to achieve enhanced sensitivity, e.g., by carrying fluorescent dyes or other markers, enabling highly sensitive detection of immune cells and molecules. This improved sensitivity of NPs allows for the detection of low-abundance targets, providing a more comprehensive understanding of the immune response. Second, NPs are characterized by high chemical, biological, and signal stability. NPs can be designed to be stable in various biological environments, including blood, tissues, and cellular compartments. This stability ensures the integrity of immune profiling over time, allowing for reliable and reproducible results. Third, many NPs are either biocompatible or biodegradable, minimizing adverse effects on immune cells and tissues. This ensures the safety of NP-based assays for both in vitro and in vivo applications. Fourth, NPs can be engineered to achieve high binding avidity to immune cells and deliver immune-modulating agents, such as antigens, adjuvants, or drugs, directly to immune cells. Fifth, NPs can be designed for multimodal detection, enabling the simultaneous use of various imaging modalities. Finally, multiple batches of NPs, exhibiting unique barcoded signals, can be engineered to simultaneously detect multiple immune markers in a single assay or imaging acquisition. Together, these characteristics have the potential to be harnessed toward the development of an entirely new imaging strategy to profile the diverse cell types of the immune system. Here, we review how NPs are already being utilized in several detection-based biomedical assays and how they are being further developed to offer unprecedented multiplexing capabilities. We also offer a new perspective on the potential to exploit and repurpose these unique characteristics of NPs to play a significant role in the ever-evolving landscape of immune profiling.
The ability to actively target cells of interest, coupled with distinctive physicochemical properties, positions NPs as an appealing technology in a broad range of biomedical applications. Quantum dots (QDs), gold nanoparticles (AuNPs), silica nanoparticles (SiO2 NPs), and polymeric-based nanocarriers (PNCs) represent four of the most common types of NP-based probes employed in the detection of cancer and will be further discussed in the following sections.78
4.1. Nanoparticle-based contrast agents for biomarker detection and biomedical imaging
One important advantage of NPs is their ability to achieve multivalent binding with their intended target. Multivalent binding, also known as polyvalent binding, involves the simultaneous attachment of multiple ligands on one biological entity to multiple receptors on another. These interactions occur naturally, such as viruses targeting cells and the binding of antibodies to pathogens,79 which have inspired synthetic multivalent systems.80 Engineered NPs frequently include multiple copies of the targeting ligand, which facilitates multiple binding events. Multivalent interactions are collectively stronger than the corresponding monovalent interactions, thus improving the binding ability of NPs to the receptors on the target cell.81Alongside the ability to complete multivalent interactions, NPs can additionally be useful because of their distinct detection properties. Luminescent semiconductor nanocrystals, or QDs, with a core diameter of 2–10 nm, are utilized in imaging applications because of their improved photostability and photoluminescence, which can be tuned based on the chemical composition.82 The properties of QDs result from quantum-size confinement, which occurs when metal and semiconductor particles are smaller than their exciton Bohr radii (ca. 1–5 nm). Cd(II) and Pb(II) have been used as the base metal for the fluorescent core of QDs.83 More recently, toxicity concerns due to the leaching of heavy metals facilitated the integration of new materials such as Ag(I), Cu(I), and carbon dots.84–86 The narrow, tunable, and symmetric emission spectra and photochemical stability of QDs, as compared to conventional fluorescent dyes, render QDs ideal for biological imaging.87,88 Therefore, QDs have been used extensively for molecular and cellular labeling.89 As such, QDs hold promise for quantitative multiplexed molecular profiling, of growing importance as prognostic and pharmacodynamic models increasingly rely on multiple co-localized biomarkers.90
Metallic NPs such as AuNPs and AgNPs exhibit localized surface plasmon resonance (LSPR), which is an intense resonance measured through Rayleigh scattering91 and is highly sensitive to surrounding changes in media. As a result, colorimetric sensing is possible due to the shift of the LSPR through solvent changes or surface chemical binding.91 Additionally, the LSPR effect gives rise to drastically increased intensities of Raman scattering signals. Thus, metallic NPs are uniquely suited as cores for constructing surface-enhanced Raman scattering (SERS) NPs, also known as SERS nanotags. The SERS technique has gained popularity in bioanalysis because of its ultrahigh sensitivity, specificity, and ability to provide unique “fingerprint” chemical and conformational information of biomolecules.92 The most widely used plasmonic substrates for fabricating SERS nanotags are AuNPs of various morphologies, such as spheres,92–94 rods,95,96 and stars.97–99 The utilization of AuNPs as Raman signal enhancers allows for the detection of clear distinct vibrational spectra, and this has been widely utilized in biomedical applications to detect and visualize specific analytes such as RNA/DNA, proteins, and cellular components.100–102 There has been additional utilization of the Raman imaging technique in isolating tumor cells. For instance, the feasibility of utilizing SERS imaging for characterizing excised tumor tissues and in vivo tumors has been proven in experiments.103,104 Tumor margins can be delineated by intraoperative SERS imaging, which is beneficial for guiding surgeons to fully excise malignant tissue.105–107
4.2. Nanoparticles in point-of-care (POC) applications
The ability to actively target cells, along with detecting their optical properties, has already made NPs ideally suited for point-of-care (POC) applications, including lateral flow assay (LFA) used in food safety and clinical diagnoses. A typical LFA test contains two main components: a mobile phase and a stationary phase. When a sample (mobile phase) is applied to the sample pad (stationary phase), it is drawn by capillary forces through the device to the conjugate pad. If the sample contains the target analyte, the analyte will bind to the label. Commercialized LFAs typically use a colorimetric label that does not require instrumentation and skilled personnel to interpret, making it affordable and accessible.AuNPs are widely used as labeling material in LFAs due to their high extinction coefficient, affordability, stability, and easy functionalization. For instance, AuNPs conjugated with peptides have been utilized in the detection of African swine fever virus with high sensitivity and specificity in 10 min.108 In a typical LFA test, the detection of the analyte depends on the label sensitivity and signal transduction. AuNPs serve as a traditional colorimetric label and can also be used with other modalities such as SERS, fluorescence, and enzyme mimicking, thereby enhancing their sensitivity and versatility in LFA applications.109 For example, the LSPR of AuNPs was used to enhance the signal-to-noise ratio when sensing for human chorionic gonadotrophin (HCG) in pregnancy tests, allowing an improved detection limit of 1 pg mL−1.110 This increased sensitivity and strong color in the visible region have been utilized in a multitude of applications and continue to be employed to detect novel pathogens.111,112
The severe acute respiratory syndrome coronavirus 2 (SARS-CoV-2) pathogen is responsible for the coronavirus disease (COVID-19) pandemic, which has affected millions of lives around the world. The predominant and standard method for laboratory diagnosis of COVID-19 is RT-PCR.113 However, this method has drawbacks, including the long extraction procedure and unsuitability for on-site detection. False negatives also occur with RT-PCR due to unstable reagents, low viral load in the sample, and improper sampling.114–116 The method additionally relies on the experience of the operators and the ability to maintain a cold chain support for reagents for transportation and storage. Researchers developed a rapid diagnostic test that was easy to perform on-site by creating functionalized AuNPs to detect the IgM and IgG antibodies against the SARS-CoV-2 virus.117 The simple synthesis, excellent stability, and specific binding force of AuNPs contributed to the improved accessibility and cost of the test.117–120
Multiplexed LFAs have been used to further improve efficiency and diagnostic precision. Multiplex immunochromatographic test strip (ICTS) nanosensors have been widely used for simultaneous multi-target detection because they are simple and cost-effective. For example, Wu et al. demonstrated a bare-eye detectable readout and independence of complicated equipment using colored NPs for simultaneous and quantitative detection of 4 common mycotoxins found in corn.121 The four different-colored AuNPs were linked to corresponding monoclonal antibodies and selectively bonded to spatially distinct lines on a single test strip. This successfully achieved the simultaneous visual detection of these toxins, providing a simple and rapid detection platform that highlights the beneficial ability of NP multiplexing.
Alongside the traditional colorimetric methods, the detection of target proteins by NP-based fluorescence and SERS LFAs has been proposed. For example, QDs embedded in silica-encapsulated NPs were used to improve the sensitivity of exosome detection. Exosomes have recently gained interest as biomarkers for monitoring diagnosis and prognosis of various diseases. The detection limit using this NP-based approach was 11 times better than the previously reported limits, demonstrating highly sensitive active targeting with NPs.122 Using SERS NPs, Zhang et al. were able to rapidly quantify 11 common respiratory tract infection (RTI) pathogens with a broad dynamic range and high sensitivity on a single lateral flow microarray.123
4.3. Nanoparticles for multiplexed detection and imaging
Accurately profiling multiple immune cells simultaneously faces a challenge due to the large variety of cell types as well as the significant variety in molecular profiles among cancer patients both spatially and temporally. NP-based contrast agents are a promising tool for immune profiling, as they can possess the following properties: (i) high sensitivity; (ii) high binding specificity; (iii) biocompatibility; (iv) possibility of surface modification; (v) photo- and chemical stability; (vi) multiplexing ability; and (vii) reproducibility. Researchers are utilizing the many advantages of NPs to facilitate multiplexed imaging of extensive arrays of cancer and immune biomarkers. This approach has the potential to enable the prediction and monitoring of therapeutic response and enhance effective drug development. Various types of NPs can be used in immune profiling and will be further discussed here.Furthermore, amorphous polymers such as polystyrene or latex have been employed to encapsulate commonly used fluorescent dyes to produce microspheres and thus facilitate multicolor experiments. For instance, commercially available energy-transfer fluorescent beads TransFluoSpheres (Molecular Probes) are produced with 10 different fluorescent colors in 10 different nominal bead diameters (from 20 nm to 15 μm).127,128 For molecular imaging applications, the TransFluoSpheres beads have a high density of pendent carboxylic acids on their surface, making them suitable for covalent coupling with proteins and other amine-containing biomolecules via water-soluble carbodiimide reagents such as 1-ethyl-3-(3-dimethylaminopropyl)carbodiimide (EDAC).
Compared to polymer-based NPs, dye doping of SiO2 NPs is straightforward and versatile enough to allow for different dyes and drugs to be incorporated in the silica matrix.129 Furthermore, controlling synthetic parameters allows for the creation of NPs with different sizes. Their adaptable and well-understood chemistry enables simple and straightforward ways to modify the NP surface chemistry to provide reactive sites for further functionalization.130 Silica NPs are easy to isolate via centrifugation during particle preparation processes due to the high density of silica. Additionally, SiO2 NPs are hydrophilic, biocompatible, biodegradable, and resistant to microbial attack. Apart from other advantages of SiO2-based NPs, they do not swell or change porosity with different pH changes, while polymer particles are hydrophobic, can agglomerate in aqueous medium, and swell in organic solvents, leading to dye leakage.131,132
Fluorescence resonance energy transfer (FRET) has been utilized as a technique for creating fluorescently barcoded SiO2 NPs to enable multiplexed bio-imaging.131 In their work, Chen et al. demonstrated active targeting of Ramos cells (B lymphocyte, Burkitt's lymphoma), CCRF-CEM cells (T lymphoblast, acute lymphoblastic leukemia), and Toledo cells (B lymphocyte, diffuse large cell lymphoma) with aptamer-conjugated single-dye-, dual-dye-, and triple-dye-doped silica NPs.133 For synthesis of dye-doped 60-nm silica NPs and sequential multiplexed FRET imaging, the authors used fluorescein amidites (FAM), rhodamine 6G (R6G), and 6-carboxyl-X-rhodamine (ROX). With a varied ratio of 3 tandem dyes co-encapsulated in SiO2 NPs, these imaging probes exhibit multiple colors when excited by a single wavelength. The covalent tri-chromophoric doping was achieved in two steps: (i) attaching amine-reactive dye molecules to (3-aminopropyl)triethoxysilane (APTES); (ii) adding the dye-APTES into hydrolysis reaction of tetraethyl orthosilicate (TEOS) known as Stöber process. This approach can be further extended to include more than 3 chromophores. Fluorophore-doped silica NPs are characterized by uniformity, high fluorescence intensity, and photostability, and they can be easily conjugated with biomolecules such as proteins and nucleic acids.
Among this type of NPs, only <10 nm-sized polyethylene glycol (PEG)-coated fluorescent core–shell SiO2 NPs – referred to as “Cornell dots,” or C dots – have been approved by the U.S. Food and Drug Administration (FDA) as an investigational new drug for first in-human clinical trials.134 The C dots were originally created in the group led by U.B. Wiesner.135–138 The ultrasmall size of the C dots is below the cutoff for renal clearance, making them safer and more efficient than previous drug delivery vehicles. In 2014, the first clinical trial results with melanoma patients were shown to be encouraging.139 Elucida Oncology Inc. has further developed the C’ dots and the first patient has been treated with folate receptor alpha (FRα)-targeted C′ dot drug conjugate in 2023 as a part of the Phase 1/2 trial. Ma et al. demonstrated the incorporation of 5 different dyes: cyanine 5 dye (Cy5), Cy5.5, rhodamine green (RhG), tetramethylrhodamine (TMR), Dyomics 782 (DY782), and IRDye 800CW (CW800), into C’ dots (Fig. 5A).140 The bio-targeted C’ dots consisted of a ca. 3-nm-diameter SiO2 core encapsulating one Cy5 fluorophore molecule, a ca. 0.5-nm-thick silica shell, a ca. 1.5-nm-thick PEG layer, and 16 c(RGDyC) targeting ligands. The prepared C’ dots comprised ca. 800 SiO2 units and ca. 100 PEG chains on the NP surface. The overall NP size was ca. 7.5 nm with ca. 110 kDa molar mass. Fluorescence correlation spectroscopy (FCS) measurements were conducted using a home-built FCS setup with a 488 nm excitation for the RhG-SiO2 NPs, 543 nm – for the TMR-SiO2 NPs, 633 nm – for the Cy5- and Cy5.5-SiO2 NPs, 785 nm – for the DY782- and CW800-SiO2 NPs. Additionally, the researchers demonstrated that the optical characteristics of these NPs can be tuned from the visible into the NIR part of the optical spectrum.
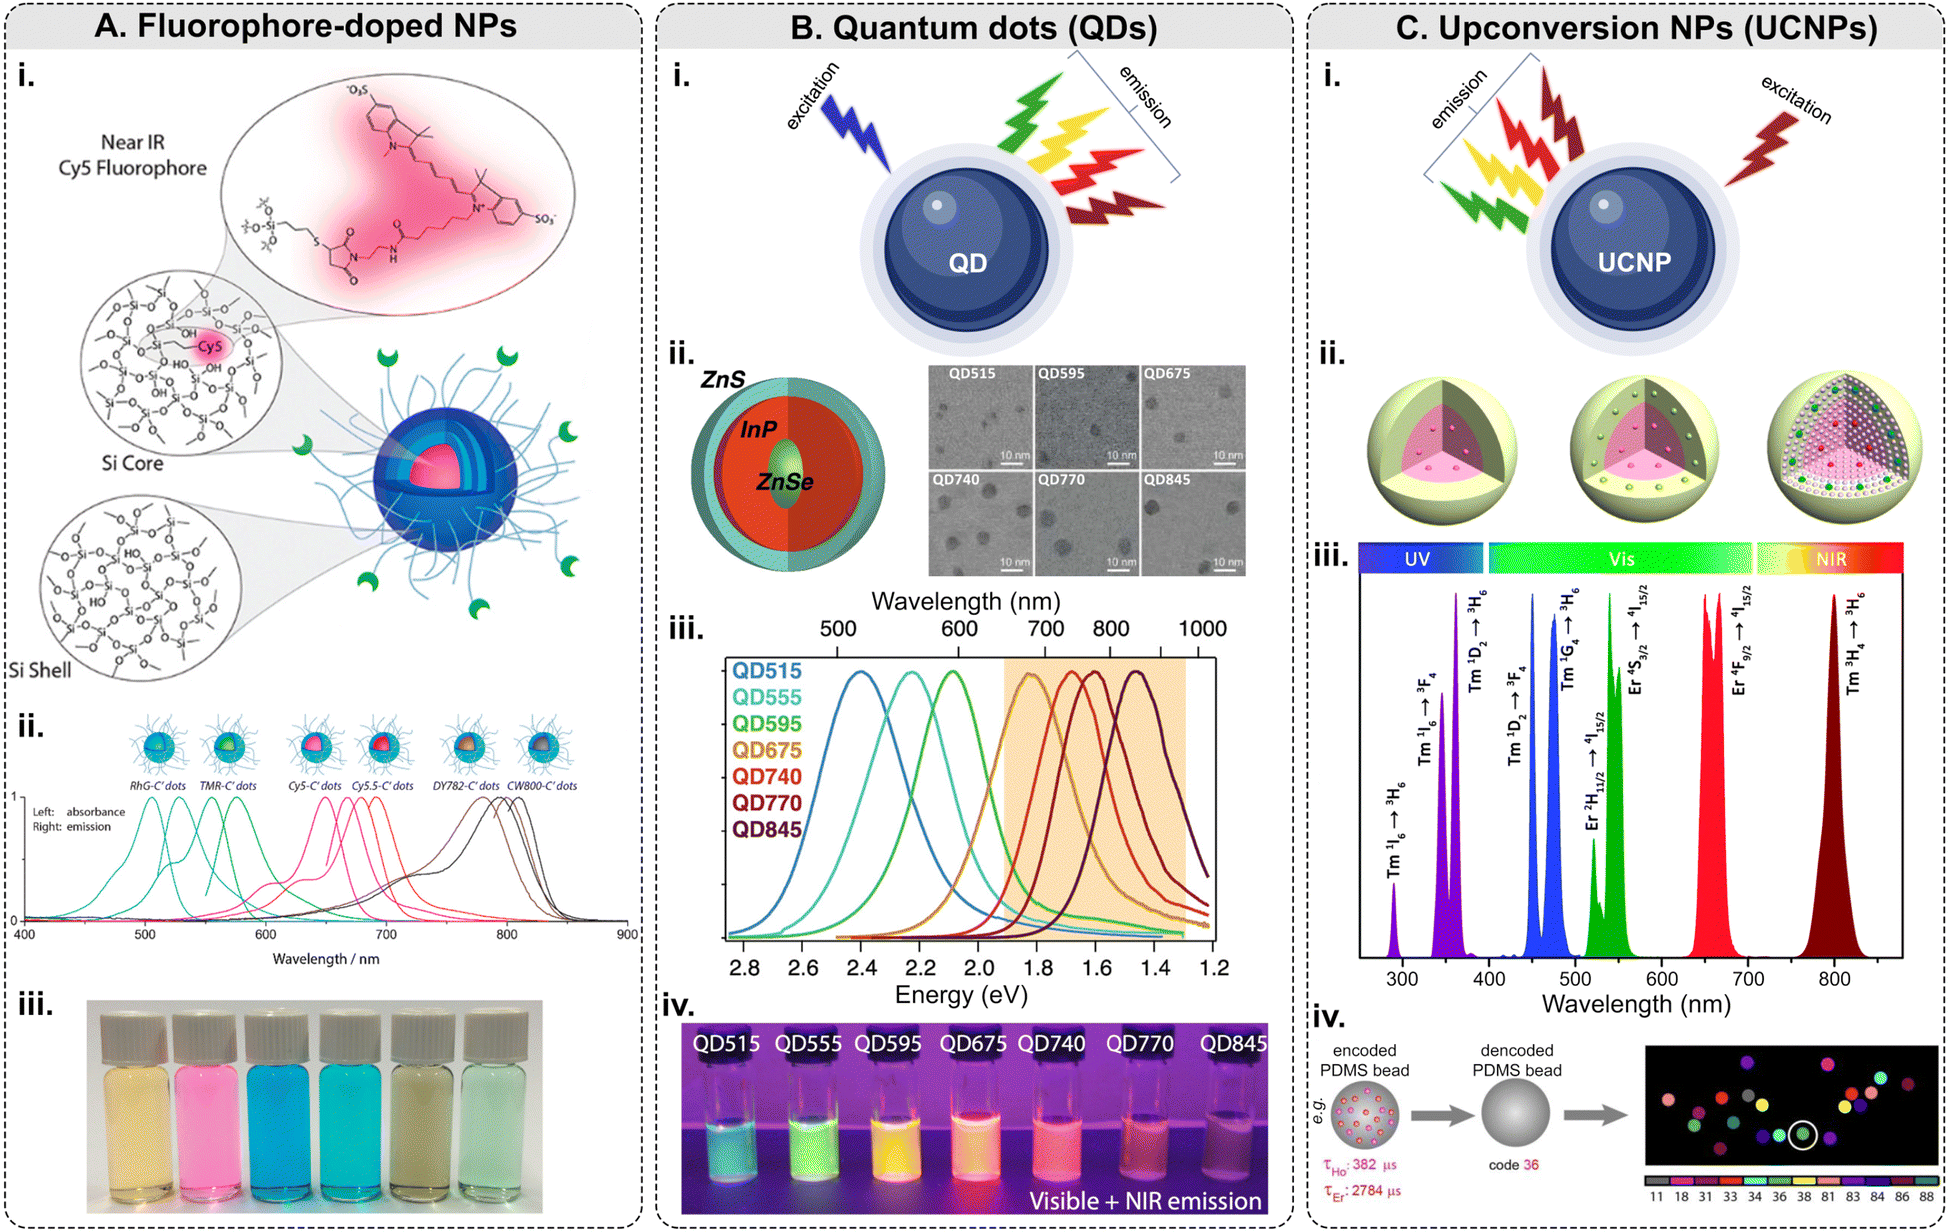 | ||
| Fig. 5 Fluorescence-based multiplexing potential of NPs. (A) Fluorophore-doped NPs. Examples include (i) a schematic of fluorophore-doped SiO2 NPs; (ii) normalized absorbance and emission spectra of SiO2 NPs (C′ dots) with different dyes/colors; (iii) a photograph showing the solution appearance of SiO2 NPs derived from different color dyes (adapted with permission from ref. 140. Copyright 2015 American Chemical Society). (B) Quantum dots. (i) Principle of emission of light along with examples of (ii) a schematic of ZnSe/InP/ZnS core/shell/shell NP structure: wide-bandgap ZnSe core acts as a spacer around which the optically active InP shell is wrapped and SEM micrographs; (iii) normalized photoluminescence spectra of QDs with increasing InP deposition: InP QDs can emit at longer wavelengths and are tunable with shell thickness; (iv) QDs under UV illumination (digital camera internal IR-blocking filter removed to show visible and NIR emission) (adapted with permission from ref. 141. Copyright 2021 American Chemical Society). (C) Upconversion NPs. (i) Principle of emission of light along with examples of (ii) general core–shell strategies for spatial confinement of lanthanide dopants in the host lattice of a NP (adapted with permission from ref. 142. Copyright 2014 American Chemical Society); (iii) typical UC emissions, ranging from the UV to NIR regions, from Yb3+–Er3+ and Yb3+–Tm3+ co-doped UCNPs under 980 nm excitation (reproduced from ref. 143 with permission from the Royal Society of Chemistry); (iv) lifetime coding based on PDMS beads encapsulating Ho and Er NPs and decoding scheme to identify every individual bead.144 | ||
Although QDs possess many unique and valuable properties, their usage in multiplexed imaging is still limited. Typically, QDs are made of metallic and inorganic elements (Cd, Pb, Te, Zn, Al, Ga, S, Se, As, In, etc.), which are known for their toxicity in biological systems.150 Therefore, the cytotoxicity of QDs is a serious concern for in vivo applications.151 Biocompatibility can be achieved by coating QDs with biocompatible materials, and toxicity can be minimized by adopting alternative synthesis methods to limit the leaching of the metal ions.152 The major challenge QDs face for tissue imaging is the reproducibility of their synthesis and bioconjugation: QDs are relatively difficult to prepare reproducibly, and the chemistry of their surface modification is still being actively studied.74,148 Additionally, the “blinking” effect is a limiting factor for raster scanning systems such as confocal microscopy and flow cytometry.
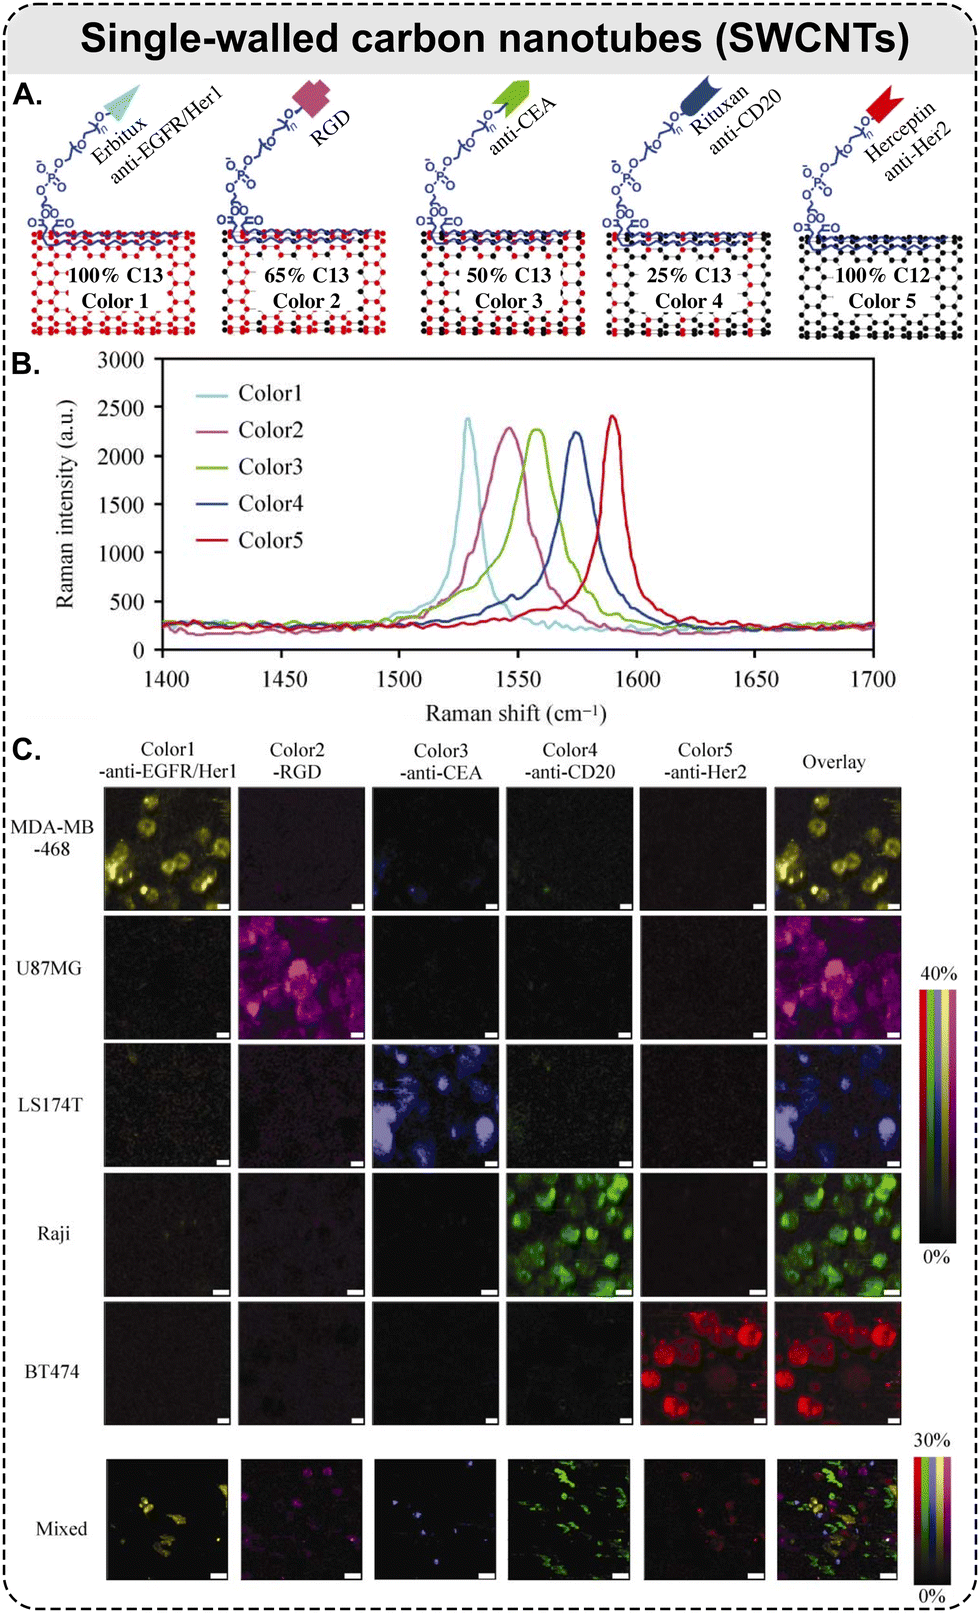 | ||
| Fig. 6 Raman scattering-based multiplexing capabilities of SWCNTs: example of five-color Raman imaging of cancer cells. (A) Five types of isotopically modified SWCNTs with average length of ca. 150 nm, grown from FeRu catalysts, conjugated with different targeting species: Erbitux anti-EGFR, RGD peptide, anti-CEA, Rituxan anti-CD20, and Herceptin anti-HER2. SWCNTs with 5 different 13C percentages of 100, 65, 50, 25, and 0%, respectively, which exhibit 5 distinct Raman peaks shown in (B) and coined as ‘colors’; (B) Raman spectra of the five different SWCNTs in aqueous solutions, where the shift of SWCNT Raman G-band peak is dependent on the 13C/12C ratio in the SWCNTs. The average shift between two adjacent colors is ca. 15 cm−1; (C) different cancer cell lines were stained by a 5-color multiplexed SWCNT mixture for Raman imaging (5 top rows: scale bars represent 10 μm); all 5 types of cancer cells were mixed and then incubated with the five-color SWCNT mixture (bottom row: scale bars represent 40 μm) (adapted with permission from ref. 160. Copyright 2010 Springer Nature). | ||
The applicability of MS-tagging of PNCs has been limited due to the challenges of detecting polymers directly in complex biological samples. However, in 2022, Agrohia et al. reported metal-coded mass tags (MMTs) that enable multiple PNCs to be detected and quantified simultaneously. These MMTs consist of a cyclic ligand: 1,4,7,10-tetraazacyclododecane-1,4,7,10-tetraacetic acid (DOTA), which forms strong complexes with Tb, Tm, Y, and Ho metal ions.162 So far, this ICP-MS-based approach has been demonstrated on digested cell samples.
A group led by W. Min developed expanded panels of Raman dyes: 24 vibrational colors of Manhattan Raman scattering (MARS) dyes164 and 20 polyynes with distinct Raman frequencies known as ‘Carbon rainbow’, or Carbow.165 The vibrational palettes were prepared by isotopically editing alkynes.166 Stimulated Raman scattering (SRS) imaging techniques were used to provide substantial signal amplification, accelerate speed, and decrease levels of autofluorescence. However, these small molecule probes must be custom-designed to be water-soluble, non-cytotoxic, and detectable at low concentrations for live-cell imaging. Therefore, the researchers suggested incorporating the SRS imaging probes into polymeric NPs made of latex167 and coherent anti-Stokes Raman scattering (CARS) probes in polystyrene beads (Rdots).168
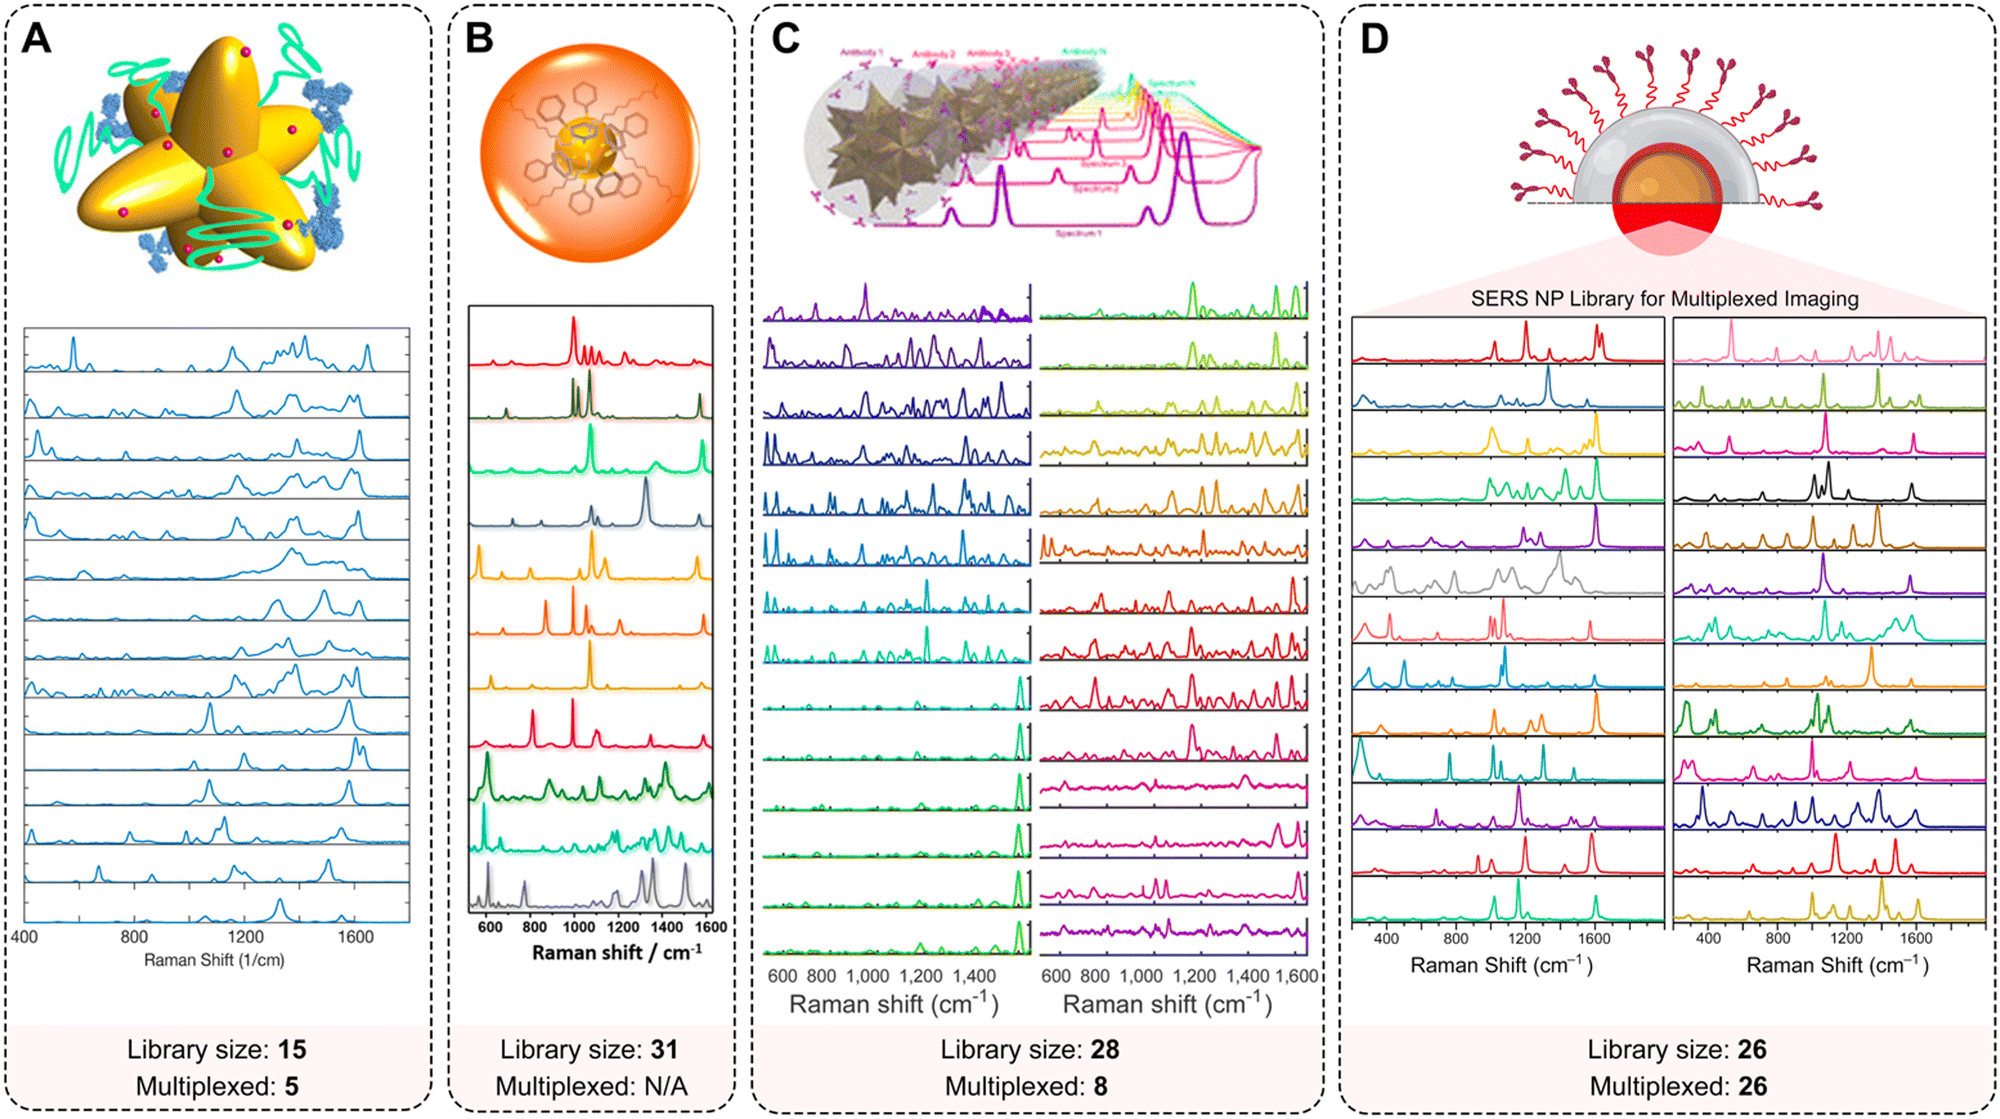 | ||
| Fig. 7 Multiplexing capabilities of SERS NPs. Examples of extended spectral libraries of SERS NPs: (A) SERS spectra of the 15 selected Raman reporters on gold nanostars (adopted with permission from ref. 170. Copyright Authors); (B) SERS spectra of 11 representative SERS-encoded NP colloids from a 31-membered panel (adopted with permission from ref. 93. Copyright 2015 American Chemical Society); (C) uniquely identifiable spectra, shown here after baseline subtraction and averaging for a 28-membered SERRS NP panel (adopted with permission from ref. 98. Copyright Authors); (D) Raman signatures from a 26-membered library of SERS NPs (adopted with permission from ref. 94. Copyright 2022 American Chemical Society). | ||
Sanchez-Purra et al. demonstrated 15 SERS NP types, all exhibiting unique Raman spectra (Fig. 7A).170 The Raman reporters demonstrated different amounts of overlap with one another. Notably, larger dye molecules such as brilliant cresyl blue (BCB), crystal violet (CV), methylene blue (MB), malachite green isocyanate (MG), methylene green (MEG), neutral red (NR), rose bengal (RB), rhodamine 6G (R6G), and victoria blue (VB) showed more complex spectra. The SERS NPs labeled with these dyes were characterized by a higher number of peaks, and thus a higher degree of overlap quantified in a correlation matrix built from the SERS spectra. This spectral overlap was shown to decrease the multiplexing capabilities of Raman imaging with the commonly used NIR dyes as Raman reporters.171 The degree of spectral overlap and the accuracy of spectral unmixing were evaluated using density functional theory (DFT) calculations,172 correlation matrices, condition numbers, and Raman imaging experiments. Using custom-synthesized NIR dyes as Raman reporters, Andreou et al. demonstrated the ability to prepare 28 distinct SERS NP types (Fig. 7C).98 Eight of the 28 SERS NPs were used for multiplexed targeted imaging of 7 biomarkers: CD8, GITR, 4-1BB, CD11b, NKp46, CD4, and PD-L1, in tumor xenografts in mice to assess immune cell infiltration and response to treatment. Mir-Simon et al. demonstrated that at least 31 different small-molecule Raman reporters can be bound to the surface of spherical AuNPs while maintaining the colloidal stability of NPs (Fig. 7B).93 Eremina et al. reported on a library of 26 SERS NP types (Fig. 7D), which were successfully used for 26-plex imaging when colocalized.94 The multiplexing potential of SERS NPs was demonstrated for in vivo imaging, imaging of actively targeted cancer cells, and on FFPE tissue sections (Table 2).94,173
| Type and size range of NPs | Application | Plexity and method of detection | Ref. | Advantages |
|---|---|---|---|---|
| FRET – fluorescence resonance energy transfer; ICP-MS – inductively coupled plasma mass spectrometry; SRS – stimulated Raman scattering; CARS – coherent anti-Stokes scattering; HUVEC – human umbilical vein endothelial cells; s.c. – subcutaneous; i.v. – intravenous. | ||||
| Quantum dots (QDs) 2–10 nm | Molecular profiling on human FFPE ovarian tumor and tonsil tissue sections | 3-Plex | 90 | Signal brightness and photostability; tunable emission spectra; narrow emission peaks; multiplexing capability; small size with relatively high surface area; long-term stability; compatibility with advanced imaging techniques |
| Monitoring of molecular indicators of angiogenesis in HUVEC cells | 5-Plex | 174 | ||
| Noninvasive and simultaneous visualization of five separate lymphatic flows draining in mice | 5-Plex | 145 | ||
| Quantitative molecular profiles for individual HeLa cells | 5-Plex; 25-multicycle-plex | 146 | ||
| Detecting rare tumor cells in tissue biopsies of Hodgkin's lymphoma patients | 5-Plex | 175 | ||
| Molecular profiling on human FFPE breast cancer tissue biopsies | 5-Plex | 176 | ||
| Fluorophore-doped NPs 10–100 nm | FRET-based molecular imaging with single excitation | 3-Plex | 105 | Enhanced brightness; photostability; versatile surface chemistry; biocompatibility; controlled size; multimodal imaging; long circulation time |
| Ultrasmall C′ dots | 6-Plex | 140 | ||
| Single-walled carbon nanotubes (SWCNTs) d ca. 1 nm; l ca. 150 nm | Molecular imaging of cancer cell lines and ex vivo tissue of colon cancer xenograft | 5-Plex | 160 | No quenching or bleaching; multimodal imaging; simple yet intense Raman spectra; facile spectral deconvolution; chemical stability; longitudinal imaging |
| Upconversion NPs (UCNPs) 5–100 nm | Molecular targeting of 3 breast cancer biomarkers in vivo in tumor xenografts at 6–8 mm depth | 11-Plex | 144 | Narrow emission bands (FWHM 10–50 nm), large anti-Stokes shifts, low toxicity, high chemical stability, resistance to photobleaching and blinking |
| Polymeric nanocarriers (PNCs) 50–100 nm | Quantification of the PNC uptake in cells | 4-Plex (ICP-MS) | 162 | High loading capacity; controlled release; biocompatibility; versatility; incorporation of therapeutic agents |
| Multiplexed imaging in mammalian cells and mouse frozen tissue samples | 6-Plex (SRS) | 163 | ||
| Flow cytometry of MCF-7 breast cancer cells stained by 12 different Rdots | 12-Plex (CARS) | 168 | ||
| SERS NPs 50–200 nm | Widefield quantitative imaging in vivo with NPs injected s.c. on the dorsum of a nude mouse | 4-Plex | 177 | Unprecedented multiplexing capability; enhanced sensitivity; stability and biocompatibility; non-destructive imaging; multimodal imaging |
| Widefield molecular imaging of biomarkers after simultaneous topical application | 4-Plex | 178 | ||
| Topical staining of ex vivo freshly excised breast tissue after lumpectomy or mastectomy | 5-Plex | 179,180 | ||
| Monitoring early effects of immune checkpoint blockade in tumor-bearing mice | 8-Plex | 98 | ||
| Multiplexing on human colon tissue for endoscopic imaging | 10-Plex | 181 | ||
| In vivo multiplexed imaging of NPs injected s.c. and in liver after i.v. injection | 10-Plex | 182 | ||
| Ex vivo multiplexed imaging of ICI | 10-Plex | 183 | ||
| Simultaneous visualization of 7 + 1 immunotherapy-related targets | 15-Plex | 170 | ||
| In vivo multiplexed imaging of NPs in liver after i.v. injection | 26-Plex | 94 | ||
4.4. Nanotechnology and spatial biology
Nanoparticles have already played an important role in offering vital information to the field of spatial biology. Identifying cell types, their relationship to one another, and the degree of expression of signaling proteins are all key pieces of information that can ultimately provide insights into the development of effective treatments. For instance, Modi et al. describe the use of synthetic DNA nanomachines to map spatial and temporal pH changes associated with endosome maturation inside living cells. The DNA nanodevices are assemblies that change states based on environmental cues, such as chemical stimuli. In this application described by Modi et al., the GFP-conjugated DNA nanomachines were successful in indicating pH changes in hemocytes in vitro that could be used to report spatial and temporal cellular changes associated with acidification in tumor cells.184Healy et al. used HER2-targeted and non-targeted MnFe2O4 (MnFO) nanoferrite NPs to analyze the spatial distribution of NPs within various stromal cells and HER2-expressing tumor cells.185 Additionally, NPs can be used for delineating between healthy and malignant tissue. For instance, Kircher et al. demonstrated how non-targeted triple-modality magnetic resonance imaging-photoacoustic imaging-Raman imaging nanoparticles can accurately help visualize the margins of brain tumors in living mice, both preoperatively and intraoperatively.186 Recently, Czaja et al. reported a novel Raman topography imaging method to assist in surgical tumor resection, which affords at least 26-plex 3D tumor surface profiles.187 Spatially relevant intracellular targeting and chemical nanoimaging have been accomplished through the use of X-ray fluorescence in conjunction with AuNP188 and QD189 probes. Furthermore, to reveal the complex spatial biology of tissue samples, several groups have performed monoplexed and multiplexed studies on histology sections using QDs190–193 and SERS NPs.94,194–196 Wang et al. reported the successful application of SERS-active Au nanostars conjugated with a fluorophore-labeled secondary antibody for selective staining of HER2 on FFPE breast cancer tissue sections.194 In their study, Eremina et al. demonstrated that HER2-targeted SERS NPs can be used for quantitative staining of FFPE tissue sections. Notably, this work was seminal in the pursuit of quantifying and validating NP-based molecular profiling on an FFPE tissue section with the gold standard IHC stain.94 Using a ductal carcinoma in situ (DCIS) case, the authors achieved a Pearson correlation coefficient between Raman imaging results and chromogenic IHC stain of 0.96. Thus, nanotechnology, and specifically NPs, have already started to play a role in better understanding the spatial architecture within biological tissue.
4.5. Nanoparticles and the immune system
It is well-established that NPs are capable of selectively binding to target ligands in different cell types. The same functionality can be used to track immune cells, such as T cells,197,198 monocytes,199,200 and NK cells.201 For instance, glucose-coated AuNPs have been used to label melanoma-specific targeted T cells (Fig. 8A). These labeled immune cells circulated in vivo and were able to be longitudinally traced using CT imaging, supporting the applicability of AuNPs in immune cell tracking.198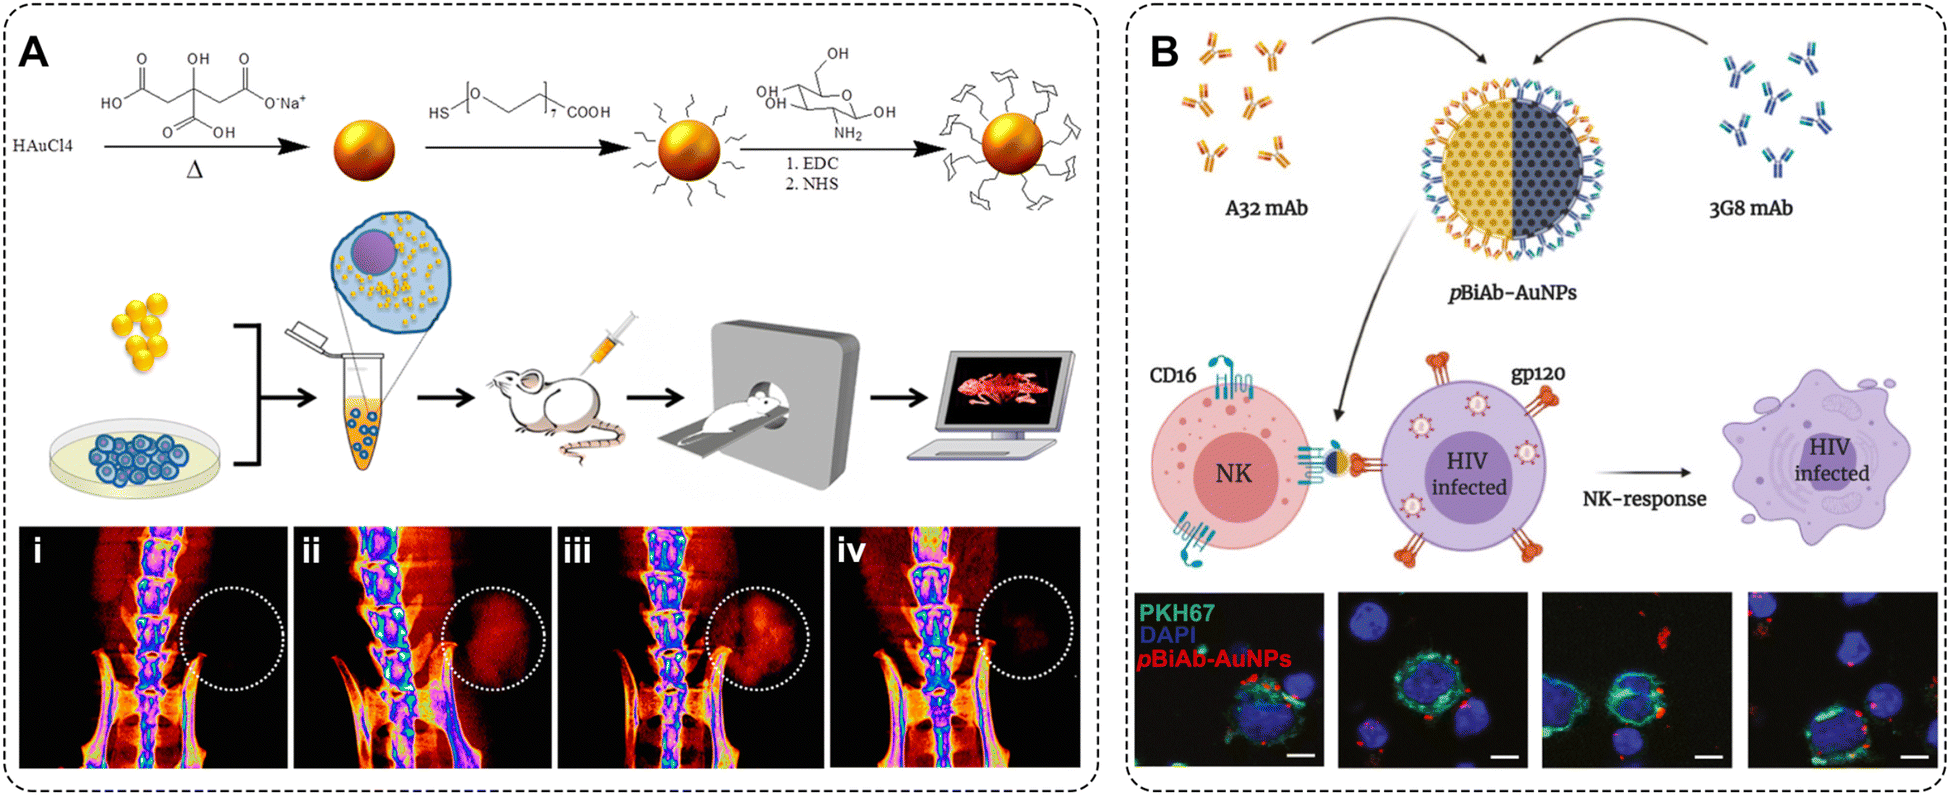 | ||
Fig. 8 Nanomedicine for cancer immunotherapy. (A) T cell tracking: schematic diagram of the AuNP synthesis, conjugation to the PEG linker, and covalent conjugation to glucose; T cells were labeled with AuNPs in vitro, the cells were then injected into mice and tracked in vivo using CT imaging; time-dependent accumulation of targeted T cells at the tumor with maximum intensity projection of micro-CT scans (i) before T cell injection, (ii) 24 h, (iii) 48 h, and (iv) 72 h post injection (circles demarcate the T cell accumulation). Adapted with permission from ref. 198. Copyright 2015 American Chemical Society. (B) Schematic of principle of polarized bispecific (pBiAb)-AuNPs in inducing cell-to-cell contact between HIV-expressing and NK cells; confocal micrographs of HIV-expressing cells (stained with PKH67 in green and DAPI nuclei staining in blue) and primary NK cells (DAPI nuclei staining). Both cell types were co-cultured at 1![[thin space (1/6-em)]](https://www.rsc.org/images/entities/char_2009.gif) :1 ratio for 20 min in the presence of the pBiAb-AuNPs. Scale bars represent 5 μm. Adapted with permission from ref. 201. Copyright 2021 Elsevier. :1 ratio for 20 min in the presence of the pBiAb-AuNPs. Scale bars represent 5 μm. Adapted with permission from ref. 201. Copyright 2021 Elsevier. | ||
Magnetic nanoparticles (MNPs) have also been used for in vivo tracking of immune cells for cell-based therapies and immunological research. There is an increased demand for multimodal imaging, and MNPs have been modified to include indocyanine green (ICG) to allow for both magnetic resonance (MR) and optical information to be obtained. The ‘ICGylation’ allowed for optical NIR fluorescence for in vivo and ex vivo imaging, as well as enabling the hydrophobic MNPs to phase transfer to aqueous media. Dendritic cells were successfully labeled with the ICGylated MNPs to allow for in vivo detection for over 3 days. Fluorescence imaging and in vivo MR imaging were in accordance, indicating the success of using ICGylated MNPs to track dendritic cells in vivo.202
Alongside the application of tracking immune cells, NPs have also been used to modify the immune response towards cancer to create more effective immunotherapies. AuNPs have been used to enhance the NK immune response towards HIV-infected T cells by increasing cell-to-cell contact, triggering a cytotoxic response against the infected cells (Fig. 8B).201 Researchers have additionally utilized the functionality of PD-1, which promotes self-tolerance by suppressing the inflammatory activity of T cells, to create a template magnetic peptide-imprinted poly(ethylene-co-vinyl alcohol) composite NPs (MPIP NPs). These MPIP NPs were found to significantly enhance the activity of NK cells towards hepatocellular cancer cells, indicating promising utilization for NPs in immunotherapy as NK checkpoint inhibitors.203
There is additional research supporting the functionality of phagocytosed NPs. The mononuclear phagocyte system uptakes and removes circulating NPs from the body, and typically, in vivo targeting NPs are engineered to avoid this immune response and increase circulation time. However, researchers used the immune system's natural uptake as an advantage when they created colloidal gold nanorods to actively target phagocytic macrophages that exhibit high intrinsic accumulation and infiltration into solid tumors, causing cytotoxicity in breast cancer cells.204
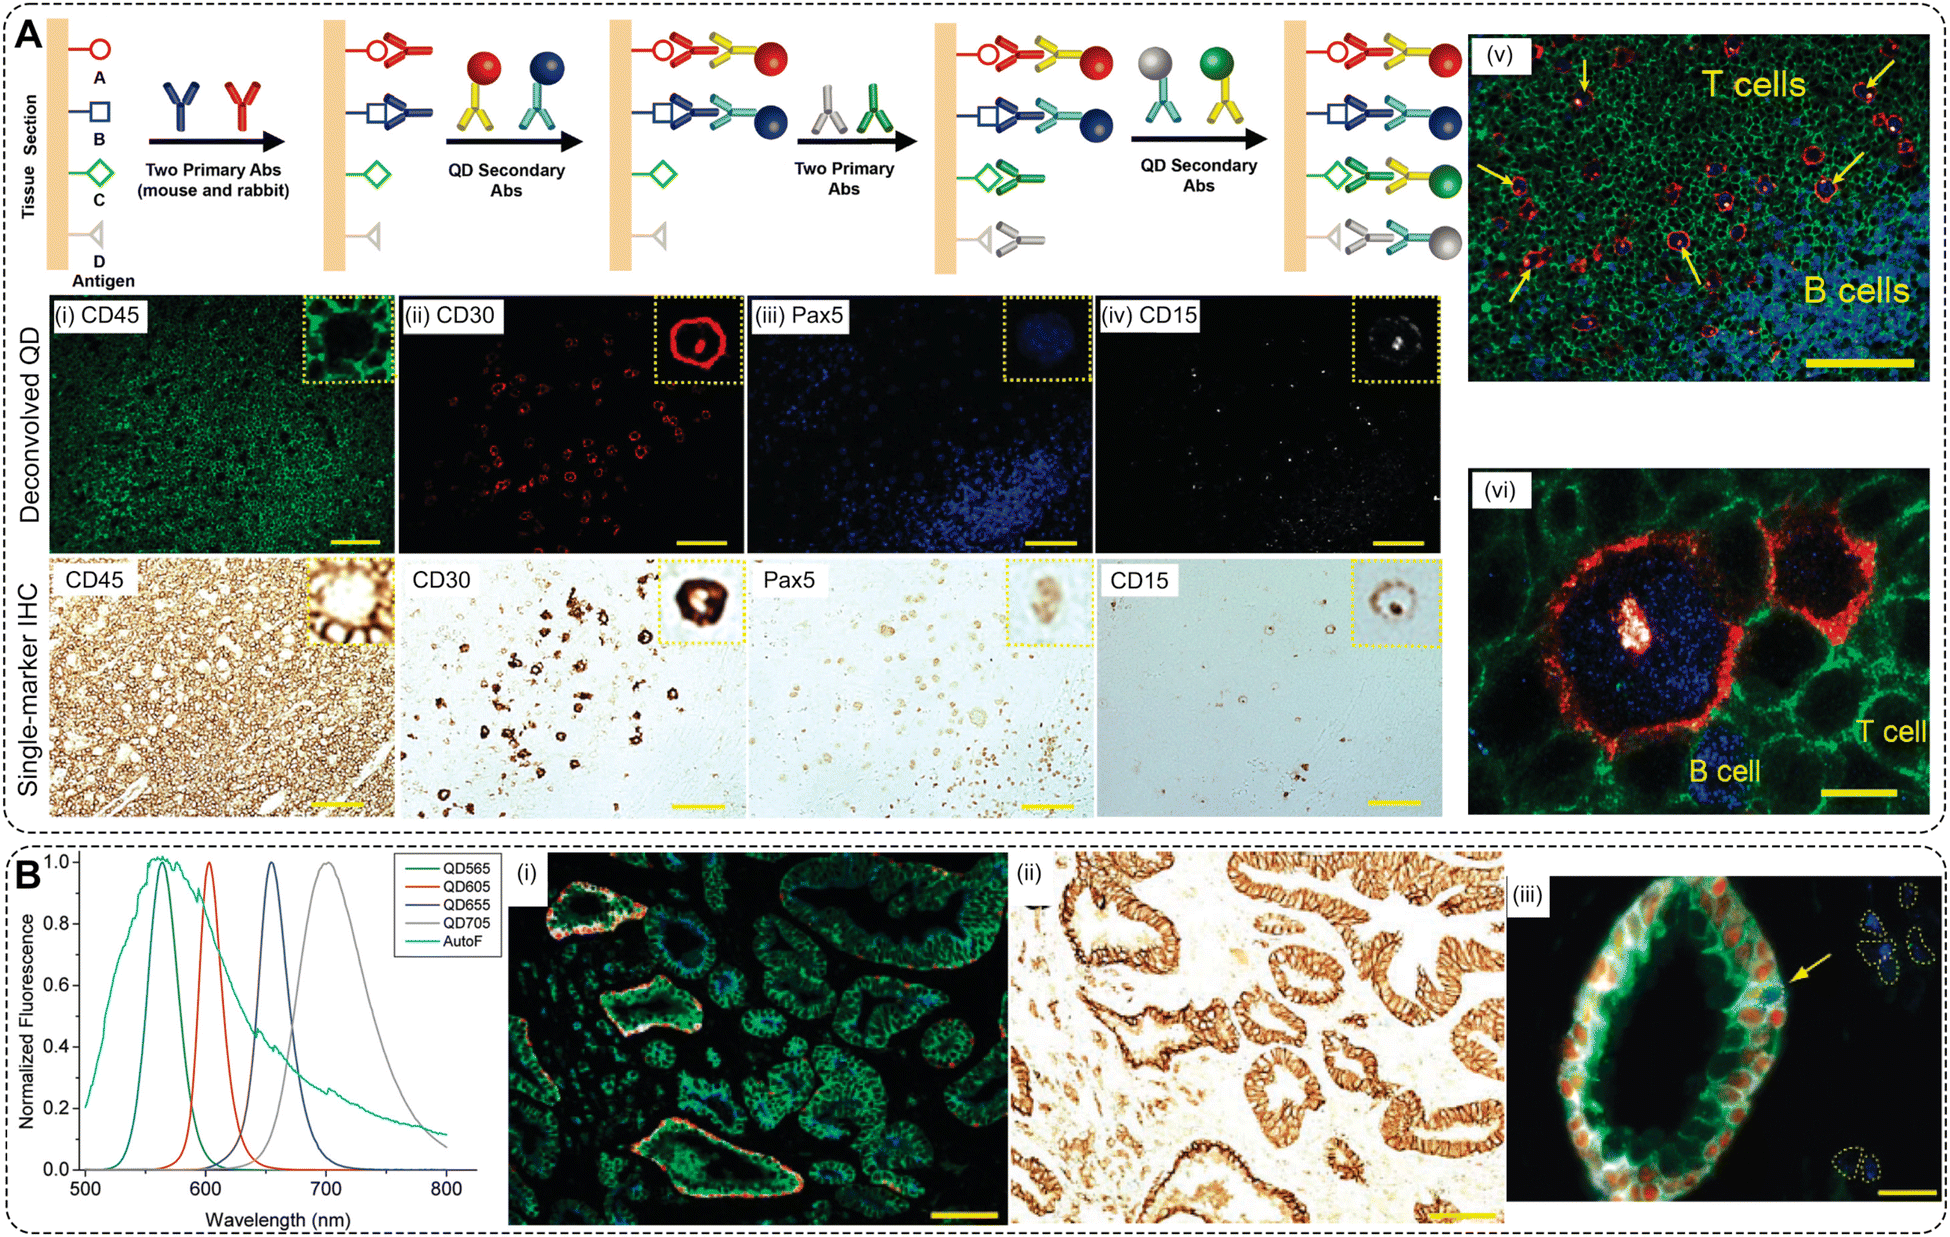 | ||
| Fig. 9 Multiplexed spatial profiling with QDs on FFPE human tissue sections. (A) Schematic illustration of multiplexed tissue staining with QDs. Two primary antibodies from two animal species (e.g., primary rabbit and mouse antibodies) are used to recognize two tissue antigens. After washing, a mixture of two secondary antibody–QD conjugates is applied to stain the two primary antibodies. The same procedure is repeated using primary antibodies for additional antigens, followed by the use of secondary antibody QD conjugates. Comparison of deconvolved QD images with conventional single-marker IHC using adjacent tissue sections of lymph node biopsies. The deconvolved QD images were obtained from multiplexed QD data by spectral imaging and separation. The single-marker IHC images were obtained from adjacent tissue sections following standard protocols. The protein biomarkers are (i) CD45, (ii) CD30, (iii) Pax5, and (iv) CD15. Scale bar: 100 μm. (v) Malignant HRS cells (red membrane, blue nuclear, and read/whitish Golgi) are identified by a unique multiplexed staining pattern of CD30 positive (membrane staining), CD15 positive (Golgi staining), Pax5 positive (nuclear staining), and CD45 negative. They are differentiated from infiltrating B cells (blue nuclear staining) and T cells (green membrane staining). A few prominent HRS cells are indicated with arrows. Scale bar: 100 μm. (vi) Detailed view showing the distinct staining patterns of HRS cells, B cells, and T cells. Scale bar: 10 μm. Adopted with permission from ref. 175. Copyright 2010 American Chemical Society. (B) QD emission spectra and tissue autofluorescence data used for color coding and spectral deconvolution. Four-biomarker multiplexed QD staining image (i) and single biomarker IHC staining for E-cadherin (ii) of adjacent prostate cancer tissue sections. The protein biomarkers in panels are E-cadherin (green), CK HMW (white), p63 (red), and AMACR (blue). Scale bars: 100 μm. (iii) Identification of single malignant tumor cells in a predominantly benign prostate gland by QD multiplexed staining of four protein biomarkers. Scale bars: 20 μm. Adopted with permission from ref. 205. Copyright 2010 American Chemical Society. | ||
4.6. Limitations and optimizations for use of nanoparticles for immune profiling
Despite the promising potential of NPs to offer enhanced sensitivity, multiplexing capabilities, and imaging contrast, several design elements need careful consideration and further optimization before they can be implemented clinically. Firstly, these elements include ensuring reproducible and cost-effective large-scale synthesis of NPs, maximizing sensitivity, addressing biocompatibility and toxicity concerns, and enabling effective delivery to their intended targets.206,207 To enable the clinical translation of NPs, researchers should consider mitigating NP fabrication complexity and carefully select the appropriate NP type for the intended clinical application.74,126 To achieve clinical approval for in vivo administration into humans, NPs must undergo comprehensive evaluations of their long-term biodistribution, degradability, clearance, and toxicity. For instance, while lipid-based and silica-based NPs have been shown to be biodegradable in the body, many inorganic NPs raise concerns about biocompatibility and stability, with some exceptions such as iron oxides and manganese oxides, which are generally considered reasonably biodegradable and biocompatible. QDs often contain heavy metals, such as cadmium and lead, which are highly toxic even at low concentrations. Therefore, QDs with biocompatible coatings or those free of heavy metals, such as carbon-based QDs (CQDs)208 are being actively researched due to their higher potential for the clinical translation. AuNPs, for instance, are chemically inert; but their long-term health effects are still uncertain, especially since they have demonstrated prolonged retention in the liver and spleen.209,210 Therefore, recently, gold nanoclusters (AuNCs), which are ultrasmall clusters of a total diameter less than 2 nm, have emerged as promising agents for cancer diagnosis and treatment.211,212 Due to their small size, these AuNCs are rapidly cleared by the kidneys with minimal retention in the mononuclear phagocyte system organs, such as the liver and spleen. Consequently, renally clearable and biodegradable NP formulations are preferred for in-vivo imaging applications to avoid long-term toxicity concerns. Although non-biodegradable NPs are being further developed and assessed for their use in vivo, they can still provide valuable information about the immune system in ex vivo applications. As previously mentioned, there are several ways that NPs are cleverly being utilized to interrogate immune markers throughout various types of ex vivo human specimens (e.g., fresh tissue, histology sections, blood, etc.).175,187,2135. Conclusions and future directions
As demonstrated by this review, the field of immune profiling is ripe with opportunities to offer important insights to inform the development of new therapeutic approaches. Within the field of precision oncology, profiling the dynamic array of immune cells across an individual patient's tumor could aid in our understanding of the complex interactions taking place within the tumor microenvironment and lead to more effective personalized treatment options. The field currently lacks a non-destructive, multiplexed imaging approach that can rapidly interrogate multiple immune features simultaneously in a single imaging acquisition. Herein, we have summarized several advantageous characteristics that NPs possess to overcome these limitations and have highlighted key instances by which investigators have successfully utilized NPs to advance our understanding of the immune system.Despite the aforementioned well-characterized benefits of NPs for imaging applications, there remain opportunities to improve their utilization across various biomedical applications through further optimization and investigation. When considering NP fabrication techniques, simpler synthetic methods should be prioritized that result in reproducible and stable imaging characteristics. The ability of NPs to act as a consistent imaging beacon, with its own detectable barcode, is essential to enable multiplexed imaging. Their unprecedented multiplexing capabilities have, thus far, been underutilized in the field and offer an exciting opportunity to simultaneously profile a multitude of immune cells that reside within a tumor, using a single imaging acquisition.
The resulting NP batches should also exhibit a homogeneous size distribution and a surface suitable for chemical conjugation. The large surface area of NPs is advantageous for attaching multiple targeting ligands, which enables high specificity in binding to intended targets. One of the most important aspects for introducing NPs into immune profiling is achieving high targeting specificity. Therefore, distinctive attributes of NPs for enabling precise biotargeting need to be comprehensively analyzed. This insight is crucial to ensure the efficacy of actively targeted NPs within cellular environments and to maintain control over the fabrication and conjugation of NP-based contrast agents with biotargeting species. To address this challenge and facilitate translation of NPs into real-world biomedical applications, researchers need to focus on engineering NPs with reproducible, well-characterized, and carefully optimized parameters such as size distribution, charge, number of fluorescent dyes, length of cross-linkers, and density of functional groups and biotargeting species.213 The binding avidity and reproducibility of active targeting by NPs can be effectively assessed in flow cytometry experiments.213,214
To sum up, we envision a bright future for NPs to play an important role in immune profiling. NPs possess a multitude of untapped characteristics that make them an ideal imaging probe to unveil the complex cellular relationships that exist among immune cells within the TME. Their high sensitivity, multivalent binding, targeted delivery, biocompatibility, and multiplexing capability along with easy customizability open new horizons for profiling the immune system.
Author contributions
O. E. E., A. F., and C. Z. conceptualized the review. O. E. E., C. V., K. N. L., A. M., and A. F. wrote an original draft. O. E. E., A. F., and C. Z. reviewed and edited the manuscript. C. Z. supervised the work and acquired funding.Data availability
No primary research results, software or code have been included and no new data were generated or analysed as part of this review.Conflicts of interest
There are no conflicts to declare.Acknowledgements
Fig. 1 and 2 were created in Biorender.com. The work was funded in part by an NIH grant through NIBIB R01EB033918. O. E. E. gratefully acknowledges the support of Agilent Technologies through an Agilent Fellowship.References
- S. Ghosh-Choudhary, J. Liu and T. Finkel, Trends Cell Biol., 2020, 30, 201–212 CrossRef CAS PubMed.
- A. P. Bhatt, M. R. Redinbo and S. J. Bultman, CA Cancer J. Clin., 2017, 67, 326–344 CrossRef.
- A. Liston, S. Humblet-Baron, D. Duffy and A. Goris, Nat. Immunol., 2021, 22, 1479–1489 CrossRef CAS PubMed.
- S. Delhalle, S. F. N. Bode, R. Balling, M. Ollert and F. Q. He, NPJ Syst. Biol. Appl., 2018, 4, 9 CrossRef PubMed.
- R. Ewaisha, G. Panicker, P. Maranian, E. R. Unger and K. S. Anderson, Theranostics, 2017, 7, 3814–3823 CrossRef CAS PubMed.
- S. N. Shishido, O. Hart, S. Jeong, A. Moriarty, D. Heeke, J. Rossi, A. Bot and P. Kuhn, J. Immunother. Cancer, 2024, 12, e007329 CrossRef.
- Y. C. Dong, L. M. Nieves, J. C. Hsu, A. Kumar, M. Bouché, U. Krishnan, K. J. Mossburg, D. Saxena, S. Uman, T. Kambayashi, J. A. Burdick, M. M. Kim, J. F. Dorsey and D. P. Cormode, Chem. Mater., 2023, 35, 9542–9551 CrossRef CAS PubMed.
- C. L. Szanto, A. M. Cornel, S. V. Vijver and S. Nierkens, Cancers, 2020, 12, 519 CrossRef CAS.
- C. Wang, J. Gong, T. Y. Tu, P. P. Lee and M. Fakih, J. Gastrointest. Oncol., 2018, 9, 404–415 CrossRef PubMed.
- J. W. Hickey, E. K. Neumann, A. J. Radtke, J. M. Camarillo, R. T. Beuschel, A. Albanese, E. McDonough, J. Hatler, A. E. Wiblin, J. Fisher, J. Croteau, E. C. Small, A. Sood, R. M. Caprioli, R. M. Angelo, G. P. Nolan, K. Chung, S. M. Hewitt, R. N. Germain, J. M. Spraggins, E. Lundberg, M. P. Snyder, N. L. Kelleher and S. K. Saka, Nat. Methods, 2022, 19, 284–295 CrossRef CAS.
- S. Chuah and V. Chew, J. Immunother. Cancer, 2020, 8, e000363 CrossRef.
- V. Chew, L. Lai, L. Pan, C. J. Lim, J. Li, R. Ong, C. Chua, J. Y. Leong, K. H. Lim, H. C. Toh, S. Y. Lee, C. Y. Chan, B. K. P. Goh, A. Chung, P. K. H. Chow and S. Albani, Proc. Natl. Acad. Sci. U. S. A., 2017, 114, E5900–E5909 CrossRef CAS.
- S. Chevrier, J. H. Levine, V. R. T. Zanotelli, K. Silina, D. Schulz, M. Bacac, C. H. Ries, L. Ailles, M. A. S. Jewett, H. Moch, M. van den Broek, C. Beisel, M. B. Stadler, C. Gedye, B. Reis, D. Pe’er and B. Bodenmiller, Cell, 2017, 169, 736–749.e18 CrossRef CAS PubMed.
- Y. Lavin, S. Kobayashi, A. Leader, E. D. Amir, N. Elefant, C. Bigenwald, R. Remark, R. Sweeney, C. D. Becker, J. H. Levine, K. Meinhof, A. Chow, S. Kim-Shulze, A. Wolf, C. Medaglia, H. Li, J. A. Rytlewski, R. O. Emerson, A. Solovyov, B. D. Greenbaum, C. Sanders, M. Vignali, M. B. Beasley, R. Flores, S. Gnjatic, D. Pe’er, A. Rahman, I. Amit and M. Merad, Cell, 2017, 169, 750–765.e17 CrossRef CAS PubMed.
- L. Zhang, X. Yu, L. Zheng, Y. Zhang, Y. Li, Q. Fang, R. Gao, B. Kang, Q. Zhang, J. Y. Huang, H. Konno, X. Guo, Y. Ye, S. Gao, S. Wang, X. Hu, X. Ren, Z. Shen, W. Ouyang and Z. Zhang, Nature, 2018, 564, 268–272 CrossRef CAS.
- L. M. Kato, S. Kawamoto, M. Maruya and S. Fagarasan, Immunol. Rev., 2014, 260, 67–75 CrossRef CAS PubMed.
- R. Dantzer, Physiol. Rev., 2018, 98, 477–504 CrossRef CAS PubMed.
- L. Müller, M. Andrée, W. Moskorz, I. Drexler, L. Walotka, R. Grothmann, J. Ptok, J. Hillebrandt, A. Ritchie, D. Rabl, P. N. Ostermann, R. Robitzsch, S. Hauka, A. Walker, C. Menne, R. Grutza, J. Timm, O. Adams and H. Schaal, Clin. Infect. Dis., 2021, 73, 2065–2072 CrossRef.
- P. Roy, M. Orecchioni and K. Ley, Nat. Rev. Immunol., 2022, 22, 251–265 CrossRef CAS.
- F. P. de Heredia, S. Gómez-Martínez and A. Marcos, Proc. Nutr. Soc., 2012, 71, 332–338 CrossRef CAS PubMed.
- L. Liu, C. W. Yoon, Z. Yuan, T. Guo, Y. Qu, P. He, X. Yu, Z. Zhu, P. Limsakul and Y. Wang, Adv. Drug Delivery Rev., 2023, 203, 115135 CrossRef CAS.
- W. Li, Y. Jiang and J. Lu, Int. J. Pharm., 2023, 634, 122655 CrossRef CAS.
- C. Foray, C. Barca, P. Backhaus, S. Schelhaas, A. Winkeler, T. Viel, M. Schäfers, O. Grauer, A. H. Jacobs and B. Zinnhardt, Adv. Exp. Med. Biol., 2020, 1225, 71–87 CrossRef CAS.
- J. Nikolich-Žugich, Nat. Immunol., 2018, 19, 10–19 CrossRef.
- S. Raychaudhuri and R. M. Gupta, Nat. Med., 2019, 25, 362–364 CrossRef CAS PubMed.
- A. Alpert, Y. Pickman, M. Leipold, Y. Rosenberg-Hasson, X. Ji, R. Gaujoux, H. Rabani, E. Starosvetsky, K. Kveler, S. Schaffert, D. Furman, O. Caspi, U. Rosenschein, P. Khatri, C. L. Dekker, H. T. Maecker, M. M. Davis and S. S. Shen-Orr, Nat. Med., 2019, 25, 487–495 CrossRef CAS PubMed.
- C. Zheng, L. Zheng, J. K. Yoo, H. Guo, Y. Zhang, X. Guo, B. Kang, R. Hu, J. Y. Huang, Q. Zhang, Z. Liu, M. Dong, X. Hu, W. Ouyang, J. Peng and Z. Zhang, Cell, 2017, 169, 1342–1356 CrossRef CAS PubMed.
- S. C. Wei, C. R. Duffy and J. P. Allison, Cancer Discov., 2018, 8, 1069–1086 CrossRef PubMed.
- J. F. Vermeulen, W. Van Hecke, E. J. M. Adriaansen, M. K. Jansen, R. G. Bouma, J. Villacorta Hidalgo, P. Fisch, R. Broekhuizen, W. G. M. Spliet, M. Kool and N. Bovenschen, Oncoimmunology, 2018, 7, e1398877 CrossRef.
- A. M. van der Leun, D. S. Thommen and T. N. Schumacher, Nat. Rev. Cancer, 2020, 20, 218–232 CrossRef CAS PubMed.
- D. J. Byun, J. D. Wolchok, L. M. Rosenberg and M. Girotra, Nat. Rev. Endocrinol., 2017, 13, 195–207 CrossRef CAS.
- A. Bassez, H. Vos, L. Van Dyck, G. Floris, I. Arijs, C. Desmedt, B. Boeckx, M. Vanden Bempt, I. Nevelsteen, K. Lambein, K. Punie, P. Neven, A. D. Garg, H. Wildiers, J. Qian, A. Smeets and D. Lambrechts, Nat. Med., 2021, 27, 820–832 CrossRef CAS.
- D. Phillips, M. Matusiak, B. R. Gutierrez, S. S. Bhate, G. L. Barlow, S. Jiang, J. Demeter, K. S. Smythe, R. H. Pierce, S. P. Fling, N. Ramchurren, M. A. Cheever, Y. Goltsev, R. B. West, M. S. Khodadoust, Y. H. Kim, C. M. Schürch and G. P. Nolan, Nat. Commun., 2021, 12, 6726 CrossRef CAS.
- N. Trac, Z. Chen, H. S. Oh, L. Jones, Y. Huang, J. Giblin, M. Gross, N. S. Sta Maria, R. E. Jacobs and E. J. Chung, ACS Nano, 2024, 18, 2091–2104 CrossRef CAS PubMed.
- J. Galon, B. Mlecnik, G. Bindea, H. K. Angell, A. Berger, C. Lagorce, A. Lugli, I. Zlobec, A. Hartmann, C. Bifulco, I. D. Nagtegaal, R. Palmqvist, G. V. Masucci, G. Botti, F. Tatangelo, P. Delrio, M. Maio, L. Laghi, F. Grizzi, M. Asslaber, C. D’Arrigo, F. Vidal-Vanaclocha, E. Zavadova, L. Chouchane, P. S. Ohashi, S. Hafezi-Bakhtiari, B. G. Wouters, M. Roehrl, L. Nguyen, Y. Kawakami, S. Hazama, K. Okuno, S. Ogino, P. Gibbs, P. Waring, N. Sato, T. Torigoe, K. Itoh, P. S. Patel, S. N. Shukla, Y. Wang, S. Kopetz, F. A. Sinicrope, V. Scripcariu, P. A. Ascierto, F. M. Marincola, B. A. Fox and F. Pagès, J. Pathol., 2014, 232, 199–209 CrossRef CAS PubMed.
- J. Galon, B. Mlecnik, F. Marliot, F.-S. Ou, C. B. Bifulco, A. Lugli, I. Zlobec, T. T. Rau, A. Hartmann, G. V. Masucci, E. Zavadova, P. Ohashi, M. H. A. Roehrl, Y. Kawakami, T. Torigoe, P. A. Ascierto, F. Marincola, D. J. Sargent, B. A. Fox and F. Pages, J. Clin. Oncol., 2016, 34, suppl.3500 Search PubMed.
- F. Pagès, B. Mlecnik, F. Marliot, G. Bindea, F. S. Ou, C. Bifulco, A. Lugli, I. Zlobec, T. T. Rau, M. D. Berger, I. D. Nagtegaal, E. Vink-Börger, A. Hartmann, C. Geppert, J. Kolwelter, S. Merkel, R. Grützmann, M. Van den Eynde, A. Jouret-Mourin, A. Kartheuser, D. Léonard, C. Remue, J. Y. Wang, P. Bavi, M. H. A. Roehrl, P. S. Ohashi, L. T. Nguyen, S. Han, H. L. MacGregor, S. Hafezi-Bakhtiari, B. G. Wouters, G. V. Masucci, E. K. Andersson, E. Zavadova, M. Vocka, J. Spacek, L. Petruzelka, B. Konopasek, P. Dundr, H. Skalova, K. Nemejcova, G. Botti, F. Tatangelo, P. Delrio, G. Ciliberto, M. Maio, L. Laghi, F. Grizzi, T. Fredriksen, B. Buttard, M. Angelova, A. Vasaturo, P. Maby, S. E. Church, H. K. Angell, L. Lafontaine, D. Bruni, C. El Sissy, N. Haicheur, A. Kirilovsky, A. Berger, C. Lagorce, J. P. Meyers, C. Paustian, Z. Feng, C. Ballesteros-Merino, J. Dijkstra, C. van de Water, S. van Lent-van Vliet, N. Knijn, A. M. Muşină, D. V. Scripcariu, B. Popivanova, M. Xu, T. Fujita, S. Hazama, N. Suzuki, H. Nagano, K. Okuno, T. Torigoe, N. Sato, T. Furuhata, I. Takemasa, K. Itoh, P. S. Patel, H. H. Vora, B. Shah, J. B. Patel, K. N. Rajvik, S. J. Pandya, S. N. Shukla, Y. Wang, G. Zhang, Y. Kawakami, F. M. Marincola, P. A. Ascierto, D. J. Sargent, B. A. Fox and J. Galon, Lancet, 2018, 391, 2128–2139 CrossRef.
- I. P. Nearchou, K. Lillard, C. G. Gavriel, H. Ueno, D. J. Harrison and P. D. Caie, Cancer Immunol. Res., 2019, 7, 609–620 CrossRef CAS PubMed.
- I. P. Nearchou, B. M. Gwyther, E. C. T. Georgiakakis, C. G. Gavriel, K. Lillard, Y. Kajiwara, H. Ueno, D. J. Harrison and P. D. Caie, NPJ Digit. Med., 2020, 3, 71 CrossRef.
- M. G. Anitei, G. Zeitoun, B. Mlecnik, F. Marliot, N. Haicheur, A. M. Todosi, A. Kirilovsky, C. Lagorce, G. Bindea, D. Ferariu, M. Danciu, P. Bruneval, V. Scripcariu, J. M. Chevallier, F. Zinzindohouè, A. Berger, J. Galon and F. Pagès, Clin. Cancer Res., 2014, 20, 1891–1899 CrossRef PubMed.
- S. Fattori, L. Gorvel, S. Granjeaud, P. Rochigneux, M. S. Rouvière, A. Ben Amara, N. Boucherit, M. Paul, M. M. Dauplat, J. Thomassin-Piana, M. Paciencia-Gros, M. Avenin, J. Pakradouni, J. Barrou, E. Charafe-Jauffret, G. Houvenaeghel, E. Lambaudie, F. Bertucci, A. Goncalves, C. Tarpin, J. A. Nunes, R. Devillier, A. S. Chretien and D. Olive, Cancers, 2021, 13, 441 CrossRef CAS PubMed.
- Q. Wu and S. D. Finley, Curr. Opin. Syst. Biol., 2019, 17, 15–23 CrossRef.
- A. A. Elashi, V. Sasidharan Nair, R. Z. Taha, H. Shaath and E. Elkord, Oncoimmunology, 2019, 8, e1542918 CrossRef PubMed.
- R. A. Leon-Ferre, K. McGrath, V. J. Suman, J. M. Carter, K. R. Kalari, R. M. Weinshilboum, L. Wang, J. N. Ingle, K. L. Knutson, S. M. Ansell, J. C. Boughey, J. C. Villasboas and M. P. Goetz, J. Clin. Oncol., 2020, 38, suppl.592 Search PubMed.
- M. Donini, S. Buti, S. Lazzarelli, R. Bozzetti, L. Rivoltini, C. Camisaschi, C. Castelli, A. Bearz, C. Simonelli, G. Lo Re, R. Mattioli, C. Caminiti, R. Passalacqua and GOIRC (Italian Oncology Group for Clinical Research), Target. Oncol., 2015, 10, 277–286 CrossRef CAS PubMed.
- J. Choi, H. G. Maeng, S. J. Lee, Y. J. Kim, D. W. Kim, H. N. Lee, J. H. Namgung, H. M. Oh, T. J. Kim, J. E. Jeong, S. J. Park, Y. M. Choi, Y. W. Kang, S. G. Yoon and J. K. Lee, Ann. Surg. Treat. Res., 2018, 94, 312–321 CrossRef CAS.
- J. Ptacek, D. Locke, R. Finck, M. E. Cvijic, Z. Li, J. G. Tarolli, M. Aksoy, Y. Sigal, Y. Zhang, M. Newgren and J. Finn, Lab. Invest., 2020, 100, 1111–1123 CrossRef CAS.
- A. L. Tarca, R. Romero and S. Draghici, Am. J. Obstet. Gynecol., 2006, 195, 373–388 CrossRef CAS.
- Y. C. Wu, M. Kissner and F. Momen-Heravi, J. Immunol. Methods, 2023, 515, 113444 CrossRef CAS PubMed.
- B. Hu, M. Sajid, R. Lv, L. Liu and C. Sun, Front. Immunol., 2022, 13, 996721 CrossRef CAS PubMed.
- N. Jhaveri, B. Ben Cheikh, N. Nikulina, N. Ma, D. Klymyshyn, J. DeRosa, R. Mihani, A. Pratapa, Y. Kassim, S. Bommakanti, O. Shang, S. Berry, N. Ihley, M. McLane, Y. He, Y. Zheng, J. Monkman, C. Cooper, K. O'Byrne, B. Anand, M. Prater, S. Basu, B. G. M. Hughes, A. Kulasinghe and O. Braubach, GEN Biotechnol., 2023, 2, 418–434 CrossRef CAS.
- L. Vanhersecke, M. Brunet, J. P. Guégan, C. Rey, A. Bougouin, S. Cousin, S. L. Moulec, B. Besse, Y. Loriot, M. Larroquette, I. Soubeyran, M. Toulmonde, G. Roubaud, S. Pernot, M. Cabart, F. Chomy, C. Lefevre, K. Bourcier, M. Kind, I. Giglioli, C. Sautès-Fridman, V. Velasco, F. Courgeon, E. Oflazoglu, A. Savina, A. Marabelle, J. C. Soria, C. Bellera, C. Sofeu, A. Bessede, W. H. Fridman, F. L. Loarer and A. Italiano, Nat. Cancer, 2021, 2, 794–802 CrossRef CAS PubMed.
- C. R. Merritt, G. T. Ong, S. E. Church, K. Barker, P. Danaher, G. Geiss, M. Hoang, J. Jung, Y. Liang, J. McKay-Fleisch, K. Nguyen, Z. Norgaard, K. Sorg, I. Sprague, C. Warren, S. Warren, P. J. Webster, Z. Zhou, D. R. Zollinger, D. L. Dunaway, G. B. Mills and J. M. Beechem, Nat. Biotechnol., 2020, 38, 586–599 CrossRef CAS PubMed.
- A. Janesick, R. Shelansky, A. D. Gottscho, F. Wagner, S. R. Williams, M. Rouault, G. Beliakoff, C. A. Morrison, M. F. Oliveira, J. T. Sicherman, A. Kohlway, J. Abousoud, T. Y. Drennon, S. H. Mohabbat, 10x Development Teams and S. E. B. Taylor, Nat. Commun., 2023, 14, 8353 CrossRef CAS PubMed.
- S. Jarosch, J. Köhlen, R. S. J. Sarker, K. Steiger, K. P. Janssen, A. Christians, C. Hennig, E. Holler, E. D’Ippolito and D. H. Busch, Cell Rep. Methods, 2021, 1, 100104 CrossRef CAS.
- F. Rivest, D. Eroglu, B. Pelz, J. Kowal, A. Kehren, V. Navikas, M. G. Procopio, P. Bordignon, E. Pérès, M. Ammann, E. Dorel, S. Scalmazzi, L. Bruno, M. Ruegg, G. Campargue, G. Casqueiro, L. Arn, J. Fischer, S. Brajkovic, P. Joris, M. Cassano and D. Dupouy, Sci. Rep., 2023, 13, 16994 CrossRef CAS.
- L. Cords, S. Engler, M. Haberecker, J. H. Ruschoff, H. Moch, N. de Souza and B. Bodenmiller, Cancer Cell, 2024, 42, 396–412.e5 CrossRef CAS PubMed.
- A. Kinkhabwala, C. Herbel, J. Pankratz, D. A. Yushchenko, S. Rüberg, P. Praveen, S. Reiß, F. C. Rodriguez, D. Schäfer, J. Kollet, V. Dittmer, M. Martinez-Osuna, L. Minnerup, C. Reinhard, A. Dzionek, T. D. Rockel, S. Borbe, M. Büscher, J. Krieg, M. Nederlof, M. Jungblut, D. Eckardt, O. Hardt, C. Dose, E. Schumann, R. P. Peters, S. Miltenyi, J. Schmitz, W. Müller and A. Bosio, Sci. Rep., 2022, 12, 1911 CrossRef CAS.
- A. J. Nirmal, Z. Maliga, T. Vallius, B. Quattrochi, A. A. Chen, C. A. Jacobson, R. J. Pelletier, C. Yapp, R. Arias-Camison, Y. A. Chen, C. G. Lian, G. F. Murphy, S. Santagata and P. K. Sorger, Cancer Discovery, 2022, 12, 1518–1541 CrossRef CAS.
- E. Kaldjian, S. Larkin and T. George, J. Immunother. Cancer, 2023, 11, A106 Search PubMed.
- M. J. Gerdes, C. J. Sevinsky, A. Sood, S. Adak, M. O. Bello, A. Bordwell, A. Can, A. Corwin, S. Dinn, R. J. Filkins, D. Hollman, V. Kamath, S. Kaanumalle, K. Kenny, M. Larsen, M. Lazare, Q. Li, C. Lowes, C. C. McCulloch, E. McDonough, M. C. Montalto, Z. Pang, J. Rittscher, A. Santamaria-Pang, B. D. Sarachan, M. L. Seel, A. Seppo, K. Shaikh, Y. Sui, J. Zhang and F. Ginty, Proc. Natl. Acad. Sci. U. S. A., 2013, 110, 11982–11987 CrossRef CAS.
- E. A. Winkler, C. N. Kim, J. M. Ross, J. H. Garcia, E. Gil, I. Oh, L. Q. Chen, D. Wu, J. S. Catapano, K. Raygor, K. Narsinh, H. Kim, S. Weinsheimer, D. L. Cooke, B. P. Walcott, M. T. Lawton, N. Gupta, B. V. Zlokovic, E. F. Chang, A. A. Abla, D. A. Lim and T. J. Nowakowski, Science, 2022, 375, eabi7377 CrossRef CAS.
- E. P. Kaldjian, A. B. Ramirez, Y. Sun, D. E. Campton, J. L. Werbin, P. Varshavskaya, S. Quarre, T. George, A. Madan, C. A. Blau and R. Seubert, Cytometry A, 2018, 93, 1220–1225 CrossRef CAS.
- J. R. Lin, Y. A. Chen, D. Campton, J. Cooper, S. Coy, C. Yapp, J. B. Tefft, E. McCarty, K. L. Ligon, S. J. Rodig, S. Reese, T. George, S. Santagata and P. K. Sorger, Nat. Cancer, 2023, 4, 1036–1052 CrossRef CAS PubMed.
- G. Lu, M. A. Baertsch, J. W. Hickey, Y. Goltsev, A. J. Rech, L. Mani, E. Forgo, C. Kong, S. Jiang, G. P. Nolan and E. L. Rosenthal, Front. Immunol., 2022, 13, 981825 CrossRef CAS.
- S. Black, D. Phillips, J. W. Hickey, J. Kennedy-Darling, V. G. Venkataraaman, N. Samusik, Y. Goltsev, C. M. Schurch and G. P. Nolan, Nat. Protoc., 2021, 16, 3802–3835 CrossRef CAS.
- C. M. Schürch, S. S. Bhate, G. L. Barlow, D. J. Phillips, L. Noti, I. Zlobec, P. Chu, S. Black, J. Demeter, D. R. McIlwain, S. Kinoshita, N. Samusik, Y. Goltsev and G. P. Nolan, Cell, 2020, 183, 838 CrossRef PubMed.
- A. Sood, Y. Sui, E. McDonough, A. Santamaría-Pang, Y. Al-Kofahi, Z. Pang, P. B. Jahrling, J. H. Kuhn and F. Ginty, Viruses, 2020, 12, 787 CrossRef CAS PubMed.
- X. Stachtea, M. B. Loughrey, M. Salvucci, A. U. Lindner, S. Cho, E. McDonough, A. Sood, J. Graf, A. Santamaria-Pang, A. Corwin, P. Laurent-Puig, S. Dasgupta, J. Shia, J. R. Owens, S. Abate, S. Van Schaeybroeck, M. Lawler, J. H. M. Prehn, F. Ginty and D. B. Longley, Mod. Pathol., 2022, 35, 564–576 CrossRef CAS PubMed.
- L. Cords, S. Engler, M. Haberecker, J. H. Rüschoff, H. Moch, N. de Souza and B. Bodenmiller, Cancer Cell, 2024, 42, 396–412.e5 CrossRef CAS.
- F. van Maldegem, K. Valand, M. Cole, H. Patel, M. Angelova, S. Rana, E. Colliver, K. Enfield, N. Bah, G. Kelly, V. S. K. Tsang, E. Mugarza, C. Moore, P. Hobson, D. Levi, M. Molina-Arcas, C. Swanton and J. Downward, Nat. Commun., 2021, 12, 5906 CrossRef CAS PubMed.
- R. Aebersold and M. Mann, Nature, 2016, 537, 347–355 CrossRef CAS.
- A. Haleem, M. Javaid, R. P. Singh, S. Rab and R. Suman, Global Health J., 2023, 7, 70–77 CrossRef.
- J. C. Hsu, Z. Tang, O. E. Eremina, A. M. Sofias, T. Lammers, J. F. Lovell, C. Zavaleta, W. Cai and D. P. Cormode, Nat. Rev. Methods Primers, 2023, 3, 30 CrossRef CAS PubMed.
- Z. Zhao, A. Ukidve, J. Kim and S. Mitragotri, Cell, 2020, 181, 151–167 CrossRef CAS.
- R. Bazak, M. Houri, S. El Achy, S. Kamel and T. Refaat, J. Cancer Res. Clin. Oncol., 2015, 141, 769–784 CrossRef CAS PubMed.
- J. D. Byrne, T. Betancourt and L. Brannon-Peppas, Adv. Drug Delivery Rev., 2008, 60, 1615–1626 CrossRef CAS PubMed.
- Y. Zhang, M. Li, X. Gao, Y. Chen and T. Liu, J. Hematol. Oncol., 2019, 12, 137 CrossRef PubMed.
- R. S. Kane, Langmuir, 2010, 26, 8636–8640 CrossRef CAS PubMed.
- S. Hong, P. R. Leroueil, I. J. Majoros, B. G. Orr, J. R. Baker, Jr. and M. M. Banaszak Holl, Chem. Biol., 2007, 14, 107–115 CrossRef CAS.
- M. Mammen, S.-K. Choi and G. M. Whitesides, Angew. Chem., Int. Ed., 1998, 37, 2754–2794 CrossRef.
- M. Jiao, A. S. Portniagin, X. Luo, L. Jing, B. Han and A. L. Rogach, Adv. Opt. Mater., 2022, 10, 2200226 CrossRef CAS.
- C. B. Murray, D. J. Norris and M. G. Bawendi, J. Am. Chem. Soc., 1993, 115, 8706–8715 CrossRef CAS.
- C. Li and P. Wu, Luminescence, 2019, 34, 782–789 CrossRef CAS.
- Y. Li, G. Bai, S. Zeng and J. Hao, ACS Appl. Mater. Interfaces, 2019, 11, 4737–4744 CrossRef CAS.
- Y. Zhang, H. Yang, X. An, Z. Wang, X. Yang, M. Yu, R. Zhang, Z. Sun and Q. Wang, Small, 2020, 16, 2001003 CrossRef CAS PubMed.
- M. Bruchez, Jr., M. Moronne, P. Gin, S. Weiss and A. P. Alivisatos, Science, 1998, 281, 2013–2016 CrossRef.
- W. C. Chan and S. Nie, Science, 1998, 281, 2016–2018 CrossRef CAS PubMed.
- I. L. Medintz, H. T. Uyeda, E. R. Goldman and H. Mattoussi, Nat. Mater., 2005, 4, 435–446 CrossRef CAS.
- E. Sweeney, T. H. Ward, N. Gray, C. Womack, G. Jayson, A. Hughes, C. Dive and R. Byers, Biochem. Biophys. Res. Commun., 2008, 374, 181–186 CrossRef CAS PubMed.
- M. Hu, C. Novo, A. Funston, H. Wang, H. Staleva, S. Zou, P. Mulvaney, Y. Xia and G. V. Hartland, J. Mater. Chem., 2008, 18, 1949–1960 RSC.
- H. Liu, X. Gao, C. Xu and D. Liu, Theranostics, 2022, 12, 1870–1903 CrossRef CAS.
- B. Mir-Simon, I. Reche-Perez, L. Guerrini, N. Pazos-Perez and R. A. Alvarez-Puebla, Chem. Mater., 2015, 27, 950–958 CrossRef CAS.
- O. E. Eremina, A. T. Czaja, A. Fernando, A. Aron, D. B. Eremin and C. Zavaleta, ACS Nano, 2022, 16, 10341–10353 CrossRef CAS PubMed.
- R. Pardehkhorram, F. Alshawawreh, V. R. Gonçales, N. A. Lee, R. D. Tilley and J. J. Gooding, Anal. Chem., 2021, 93, 12954–12965 CrossRef CAS PubMed.
- K.-Q. Lin, J. Yi, S. Hu, B.-J. Liu, J.-Y. Liu, X. Wang and B. Ren, J. Phys. Chem. C, 2016, 120, 20806–20813 CrossRef CAS.
- D. Jimenez de Aberasturi, A. B. Serrano-Montes, J. Langer, M. Henriksen-Lacey, W. J. Parak and L. M. Liz-Marzán, Chem. Mater., 2016, 28, 6779–6790 CrossRef CAS.
- C. Andreou, K. Plakas, N. Berisha, M. Gigoux, L. E. Rosch, R. Mirsafavi, A. Oseledchyk, S. Pal, D. Zamarin, T. Merghoub, M. R. Detty and M. F. Kircher, Nanoscale Horiz., 2022, 7, 1540–1552 RSC.
- B. Andreiuk, F. Nicolson, L. M. Clark, S. R. Panikkanvalappil, Kenry, M. Rashidian, S. Harmsen and M. F. Kircher, Nanotheranostics, 2022, 6, 10–30 CrossRef PubMed.
- J. Langer, D. Jimenez de Aberasturi, J. Aizpurua, R. A. Alvarez-Puebla, B. Auguié, J. J. Baumberg, G. C. Bazan, S. E. J. Bell, A. Boisen, A. G. Brolo, J. Choo, D. Cialla-May, V. Deckert, L. Fabris, K. Faulds, F. J. García de Abajo, R. Goodacre, D. Graham, A. J. Haes, C. L. Haynes, C. Huck, T. Itoh, M. Käll, J. Kneipp, N. A. Kotov, H. Kuang, E. C. Le Ru, H. K. Lee, J. F. Li, X. Y. Ling, S. A. Maier, T. Mayerhöfer, M. Moskovits, K. Murakoshi, J. M. Nam, S. Nie, Y. Ozaki, I. Pastoriza-Santos, J. Perez-Juste, J. Popp, A. Pucci, S. Reich, B. Ren, G. C. Schatz, T. Shegai, S. Schlücker, L. L. Tay, K. G. Thomas, Z. Q. Tian, R. P. Van Duyne, T. Vo-Dinh, Y. Wang, K. A. Willets, C. Xu, H. Xu, Y. Xu, Y. S. Yamamoto, B. Zhao and L. M. Liz-Marzán, ACS Nano, 2020, 14, 28–117 CrossRef CAS PubMed.
- J. Plou, P. S. Valera, I. García, C. D. L. de Albuquerque, A. Carracedo and L. M. Liz-Marzán, ACS Photonics, 2022, 9, 333–350 CrossRef CAS.
- G. Cutshaw, S. Uthaman, N. Hassan, S. Kothadiya, X. Wen and R. Bardhan, Chem. Rev., 2023, 123, 8297–8346 CrossRef CAS PubMed.
- U. S. Dinish, G. Balasundaram, Y. T. Chang and M. Olivo, Sci. Rep., 2014, 4, 4075 CrossRef CAS PubMed.
- R. M. Davis, J. L. Campbell, S. Burkitt, Z. Qiu, S. Kang, M. Mehraein, D. Miyasato, H. Salinas, J. T. C. Liu and C. Zavaleta, Nanomaterials, 2018, 8, 953 CrossRef.
- W. Duan, Q. Yue, Y. Liu, Y. Zhang, Q. Guo, C. Wang, S. Yin, D. Fan, W. Xu, J. Zhuang, J. Gong, X. Li, R. Huang, L. Chen, S. Aime, Z. Wang, J. Feng, Y. Mao, X. Y. Zhang and C. Li, Chem. Sci., 2020, 11, 4397–4402 RSC.
- L. Han, W. Duan, X. Li, C. Wang, Z. Jin, Y. Zhai, C. Cao, L. Chen, W. Xu, Y. Liu, Y. Y. Bi, J. Feng, Y. Mao, Q. Yue, X. Y. Zhang and C. Li, ACS Appl. Mater. Interfaces, 2019, 11, 15241–15250 CrossRef CAS.
- V. Neuschmelting, S. Harmsen, N. Beziere, H. Lockau, H. T. Hsu, R. Huang, D. Razansky, V. Ntziachristos and M. F. Kircher, Small, 2018, 14, e1800740 CrossRef.
- W. Zhu, K. Meng, Y. Zhang, Z. Bu, D. Zhao and G. Meng, Front. Chem., 2022, 9, 804981 CrossRef.
- J. H. Soh, H.-M. Chan and J. Y. Ying, Nano Today, 2020, 30, 100831 CrossRef CAS.
- R. Tanaka, T. Yuhi, N. Nagatani, T. Endo, K. Kerman, Y. Takamura and E. Tamiya, Anal. Bioanal. Chem., 2006, 385, 1414–1420 CrossRef CAS.
- Z. Wang, J. Zhao, X. Xu, L. Guo, L. Xu, M. Sun, S. Hu, H. Kuang, C. Xu and A. Li, Small Methods, 2022, 6, e2101143 CrossRef PubMed.
- C. Parolo, A. Sena-Torralba, J. F. Bergua, E. Calucho, C. Fuentes-Chust, L. Hu, L. Rivas, R. Álvarez-Diduk, E. P. Nguyen, S. Cinti, D. Quesada-González and A. Merkoçi, Nat. Protoc., 2020, 15, 3788–3816 CrossRef CAS PubMed.
- Y.-H. Jin, L. Cai, Z.-S. Cheng, H. Cheng, T. Deng, Y.-P. Fan, C. Fang, D. Huang, L.-Q. Huang, Q. Huang, Y. Han, B. Hu, F. Hu, B.-H. Li, Y.-R. Li, K. Liang, L.-K. Lin, L.-S. Luo, J. Ma, L.-L. Ma, Z.-Y. Peng, Y.-B. Pan, Z.-Y. Pan, X.-Q. Ren, H.-M. Sun, Y. Wang, Y.-Y. Wang, H. Weng, C.-J. Wei, D.-F. Wu, J. Xia, Y. Xiong, H.-B. Xu, X.-M. Yao, Y.-F. Yuan, T.-S. Ye, X.-C. Zhang, Y.-W. Zhang, Y.-G. Zhang, H.-M. Zhang, Y. Zhao, M.-J. Zhao, H. Zi, X.-T. Zeng, Y.-Y. Wang, X.-H. Wang and for the Zhongnan Hospital of Wuhan University Novel Coronavirus Management and Research Team, Evidence-Based Medicine Chapter of China International Exchange and Promotive Association for Medical and Health Care (CPAM), Mil. Med. Res., 2020, 7, 4 CAS.
- T. Ai, Z. Yang, H. Hou, C. Zhan, C. Chen, W. Lv, Q. Tao, Z. Sun and L. Xia, Radiology, 2020, 296, E32–E40 CrossRef PubMed.
- D. J. Bacich, K. M. Sobek, J. L. Cummings, A. A. Atwood and D. S. O'Keefe, BMC Res. Notes, 2011, 4, 457 CrossRef CAS.
- P. Winichakoon, R. Chaiwarith, C. Liwsrisakun, P. Salee, A. Goonna, A. Limsukon and Q. Kaewpoowat, J. Clin. Microbiol., 2020, 58, e00297–20 CrossRef CAS PubMed.
- C. Huang, T. Wen, F.-J. Shi, X.-Y. Zeng and Y.-J. Jiao, ACS Omega, 2020, 5, 12550–12556 CrossRef CAS.
- S. Cavalera, B. Colitti, S. Rosati, G. Ferrara, L. Bertolotti, C. Nogarol, C. Guiotto, C. Cagnazzo, M. Denina, F. Fagioli, F. Di Nardo, M. Chiarello, C. Baggiani and L. Anfossi, Talanta, 2021, 223, 121737 CrossRef CAS PubMed.
- X. Hu, C. Wu, B. Situ, P. Tian, T. An, Q. Li, W. Pan, R. Zhang, B. Yang, D. Sun, Y. Hu, Q. Wang and L. Zheng, Int. J. Nanomed., 2021, 16, 715–724 CrossRef.
- K.-F. Hung, C.-H. Hung, C. Hong, S.-C. Chen, Y.-C. Sun, J.-W. Wen, C.-H. Kuo, C.-H. Ko and C.-M. Cheng, Micromachines, 2021, 12, 321 CrossRef PubMed.
- Y. Wu, Y. Zhou, H. Huang, X. Chen, Y. Leng, W. Lai, X. Huang and Y. Xiong, Sens. Actuators, B, 2020, 316, 128107 CrossRef CAS.
- H.-M. Kim, C. Oh, J. An, S. Baek, S. Bock, J. Kim, H.-S. Jung, H. Song, J.-W. Kim, A. Jo, D.-E. Kim, W.-Y. Rho, J.-Y. Jang, G.-J. Cheon, H.-J. Im and B.-H. Jun, Nanomaterials, 2021, 11, 768 CrossRef CAS.
- D. Zhang, L. Huang, B. Liu, Q. Ge, J. Dong and X. Zhao, Theranostics, 2019, 9, 4849–4859 CrossRef CAS.
- H. R. Salinas, D. L. Miyasato, O. E. Eremina, R. Perez, K. L. Gonzalez, A. T. Czaja, S. Burkitt, A. Aron, A. Fernando, L. S. Ojeda, K. N. Larson, A. W. Mohamed, J. L. Campbell, B. A. Goins and C. Zavaleta, Biomater. Sci., 2021, 9, 482–495 RSC.
- E.-J. Go, H. Yang, W. Park, S. J. Lee, J.-H. Han, S. J. Kong, W. S. Lee, D. K. Han, H. J. Chon and C. Kim, Small, 2023, 19, 2300544 CrossRef CAS.
- D. L. Miyasato, A. W. Mohamed and C. Zavaleta, Wiley Interdiscip. Rev.: Nanomed. Nanobiotechnol., 2021, 13, e1721 CAS.
- On the market, Nat. Med., 1995, 1, 179–180 CrossRef.
- T. D. Lacoste, X. Michalet, F. Pinaud, D. S. Chemla, A. P. Alivisatos and S. Weiss, Proc. Natl. Acad. Sci. U. S. A., 2000, 97, 9461–9466 CrossRef CAS PubMed.
- E. G. Ehrhorn, P. Lovell, D. Svechkarev, S. Romanova and A. M. Mohs, Nanotechnology, 2024, 35, 305605 CrossRef.
- V. Gubala, G. Giovannini, F. Kunc, M. P. Monopoli and C. J. Moore, Cancer Nanotechnol., 2020, 11, 1 CrossRef CAS.
- L. Wang and W. Tan, Nano Lett., 2006, 6, 84–88 CrossRef CAS.
- G. Chapman and G. Patonay, J. Fluoresc., 2019, 29, 293–305 CrossRef CAS PubMed.
- X. Chen, M.-C. Estévez, Z. Zhu, Y.-F. Huang, Y. Chen, L. Wang and W. Tan, Anal. Chem., 2009, 81, 7009–7014 CrossRef CAS.
- M. Benezra, O. Penate-Medina, P. B. Zanzonico, D. Schaer, H. Ow, A. Burns, E. DeStanchina, V. Longo, E. Herz, S. Iyer, J. Wolchok, S. M. Larson, U. Wiesner and M. S. Bradbury, J. Clin. Invest., 2011, 121, 2768–2780 CrossRef CAS PubMed.
- H. Ow, D. R. Larson, M. Srivastava, B. A. Baird, W. W. Webb and U. Wiesner, Nano Lett., 2005, 5, 113–117 CrossRef CAS.
- H. Ow and U. Wiesner, US Pat., US20040101822A1, 2004.
- U. Wiesner, H. Ow, D. R. Larson and W. W. Webb, US Pat., US8298677B2, 2012.
- A. A. Burns, E. Herz, T. C. Zadayko and U. Wiesner, US Pat., US8084001B2, 2011.
- E. Phillips, O. Penate-Medina, P. B. Zanzonico, R. D. Carvajal, P. Mohan, Y. Ye, J. Humm, M. Gönen, H. Kalaigian, H. Schöder, H. W. Strauss, S. M. Larson, U. Wiesner and M. S. Bradbury, Sci. Transl. Med., 2014, 6, 260ra149 Search PubMed.
- K. Ma, C. Mendoza, M. Hanson, U. Werner-Zwanziger, J. Zwanziger and U. Wiesner, Chem. Mater., 2015, 27, 4119–4133 CrossRef CAS.
- A. M. Saeboe, A. Y. Nikiforov, R. Toufanian, J. C. Kays, M. Chern, J. P. Casas, K. Han, A. Piryatinski, D. Jones and A. M. Dennis, Nano Lett., 2021, 21, 3271–3279 CrossRef CAS.
- F. Wang and X. Liu, Acc. Chem. Res., 2014, 47, 1378–1385 CrossRef CAS PubMed.
- H. Dong, L.-D. Sun and C.-H. Yan, Chem. Soc. Rev., 2015, 44, 1608–1634 RSC.
- Y. Fan, P. Wang, Y. Lu, R. Wang, L. Zhou, X. Zheng, X. Li, J. A. Piper and F. Zhang, Nat. Nanotechnol., 2018, 13, 941–946 CrossRef CAS.
- H. Kobayashi, Y. Hama, Y. Koyama, T. Barrett, C. A. Regino, Y. Urano and P. L. Choyke, Nano Lett., 2007, 7, 1711–1716 CrossRef CAS PubMed.
- P. Zrazhevskiy and X. Gao, Nat. Commun., 2013, 4, 1619 CrossRef PubMed.
- S. Chan, M. Liu, K. Latham, M. Haruta, H. Kurata, T. Teranishi and Y. Tachibana, J. Mater. Chem. C, 2017, 5, 2182–2187 RSC.
- S. Pandey and D. Bodas, Adv. Colloid Interface Sci., 2020, 278, 102137 CrossRef CAS.
- M. Han, X. Gao, J. Z. Su and S. Nie, Nat. Biotechnol., 2001, 19, 631–635 CrossRef CAS.
- K. J. McHugh, L. Jing, A. M. Behrens, S. Jayawardena, W. Tang, M. Gao, R. Langer and A. Jaklenec, Adv. Mater., 2018, 30, e1706356 CrossRef.
- R. K. Singh, K. D. Patel, K. W. Leong and H.-W. Kim, ACS Appl. Mater. Interfaces, 2017, 9, 10309–10337 CrossRef CAS PubMed.
- C. Kirchner, T. Liedl, S. Kudera, T. Pellegrino, A. Munoz Javier, H. E. Gaub, S. Stölzle, N. Fertig and W. J. Parak, Nano Lett., 2005, 5, 331–338 CrossRef CAS.
- G. Chen, H. Qiu, P. N. Prasad and X. Chen, Chem. Rev., 2014, 114, 5161–5214 CrossRef CAS.
- R. P. Feazell, N. Nakayama-Ratchford, H. Dai and S. J. Lippard, J. Am. Chem. Soc., 2007, 129, 8438–8439 CrossRef CAS PubMed.
- Z. Chen, S. M. Tabakman, A. P. Goodwin, M. G. Kattah, D. Daranciang, X. Wang, G. Zhang, X. Li, Z. Liu, P. J. Utz, K. Jiang, S. Fan and H. Dai, Nat. Biotechnol., 2008, 26, 1285–1292 CrossRef CAS PubMed.
- K. Welsher, Z. Liu, D. Daranciang and H. Dai, Nano Lett., 2008, 8, 586–590 CrossRef CAS.
- P. Cherukuri, C. J. Gannon, T. K. Leeuw, H. K. Schmidt, R. E. Smalley, S. A. Curley and R. B. Weisman, Proc. Natl. Acad. Sci. U. S. A., 2006, 103, 18882–18886 CrossRef CAS.
- M. J. O'Connell, S. M. Bachilo, C. B. Huffman, V. C. Moore, M. S. Strano, E. H. Haroz, K. L. Rialon, P. J. Boul, W. H. Noon, C. Kittrell, J. Ma, R. H. Hauge, R. B. Weisman and R. E. Smalley, Science, 2002, 297, 593–596 CrossRef.
- A. M. Rao, E. Richter, S. Bandow, B. Chase, P. C. Eklund, K. A. Williams, S. Fang, K. R. Subbaswamy, M. Menon, A. Thess, R. E. Smalley, G. Dresselhaus and M. S. Dresselhaus, Science, 1997, 275, 187–191 CrossRef CAS.
- Z. Liu, S. Tabakman, S. Sherlock, X. Li, Z. Chen, K. Jiang, S. Fan and H. Dai, Nano Res., 2010, 3, 222–233 CrossRef CAS.
- Z. Liu, X. Li, S. M. Tabakman, K. Jiang, S. Fan and H. Dai, J. Am. Chem. Soc., 2008, 130, 13540–13541 CrossRef CAS PubMed.
- D. K. Agrohia, P. Wu, U. Huynh, S. Thayumanavan and R. W. Vachet, Anal. Chem., 2022, 94, 7901–7908 CrossRef CAS.
- Z. Zhao, C. Chen, S. Wei, H. Xiong, F. Hu, Y. Miao, T. Jin and W. Min, Nat. Commun., 2021, 12, 1305 CrossRef CAS PubMed.
- L. Wei, Z. Chen, L. Shi, R. Long, A. V. Anzalone, L. Zhang, F. Hu, R. Yuste, V. W. Cornish and W. Min, Nature, 2017, 544, 465–470 CrossRef CAS PubMed.
- F. Hu, C. Zeng, R. Long, Y. Miao, L. Wei, Q. Xu and W. Min, Nat. Methods, 2018, 15, 194–200 CrossRef CAS.
- Z. Chen, D. W. Paley, L. Wei, A. L. Weisman, R. A. Friesner, C. Nuckolls and W. Min, J. Am. Chem. Soc., 2014, 136, 8027–8033 CAS.
- F. Hu, S. D. Brucks, T. H. Lambert, L. M. Campos and W. Min, Chem. Commun., 2017, 53, 6187–6190 RSC.
- R. Nishiyama, K. Hiramatsu, S. Kawamura, K. Dodo, K. Furuya, J. G. de Pablo, S. Takizawa, W. Min, M. Sodeoka and K. Goda, Proc. Natl. Acad. Sci. U. S. A., 2023, 2, pgad001 Search PubMed.
- C. L. Zavaleta, M. F. Kircher and S. S. Gambhir, J. Nucl. Med., 2011, 52, 1839–1844 CrossRef CAS PubMed.
- M. Sánchez-Purrà, B. Roig-Solvas, C. Rodriguez-Quijada, B. M. Leonardo and K. Hamad-Schifferli, ACS Omega, 2018, 3, 10733–10742 CrossRef.
- O. E. Eremina, S. Schaefer, A. T. Czaja, S. Awad, M. A. Lim and C. Zavaleta, Analyst, 2023, 148, 5915–5925 RSC.
- O. E. Eremina, D. B. Eremin, A. Czaja and C. Zavaleta, J. Phys. Chem. Lett., 2021, 12, 5564–5570 CrossRef CAS.
- A. Czaja, S. Awad, O. E. Eremina, A. Fernando and C. Zavaleta, J. Raman Spectrosc., 2024, 55, 566–580 CrossRef CAS.
- F. T. Lee-Montiel, P. Li and P. I. Imoukhuede, Nanoscale, 2015, 7, 18504–18514 RSC.
- J. Liu, S. K. Lau, V. A. Varma, B. A. Kairdolf and S. Nie, Anal. Chem., 2010, 82, 6237–6243 CrossRef CAS PubMed.
- M. V. Yezhelyev, A. Al-Hajj, C. Morris, A. I. Marcus, T. Liu, M. Lewis, C. Cohen, P. Zrazhevskiy, J. W. Simons, A. Rogatko, S. Nie, X. Gao and R. M. O'Regan, Adv. Mater., 2007, 19, 3146–3151 CrossRef CAS.
- P. Z. McVeigh, R. J. Mallia, I. Veilleux and B. C. Wilson, J. Biomed. Opt., 2013, 18, 046011 CrossRef.
- R. J. Mallia, P. Z. McVeigh, C. J. Fisher, I. Veilleux and B. C. Wilson, Nanomedicine, 2015, 10, 89–101 CrossRef CAS PubMed.
- Y. W. Wang, N. P. Reder, S. Kang, A. K. Glaser, Q. Yang, M. A. Wall, S. H. Javid, S. M. Dintzis and J. T. C. Liu, Cancer Res., 2017, 77, 4506–4516 CrossRef CAS PubMed.
- Y. W. Wang, J. D. Doerksen, S. Kang, D. Walsh, Q. Yang, D. Hong and J. T. Liu, Small, 2016, 12, 5612–5621 CrossRef.
- C. L. Zavaleta, E. Garai, J. T. Liu, S. Sensarn, M. J. Mandella, D. Van de Sompel, S. Friedland, J. Van Dam, C. H. Contag and S. S. Gambhir, Proc. Natl. Acad. Sci. U. S. A., 2013, 110, E2288–E2297 CrossRef CAS PubMed.
- C. L. Zavaleta, B. R. Smith, I. Walton, W. Doering, G. Davis, B. Shojaei, M. J. Natan and S. S. Gambhir, Proc. Natl. Acad. Sci. U. S. A., 2009, 106, 13511–13516 CrossRef CAS.
- J. Li, F. Liu, X. Bi and J. Ye, Biomaterials, 2023, 302, 122327 CrossRef CAS PubMed.
- S. Modi, M. G. Swetha, D. Goswami, G. D. Gupta, S. Mayor and Y. Krishnan, Nat. Nanotechnol., 2009, 4, 325–330 CrossRef CAS PubMed.
- S. Healy, E. T. Henderson, S. Ke, J. Kelly, B. W. Simons, C. Hu, R. Ivkov and P. Korangath, Nanotheranostics, 2023, 7, 393–411 CrossRef PubMed.
- M. F. Kircher, A. de la Zerda, J. V. Jokerst, C. L. Zavaleta, P. J. Kempen, E. Mittra, K. Pitter, R. Huang, C. Campos, F. Habte, R. Sinclair, C. W. Brennan, I. K. Mellinghoff, E. C. Holland and S. S. Gambhir, Nat. Med., 2012, 18, 829–834 CrossRef CAS PubMed.
- A. Czaja, A. J. Jiang, M. Z. Blanco, O. E. Eremina and C. Zavaleta, npj Imaging, 2024, 2, 2 CrossRef.
- R. McRae, B. Lai, S. Vogt and C. J. Fahrni, J. Struct. Biol., 2006, 155, 22–29 CrossRef CAS PubMed.
- S. Corezzi, L. Urbanelli, P. Cloetens, C. Emiliani, L. Helfen, S. Bohic, F. Elisei and D. Fioretto, Anal. Biochem., 2009, 388, 33–39 CrossRef CAS PubMed.
- X. Wu, H. Liu, J. Liu, K. N. Haley, J. A. Treadway, J. P. Larson, N. Ge, F. Peale and M. P. Bruchez, Nat. Biotechnol., 2003, 21, 41–46 CrossRef CAS PubMed.
- E. Zahavy, E. Freeman, S. Lustig, A. Keysary and S. Yitzhaki, J. Fluoresc., 2005, 15, 661–665 CrossRef CAS.
- T. J. Fountaine, S. M. Wincovitch, D. H. Geho, S. H. Garfield and S. Pittaluga, Mod. Pathol., 2006, 19, 1181–1191 CrossRef CAS.
- H. Xu, J. Xu, X. Wang, D. Wu, Z. G. Chen and A. Y. Wang, ACS Appl. Mater. Interfaces, 2013, 5, 2901–2907 CrossRef CAS.
- X. P. Wang, Y. Zhang, M. Konig, E. Papadopoulou, B. Walkenfort, S. Kasimir-Bauer, A. Bankfalvi and S. Schlücker, Analyst, 2016, 141, 5113–5119 CAS.
- M. Salehi, L. Schneider, P. Ströbel, A. Marx, J. Packeisen and S. Schlücker, Nanoscale, 2014, 6, 2361–2367 RSC.
- B. R. Lutz, C. E. Dentinger, L. N. Nguyen, L. Sun, J. Zhang, A. N. Allen, S. Chan and B. S. Knudsen, ACS Nano, 2008, 2, 2306–2314 CrossRef CAS.
- J. Lee, K.-S. Yun, C. S. Choi, S.-H. Shin, H.-S. Ban, T. Rhim, S. K. Lee and K. Y. Lee, Bioconjugate Chem., 2012, 23, 1174–1180 CrossRef CAS.
- R. Meir, K. Shamalov, O. Betzer, M. Motiei, M. Horovitz-Fried, R. Yehuda, A. Popovtzer, R. Popovtzer and C. J. Cohen, ACS Nano, 2015, 9, 6363–6372 CrossRef CAS PubMed.
- M.-H. Lee, J. L. Thomas, M.-H. Ho, C. Yuan and H.-Y. Lin, ACS Appl. Mater. Interfaces, 2010, 2, 1729–1736 CrossRef CAS.
- Y. Yang, L. Guo, Z. Wang, P. Liu, X. Liu, J. Ding and W. Zhou, Biomaterials, 2021, 264, 120390 CrossRef CAS.
- A. Astorga-Gamaza, M. Vitali, M. L. Borrajo, R. Suárez-López, C. Jaime, N. Bastus, C. Serra-Peinado, L. Luque-Ballesteros, O. Blanch-Lombarte, J. G. Prado, J. Lorente, F. Pumarola, M. Pellicer, V. Falcó, M. Genescà, V. Puntes and M. J. Buzon, Nano Today, 2021, 36, 101056 CrossRef CAS.
- H. S. Park, J. Kim, M. Y. Cho, H. Lee, S. H. Nam, Y. D. Suh and K. S. Hong, Sci. Rep., 2017, 7, 8831 CrossRef.
- M.-H. Lee, J. L. Thomas, M.-H. Ho, C. Yuan and H.-Y. Lin, ACS Appl. Mater. Interfaces, 2010, 2, 1729–1736 CrossRef CAS.
- E. C. Dreaden, S. C. Mwakwari, L. A. Austin, M. J. Kieffer, A. K. Oyelere and M. A. El-Sayed, Small, 2012, 8, 2819–2822 CrossRef CAS PubMed.
- J. Liu, S. K. Lau, V. A. Varma, R. A. Moffitt, M. Caldwell, T. Liu, A. N. Young, J. A. Petros, A. O. Osunkoya, T. Krogstad, B. Leyland-Jones, M. D. Wang and S. Nie, ACS Nano, 2010, 4, 2755–2765 CAS.
- S. Wilhelm, A. J. Tavares, Q. Dai, S. Ohta, J. Audet, H. F. Dvorak and W. C. W. Chan, Nat. Rev. Mater, 2016, 1, 16014 CrossRef CAS.
- A. Dasgupta, A. M. Sofias, F. Kiessling and T. Lammers, Nat. Rev. Bioeng., 2024 DOI:10.1038/s44222-024-00203-3.
- L. Wang, W. Li, L. Yin, Y. Liu, H. Guo, J. Lai, Y. Han, G. Li, M. Li, J. Zhang, R. Vajtai, P. M. Ajayan and M. Wu, Sci. Adv., 2020, 6, eabb6772 CrossRef CAS PubMed.
- A. S. Thakor, R. Paulmurugan, P. Kempen, C. Zavaleta, R. Sinclair, T. F. Massoud and S. S. Gambhir, Small, 2011, 7, 126–136 CAS.
- J. L. Campbell, E. D. SoRelle, O. Ilovich, O. Liba, M. L. James, Z. Qiu, V. Perez, C. T. Chan, A. de la Zerda and C. Zavaleta, Biomaterials, 2017, 135, 42–52 CrossRef CAS.
- D. Luo, X. Wang, S. Zeng, G. Ramamurthy, C. Burda and J. P. Basilion, Small, 2019, 15, e1900968 CrossRef PubMed.
- J. H. Yu, M. S. Jeong, E. O. Cruz, I. S. Alam, S. K. Tumbale, A. Zlitni, S. Y. Lee, Y. I. Park, K. Ferrara, S. H. Kwon, S. S. Gambhir and J. Rao, ACS Nano, 2023, 17, 2554–2567 CAS.
- P. Bagheri, O. E. Eremina, A. Fernando, M. Kamal, I. Stegis, C. Vazquez, S. N. Shishido, P. Kuhn and C. Zavaleta, ACS Appl. Mater. Interfaces, 2024, 16, 15847–15860 CrossRef CAS.
- Y. W. Wang, S. Kang, A. Khan, P. Q. Bao and J. T. Liu, Biomed. Opt. Express, 2015, 6, 3714–3723 CrossRef CAS PubMed.
| This journal is © The Royal Society of Chemistry 2024 |