
 Open Access Article
 This Open Access Article is licensed under a Creative Commons Attribution-Non Commercial 3.0 Unported Licence
Crystallization-induced emission from F-doped carbon dots†
Tingxuan
Guo‡
a,
Gaixia
Yang‡
a,
Yan
Li
 *a,
Can
Liu
a,
Fulin
Yang
a,
Defa
Hou
a,
Hao
Sun
a,
Yunwu
Zheng
a,
Xu
Lin
*a and
Lanxiang
Liu
*b
*a,
Can
Liu
a,
Fulin
Yang
a,
Defa
Hou
a,
Hao
Sun
a,
Yunwu
Zheng
a,
Xu
Lin
*a and
Lanxiang
Liu
*b
aNational Joint Engineering Research Center for Highly-Efficient Utilization Technology of Forestry Resources, Southwest Forestry University, 300 Bailong Road, Kunming 650224, Yunnan, China
bInstitute of Highland Forest Science, Chinese Academy of Forestry, National Forestry and Grassland Administration, Kunming 650233, China
First published on 27th March 2024
Abstract
Herein, F-doped CDs with bright red SSF were synthesized by a solvothermal method using trifluoroethanol as the solvent and m-hydroxybenzaldehyde as the carbon source. Strong F–F interactions are vital for inducing crystallization, and solid luminescence is achieved by blocking the nonradiative energy dissipation pathways of crystalline organizations.
Carbon dots (CDs),1,2 due to their excellent optical properties, low toxicity, good biocompatibility, environmental friendliness, and ease of preparation, have shown promise in various fields.3–5 However, high-performing CDs often suffer from severe aggregation-driven quenching (ACQ) in the solid state due to the predominance of nonradiative energy dissipation pathways, which limits their commercial applicability.6,7 In recent years, researchers have used various strategies to circumvent ACQ caused by fluorescence resonance energy transfer (FRET) and direct π–π interactions between fluorescence sources.8–12 The main methods include dispersing CDs into other matrix materials to form composite materials, introducing long-chain alkyl groups to increase steric hindrance, and regulating surface functional group structures and aggregate-induced emission.13–17 Among these methods, crystallization-induced emission (CIE) is an important method for avoiding fluorescence quenching.18 The CIE properties arise due to intermolecular interactions in the crystal structure that result in locking of the ground state molecular geometry and blocking relaxation from the excited state.19,20 To achieve CIE, additional strong interactions, such as hydrogen bonding, must be introduced into carbon dots to increase crystallinity.21,22 However, as electron acceptors, hydrogen bonding moieties often affect excited-state electrons, affecting efficiency.23
The replacement of hydrogen with fluorine leads to changes in the physical and chemical properties of compounds. It has been proven that the fluorination of alkyl groups in proteins affects protein folding through F⋯F interactions.24 In addition, fluorination of an organic compound can significantly enhance intermolecular interactions and crystal stability.25 Although F⋯F interactions are considered weak and are weaker than hydrogen bonding interactions, they play an important role in molecular assembly and crystal engineering.26 Due to the strong electronegativity of F atoms and the highly polarized nature of C–F bonds, F doping has become an effective strategy for inducing solid-state fluorescence (SSF) by adjusting the surface electronic state and interactions of CDs.27,28 Unfortunately, all the reported F-doped SSF carbon dots exhibit varying degrees of ACQ, resulting in lower fluorescence efficiency in the solid state, although they exhibit bright fluorescence in the solution state.29–33
Herein, we report the synthesis of a novel kind of red-emissive SSF-CD (λem = 640 nm) that is prepared by F-doping via a facile solvothermal approach (Fig. 1). The prepared F-CDs exhibit crystallinity, and their red fluorescence efficiency in the solid state is similar to that in solution. However, a control sample without F-doping (H-CDs) shows no SSF. The XRD results show that F-doping leads to the formation of crystal structures in F-CDs, and this crystal conformation prevents compact π–π packing. The strong interactions between F atoms in the F-CDs allowed for the preparation of white LEDs by room-temperature pressing. The results of this study expand on the synthesis strategies available to prepare controlled SSF CDs, which is very important in this emerging field.
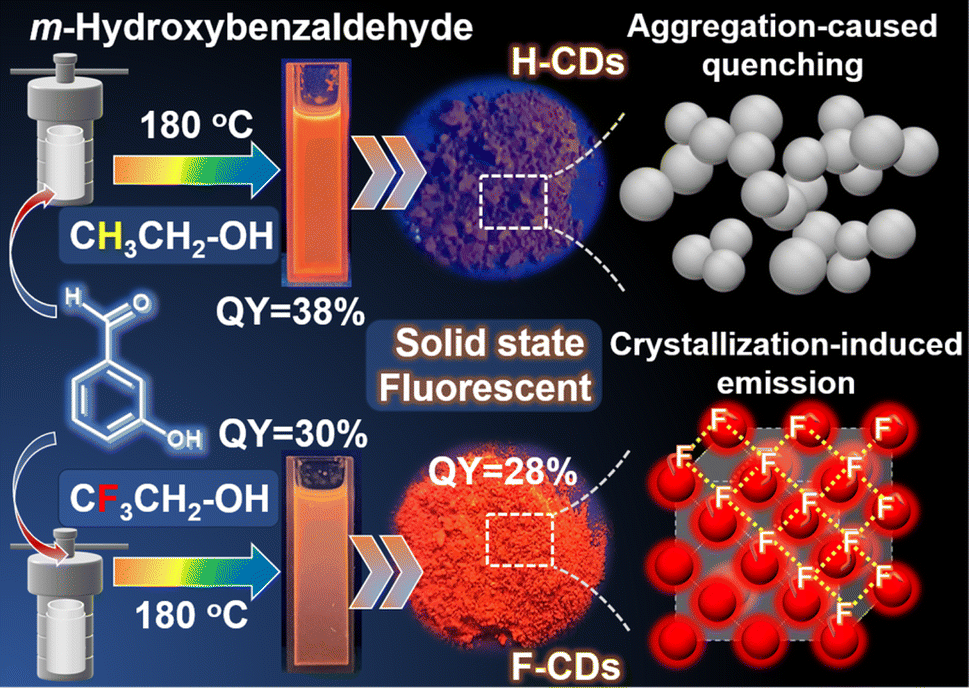 | ||
| Fig. 1 Schematic of the synthesis procedures; optical images of the CDs dispersed in ethanol solution under 365 nm UV light. Schematic diagram of the SSF mechanism model. | ||
As shown in Fig. 1, the F-CDs were synthesized by a simple one-pot solvothermal method at 180 °C using trifluoroethanol as the solvent and m-hydroxybenzaldehyde as the carbon source. The precipitate was first removed from the reaction suspension, and then the solvent was removed by rotary evaporation to obtain orange crystals that emitted red fluorescence under a 365 nm UV lamp. Through scanning electron microscopy (SEM) observations of these crystals, it was found that the F-CDs form a large crystal structure with a thickness of approximately 15.5 μm, while the H-CDs are composed of smaller amorphous structures, indicating that there were strong interactions among the F-CDs (Fig. 2a and b). This crystalline structure was dissolved in ethanol and diluted to 1.0 mg mL−1, after which the sample was observed by TEM, and an aggregated structure of 20–35 nm was still observed (Fig. 2c). The carbon dot solution was further diluted to 0.1 mg mL−1, and discrete carbon dots with an average diameter of 2.0 ± 0.1 nm were observed. In contrast, discrete carbon dots can be observed in the H-CDs at a concentration of 1 mg mL−1, with an average diameter of 3.5 ± 0.2 nm (Fig. 2d). Fig. S1† shows a high-resolution TEM (HR-TEM) image of individual F-CDs and H-CDs, which reveals the high crystallinity of the carbon core. The spacing of the lattice fringe is 0.20 nm, which corresponds to the (100) plane of graphitic carbon.34
 | ||
| Fig. 2 SEM images of the (a) F-CDs and (b) H-CDs. TEM image (inset: the corresponding particle size distribution histogram) of the (c) F-CDs and (d) H-CDs. | ||
The geometrical structures of the two types of CDs were analysed via X-ray diffraction (XRD) (Fig. 3a). The broad peak at 26.5° in the XRD pattern of the H-CDs corresponds to the (002) facet of graphite and is attributed to amorphous carbon derived from deformations caused by heteroatomic dopants or sp3 carbon defects in graphitic structures.35,36 The XRD pattern of the F-CDs shows many sharp diffraction peaks, which confirms the crystal structure.37 Due to the strong interactions among F atoms, crystallization is induced, circumventing direct face-to-face π–π aggregation between carbon dots, which is likely to be the reason for the solid-state fluorescence phenomenon.
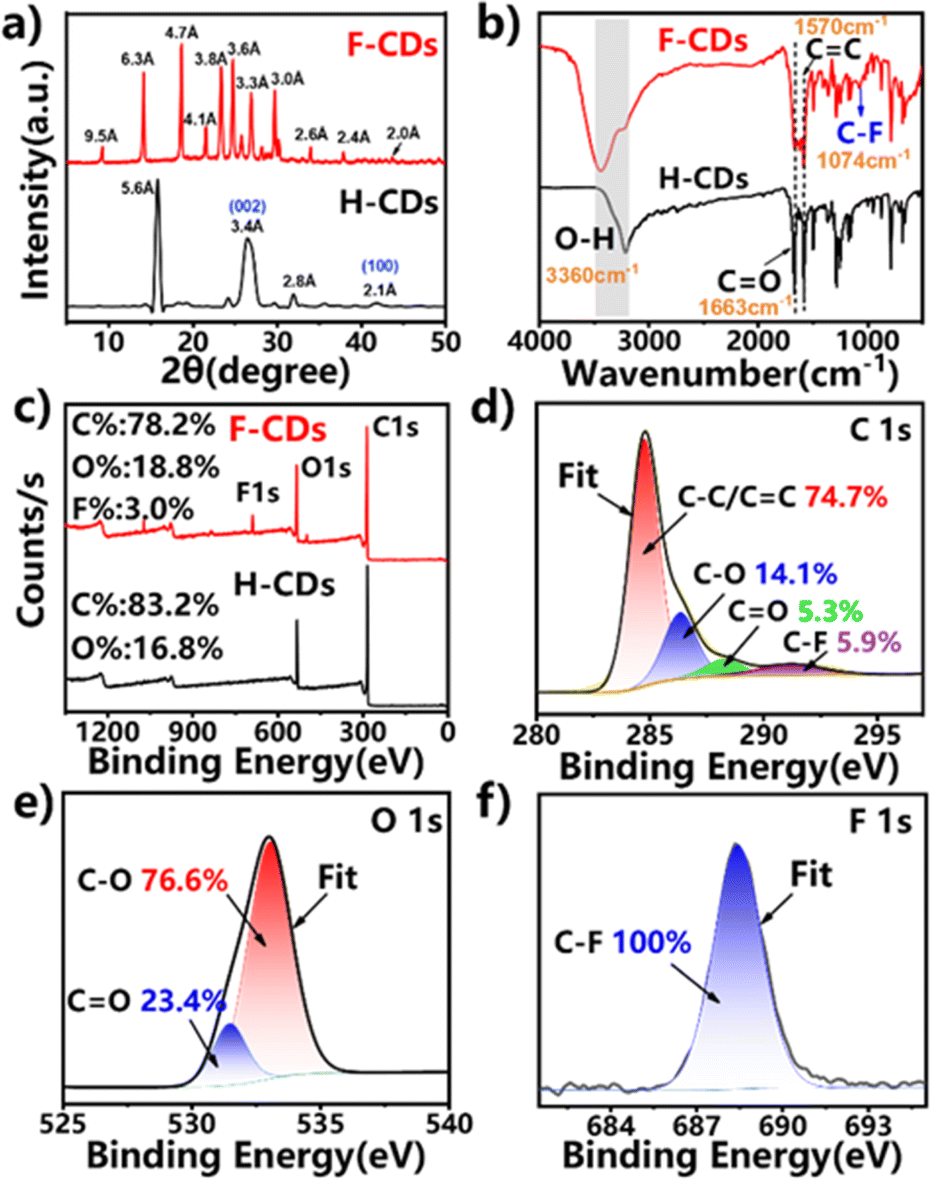 | ||
| Fig. 3 (a) XRD pattern image, (b) FTIR spectra, (c) XPS survey spectra, and high-resolution (d) C 1s, (e) O 1s, and (f) F 1s spectra of the F-CDs. | ||
The chemical composition and surface functional groups of the H-CDs and F-CDs were examined by Fourier transform infrared (FT-IR) and X-ray photoelectron spectroscopy (XPS). As shown in Fig. 3b, the FT-IR spectra indicate the presence of O–H (3012–3680 cm−1), C![[double bond, length as m-dash]](https://www.rsc.org/images/entities/char_e001.gif) O (1663 cm−1), and CC (1570 cm−1) bonds in both samples, but a unique vibrational peak corresponding to the C–F bond (1074 cm−1) is present in the F-CD spectrum.30,38 In addition, the full-survey XPS spectra (Fig. 3c) confirm the presence of F in the F-CD sample. As shown in Fig. 4d, the H-CDs contain C and O at proportions of 83.2% and 16.8%, respectively, while the F-CDs mainly contain C, O and F at proportions of 78.2%, 18.8% and 3.0%, respectively. In addition, the high-resolution XPS spectrum of C 1s (Fig. 3d) shows four peaks at 284.8, 286.7, 288.5, and 291.2 eV, which can be assigned to C–C/CC, C–O, CO and C–F bonds, respectively.39,40 The O 1s spectrum can be deconvoluted into two peaks at 531.5 and 533.1 eV, ascribed to CO and C–O, respectively (Fig. 3e).41 In particular, the high-resolution F 1s spectrum (Fig. 3f) shows a typical signal corresponding to the C–F bond (688.4 eV).42 The high-resolution C 1s and O 1s XPS spectra of the H-CDs are also shown in Fig. S2.† The above results show that F is successfully doped into F-CDs using trifluoroethanol as the solvent.43
O (1663 cm−1), and CC (1570 cm−1) bonds in both samples, but a unique vibrational peak corresponding to the C–F bond (1074 cm−1) is present in the F-CD spectrum.30,38 In addition, the full-survey XPS spectra (Fig. 3c) confirm the presence of F in the F-CD sample. As shown in Fig. 4d, the H-CDs contain C and O at proportions of 83.2% and 16.8%, respectively, while the F-CDs mainly contain C, O and F at proportions of 78.2%, 18.8% and 3.0%, respectively. In addition, the high-resolution XPS spectrum of C 1s (Fig. 3d) shows four peaks at 284.8, 286.7, 288.5, and 291.2 eV, which can be assigned to C–C/CC, C–O, CO and C–F bonds, respectively.39,40 The O 1s spectrum can be deconvoluted into two peaks at 531.5 and 533.1 eV, ascribed to CO and C–O, respectively (Fig. 3e).41 In particular, the high-resolution F 1s spectrum (Fig. 3f) shows a typical signal corresponding to the C–F bond (688.4 eV).42 The high-resolution C 1s and O 1s XPS spectra of the H-CDs are also shown in Fig. S2.† The above results show that F is successfully doped into F-CDs using trifluoroethanol as the solvent.43
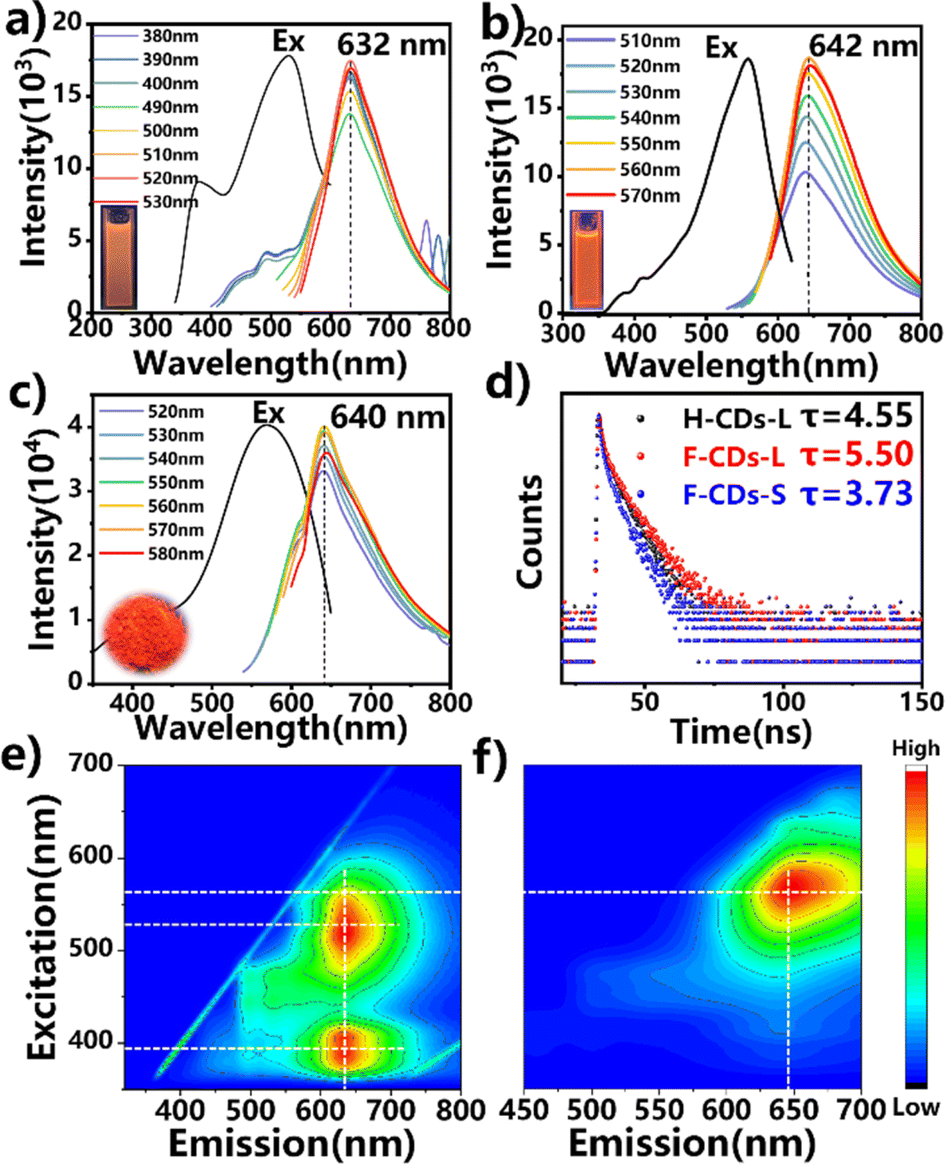 | ||
| Fig. 4 PL emission spectra of (a) F-CDs-l, (b) H-CDs-l, and (c) F-CDs-s at different excitation wavelengths; (d) photoluminescence decays of H-CDs and F-CDs in ethanol solution and (c = 0.1 mg mL−1) in the solid state; 3D PL spectra of (e) F-CDs-l and (f) H-CDs-l. | ||
The optical properties of the F-CDs and H-CDs in both the solution state and solid-state were investigated. Fig. S3† shows the UV-vis absorption of the solution-state F-CDs, H-CDs and solid-state F-CDs. Both CDs show two main absorption peaks at 254 nm and 317 nm, which can be attributed to the π–π* and n–π* transitions, respectively.44,45 However, compared to those of the H-CDs, the F-CDs have a broader UV-vis absorption range, which could have occurred because new defects were induced by F-doping.46 The H-CDs and F-CDs in the solution state emit red fluorescence, and their emission peaks occur at 642 nm and 632 nm, respectively, under UV excitation (λex = 365 nm); both the F-CDs and H-CDs exhibit excitation-independent emission behaviour (Fig. 4a, b and Table 1). Under optimal excitation, the fluorescence quantum yields (QYs) of the F-CDs and H-CDs in ethanol are 30% and 38%, respectively. Due to the influence of the electron-absorbing group of F atoms, the emission peak of the F-CDs is blue-shifted, and the QY is lower than that of the H-CDs. In addition, the time-resolved PL decay data show that the F-CDs have a longer average fluorescence lifetime (τavg = 5.50 ns) than the H-CDs (τavg = 4.55 ns) (Fig. 4d).47 The 3D spectrum shows that both CDs only have red emission centres; the difference is that F-CDs can be excited by two optimal light sources of different wavelengths and then emit light at the same wavelength; that is, F-CDs have two channels for achieving strong fluorescence, which may be related to the new absorption region formed due to F-doping (Fig. 4e and f).48 In the solid state, the F-CDs exhibit bright red fluorescence with an emission peak at 640 nm and an excitation peak at 560 nm, without excitation dependence (Fig. 4c). Compared with that in the liquid state, the F⋯F interaction in the solid-state promotes a redshift in the emission peak and prevents fluorescence quenching.49 In contrast, solid-state H-CD samples did not show any fluorescence under excitation of all different wavelengths.
| F-CDs-L | H-CDs-L | F-CDs-S | |
|---|---|---|---|
| λ ex | 531 nm | 550 nm | 555 nm |
| λ em | 632 nm | 642 nm | 640 nm |
| QYs | 30.0% | 38.0% | 28.0% |
| τ avg | 5.50 ns | 4.55 ns | 3.73 ns |
To investigate the formation process of CDs and their reaction mechanism, we performed time gradient experiments on the synthesized F-CDs (Fig. S6–8†). As the reaction progressed, the normalized PL spectra show that the maximum emission wavelength of the F-CDs slowly redshifted from 420 nm to 632 nm, which indicates that the conjugated structures of the fluorophores in the F-CDs gradually became larger. The F-CD solid powder began to display a fluorescent colour after approximately 3 h and reaches its brightest point after 6 hours. Based on dynamic NMR analysis of F-CDs and our previous research,50 we believe that the –CH2CF3 group is introduced at the 5-site of m-hydroxybenzaldehyde during the reaction (Fig. 5a) and that the F⋯F interaction supports the crystal structure and prevents strong π–π stacking, blocking the major approach for nonradiative energy dissipation in crystalline aromatic compounds and inducing SSF.51,52 The unit structure of the fluorescent molecules in the F-CDs might be dyad 4. In addition, the length of the molecule along the long axis of the dyad was approximately 1 nm. The average particle size of the F-CDs as measured by TEM was approximately 2.0 nm, suggesting that the fluorescent molecules were concentrated by as many as four units. After supramolecular aggregation, CDs were formed with a layer spacing of 0.2 nm. This process could enhance photoluminescence by restraining the movement of the fluorescence center, akin to the emission enhancement effect of supramolecular cross-linking.53–55
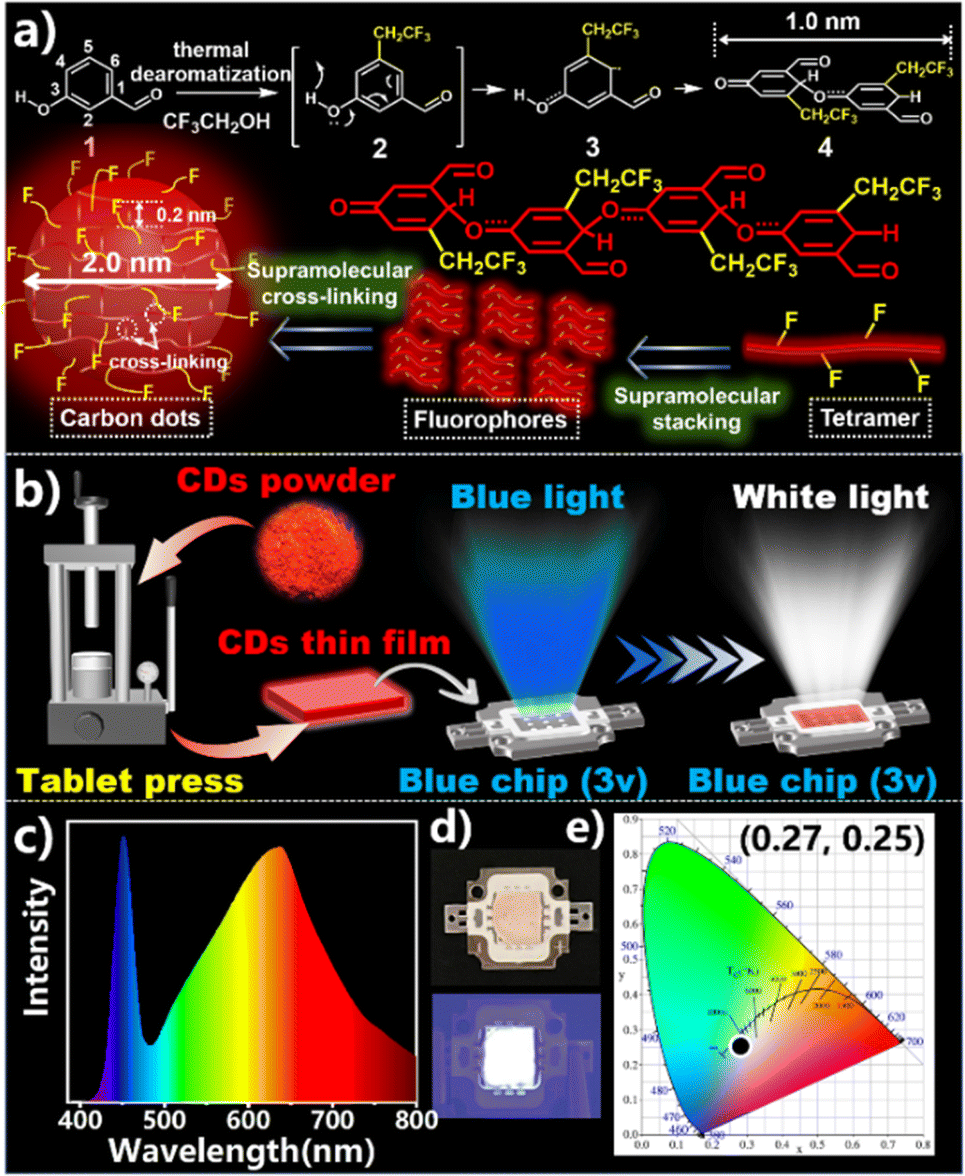 | ||
| Fig. 5 (a) Mechanisms of CD formation; (b) LED production diagram; (c) corresponding emission spectra; (d) photos of LEDs; (e) CIE colour coordinates of white LEDs. | ||
SSF was not observed when o-hydroxybenzaldehyde and p-hydroxybenzaldehyde were used as the reaction matrix (Fig. S9†). In addition, the CDs obtained under acidic or alkaline conditions also did not exhibit SSF (Fig. S10†), possibly because the acid or base destroyed the reactive sites and –CH2CF3 was not successfully introduced at the 5-site of m-hydroxybenzaldehyde. The hydrothermal reaction that occurred when trifluoroethanol was combined with other solvents (ethanol, methanol or water) in different proportions to form the reaction solvent also confirmed that the action of F atoms led to SSF. The doping of F atoms is detrimental to the formation of CDs, such as leading to smaller particle sizes, shorter conjugated structures in the carbon nucleus, and lower fluorescence efficiency.56 However, F atoms can enhance the interaction between carbon dots, promote their crystallization, and induce the emission of solid fluorescence, which is referred to as the crystal induced emission effect.57
Considering that the F-CDs exhibited strong SSF in the deep-red region, we used them to prepare a CD thin film and white light-emitting LED.58 Due to the presence of F atoms, we expected strong interactions between molecules, so we pressed the F-CD powder into a tablet to form a film, which was subsequently covered with a blue chip to obtain a luminous white LED (Fig. 5b). As shown in Fig. 5c and d, the photoluminescence spectra of white LEDs prepared from F-CD films show panchromatic emission at 400–700 nm, where two different emission bands centred at 451 nm and 636 nm overlap each other and display (0.36, 0.37) CIE coordinates (Fig. 5e).
In summary, we proposed a simple and novel F-strategy for the synthesis of solid-state red fluorescent F-CDs. Both the FTIR and XPS data confirmed the formation of C–F bonds at the periphery/edge or on the surface of the F-CDs. The XRD data demonstrated the formation of crystalline structures in the F-CDs. Unlike the H-CDs that contained no F dopant, the F-CDs showed bright red fluorescence in the solid state. Strong F–F interactions are vital for inducing crystallization, and solid luminescence is achieved by blocking the non-radiative energy dissipation pathways of crystalline organizations. This study provides novel evidence supporting the synthesis and application of SSF CDs.
Author contributions
Conceptualization: L. L. and X. L.; methodology: Y. L., H. S. and C. L.; writing—original draft preparation: T. G. and G. Y.; writing—review and editing: F. Y., D. H. and Y. Z. All authors have read and agreed to the published version of the manuscript.Conflicts of interest
There are no conflicts to declare.Acknowledgements
This work was partially supported by the National Natural Science Foundation (No. 22261050), and the Programs of Science and Technology Department of Yunnan Province (YNQR-QNRC-2018-099, 202301AT070180, 202301AT070217, and 202301BD070001-034).Notes and references
- S. N. Baker and G. A. Baker, Angew. Chem., Int. Ed., 2010, 49, 6726–6744 CrossRef CAS PubMed.
- H. Wang, L. Ai, H. Song, Z. Song, X. Yong, S. Qu and S. Lu, Adv. Funct. Mater., 2023, 35, 2303756 CrossRef.
- B. Wang and S. Lu, Matter, 2022, 5, 110–149 CrossRef CAS.
- T. Feng, Q. Zeng, S. Lu, X. Yan, J. Liu, S. Tao, M. Yang and B. Yang, ACS Photonics, 2018, 5, 502–510 CrossRef CAS.
- Y. Zhang, K. Liu, J. Yu, H. Chen, R. Fu, S. Zhu, Z. Chen, S. Wang and S. Lu, Nano Res., 2022, 15, 6399–6406 CrossRef CAS.
- H. Li, Y. Chen, H. Wang, H. Wang, Q. Liao, S. Han, Y. Li, D. Wang, G. Li and Y. Deng, Adv. Funct. Mater., 2023, 33, 2302862 CrossRef CAS.
- Y. Zhang, H. Song, L. Wang, J. Yu, B. Wang, Y. Hu, S. Zang, B. Yang and S. Lu, Angew. Chem., Int. Ed., 2021, 60, 25514–25521 CrossRef CAS PubMed.
- H. Yang, Y. Liu, Z. Guo, B. Lei, J. Zhuang, X. Zhang, Z. Liu and C. Hu, Nat. Commun., 2019, 10, 1789 CrossRef PubMed.
- X. Ba, L. Zhang, Y. Yin, F. Jiang, P. Jiang and Y. Liu, J. Colloid Interface Sci., 2020, 565, 77–85 CrossRef CAS PubMed.
- X. Xu, L. Mo, Y. Li, X. Pan, G. Hu, B. Lei, X. Zhang, M. Zheng, J. Zhuang and Y. Liu, Adv. Mater., 2021, 33, 2104872 CrossRef CAS PubMed.
- J. Wang, J. Zheng, Y. Yang, X. Liu, J. Qiu and Y. Tian, Carbon, 2022, 190, 22–31 CrossRef CAS.
- B. Xu, J. Li, J. Zhang, H. Ning, X. Fang, J. Shen, H. Zhou, T. Jiang, Z. Gao, X. Meng and Z. Wang, Adv. Sci., 2023, 10, 2205788 CrossRef CAS PubMed.
- M. Park, Y. Jeong, H. S. Kim, W. Lee, S. Nam, S. Lee, H. Yoon, J. Kim, S. Yoo and S. Jeon, Adv. Funct. Mater., 2021, 31, 2102741 CrossRef CAS.
- Y. Wang, H. Li, D. Wang and B. Z. Tang, Adv. Funct. Mater., 2021, 31, 2006952 CrossRef CAS.
- Y. An, C. Liu, M. Chen, X. Yin, D. Hou, Y. Zheng, R. Shi, X. He and X. Lin, ACS Sustain. Chem. Eng., 2022, 11, 23–28 CrossRef.
- L. Ai, Z. Song, M. Nie, J. Yu, F. Liu, H. Song, B. Zhang, G. I. N. Waterhouse and S. Lu, Angew. Chem., Int. Ed., 2023, 62, 202217822 CrossRef.
- Z. Wan, Y. Li, Y. Zhou, D. Peng, X. Zhang, J. Zhuang, B. Lei, Y. Liu and C. Hu, Adv. Funct. Mater., 2023, 33, 2207296 CrossRef CAS.
- J. Bai, Inorg. Chem. Commun., 2023, 151, 110614 CrossRef CAS.
- J. Tan, Q. Li, S. Meng, Y. Li, J. Yang, Y. Ye, Z. Tang, S. Qu and X. Ren, Adv. Mater., 2021, 33, 2006781 CrossRef CAS.
- Z. Zhou, E. V. Ushakova, E. Liu, X. Bao, D. Li, D. Zhou, Z. Tan, S. Qu and A. L. Rogach, Nanoscale, 2020, 12, 10987–10993 RSC.
- J. Wang, S. Zhang, Y. Li, C. Wu, W. Zhang, H. Zhang, Z. Xie and S. Zhou, Small, 2022, 18, 2203152 CrossRef CAS PubMed.
- J. Liu, J. Zhang, Y. Zhou, D. Xiao, Y. Zhuo, Y. Chai and R. Yuan, Anal. Chem., 2021, 93, 10890–10897 CrossRef CAS PubMed.
- K. Chu, Z. Ding and E. Zysman-Colman, Chem.–Eur. J., 2023, 29, 202301504 CrossRef PubMed.
- C. Jäckel, M. Salwiczek and B. Koksch, Angew. Chem., Int. Ed., 2006, 45, 4198–4203 CrossRef PubMed.
- G. V. Janjić, S. T. Jelić, N. P. Trišović, D. M. Popović, I. S. Đorđević and M. K. Milčić, Cryst. Growth Des., 2020, 20, 2943–2951 CrossRef.
- H. Omorodion, B. Twamley, J. A. Platts and R. J. Baker, Cryst. Growth Des., 2015, 15, 2835–2841 CrossRef CAS.
- G. Zuo, A. Xie, X. Pan, T. Su, J. Li and W. Dong, ACS Appl. Nano Mater., 2018, 1, 2376–2385 CrossRef CAS.
- W. Yang, H. Zhang, J. Lai, X. Peng, Y. Hu, W. Gu and L. Ye, Carbon, 2018, 128, 78–85 CrossRef CAS.
- T. Li, W. Shi, Q. Mao and X. Chen, J. Mater. Chem. C, 2021, 9, 17357–17364 RSC.
- L. Zhang, M. Wu, Z. Wang, H. Guo, L. Wang and M. Wu, ACS Sustain. Chem. Eng., 2021, 9, 16262–16269 CrossRef CAS.
- P. Long, Y. Feng, C. Cao, Y. Li, J. Han, S. Li, C. Peng, Z. Li and W. Feng, Adv. Funct. Mater., 2018, 28, 1800791 CrossRef.
- L. E. Zimmer, C. Sparr and R. Gilmour, Angew. Chem., Int. Ed., 2011, 50, 11860–11871 CrossRef CAS PubMed.
- B. Cheng, L. Cao, C. Li, F. Huo, Q. Meng, G. Tong, X. Wu, L. Bu, L. Rao and S. Wang, Chin. Chem. Lett., 2023, 34, 108969 Search PubMed.
- Y. Wang, Y. Liu, X. Hao, X. Zhou, H. Peng, Z. Shen, I. I. Smalyukh, X. Xie and B. Yang, Adv. Mater., 2023, 35, 2303680 CrossRef CAS PubMed.
- P. Long, Y. Feng, C. Cao, Y. Li, J. Han, S. Li, C. Peng, Z. Li and W. Feng, Adv. Funct. Mater., 2018, 28, 1800791 CrossRef.
- J. Xu, Q. Liang, Z. Li, V. Y. Osipov, Y. Lin, B. Ge, Q. Xu, J. Zhu and H. Bi, Adv. Mater., 2022, 34, 2200011 CrossRef CAS.
- M. Zheng, H. Jia, B. Zhao, C. Zhang, Q. Dang, H. Ma, K. Xu and Z. Tan, Small, 2023, 19, 2206715 CrossRef CAS.
- M. P. Han, K. Tang, Y. Wang, B. Lin and T. Cheng, Nanoscale, 2015, 7, 1586–1595 RSC.
- H. Li, Z. Zhang, J. Ding, Y. Xu, G. Chen, J. Liu, L. Zhao, N. Huang, Z. He, Y. Li and L. Ding, Carbon, 2019, 149, 342–349 CrossRef CAS.
- Y. Chen, M. Zheng, Y. Xiao, H. Dong, H. Zhang, J. Zhuang, H. Hu, B. Lei and Y. Liu, Adv. Mater., 2016, 28, 312–318 CrossRef CAS PubMed.
- Y. Ding, X. Wang, M. Tang and H. Qiu, Adv. Sci., 2022, 9, 2103833 CrossRef CAS PubMed.
- H. Ding, J. Xu, L. Jiang, C. Dong, Q. Meng, S. U. Rehman, J. Wang, Z. Ge, V. Y. Osipov and H. Bi, Chin. Chem. Lett., 2021, 32, 3646–3651 CrossRef CAS.
- J. Shao, S. Zhu, H. Liu, Y. Song, S. Tao and B. Yang, Adv. Sci., 2017, 4, 1700395 CrossRef PubMed.
- S. Chen, T. Han and B. Z. Tang, Adv. Funct. Mater., 2023, 33, 2307267 CrossRef CAS.
- H. Ding, S.-B. Yu, J.-S. Wei and H.-M. Xiong, ACS Nano, 2016, 10, 484–491 CrossRef CAS PubMed.
- L. Jiang, H. Ding, S. Lu, T. Geng, G. Xiao, B. Zou and H. Bi, Angew. Chem., Int. Ed., 2020, 59, 9986–9991 CrossRef CAS PubMed.
- P. Long, Y. Feng, Y. Li, C. Cao, S. Li, H. An, C. Qin, J. Han and W. Feng, ACS Appl. Mater. Interfaces, 2017, 9, 37981–37990 CrossRef CAS PubMed.
- F. Liu, Z. Li, Y. Li, Y. Feng and W. Feng, Carbon, 2021, 181, 9–15 CrossRef CAS.
- J. Li and X. Gong, Mater. Today Chem., 2022, 26, 101255 CrossRef CAS.
- Y. Li, C. Liu, H. Sun, M. Chen, D. Hou, Y. Zheng, H. Xie, B. Zhou and X. Lin, Adv. Sci., 2023, 10, 2300543 CrossRef CAS PubMed.
- M. K. Bera, P. Pal and S. Malik, J. Mater. Chem. C, 2020, 8, 788–802 RSC.
- G. Hu, Y. Wang, S. Zhang, H. Ding, Z. Zhou, J. Wei, X. Li and H. Xiong, Carbon, 2014, 203, 1–10 CrossRef.
- S. Zhu, L. Wang, N. Zhou, X. Zhao, Y. Song, S. Maharjan, J. Zhang, L. Lu, H. Wang and B. Yang, Chem. Commun., 2014, 50, 13845–13848 RSC.
- S. Zhu, Y. Song, J. Shao, X. Zhao and B. Yang, Angew. Chem., Int. Ed., 2015, 54, 14626–14637 CrossRef CAS PubMed.
- M. Ge, S. Han, Y. Ma, J. Li, S. Liu, Z. Chen and S. Li, Adv. Opt. Mater., 2021, 9, 2101092 CrossRef CAS.
- H. Song, J. Yu, Z. Tang, B. Yang and S. Lu, Adv. Energy Mater., 2022, 12, 2102573 CrossRef CAS.
- M. Yamauchi, K. Yokoyama, N. Aratani, H. Yamada and S. Masuo, Angew. Chem., Int. Ed., 2019, 58, 14173–14178 CrossRef CAS PubMed.
- C. Ji, W. Xu, Q. Han, T. Zhao, J. Deng and Z. Peng, Nano Energy, 2023, 114, 108623 CrossRef CAS.
Footnotes |
| † Electronic supplementary information (ESI) available. See DOI: https://doi.org/10.1039/d4na00206g |
| ‡ These authors contributed equally to this work. |
| This journal is © The Royal Society of Chemistry 2024 |