 Open Access Article
Enhancing photoluminescence performance of perovskite quantum dots with plasmonic nanoparticles: insights into mechanisms and light-emitting applications†
Gautham
Kumar
 a,
Chien-Chung
Lin
b,
Hao-Chung
Kuo
a and
Fang-Chung
Chen
 *ac
*ac
aDepartment of Photonics, College of Electrical and Computer Engineering, National Yang Ming Chiao Tung University, Hsinchu 30010, Taiwan. E-mail: fcchendop@nycu.edu.tw; fcchen@mail.nctu.edu.tw
bGraduate Institute of Photonics and Optoelectronics, Department of Electrical Engineering, National Taiwan University, Taipei 10617, Taiwan
cCenter for Emergent Functional Matter Science, National Yang Ming Chiao Tung University, Hsinchu 30010, Taiwan
First published on 19th January 2024
Abstract
Perovskite quantum dots (QDs) are considered as promising materials for numerous optoelectronic applications due to their narrow emission spectra, high color purity, high photoluminescence quantum yields (PLQYs), and cost-effectiveness. Herein, we synthesized various types of perovskite QDs and incorporated Au nanoparticles (NPs) to systematically investigate the impact of plasmonic effects on the photoluminescence performance of perovskite QDs. The PLQYs of the QDs are enhanced effectively upon the inclusion of Au NPs in the solutions, with an impressive PLQY approaching 99% achieved. The PL measurements reveal that the primary mechanism behind the PL improvement is the accelerated rate of radiative recombination. Furthermore, we integrate perovskite QDs and Au NPs, which function as color conversion layers, with blue light-emitting diodes (LEDs), achieving a remarkable efficiency of 140.6 lm W−1. Additionally, we prepare photopatternable thin films of perovskite QDs using photocrosslinkable polymers as the matrix. Microscale patterning of the thin films is accomplished, indicating that the addition of plasmonic NPs does not adversely affect their photopatternable properties. Overall, our research not only elucidates the underlying mechanisms of plasmonic effects on perovskite QDs but presents a practical method for enhancing their optical performance, paving the way for next-generation optoelectronic applications, including high-definition micro-LED panels.
1. Introduction
Perovskite quantum dots (QDs), also known as perovskite nanocrystals, have recently emerged as promising materials for a wide range of optoelectronic applications, including light-emitting diodes (LEDs), solar cells,1 photodetectors,2 sensors,3 and lasers.4,5 This is attributed to their distinct advantages, such as narrow emission spectra, high color purity, tunable colors, exceptional photoluminescence quantum yields (PLQYs), substantial optical gain coefficients and cost-effectiveness.6,7 Due to the strong confinement of excitation energy within nano-sized crystals, perovskite QDs have also become ideal systems for studying light-exciton interactions.8 In recent developments, highly luminescent colloidal perovskite QDs have been synthesized, demonstrating significant potential as down-converting color-changing agents to expand the color gamut for display applications.9 While the PLQYs of perovskite QDs in solution are notably high,10,11 their efficiency in solid-state thin films lags much behind that of QD solutions. Consequently, there is an urgent demand for the development of effective strategies to achieve high PLQYs in thin films of perovskite QDs.One approach for improving the optical performance of QD films involves the integration of plasmonic nanostructures. Surface plasmons (SPs) are collective oscillations of electromagnetic waves that propagate along metal surfaces.12 They can be generally categorized into two types: localized surface plasmon resonances (LSPRs) and propagating surface plasmon polaritons (SPPs). LSPRs represent coherent oscillations of electrons confined locally within metal nanostructures, while SPPs are typically excited at the interfaces between metal and dielectric materials. Plasmonic nanostructures concentrate light to subwavelength scales, resulting in strong field enhancement. Additionally, SPs can also excite hot electrons, induce far-field scattering and create localized photothermal heating. These plasmonic effects have proven effective in enhancing light-matter interactions and have been widely employed for improving the performance of optoelectronic devices.2,3,6,7,13 For example, plasmonics can significantly increase light absorption in solar cells, enabling a substantial reduction in the thickness of their absorber layers and offering new design possibilities for these light harvesting devices.14,15 For organic solar cells, the incorporation of soluble-processable metal nanoparticles (NPs) into the devices can trigger LSPR, leading to local-field enhancement and subsequently increasing the device power conversion efficiencies.16,17 Plasmonic metal NPs have also found applications in boosting the performance of light-emitting diodes,18,19 random lasers,20 and nanolasers.21 When coupled with plasmonic nanostructures, perovskite QDs experience a strong enhancement in their photoluminescence (PL).22
More recently, metal-perovskite nanostructures have been the subject of extensive research. Balakrishnan and Kamat discovered that surface ligands, such as oleylamine, which stabilize perovskite QDs, promote the reduction of the Au(III) salts, leading to the nucleation of Au NPs on the corners of the CsPbBr3 QDs.22 Nevertheless, this process resulted in a reduction in the emission from the perovskite QDs. Later, Roman et al. found that uncontrolled exchange of Au and Pb ions resulted in the formation of Cs2Au2Br6 nanocrystals, causing significant PL quenching.23 To mitigate this issue, the addition of excess Pb2+ ions in the solution competitively prevented the exchange reaction of the cations. As a result, Au ions were reduced by the ligands and deposited on the surface of CsPbBr3 QDs, leading to higher PLQY compared to that of the previous Cs2Au2Br6 nanocrystals.23 In 2021, Bao et al. demonstrated that decorating CsPb(Br/Cl)3 QDs with Au NPs enhanced their photoluminescence, although excessive decoration reduced the PLQY because of the decreased coupling strength.24 Similarly, many previous studies also have reported enhanced PL performance in blends of perovskite QDs with metal NPs.25–27 For instance, Wang et al. fabricated films of Au nanorods/CsPbBr3 QDs on Si wafers, resulting in a 2-fold increase in PL intensity.25 Plasmonic interactions between Au NPs and perovskite QDs have also been harnessed to achieve competitive optical efficiency in luminescent solar concentrators; coupling between Au NPs and QDs enhanced emission intensity and extended charge recombination times.27 Moreover, PL improvement in CsPbBr3−xIx QDs has been also realized using plasmonic Au nanoarrays.28
Although extensive research has explored the plasmonic effects on perovskite QDs, the mechanisms underlying the PL enhancement are not yet fully understood. Herein, we synthesize various types of perovskite QDs and Au NPs to systematically investigate the impact of plasmonic effects on the PL performance of perovskite QDs. A high PLQY approaching 99% is achieved after Au NPs are included in solutions. Our analysis of the PL results for combinations of perovskite QDs and Au NPs suggests that the primary mechanism behind the PL enhancement in solutions is the accelerated rate of radiative recombination. Furthermore, we incorporate thin films of these nanocompositions, containing perovskite QDs and Au NPs, as color conversion layers (CCLs) in blue chip LEDs, resulting in significantly improved efficiency; a remarkable efficiency of 140.6 lm W−1 is achieved. Additionally, we successfully develop photopatternable thin films of perovskite QDs using photocrosslinkable polymers as the binders. Microscale patterns are implemented with success, and the results indicate that the addition of plasmonic NPs does not adversely affect the photopatternable properties. The findings presented in this work not only shed light on the underlying mechanisms of plasmonic effects but also offer a viable approach for enhancing the optical performance of perovskite QDs. This advancement holds great promise for next-generation optoelectronic applications, including high-definition micro-LED panels.
2. Experimental
2.1 Materials
Oleic acid (90% technical grade), formamidinium bromide (FABr, 98%), lead(II) bromide (99.99%), toluene (99.8%), N,N-dimethylformamide (>99.8%), acetonitrile (99.9%), poly(vinyl cinnamate) (PVCN, MW = 40![[thin space (1/6-em)]](https://www.rsc.org/images/entities/char_2009.gif) 000; PDI = 2.5), and polyethyleneglycol-amine (MW = 294.1) were purchased from Sigma-Aldrich. 2-Octylamine (99%), methyl acetate (99%), 1,2-propanediol monomethyl ether acetate (PGMEA, 99%, stab. with 50 ppm BHT), and HAuCl4·3H2O (99.99%) were purchased from Alfa Aesar. Oleylamine (∼90%) was purchased from Acros Organics. Polydimethylsiloxane (PDMS) (Sylgard 184) was purchased from Dow Corning. Graphene oxide (GO) solution was purchased from UniRegion Bio-Tech. All the chemicals were used as received without any purification.
000; PDI = 2.5), and polyethyleneglycol-amine (MW = 294.1) were purchased from Sigma-Aldrich. 2-Octylamine (99%), methyl acetate (99%), 1,2-propanediol monomethyl ether acetate (PGMEA, 99%, stab. with 50 ppm BHT), and HAuCl4·3H2O (99.99%) were purchased from Alfa Aesar. Oleylamine (∼90%) was purchased from Acros Organics. Polydimethylsiloxane (PDMS) (Sylgard 184) was purchased from Dow Corning. Graphene oxide (GO) solution was purchased from UniRegion Bio-Tech. All the chemicals were used as received without any purification.
2.2 Synthesis of FAPbBr3 QDs
The synthesis of FAPbBr3 QDs followed the LARP method with some modifications.11,29 Initially, the precursor solution was prepared by dissolving FABr (0.5 mL, 0.32 M) and PbBr2 (0.5 mL, 0.4 M) in 1 mL of dimethylformamide (DMF), and the resulting solution was stirred overnight. Subsequently, the precursor solution was added dropwise into a solution consisting of 10 mL toluene, 0.50 mL oleic acid (OA) and 0.02 mL octylamine (OctAm) under vigorous stirring. Instantaneous colloidal crystallization occurred due to the poor solubility of the perovskite precursors in the nonpolar toluene solvent. After centrifugation at 8000 rpm for 25 min, the reaction mixture was separated into two parts; the supernatant was discarded and the precipitate containing perovskite QDs was redispersed in 10 mL fresh toluene. Finally, the solution was centrifuged again at 8000 rpm for 15 min, and the supernatant of the colloidal dispersion was collected. The resulting QDs were denoted as Oct-QDs. Meanwhile, the precursor solution was also added dropwise into another solution consisting of 10 mL toluene, 0.1 mL of OA and 0.01 mL oleylamine (OAm) under vigorous stirring. The QDs were washed and collected using the same methods described above, and the resulting QDs were denoted as OAm-QDs.To improve the quality of the QDs, post-synthesis was further conducted;10 the reaction was carried out under ambient conditions at a relative humidity of 40 ± 5% and a room temperature of 25 °C. Oct-QDs were placed in a conical flask and subjected to vigorous stirring. Before mixing in the conical flask, the PbBr2 precursor (1.5 mmol) was distinctly dissolved in a mixture of propionic acid, butylamine and hexane in a ratio of 1![[thin space (1/6-em)]](https://www.rsc.org/images/entities/char_2009.gif) :
:![[thin space (1/6-em)]](https://www.rsc.org/images/entities/char_2009.gif) 1
1![[thin space (1/6-em)]](https://www.rsc.org/images/entities/char_2009.gif) :
:![[thin space (1/6-em)]](https://www.rsc.org/images/entities/char_2009.gif) 1 (v/v) and stirred at 70 °C overnight. Subsequently, PbBr2 (0.03 mL), OA (5 mL), and 2-methyl acetate (10 mL) were added to the conical flask. After centrifugation at 8000 rpm for 25 min, the supernatant was collected and a highly luminescent powder was obtained after solvent evaporation.
1 (v/v) and stirred at 70 °C overnight. Subsequently, PbBr2 (0.03 mL), OA (5 mL), and 2-methyl acetate (10 mL) were added to the conical flask. After centrifugation at 8000 rpm for 25 min, the supernatant was collected and a highly luminescent powder was obtained after solvent evaporation.
2.3 Synthesis of gold nanoparticle-decorated graphene oxide nanocomposites
The gold nanoparticle-decorated GO nanocomposites were synthesized in an aqueous medium following the procedures reported in previous literature studies.30,31 In short, a solution of GO (0.275 mg mL−1, 3 mL) in water was added to another aqueous solution of HAuCl4·3H2O (0.047 mg mL−1, 10 mL) and the mixture was aged for 60 min to facilitate interactions between the GO nanosheets and the Au ions.31 Subsequently, the solution was heated to 90 °C, and a reducing agent, glycine (0.3 mmol), was introduced.31 The solution was maintained at 90 °C and continuously stirred for 4 h. After cooling down to room temperature, the solution was centrifuged at 6000 rpm. Then, the precipitate was washed with DI water twice to remove the remaining gold ions and impurities. Finally, the obtained nanoparticles were further dried through lyophilization; this batch of Au NPs is denoted as AuNP-GO. Another type of Au NPs was also synthesized to study the effects induced by the metal NPs.44 The first few steps were identical to the procedure for preparing AuNP-GO. After the reduction of Au ions by glycine and maintaining the solution at 90 °C for 4 h, the heating was stopped and naturally cooled down to room temperature. During the cooling step, polyethyleneglycol-amine (0.15 M, 180 μL) was added to the solution. After 45 min of stirring, the resulting solution was subjected to centrifugation (6000 rpm) and washed with DI water twice. Finally, the nanocomposites were also dried through lyophilization, and the final product is denoted as AuNP-PEGGO.2.4 Fabrication of quantum-dot LEDs
The PDMS precursor was prepared by mixing 10 parts (by weight, ∼10 g) of Sylgard™ 184 pre-polymer and 1 part (∼1 g) of the curing agent for ∼10 min until the entire mixture was filled with bubbles. The mixture was then placed in a desiccator to degas (allowing bubbles to rise out) for 15 min. Then, PeQDs and PDMS (20![[thin space (1/6-em)]](https://www.rsc.org/images/entities/char_2009.gif) :
:![[thin space (1/6-em)]](https://www.rsc.org/images/entities/char_2009.gif) 1 in weight ratio) were further mixed well and filled in a blue LED chip with a 5070 package.
1 in weight ratio) were further mixed well and filled in a blue LED chip with a 5070 package.
2.5 Optical patterning of QDs
The glass substrates (3 cm × 3 cm) were cleaned with the Alconox neutral detergent and deionized water mixture. Subsequently, these substrates were subjected to sonication in both acetone and isopropanol for 15 min each and dried in an oven. Thereafter, perovskite QDs (6.0 wt%) and poly(vinyl cinnamate) (PVCN) (0.4 wt%) were dispersed in toluene, and the resulting solution was spin-coated on the pre-cleaned glass substrates at a spin speed of 900 rpm for 15 s followed by 1500 rpm for 60 s. Then, the cross-linking reaction of the films was initiated by exposing them to 365 nm UV irradiation and the exposure dose was 10 J cm−2.11 Finally, the films were further annealed at 60 °C for 5 min in a glovebox. On the other hand, a double-sided mask aligner (M&R Nano Technology) was used in the microscale patterning process; the dose rate was 12 J cm−2.11 The films were developed by dipping the samples in 1,2-propanediol monomethyl ether acetate (PGMEA) for 3 min (OAm-QDs) to remove unexposed portions. For the other two types of QDs, the dipping time was longer (30 min). Finally, the samples were annealed at 80 °C for 10 min.3. Results and discussion
The formamidinium lead bromide (FAPbBr3) QDs were synthesized using the ligand-assisted reprecipitation (LARP) method at room temperature.10 The detailed procedures are outlined in the experimental section. The perovskite QDs prepared with octylamine and oleylamine are denoted as Oct-QDs and OAm-QDs, respectively. The PLQY values of Oct-QDs and OAm-QDs were 84.8 ± 0.7% and 77.4 ± 0.9%, respectively. Furthermore, the physical properties of these perovskite QDs were improved through post-treatment.29 As a result, the Oct-QDs were further treated and the resulting QDs (denoted as Post-QDs) exhibited a high PLQY of 94.5 ± 1.3% in toluene after post-synthesis. Fig. 1a–c display the transmission electron microscopy (TEM) images of the various types of perovskite QDs. These images reveal the presence of typical cubic nanocrystals. The size distributions of these PeQDs are depicted in Fig. 1d–f with average diameters of 8.5 ± 1.5, 10.8 ± 1.4, and 11.0 ± 1.2 nm for Oct-QDs, OAm-QDs and Post-QDs, respectively. In parallel, Au NPs were synthesized following the procedures we previously reported.30,31 We employed graphene oxides (GOs) as a template for the anchoring of Au NPs, thereby avoiding their aggregation. Furthermore, poly(ethylene glycol) (PEG) bis(amine) was added to the synthesis medium to improve the solubility of the nanocomposites.32 Fig. S1 (ESI†) displays the TEM images of the two distinct Au NPs. The AuNPs anchored to the GO surfaces exhibited a near-spherical shape. The average diameters for the Au NPs in the AuNP-GO and AuNP-PEGGO nanocompositions were 19 and 18 nm, respectively. Observing the TEM images, we noted that the majority of Au NPs were located in close proximity to the edges and wrinkles of the GO sheets. The heightened defect density of the GO nanosheets near their edges and creases likely provided a greater number of charge sites for immobilizing Au ions during the initial nucleation stage.32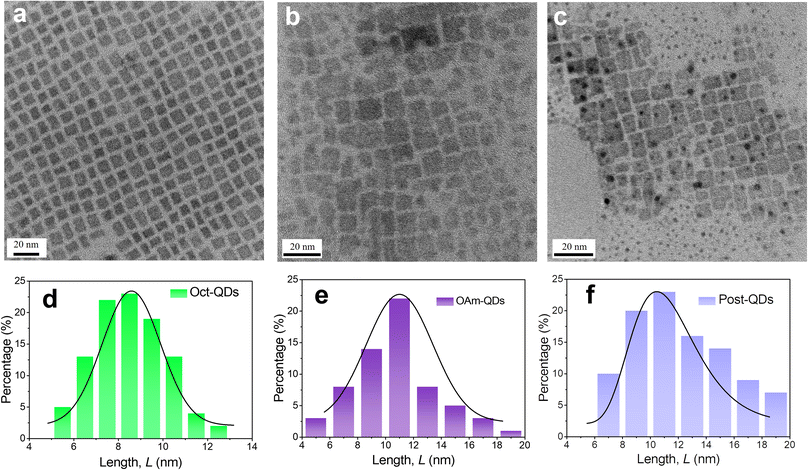 | ||
| Fig. 1 (a–c) TEM images of the perovskite QDs; (d–f) the size distributions of the perovskite QDs. The perovskite QDs are (a and d) Oct-QDs; (b and e) OAm-QDs; (c and f) Post-QDs. | ||
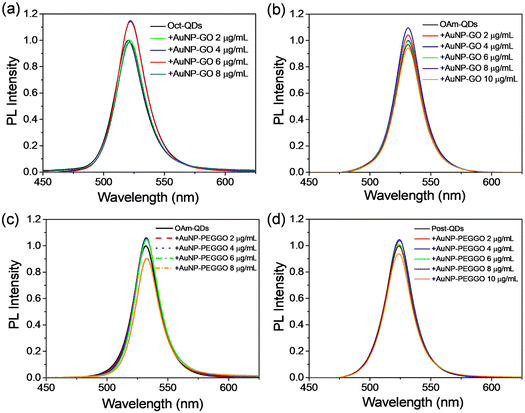
To improve the emission properties of the perovskite QDs, we introduced Au NPs into the solutions of perovskite QDs.33Fig. 2 displays the PL spectra of the perovskite QDs in toluene upon the addition of Au NPs. Notably, characteristic green emission peaks were observed for the FAPbBr3 QDs. The PL intensities of the QDs were enhanced under the optimized conditions. For instance, the emission from Oct-QDs increased by approximately 15% after the addition of Au NPs at 4 μg mL−1 (Fig. 2a). However, the PL intensity started to decline upon the addition of an excessive amount of Au NPs. Prior research has indicated that the presence of metal NPs or salts in colloidal suspensions can lead to rapid optical degradation of perovskite QDs.22,34,35 Therefore, we infer that iodide leaching towards the metal NPs and the subsequent formation of metal iodides could be one of the primary factors contributing to the decreased PL intensities.22,34,35
Various types of perovskite QDs and Au NPs were also used in the PL studies (Fig. 2). The enhancement factors in the PL intensities were approximately 10%, 6%, and 5% as shown in Fig. 2b, c and d, respectively. Comparing the results for Oct-QDs and OAm-QDs when using AuNP-GO nanocomposites (Fig. 2a and b), we observed the most substantial enhancement in PL efficiency for Oct-QDs. This may be attributed to the shorter main chain of octylamine (8 carbon atoms) compared to oleylamine (18 carbon atoms), potentially allowing the Au NPs to be closer to the perovskite QDs in the solutions, thereby maximizing the near-field LSPR effects. Moreover, the results presented in Fig. 2b and c indicate a slightly larger enhancement factor when using AuNP-GO, suggesting that the incorporation of PEG moieties possibly increased the effective distance between the perovskite QDs and Au NPs. Conversely, the PL enhancement was quite limited when employing Post-QDs (Fig. 2d). This limitation can be attributed to the initially high PLQY, which stood at 94.5 ± 1.3%. However, a very high PLQY of approximately 99% has been achieved for Post-QDs. The results of the PL measurements are summarized in Tables S1–S3 (ESI†).
Two primary mechanisms, namely, local excitation field enhancement and accelerated radiative recombination (the Purcell effect), may account for the PL enhancement observed in the previous solutions of the perovskite QDs.36 The first one arises from the strong local electric field induced by the plasmonic resonance near the metal NPs. However, such a mechanism can also accelerate nonradiative recombination. The later mechanism, the Purcell effect, requires a resonance overlap between the frequency of the LSPR and the PL spectrum of the emitters. Note that the origin of the plasmonic effects could involve either one or both of these mechanisms.
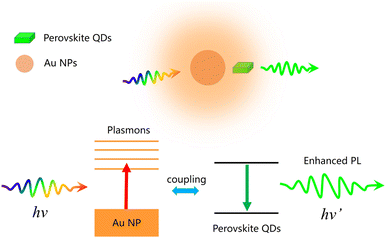
On the other hand, in our systems, we found that the highest PL enhancement factor was less than 16%. Notably, for the best-performing Post-QDs, the increase in PL intensity was very limited. These findings suggest that the Purcell effect was likely the primary factor for the observed PL enhancement, thereby accelerating radiative recombination. Given that the Purcell effect typically cannot significantly improve the PL of QDs with initially high PLQYs, we suspect that the PL improvement through enhanced excitation efficiency was relatively minor.36Scheme 1 illustrates the plasmonic effect of the Au NPs on the PL performance of perovskite QDs.
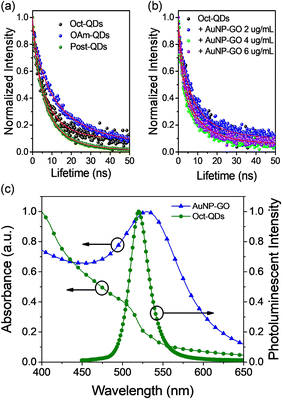
Time-resolved photoluminescence (TRPL) measurements were performed to study the exciton dynamics in the mixtures composed of the perovskite QDs and Au NPs. Fig. 3a shows the PL decay curves of the three types of perovskite QDs, which could be well fitted to the following bi-exponential decay equation,32
 | (1) |
 | (2) |
From the results, it is evident that Oct-QDs exhibited shorter lifetimes compared to OAm-QDs, which aligned with their higher PLQY of 85.0 ± 1.0%. The average lifetime (τavg) for Oct-QDs was also shorter (12.46 ns). This indicated that the enhanced PL behavior of Oct-QDs could be attributed to faster rates of radiative decay and surface recombination. Furthermore, the lifetimes of Oct-QDs were observed to decrease after post-treatment (Post-QDs); specifically, τ1 and τ2 reduced from 7.33 and 24.20 ns to 5.09 and 14.77 ns, respectively. The results indicate that post-treatment effectively reduced the density of defect states, leading to faster radiative decay and a higher PLQY (Table S3, ESI†).
Fig. 3b displays the decay curves of the Oct-QDs after the addition of various amounts of AuNP-GO. The lifetime values of the Oct-QDs decreased with the addition of Au NPs. Under optimal conditions, τ1 and τ2 decreased to 4.31 and 14.32 ns, resulting in a short τavg of 8.74 ns. However, as more AuNP-GO was added, the lifetimes became longer. Tables S1–S3† (ESI) also provide a comparison of the lifetimes and PLQY values. The highest PLQY occurred when the lifetimes were the shortest, indicating that Au NPs increased the radiative decay rates. This increase in the spontaneous radiative rate of the Oct-QDs was likely due to the coupling between the excitons and localized surface plasmons of the Au NPs (Scheme 1), which aligns with the assumption made in Fig. 2. Furthermore, Tables S4–S6 (ESI†) list the radiative (kr) and non-radiative recombination (knr) rate constants, which are obtained from the calculations using the PLQY values and the PL decay lifetimes. We clearly observed that the radiative recombination rates were increased after the addition of Au NPs. These findings strongly support the notion that the Purcell effect is primarily responsible for the PL improvement.
Fig. 3c illustrates a significant spectral overlap between the plasmon band of the Au NPs and the emission spectrum of the Oct-QDs. The condition of accelerating the radiative rate, known as the Purcell effect, relies on a resonance overlap between the plasmon frequency and the PL spectra. The pronounced spectral overlap supports the presence of strong coupling.36 Furthermore, it is worth noting that the plasmonic effects may also address the issue of “dark” states in the QDs. A higher radiative rate reduced the probability of the Auger process, which is a primary mechanism for the creation of charged, non-emissive QDs, consequently leading to increased PLQY values.36 However, further studies are required to fully understand the mechanism behind this PL enhancement.
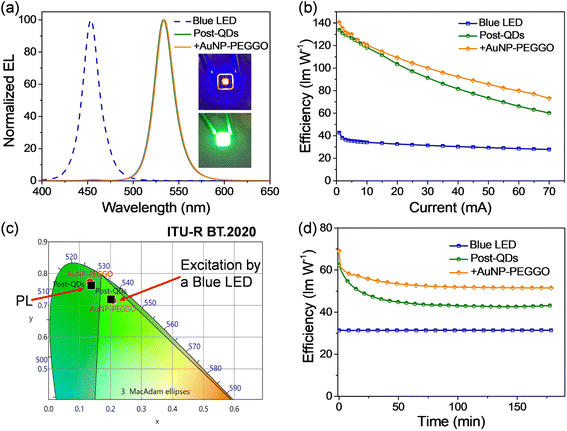
The highly luminescent nanocompositions containing perovskite QDs and Au NPs have potential applications as color conversion layers (CCLs) for lighting and displays. First, we fabricated green LEDs by depositing the QDs on blue GaN-based light-emitting chips.40 Different types of perovskite QDs were mixed with polydimethylsiloxane (PDMS), and the resulting mixture was used to fill in the blue LED chip; details of the fabrication processes are illustrated in Fig. S2 (ESI†). Fig. 4a displays the electroluminescence (EL) spectra of blue LEDs before and after the incorporation of Post-QDs, with the LED operated at an injection current of 30 mA. We observed a strong blue emission peak centered at 454 nm from the blue LED. After filling the Post-QD/PDMS mixture, a green emission peak appeared at 534 nm. Notably, the peak position was slightly red shifted compared to the emission observed in toluene (as shown in Fig. 2), suggesting potential aggregation of the QDs in the solid states. When the current was lower than 20 mA, no apparent blue emission could be observed. On the other hand, a very minor peak at 456 nm was still observed when the current was higher than 20 mA. Nevertheless, more than 99% of the blue emission was effectively converted to green photons, suggesting that a high color conversion efficiency was achieved. Furthermore, we introduced the Au NPs (AuNP-PEGGO) into the mixture with the Post-QDs, and this also led to effective down-conversion of blue photons into green emission (Fig. 4a). The EL spectra of the green emission were nearly identical, revealing that the addition of An NPs did not alter the nature of the excited states.
Fig. 4b presents the device efficiencies of the LEDs at various injection current levels. The highest power efficiency achieved by the blue LED was 42.7 lm W−1, which gradually decreased with increasing injection current. However, after incorporating Post-QDs, the highest power efficiency of the green LED reached 133.9 lm W−1. The efficiency further improved to 140.6 lm W−1 upon the incorporation of Au NPs (AuNP-PEGGO) into the LEDs. Within the range of injection current, up to 70 mA, the LED showed enhanced efficiencies when Au NPs were used. Furthermore, the efficiencies at a high injection current of 70 mA remained high; for example, the efficiencies were 60.14 and 73.14 lm W−1 for the LEDs prepared without and with Au NPs, respectively. Because the device efficiencies are directly related to the PLQY values, the improvement in device efficiencies could be attributed to the plasmonic effects of the Au NPs. From Fig. 3c, we could observe intensive absorption below 520 nm due to the d-band transition. A portion of the blue emission from the GaN LED could be absorbed and consumed by the Au NPs, thereby reducing the device efficiency. Nevertheless, the prevailing influence of the Purcell effect is poised to surpass other potential impacts, thereby increasing the efficiencies. Consequently, the incorporation of Au NPs is expected to yield a net increase in the generation of green photons by the system.
Fig. 4c displays the CIE color coordinates of the emission from the blue LED, the green emission from the LEDs prepared with the QDs, and the BT.2020 green standard.41 The coordinates of the LED prepared with and without Au NPs were (0.208, 0.715) and (0.202, 0.719), respectively. Both were very close to the BT.2020 green standard (0.170, 0.797), revealing their high potential for display applications.
Fig. 4d depicts the time-dependent efficiencies of the LEDs at a sustained driving current in the ambient atmosphere. Fig. S3 (ESI†) also shows the normalized efficiencies. The efficiency of the blue LEDs were retained throughout the test. However, the luminous efficiencies of both LEDs dropped rapidly in the first stage but gradually stabilized after approximately 1 h. Notably, the LED prepared with Au NPs degraded very fast during the first few minutes, but the stabilized efficiency was still higher than the efficiency of the device fabricated without Au NPs. To illustrate this, after 180 minutes of stress testing, the efficiency of the LED prepared with Au NPs remained at 75% of its initial value, whereas it dropped to 69% for the device prepared without Au NPs (Fig. 3). In other words, the addition of Au NPs could somehow improve the stability of the LEDs. These encouraging results demonstrate the potential to simultaneously enhance both device efficiency and stability using plasmonic metal NPs.
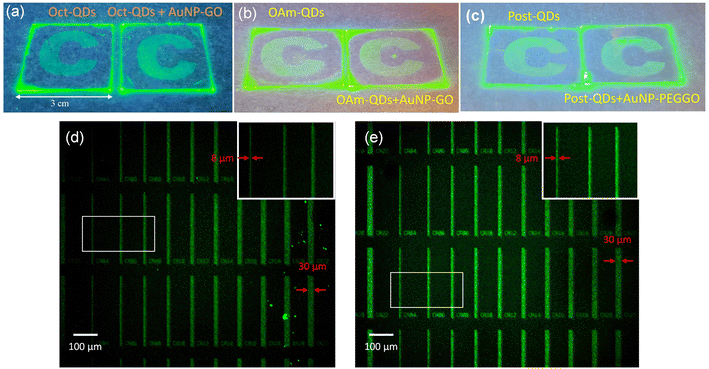
Previously, we reported the preparation of photopatternable perovskite quantum dot-polymer nanocomposites (PQD-PNCs), which can be patterned using conventional photolithography processes to achieve feature sizes at the micro-scale.11Fig. 5a–c show the images of the patterned PQD-PNC films prepared with and without Au NPs. In these films, perovskite QDs and Au NPs (AuNP-PEGGO) were embedded into poly(vinyl cinnamate) (PVCN). The patterned thin films, observed under normal lighting conditions, are also revealed in Fig. S4 (ESI†). The resulting patterns exhibited similar optical properties, indicating that the addition of Au NPs did not affect the photopatternable properties.
Patterning of QD films is in high demand for numerous optoelectronic applications. To achieve microscale patterns, we utilized a mask aligner equipped with a 1000 W UV light source for the patterning process using the PeQD-PNCs. As shown in Fig. 5d and e, we created fine line patterns with varying widths through photolithography. The results demonstrate the effectiveness of achieving microscale patterning using PeQD-PNCs, both with and without Au NPs. The inset images of Fig. 5d and e reveal that the smallest line width achieved was 8.0 μm. Moreover, there was no noticeable difference in the microscale patterns when incorporating Au NPs, revealing their high potential for use in photolithography with perovskite QDs.
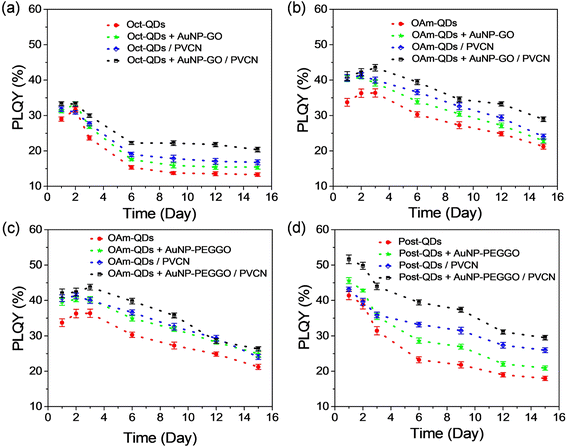
One of the primary challenges associated with the use of perovskite QDs is their poor stability and high sensitivity to environmental stresses. To assess the stability of these thin films, we prepared neat films of the perovskite QDs and various PQD-PNC films. Subsequently, we stored the thin films under normal ambient conditions without any encapsulation. Fig. 6 shows the results of the stability tests for the thin films, with time-dependent PLQY values being recorded. The PLQY values for the neat films prepared with Oct-QDs, OAm-QDs and Post-QDs were 29.0 ± 0.6%, 33.7 ± 1.1% and 41.4 ± 1.2%, respectively. Although the PLQY of Oct-QDs (84.8 ± 0.7%) in a diluted toluene solution was higher than that of OAm-QDs (77.4 ± 0.9%), the PLQY of OAm-QDs was slightly higher in their solid form. We suspect that the surface ligands of OAm-QDs, likely oleylammonium halide and/or oleylammonium carboxylates,42,43 were stronger and better at preserving the colloidal integrity of the QDs after solidification. Furthermore, the PLQY values were improved after blending with Au NPs, consistent with the findings from the studies in the solutions, as described earlier. Additionally, the PLQY values of the PeQD-PNC films were higher than those of the neat films, possibly due to the dilution effects, which reduced the reabsorption efficiency. The highest PLQY among all the conditions was 52.9% for the film prepared with AuNP-PEGGO in a PVCN polymer matrix. Clearly, the LSPR effects of Au NPs can effectively enhance the PL performance of the perovskite QD films.
Fig. 6 also indicates the PLQYs recovered under certain conditions, particularly during the initial few days of storage. Although the mechanism behind the PL recovery is not yet well understood, our previous results suggest that it may be attributed to the desorption and subsequent re-adsorption of surface ligands.11 For the Post-QDs, such a phenomenon of PLQY recovery was absent; which led us to suspect that the surface ligands were bound more strongly to the surface after the post-treatment, thereby preserving the colloidal integrity.42
For instance, the highest PLQY (33.3 ± 0.6%) was observed for Oct-QDs when prepared with PVCN and AuNP-GO (Fig. 6a). It remained nearly unchanged on the second day but started to decay from the third day onwards. From the seventh day, the PLQY declined at a much slower rate. Conversely, OAm-QDs and Post-QDs exhibited different behaviors. The PLQY values of OAm-QDs showed a temporary recovery during the first 2 or 3 days, followed by a steady decline with time (Fig. 6b and c). In contrast, the PLQY values of Post-QDs monotonically decreased with time (Fig. 6d). The PLQY of Post-QDs prepared with PVCN and AuNP-PEGGO remained stable at 29.5 ± 0.7% after 15 days of storage. Interestingly, the decay rates for both types of perovskite QDs were similar and remained unaffected by the presence of Au NPs or a polymer matrix. Note that the results differ somewhat from the behavior observed in perovskite QDs embedded in PDMS (Fig. 4d). The presence of Au NPs may have acted as a heat sink, aiding in heat dissipation generated from the LEDs during continuous operation. On the other hand, for thin films, reactions with moisture and/or oxygen likely played a more significant role in material degradation.
4. Conclusion
In summary, we conduct a systematic study on the LSPR effects of Au NPs on the emission properties of perovskite QDs. The investigation reveals that the PLQY values of the FAPbBr3 QDs are enhanced by blending them with Au NPs, achieving a high PLQY approaching 99% in toluene. Various perovskite QDs with different ligands and Au NPs are also employed for steady-state and time-resolved PL studies. The results indicate that the radiative recombination rate is accelerated and the Purcell effect is likely the primary reason for the observed PL improvement. The PL increment through enhanced excitation efficiency is relatively minor. Furthermore, highly luminescent nano-compositions, consisting of PeQDs and Au NPs, are employed as the CCLs for display applications. They effectively convert the blue emission from LEDs into green photons, and the resulting green LED achieves a remarkable efficiency of 140.6 lm W−1 after incorporating Au NPs into the device. Finally, the PeQDs and Au NPs are embedded in a photopatternable polymer, PVCN, and the resulting polymer films can be patterned with UV light. Importantly, the microscale patterns created with and without Au NPs exhibit similar properties, suggesting that the addition of Au NPs does not adversely affect the photopatternable nature. We anticipate that our results will pave the way for new opportunities to enhance the optical performance of perovskite QDs in next-generation optoelectronic applications.Conflicts of interest
There are no conflicts to declare.Acknowledgements
We thank the National Science and Technology Council, Taiwan (grant no. NSTC 112-2221-E-A49-072-MY3, NSTC 109-2221-E-009-147-MY3 and NSTC 112-2218-E-A49-022-MBK), and the Ministry of Education (MOE), Taiwan (SPROUT Project-Center for Emergent Functional Matter Science of National Chiao Tung University), for financial support.References
- L. Hu, Q. Zhao, S. Huang, J. Zheng, X. Guan, R. Patterson, J. Kim, L. Shi, C. H. Lin, Q. Lei, D. Chu, W. Tao, S. Cheong, R. D. Tilley, A. W. Y. Ho-Baillie, J. M. Luther, J. Yuan and T. Wu, Nat. Commun., 2021, 12, 466 CrossRef CAS PubMed.
- C. Livache, B. Martinez, N. Goubet, C. Greboval, J. Qu, A. Chu, S. Royer, S. Ithurria, M. G. Silly, B. Dubertret and E. Lhuillier, Nat. Commun., 2019, 10, 2125 CrossRef PubMed.
- Y. T. Long, C. Kong, D. W. Li, Y. Li, S. Chowdhury and H. Tian, Small, 2011, 7, 1624–1628 CrossRef CAS PubMed.
- Y. F. Jia, R. A. Kerner, A. J. Grede, B. P. Rand and N. C. Giebink, Nat. Photonics, 2017, 11, 784–788 CrossRef CAS.
- A. P. Schlaus, M. S. Spencer, K. Miyata, F. Liu, X. Wang, I. Datta, M. Lipson, A. Pan and X. Y. Zhu, Nat. Commun., 2019, 10, 265 CrossRef PubMed.
- C. B. Murray, C. R. Kagan and M. G. Bawendi, Annu. Rev. Mater. Sci., 2000, 30, 545–610 CrossRef CAS.
- L. Qu and X. Peng, J. Am. Chem. Soc., 2002, 124, 2049–2055 CrossRef CAS PubMed.
- J. M. Pietryga, Y. S. Park, J. Lim, A. F. Fidler, W. K. Bae, S. Brovelli and V. I. Klimov, Chem. Rev., 2016, 116, 10513–10622 CrossRef CAS PubMed.
- C.-C. Lin, K.-L. Liang, H.-Y. Chao, C.-I. Wu, S. F. Lin, B.-M. Huang, C.-W. Huang, C.-C. Wu, W.-H. Kuo and Y.-H. Fang, ACS Appl. Opt. Mater., 2023 DOI:10.1021/acsaom.3c00104.
- F. Di Stasio, S. Christodoulou, N. Huo and G. Konstantatos, Chem. Mater., 2017, 29, 7663–7667 CrossRef.
- C. H. Sung, S. D. Huang, G. Kumar, W. C. Lin, C. C. Lin, H. C. Kuo and F. C. Chen, J. Mater. Chem. C, 2022, 10, 15941–15947 RSC.
- C. H. Chou and F. C. Chen, Nanoscale, 2014, 6, 8444–8458 RSC.
- R. Schmidt, C. Krasselt, C. Gohler and C. von Borczyskowski, ACS Nano, 2014, 8, 3506–3521 CrossRef CAS PubMed.
- H. A. Atwater and A. Polman, Nat. Mater., 2010, 9, 205–213 CrossRef CAS PubMed.
- P. Mandal, Plasmonics, 2022, 17, 1247–1267 CrossRef.
- K. S. Tan, M. K. Chuang, F. C. Chen and C. S. Hsu, ACS Appl. Mater. Interfaces, 2013, 5, 12419–12424 CrossRef CAS PubMed.
- N. W. Teng, S. S. Yang and F. C. Chen, IEEE J. Photovolt., 2018, 8, 752–756 Search PubMed.
- L. S. Jhuang, G. Kumar and F. C. Chen, Dyes Pigm., 2021, 188, 109204 CrossRef CAS.
- L. Gu, K. Wen, Q. Peng, W. Huang and J. Wang, Small, 2020, 16, e2001861 CrossRef PubMed.
- T. S. Kao, K. B. Hong, Y. H. Chou, J. F. Huang, F. C. Chen and T. C. Lu, Opt. Express, 2016, 24, 20696–20702 CrossRef CAS PubMed.
- Y. H. Hsieh, B. W. Hsu, K. N. Peng, K. W. Lee, C. W. Chu, S. W. Chang, H. W. Lin, T. J. Yen and Y. J. Lu, ACS Nano, 2020, 14, 11670–11676 CrossRef CAS PubMed.
- S. K. Balakrishnan and P. V. Kamat, ACS Energy Lett., 2017, 2, 88–93 CrossRef CAS.
- B. Roman, J. Otto, C. Galik, R. Downing and M. Sheldon, Nano Lett., 2017, 17, 5561–5566 CrossRef CAS PubMed.
- L. Bao, W. Q. Liu, Y. H. Chen, Y. B. Zhang and Y. Zhang, J. Mater. Chem. C, 2021, 9, 5182–5189 RSC.
- F. Y. Juan, F. Xu, M. Wang, M. X. Wang, G. Z. Hou, J. Xu, H. M. Wei, Y. H. Wang, Y. Q. Wu and B. Q. Cao, Chem. Phys., 2020, 530, 110627 CrossRef CAS.
- L.-C. Chen, C.-H. Tien, K.-L. Lee and Y.-T. Kao, Energies, 2020, 13, 1471 CrossRef CAS.
- B. Mendewala, E. T. Vickers, K. Nikolaidou, A. DiBenedetto, W. G. Delmas, J. Z. Zhang and S. Ghosh, Adv. Opt. Mater., 2021, 9, 2100754 CrossRef CAS.
- Y. Wu, Q. Han, M. Wang, F. Juan, G. Hou, F. Xun, H. Wei, J. Xu and B. Cao, Opt. Express, 2021, 29, 36988–36996 CrossRef CAS PubMed.
- F. Di Stasio, I. Ramiro, Y. Bi, S. Christodoulou, A. Stavrinadis and G. Konstantatos, Chem. Mater., 2018, 30, 6231–6235 CrossRef CAS.
- M. K. Chuang, S. W. Lin, F. C. Chen, C. W. Chu and C. S. Hsu, Nanoscale, 2014, 6, 1573–1579 RSC.
- M. K. Chuang, F. C. Chen and C. S. Hsu, J. Nanomater., 2014, 2014, 736879 Search PubMed.
- M. K. Chuang and F. C. Chen, ACS Appl. Mater. Interfaces, 2015, 7, 7397–7405 CrossRef CAS PubMed.
- S. Ramos-Terron, D. Alba-Molina, M. A. Varo, M. Cano, J. J. Giner-Casares and G. de Miguel, Nanoscale, 2021, 13, 14221–14227 RSC.
- S. Saris, V. Niemann, V. Mantella, A. Loiudice and R. Buonsanti, Nanoscale, 2019, 11, 19543–19550 RSC.
- C. Bi, S. Wang, Q. Li, S. V. Kershaw, J. Tian and A. L. Rogach, J. Phys. Chem. Lett., 2019, 10, 943–952 CrossRef CAS PubMed.
- V. Krivenkov, P. Samokhvalov, I. Nabiev and Y. P. Rakovich, J. Phys. Chem. Lett., 2020, 11, 8018–8025 CrossRef CAS PubMed.
- F. Zhang, H. Zhong, C. Chen, X. G. Wu, X. Hu, H. Huang, J. Han, B. Zou and Y. Dong, ACS Nano, 2015, 9, 4533–4542 CrossRef CAS PubMed.
- Y. Zu, J. Xi, L. Li, J. Dai, S. Wang, F. Yun, B. Jiao, H. Dong, X. Hou and Z. Wu, ACS Appl. Mater. Interfaces, 2020, 12, 2835–2841 CrossRef CAS PubMed.
- A. Sillen and Y. Engelborghs, Photochem. Photobiol., 1998, 67, 475–486 CrossRef CAS.
- S. C. Hsu, Y. M. Huang, C. P. Huang, T. Y. Lee, Y. Y. Cho, Y. H. Liu, A. Manikandan, Y. L. Chueh, T. M. Chen, H. C. Kuo and C. C. Lin, ACS Omega, 2021, 6, 2836–2845 CrossRef CAS PubMed.
- S. W. Dai, Y. L. Lai, L. Yang, Y. T. Chuang, G. H. Tan, S. W. Shen, Y. S. Huang, Y. C. Lo, T. H. Yeh, C. I. Wu, L. J. Chen, M. Y. Lu, K. T. Wong, S. W. Liu and H. W. Lin, ACS Appl. Mater. Interfaces, 2021, 13, 25202–25213 CrossRef CAS PubMed.
- J. De Roo, M. Ibanez, P. Geiregat, G. Nedelcu, W. Walravens, J. Maes, J. C. Martins, I. Van Driessche, M. V. Kovalenko and Z. Hens, ACS Nano, 2016, 10, 2071–2081 CrossRef CAS PubMed.
- J. Xue, J.-W. Lee, Z. Dai, R. Wang, S. Nuryyeva, M. E. Liao, S.-Y. Chang, L. Meng, D. Meng, P. Sun, O. Lin, M. S. Goorsky and Y. Yang, Joule, 2018, 2, 1866–1878 CrossRef CAS.
- Y. J. Park, S. Y. Park and I. In, J. Ind. Eng. Chem., 2011, 17, 298–303 CrossRef CAS.
Footnote |
| † Electronic supplementary information (ESI) available. See DOI: https://doi.org/10.1039/d3na01078c |
| This journal is © The Royal Society of Chemistry 2024 |

