 Open Access Article
Creative Commons Attribution 3.0 Unported Licence
Retracted Article: Sequestration of chromium(VI) and nickel(II) heavy metals from unhygienic water via sustainable and innovative magnetic nanotechnology†
Noor
Zulfiqar
 *a,
Monireh
Shariatipour
b and
Fawad
Inam
 cd
cd
aDepartment of Chemistry, Faculty of Science, University of Agriculture, Faisalabad, Pakistan. E-mail: chemistnoor94@gmail.com; 2018ag3898@uaf.edu.pk
bDepartment of Chemistry, Faculty of Science, Tarbiat Modares University, Tehran, Iran
cSchool of Architecture, Computing and Engineering, University of East London, EB 1.102 Docklands Campus, University Way, London, E16 2RD, UK
dExecutive Principal Office, Oxford Business College, 23-38 Hythe Bridge Street, Oxford, OX1 2EP, UK
First published on 24th November 2023
Abstract
In a stride towards sustainable solutions, this research endeavors to address the critical issue of water pollution via heavy metals by coupling the power of magnetic nanotechnology, in combination with a green chemistry approach, to eliminate two noxious inorganic pollutants: chromium(VI) and nickel(II) from aqueous environments. The synthesis of magnetite (Fe3O4) nanoparticles was achieved using ferric chloride hexahydrate (FeCl3·6H2O) as a precursor, with the assistance of Ziziphus mauritiana Lam. leaves extract, known for its remarkable salt-reducing properties. A range of bio-adsorbents, derived from corncob biomass, corncob pyrolyzed biochar, and magnetite/corncob biochar nanocomposite (NC), were engineered for their eco-friendly and biocompatible characteristics. Extensive parametric optimizations, including variations in pH, contact time, dose rate, and concentration, were carried out to gain insights into the adsorption behavior and capacity of these bioadsorbents concerning Cr(VI) and Ni(II). Equilibrium and kinetic studies were undertaken to comprehensively understand the adsorption dynamics. In the case of Ni(II), the Freundlich isotherm model provided a satisfactory fit for all bio-adsorbents, demonstrating R2 values of 0.91, 0.95, and 0.96 for BM, BC, and NC, respectively. Furthermore, the pseudo 1st order model emerged as the most suitable fit for Cr(VI) sequestration in corncob BM with an R2 value of 0.98, while pseudo 2nd order models were robustly fitted for BC and NC, yielding R2 values of 0.88 and 0.99, respectively. The magnetite/corncob nanocomposite outperformed other bioadsorbents in removing heavy metals from wastewater due to its environmental friendliness, larger surface area, reusability, and cost-effectiveness at an industrial scale.
1. Introduction
Aquatic pollution, stemming from industrialization, poses a significant threat to ecosystems.1 Addressing this issue through water treatment is crucial.2 Water systems receive substantial amounts of harmful pollutants, including heavy metals, antibiotics, and dyes, which can permeate the entire ecosystem.3 Human activities introduce metallic ions into aquatic environments and the food web.4 Even trace amounts of heavy metals in water can be toxic to organisms, as these substances are not biodegradable and are soluble in aqueous mediums.5 Heavy metals toxicity cause diseases like brain disorders, joint and muscle pain, gastro, intestinal and eye-sight problems.6 A number of methods are applied for the removal of heavy metals from water inclusive of evaporation, coagulation, membrane separation, ion exchange, electro deposition, precipitation,7 electro dialysis, ultrafiltration,1 and flocculation.3 Conventional methods are expensive, greater extent of energy and reagents are required. Because the amount of heavy metals in water is incredibly low i.e. less than 100 ppm, that's why, these conventional procedures do not produce noticeable results. In case of heavy metal removal from aqueous medium bio-adsorption outcomes are astonishing. Bio-adsorption is stated as a physio-chemical method in which bio materials are employed for the elimination of substances from aqueous mediums.7 In addition, it is a biocompatible, simple process, cheap (due to easy availability of agrowaste)1 and works under the sludge free conditions.8–10 Adsorbents can be recycled by desorption process for further use.11,12 Biomaterials from industrial and agricultural sector can be used as bio-adsorbents,13,14 peanut shells, soybean hulls, corncobs,15 microalgae biomass is also reported.16 Isolation of heavy metals including Cs, Pb, Cu, Ni and As is reported by pine cone as bio-adsorbent.17 Corncobs3 and carboxyl modified cornstalk has also been reported as bio-adsorbent for retrieval of Ga(III).18Iron oxides are classified as antiferromagnetic hematite (Fe2O3), paramagnetic, ferromagnetic maghemite, super-magnetic magnetite (Fe3O4) and orthorhombic structures.19 Magnetite NPs have outstanding properties like synthesized cheaply and easily, have small size, high magnetism, biocompatible, microwave absorption properties,20 surface chemical properties, catalytic properties, better stability and can be recovered easily by using external magnet.21 These properties widen the applications of magnetite nanoparticles i.e. biomedical applications containing diagnosis, bio-imaging, drug delivery, gene delivery, tumor therapy, cell separation,22 disciplines including physics, chemistry, industry, medicine, material sciences,20 hard drives for storage of data, degradation of dyes, environmental bioremediation,19 water pollution removal of organic and inorganic contaminants.23
Ziziphus mauritiana (Ber) fruit contains vitamin A, C and B complexes along with minerals. Its leaves contain 5.6% digestible crude protein and 49.7% of total digestible nutrients. Extract of Ziziphus mauritiana leaves have medicinal importance and theses are used to cure cuts and wounds and in various remedies.24 Magnetite nanoparticles fabricated by using Ziziphus mauritiana leaf extract and their nanocomposite with corncob are assumed to have effective bio-adsorption properties against heavy metal removal from aqueous solution. The goal of this research is to fabricate magnetite/corncob nanocomposites from biochar and magnetic NPs. Biochar is defined as pyrogenic carbon prepared by thermal conversion of lignocellulose biomass in an atmosphere of oxygen free or limited oxygen. Pristine biochars have low adsorption values.25 Agglomeration of magnetite nanoparticles leads to formation of aggregates. These aggregates inhibits the reactivity and mass transfer kinetics of magnetite NP's.26 Hence, composite fabrication by combining magnetite NPs and biochar is a good technique for the adsorptive removal of heavy metals.17 As reported by D. Kołodyńska et al.,27 Fe3O4 nanocomposite shows good adsorption capacities of phosphates i.e. 7.5% (for pristine biochar) to 67.3%.
2. Materials and methods
2.1. Materials and chemicals
Ziziphus mauritiana leaves were collected for synthesis of extract, while corncobs from a local marketplace served for biomass and biochar preparation. Chemicals, including ferric chloride hexahydrate (FeCl3·6H2O), sodium hydroxide (NaOH), hydrochloric acid (HCl), Acetone, and Ethanol, were used without further refinement as they were of analytical grade. An electronic balance (0.1–320 g range) was utilized for precise measurements. Bio-adsorption experiments for heavy metals were conducted in an orbital shaker (300 rpm) at room temperature in titration flasks, with pH maintained using a HANNA pH 20 pH meter. Manual sieving through a nano-range sieve yielded magnetite/corncob biochar nanocomposite nano powder.2.2. Synthesis of corncob biomass and biochar
Corncobs were sourced from a nearby market for this study. To eliminate impurities, the corncobs underwent a thorough rinsing with deionized water. Afterward, they were dried in an oven until a constant weight was achieved. The corncobs were initially crushed to a specific size using an iron pestle and mortar, and further grinding was performed until a consistent particle size was attained. Approximately 200 grams of processed biomass were prepared for pyrolysis. A muffle furnace was employed to carbonize corncobs under restricted oxygen conditions at a temperature of 700 °C, a process lasting approximately 5 hours.2.3. Plant leaves extract mediated magnetite nanoparticle synthesis
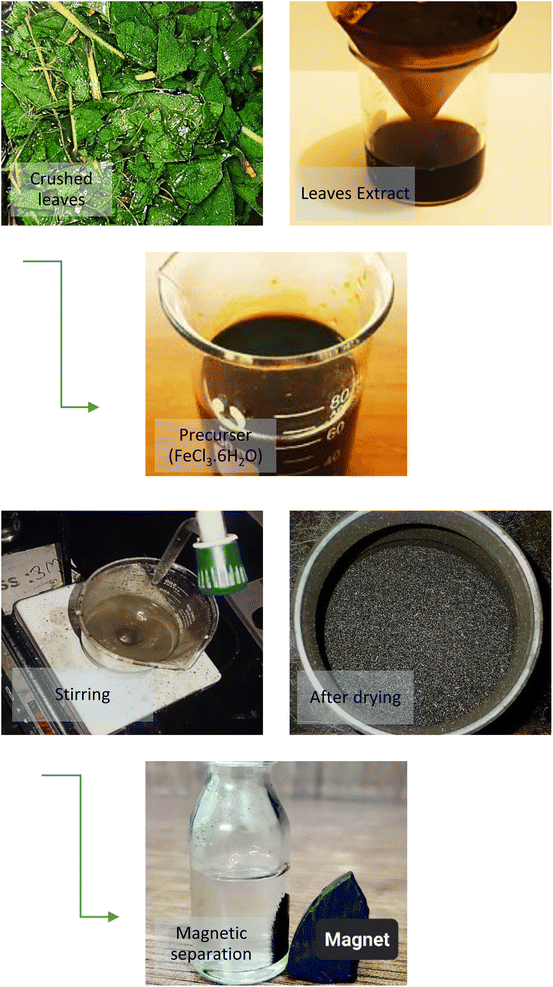
Approximately 20–30 grams of Ziziphus mauritiana Lam. plant leaves were washed and immersed in 400 mL of deionized water within a 500 mL beaker. After one hour of soaking at 80 °C, the plant leaf extract was filtered and stored at low temperature. Magnetite nanoparticles were synthesized by combining FeCl3·6H2O sonicated solution with the leaf extract and heating at 70 °C for 2 hours with constant magnetic stirring. KOH (1 M) maintained the reaction pH until it turned black. The temperature was then increased to 90 °C. Precipitates were separated using an external magnet and dried for 24 hours at 60 °C, followed by storage in an airtight container for future use (Fig. 1).20,282.4. Magnetite/corncob biochar NC synthesis
The corncob biochar, processed into nano-sized powder, was sifted through a nano-sieve. A ratio of 1![[thin space (1/6-em)]](https://www.rsc.org/images/entities/char_2009.gif) :
:![[thin space (1/6-em)]](https://www.rsc.org/images/entities/char_2009.gif) 5 was maintained for the magnetite/corncob nanocomposite. The 1
5 was maintained for the magnetite/corncob nanocomposite. The 1![[thin space (1/6-em)]](https://www.rsc.org/images/entities/char_2009.gif) :
:![[thin space (1/6-em)]](https://www.rsc.org/images/entities/char_2009.gif) 5 ratios for the magnetite/corncob nanocomposite was maintained to optimize structural stability and enhance the synergistic effects of magnetic responsiveness and adsorption capacity. This specific ratio ensures an efficient balance between the magnetic properties of magnetite and the surface area provided by corncob, resulting in an effective composite for the removal of chromium(VI) and nickel(II) from unhygienic water sources. Two grams of magnetite nanoparticles were combined with distilled water to create a suspension. Ten grams of the nano-powder were then added to the suspension, and the setup was placed in a shaker at 313 rpm for 4 hours at 25 °C. Using an external magnet, the magnetite/corncob nanocomposite settled, allowing the removal of the upper water phase. The residue was subsequently dried in an oven, and the solid nanocomposite was stored in airtight containers for future use.29
5 ratios for the magnetite/corncob nanocomposite was maintained to optimize structural stability and enhance the synergistic effects of magnetic responsiveness and adsorption capacity. This specific ratio ensures an efficient balance between the magnetic properties of magnetite and the surface area provided by corncob, resulting in an effective composite for the removal of chromium(VI) and nickel(II) from unhygienic water sources. Two grams of magnetite nanoparticles were combined with distilled water to create a suspension. Ten grams of the nano-powder were then added to the suspension, and the setup was placed in a shaker at 313 rpm for 4 hours at 25 °C. Using an external magnet, the magnetite/corncob nanocomposite settled, allowing the removal of the upper water phase. The residue was subsequently dried in an oven, and the solid nanocomposite was stored in airtight containers for future use.29
2.5. Stock solution preparation and batch biosorption studies
Stock solution of nickel(II) sulphate and potassium dichromate were prepared for parametric studies. 1000 ppm solutions of nickel(II) and chromium(VI) were prepared by dissolving 4.47 grams of nickel sulphate, and 5.65 grams of potassium dichromate into 1 litter of deionized water respectively. The study examined the relationship between initial heavy metal concentrations (10, 20, 40, 60, 80 ppm), contact times (30, 60, 120, 180, and 240 min), and dosing rates (0.05 to 0.1 grams). pH control was maintained with 1 molar solutions of sodium hydroxide and hydrochloric acid. The flasks were shaken continuously for 4 hours. Once the target values were attained, solutions of corncob biomass, corncob biochar, and magnetite/corncob biochar nanocomposites were filtered using filter paper.2.6. Study of equilibrium
| Ce/qe = 1/XmKL + Ce/Xm | (1) |
log![[thin space (1/6-em)]](https://www.rsc.org/images/entities/char_2009.gif) qe = 1/n qe = 1/n![[thin space (1/6-em)]](https://www.rsc.org/images/entities/char_2009.gif) log log![[thin space (1/6-em)]](https://www.rsc.org/images/entities/char_2009.gif) Ce + log Ce + log![[thin space (1/6-em)]](https://www.rsc.org/images/entities/char_2009.gif) Kf Kf | (2) |
The ability of adsorbent's adsorption is represented by the Kf value, and the value of 1/n less than one or n (dimensionless constant) greater than one indicates that drug ions can be easily separated and that the insertion of multiple layer ions from the liquid is preferred. A low 1/n rating indicates high throughput and high interaction between adsorbent and heavy metal. The Freundlich isotherm defines improper sorption in different areas, which suggests that binding sites are unequal and independent.32
2.7. Kinetic modelling
qt/qe + ln(qe − qt) = ln![[thin space (1/6-em)]](https://www.rsc.org/images/entities/char_2009.gif) qe − k1t qe − k1t | (3) |
The rate is assumed to be equal to the number of vacant posts in the model. The first order k1 and the estimated adsorption capacity were calculated using the slopes and subtitle of the log section (qe − q) vs. t.
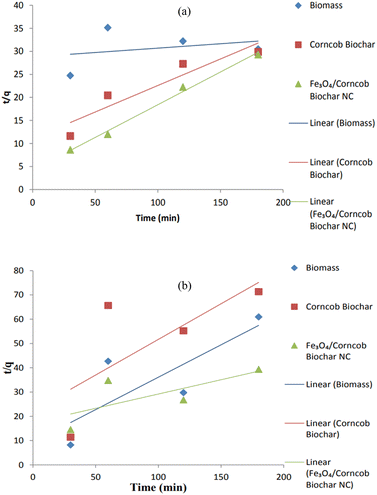
| t/q = 1/K2q2e + 1/qet | (4) |
2.8. Characterization methods and equipment used
In the research focused on the sequestration of chromium(VI) and nickel(II) heavy metals various analytical techniques were employed with specific quantitative parameters. X-ray diffraction (XRD) utilized a resolution of approximately 0.02° 2θ, an angular range covering 10 to 90° 2θ, and a step size set at increments of 0.02°, ensuring precise crystal structure identification. Scanning Electron Microscopy (SEM) and Transmission Electron Microscopy (TEM) involved an accelerating voltage ranging from 5 to 30 kV, magnification extending from 10× to 1![[thin space (1/6-em)]](https://www.rsc.org/images/entities/char_2009.gif) 000
000![[thin space (1/6-em)]](https://www.rsc.org/images/entities/char_2009.gif) 00× or higher, and a resolution at the sub-nanometer to a few nanometers scale, influencing the level of detail and depth of field in imaging. Fourier-Transform Infrared Spectroscopy (FTIR) employed a spectral resolution of 4 cm−1 or better and a wavenumber range spanning from 4000 to 400 cm−1, facilitating the differentiation of functional groups. These quantitative analytical parameters were pivotal in ensuring the accuracy and precision of the measurements, contributing to a thorough characterization of the magnetite/corncob nanocomposite's structural and functional properties in the successful removal of chromium(VI) and nickel(II) from contaminated water.
00× or higher, and a resolution at the sub-nanometer to a few nanometers scale, influencing the level of detail and depth of field in imaging. Fourier-Transform Infrared Spectroscopy (FTIR) employed a spectral resolution of 4 cm−1 or better and a wavenumber range spanning from 4000 to 400 cm−1, facilitating the differentiation of functional groups. These quantitative analytical parameters were pivotal in ensuring the accuracy and precision of the measurements, contributing to a thorough characterization of the magnetite/corncob nanocomposite's structural and functional properties in the successful removal of chromium(VI) and nickel(II) from contaminated water.
3. Results and discussion
3.1. Characterization of bioadsorbent
![[thin space (1/6-em)]](https://www.rsc.org/images/entities/char_2009.gif) :
:![[thin space (1/6-em)]](https://www.rsc.org/images/entities/char_2009.gif) 1 molar ratio of iron(III) to iron(II) used in the coating process strongly suggests magnetite synthesis, prompting a modification of the molar ratio employed in this study to better align with the 2
1 molar ratio of iron(III) to iron(II) used in the coating process strongly suggests magnetite synthesis, prompting a modification of the molar ratio employed in this study to better align with the 2![[thin space (1/6-em)]](https://www.rsc.org/images/entities/char_2009.gif) :
:![[thin space (1/6-em)]](https://www.rsc.org/images/entities/char_2009.gif) 1 ratio characteristic of magnetite. XRD confirmed the mean size of NPs approximately ∼8 and ∼9 nm. The lines are consistent according to the JCPDS no. 03-0863. Furthermore, a magnetic affinity test using a magnet demonstrated a significant attraction, further supporting the likelihood of magnetite production.33 Compared to literature an average size of 13.6 nm was reported in the previous research on magnetic nanoparticles.34
1 ratio characteristic of magnetite. XRD confirmed the mean size of NPs approximately ∼8 and ∼9 nm. The lines are consistent according to the JCPDS no. 03-0863. Furthermore, a magnetic affinity test using a magnet demonstrated a significant attraction, further supporting the likelihood of magnetite production.33 Compared to literature an average size of 13.6 nm was reported in the previous research on magnetic nanoparticles.34
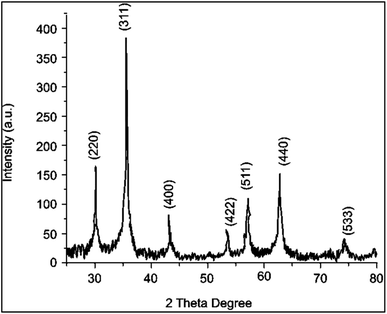 | ||
| Fig. 2 X-ray powder diffraction of biochar with an iron coating. Miller indices are shown above magnetite identification peaks. | ||
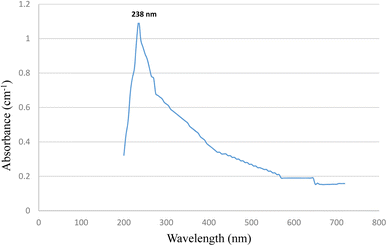
Confirmation of magnetite NPs in the first step was done by using UV-VIS equipment. To analyze the optical properties of the synthesized Fe3O4 nanoparticles, a clear colloidal solution was prepared. This solution was obtained through a 30 minute sonication process, wherein Fe3O4 nanoparticles were dispersed in de-ionized water. As a reference, pure de-ionized water was employed. The ensuing absorbance spectrum revealed significant absorption within the visible range of the electromagnetic spectrum. Notably, a distinct absorption peak was conspicuously observed at a wavelength of 238 nanometers (nm). Within this spectral region, the black-colored Fe3O4 nanoparticles exhibited a remarkable and rather broad absorption profile. This spectral analysis serves as a crucial component in understanding the optical characteristics and potential applications of these nanoparticles.35,36 The scanning range adjusted for absorption was 350–550 nm. Magnetite NPs have been conformed ranging from 200–600 nm area as depicted in most of literature. The following UV-VIS conformation is in accordance with literature.35,36 UV spectrum is shown in Fig. 3.
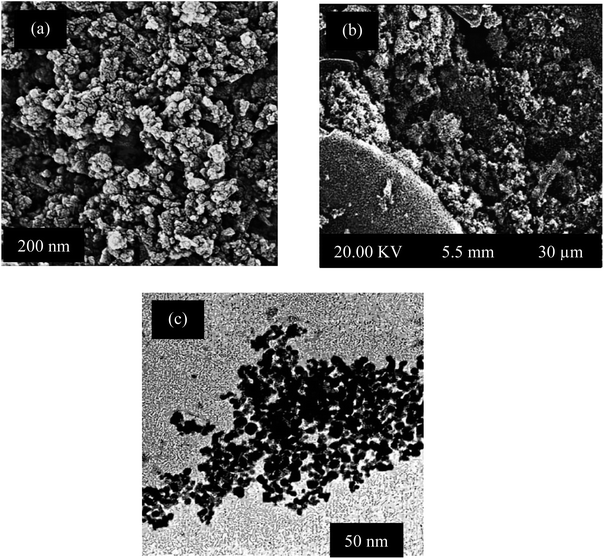 | ||
| Fig. 4 Scanning electron microscopy (SEM) images of Fe3O4 NPs and magnetite/corncob biochar (a), and (b) and (c) TEM images respectively. | ||
TEM analysis further confirmed the nanoscale dimensions, with a representative nanoparticle size of 17 ± 3.49 nm. Moreover, TEM micrographs unveiled fine surface features and agglomeration patterns, underscoring the nanoparticles' polydispersity. Contrast variations in TEM images hint at potential core–shell structures within certain nanoparticles. The clustering observed in Fig. 4(c) may be attributed to molecules from the environment adhering to the nanoparticle surface, seeking a state of equilibrium in intermolecular forces.
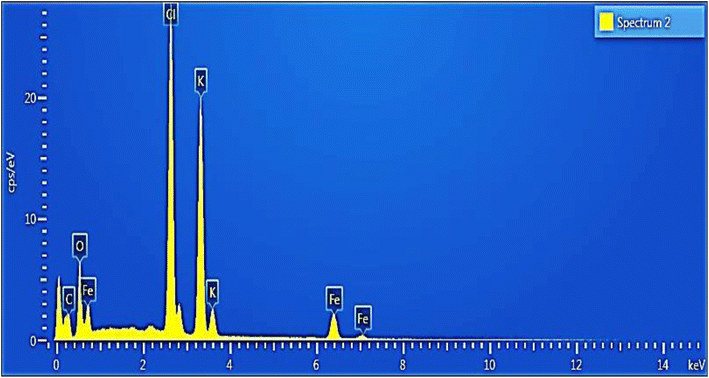
Fig. 5 displays the EDX spectrum of magnetite nanoparticles (NPs), where all detected peaks correspond to the K series. Notably, the spectrum distinctly exhibits peaks for iron (Fe) and oxygen (O). An elemental analysis conducted via EDX reveals that iron accounts for approximately 11.26% of the total weight of the magnetite NPs, while oxygen constitutes around 24.19% of the total weight. Additionally, other elements including carbon (C) at 11.7%, chlorine (Cl) at 25.98%, and potassium (K) at 26.87% are also present in the sample, likely originating from the organic compounds used in the coating process.
![[double bond, length as m-dash]](https://www.rsc.org/images/entities/char_e001.gif) C– or carbonyl functionalities owing to biomolecules. Magnetite shows very sharp band which is characteristic peak for the Fe–O vibrations.39 This FT-IR spectrum is in accordance with previous studies.35,40
C– or carbonyl functionalities owing to biomolecules. Magnetite shows very sharp band which is characteristic peak for the Fe–O vibrations.39 This FT-IR spectrum is in accordance with previous studies.35,40
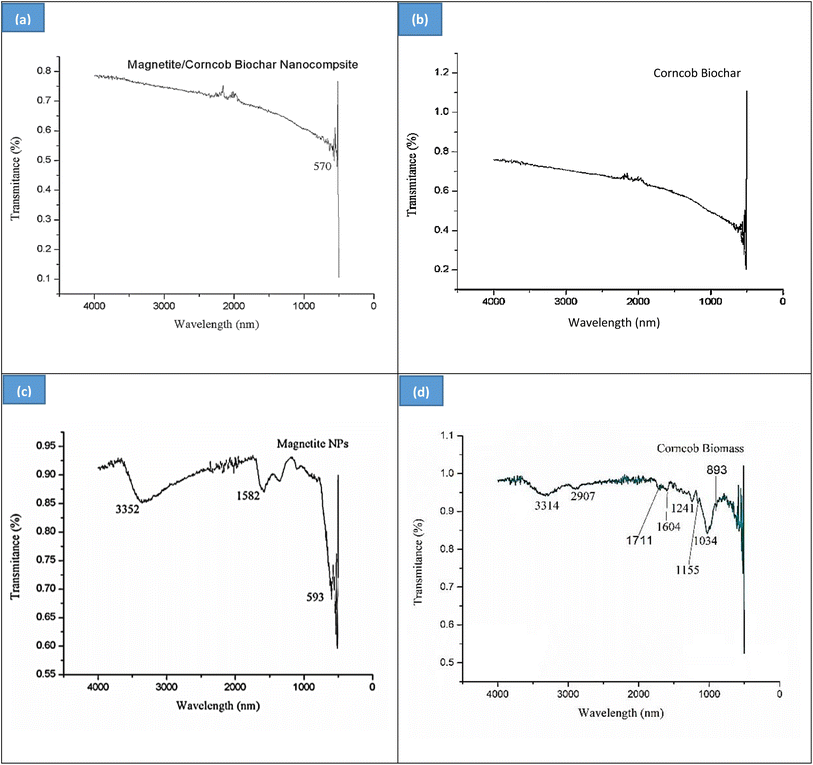 | ||
| Fig. 7 FT-IR (a) spectra of magnetite/corncob biochar nanocomposite, (b) corncob biochar, (c) Fe3O4 NPs, and (d) raw corncob biomass respectively. | ||
Peaks at 893 cm−1 and 1034 cm−1 are identifying β-(1–4) glycosydic linkage. Most of small peaks in between 1250–1600 cm−1 are representing presence of cellulose. The primary OH of cellulose represents a specific plane bending at 1155 cm−1 of C–O–H. Hemicellulose shows a specific peak at 1711 cm−1. Peaks near 1600 and at 1604 cm−1 represents the aromatic presence of lignin. 2907 cm−1 is the stretching vibration of C–H bond in cellulose. 3314 cm−1 depicts the O–H functionality of cellulose and hemicellulose. FT-IR of raw corncob under this study show resemblance with literature.41–43
3.2. Optimization of process parameters
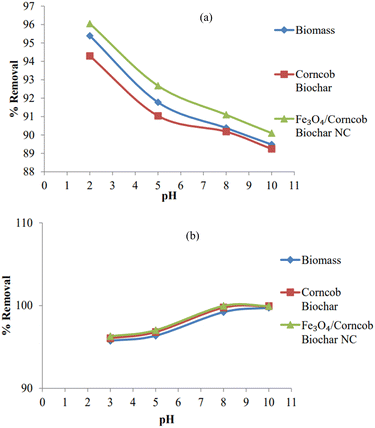
In the case of nickel(II), in an acidic environment at pH 3, all adsorbents exhibited excellent uptake capacity (q = 95 mg L−1) and 95% removal. However, as the pH increased to 5, 8, and 10, a notable increase in both removal percentage and uptake capacity was observed, particularly in alkaline conditions. The transition from pH 8 to 10 indicated equilibrium. This trend may be attributed to the competition between hydrogen ions and heavy metal ions for active sites on the adsorbent surface, leading to reduced efficiency of pollutant ion adsorption at lower pH levels. Conversely, at elevated pH levels, the surfaces of biomass, biochar, and nanocomposites acquired a net negative charge, enhancing Ni2+ ion adsorption through electrostatic interactions. Additionally, within this pH range, the precipitation of Ni (OH)2 on the biochar surfaces further contributed to the significant removal of Ni2+ ions from the solution.28Fig. 8 shows the effect of pH on adsorption of (a) chromium(IV) and (b) nickel(II) respectively.
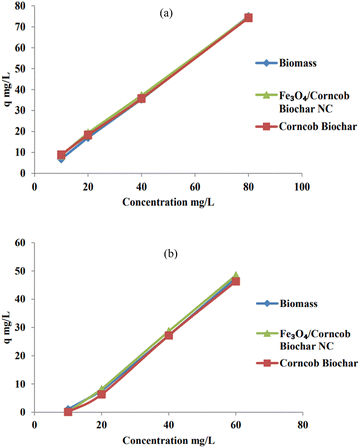
The variance in the adsorption of chromium(VI) ions on the activated carbon samples can be attributed to differences in surface area and total pore volume. As the concentration of Cr(VI) ions increases, active sites on the surface become saturated with these ions, resulting in a higher uptake of metal ions from the solution. Additionally, higher initial Cr(VI) concentrations enhance the interaction between Cr(VI) ions in the aqueous phase and the surface of the biomass, leading to a more efficient uptake of Cr(VI) for a given quantity of biomass.9 To explore the impact of the initial concentration of Ni(II) ions in solution, concentrations of 10 ppm, 20 ppm, 40 ppm, and 80 ppm were prepared. The quantity of adsorbent used is directly linked to this parameter optimization. Specifically, 0.1 gram of adsorbent yielded q values ranging from 6.90 to 74.94 as the initial concentration increased. Adsorbents with higher surface areas and more available adsorption sites displayed a q value of 74 mg g−1 for the 80 ppm solution. Considering this parameter, corncob was identified as an effective adsorbent for Ni(II) ions. Fig. 9 demonstrates the effect of initial Concentration on adsorption of (a) Ni(II) and (b) Cr(IV) respectively.
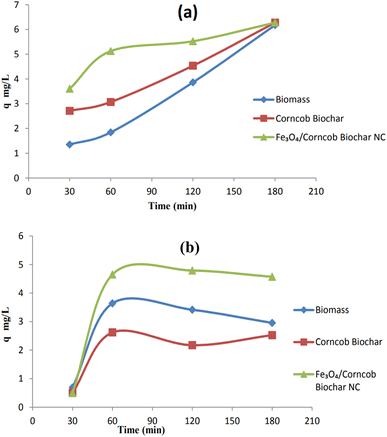
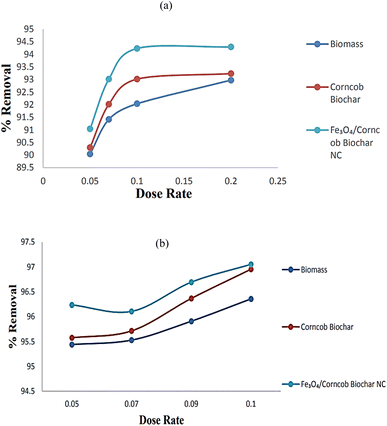
The nanocomposite exhibits superior uptake capacity and percentage removal (q = 96–97) within the range of 0.05 g to 0.1 g. Similarly, biomass and corncob biochar display similar trends. Notably, the uptake capacity does not significantly increase with higher doses of adsorbents. The initial assumption was that increasing the dose would enhance removal and uptake, but instead, there was only a marginal increase in nickel(II) removal. The effectiveness of nickel(II) removal is closely linked to the availability of active adsorption sites and the optimal adsorbent dosage. Increasing the amount of adsorbent up to a certain point increases the availability of adsorption sites, resulting in higher Ni(II) removal. However, if the adsorbent concentration is raised beyond this optimal level, the efficiency of Ni(II) removal tends to plateau or even decline. This phenomenon can be attributed to the saturation and crowding of adsorption sites, leading to reduced Ni(II) removal capacity.7Fig. 11 shows the effect of contact time on adsorption of (a) Cr(IV) and (b) Ni(II) respectively.
3.3. Equilibrium models for adsorption
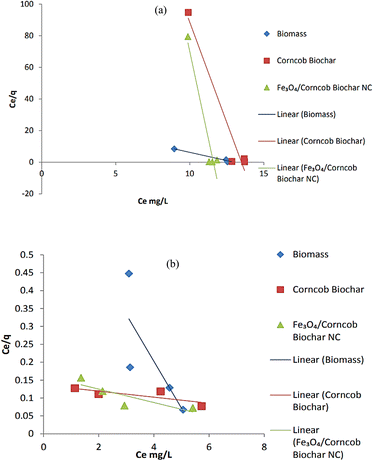
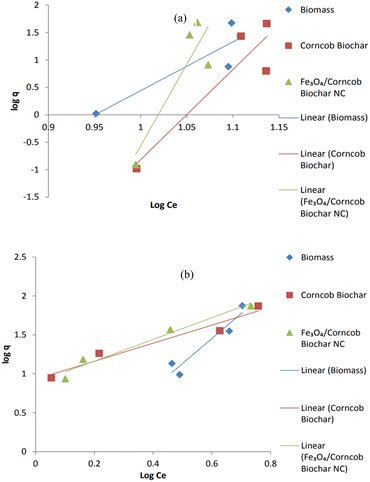
| Adsorbate | Adsorbent | Langmuir model | Experimental value q (mg g−1) | Freundlich model | |||||
|---|---|---|---|---|---|---|---|---|---|
| X m (mg g−1) | K L (L mg−1) | R 2 | q e (mg g−1) | 1/n | K F (mg g−1) | R 2 | |||
| Cr(VI) | Biomass | 0.47 | 0.07 | 0.98 | 47.45 | 2.5 × 10²¹ | 8.87 | 2.13 | 0.81 |
| Corncob biochar | 0.03 | 0.07 | 0.94 | 46.30 | 4.6 × 1040 | 16.42 | 2.84 | 0.84 | |
| Fe3O4/corncob biochar NC | 0.02 | 0.08 | 0.92 | 48.48 | 2.9 × 1070 | 29.71 | 3.41 | 0.78 | |
| Adsorbate | Adsorbent | Langmuir model | Experiment al value q (mg g−1) | Freundlich model | |||||
|---|---|---|---|---|---|---|---|---|---|
| X m (mg g−1) | K L (L mg−1) | R 2 | q e (mg g−1) | 1/n | K F (mg g−1) | R 2 | |||
| Ni(II) | Biomass | 7.65 | 0.18 | 0.47 | 74.94 | 145.17 | 3.2 | −0.74 | 0.91 |
| Corncob Biochar | 119.04 | 0.06 | 0.26 | 74.27 | 379.002 | 1.15 | −0.07 | 0.95 | |
| Fe3O4/corncob biochar NC | 53.47 | 0.11 | 0.010 | 74.59 | 588.12 | 1.39 | −0.12 | 0.96 | |
3.4. Kinetic studies of adsorption for Cr(IV) and Ni(II)
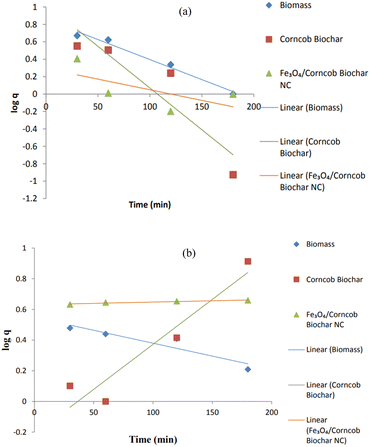
It was assumed that the rate of a certain process was directly related to the number of vacant sites within the model. To determine this relationship, we calculated two important parameters: the first-order rate constant (KL) and the equilibrium adsorption capacity (qe). These values were derived by analyzing the plot of the natural logarithm of (qe − q) against time (t), taking into account the slopes and intercepts. However, when we compared the R-squared (R2) values between the pseudo-first order and pseudo-second order kinetics for Cr(IV), we observed a significant difference. Specifically, the R2 values for the pseudo-first order kinetics were notably lower than those for the pseudo-second order kinetics. This discrepancy clearly indicates that the pseudo-first order kinetic equation is inadequate for accurately predicting the experimental adsorption capacity (qe × p) for NC.Corncob biomass showed R2 = 0.98 while corncob biochar also showed strong R2 = 0.84 assuming physical adsorption happening. Corncob biomass did not follow pseudo 2nd order (PSO) but corncob biochar and magnetite/corncob biochar NC both followed PSO with R2 = 0.88 and 0.99 respectively (Table 2). As surface modification cause changes in surface behaviors. Corncob biochar showed strong R2 value for both PFO and PSO. As corncob biochar was also the main component for magnetite/corncob biochar NC. These facts indicated that the 2nd order kinetic model which was predicted on assumption that adsorption might be a rate-limiting step process, does not accurately describe the adsorption of heavy metals.31,44 Pseudo 1st and 2nd order plots for (a) Cr(IV) and (b) Ni(II) are depicted in Fig. 15 and 16 respectively.
| Adsorbate | Adsorbent | Pseudo first order | Pseudo second order | |||||
|---|---|---|---|---|---|---|---|---|
| q e (mg g−1) | K 1ad (min−1) | R 2 | q exp (mg g−1) | q e (mg g−1) | K 2ad (mg g−1 min−1) | R 2 | ||
| Chromium(VI) | Biomass | 7.18 | 0.0019 | 0.98 | 5.90 | 52.63 | 1.3 × 10⁻⁵ | 0.08 |
| Corncob biochar | 10.64 | 0.0041 | 0.84 | 6.02 | 8.68 | 0.0012 | 0.88 | |
| Fe3O4/corncob biochar NC | 1.96 | 0.0010 | 0.41 | 6.14 | 7.04 | 0.0048 | 0.99 | |
| Adsorbate | Adsorbent | Pseudo first order | Pseudo second order | |||||
|---|---|---|---|---|---|---|---|---|
| q e (mg g−1) | K 1ad (min−1) | R 2 | q exp (mg g−1) | q e (mg g−1) | K 2ad (mg g−1 min−1) | R 2 | ||
| Ni(II) | Biomass | 3.53 | 0.00073 | 0.86 | 6.18 | 3.74 | 0.00756 | 0.64 |
| Corncob biochar | 1.63 | 0.0025 | 0.90 | 6.67 | 3.41 | 0.00385 | 0.51 | |
| Fe3O4/corncob biochar NC | 4.27 | 8.684 | 0.90 | 7.08 | 8.48 | 0.0008 | 0.51 | |
3.5. Differences between the removal capacity of Ni(II) and Cr(IV)
3.6. Specific surface area
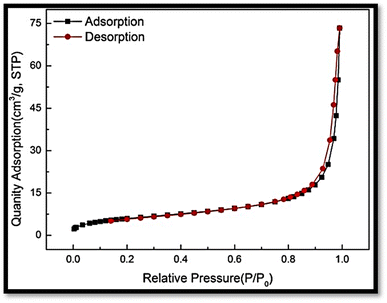
The BET surface area of the magnetic nanocomposite was determined to be 44.33 m2 g−1 in the relative pressure range from 0.0 to 1.0, indicating a favorable scenario for heavy metal removal. The relatively high surface area suggested abundant active sites available for adsorption, implying a substantial adsorption capacity and efficient removal of heavy metal ions from aqueous solutions (Fig. 17).3.7. Desorption test
Approximately 0.15 g each of biomass, biochar, and magnetite/corncob nanocomposite were individually introduced into 60 mL of a solution containing 60 mg L−1 heavy metals within a 300 mL flask. The solution's pH was adjusted to 3.21, 4.35, and 2.15 for biochar, biomass, and NC, respectively, corresponding to the pH at which maximum adsorption occurred for each. The mixture was stirred for 1 h, followed by centrifugation at 350 rpm for 40 min, and the remaining heavy metal concentration was measured at 500 nm. The metal-loaded adsorbents were rinsed with water, dried at 75 °C to complete dryness, and then immersed in 120 mL of water for the desorption process. After vigorous shaking for 40 min, centrifugation was performed, and the desorbed heavy metal concentration was determined by the following equation: | (5) |
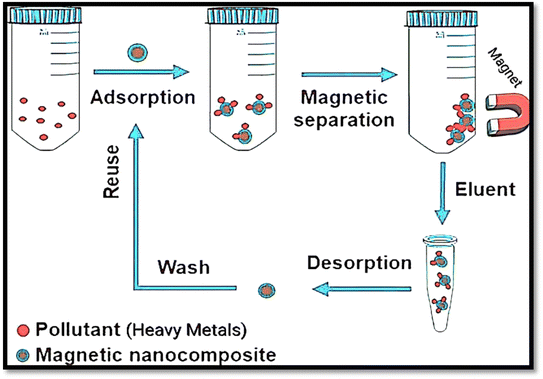
The percentage desorption sequence is biochar (89.24%) > NC (82.36%) > biomass (67.45%). Desorption exceeding 80% suggests that biochar and NC can be readily regenerated for additional adsorption cycles. The relatively higher desorption percentages for biochar and NC imply a weak bond between heavy metals and these materials, indicative of physiosorption. Conversely, the lower desorption percentage for biomass suggests a strong chemical adsorption process with heavy metals tightly bonded to the biomass (Fig. 18).
3.8. Innovation
This research introduces a groundbreaking innovation in the field of heavy metal remediation by employing a green chemistry approach for the synthesis of a magnetite nanocomposite. The key innovation lies in the utilization of Ziziphus Mauritania Lam. leaves extract to facilitate the reduction of FeCl3·6H2O salt, resulting in the eco-friendly synthesis of magnetite nanoparticles (NPs). These NPs are then ingeniously incorporated into finely powdered and pyrolyzed corncob biochar, forming a novel nanocomposite material.The use of magnetite nanocomposites represents a significant advancement over traditional adsorbents. The integration of magnetite NPs within the corncob biochar matrix enhances the adsorption efficiency for toxic pollutants such as chromium(VI) and nickel(II). The nanocomposite exhibits several distinctive features, including a larger surface area, which enhances adsorption capacity, and a sustainable synthesis process that utilizes natural extracts, aligning with the principles of green chemistry.
Furthermore, the study provides a comprehensive understanding of the adsorption kinetics and equilibrium of chromium(VI) and nickel(II) on the developed nanocomposite. The application of kinetic models and isotherm studies contributes to the innovative design of an adsorbent tailored for optimal heavy metal removal efficiency. The synthesized nanocomposite's remarkable performance, coupled with its environmental friendliness, reusability, and cost-effectiveness at an industrial scale, positions it as a pioneering solution for addressing heavy metal contamination in wastewater. This innovation opens new avenues for sustainable water treatment technologies, emphasizing the potential of magnetite nanocomposites as a transformative approach in the realm of environmental remediation.
4. Conclusion
This research exploited green chemistry approach to engineer magnetite nanoparticles for effectively trapping chromium(VI) and nickel(II) from unhygienic water. These nanoparticles seamlessly integrated with finely powdered and pyrolyzed corncob biochar in a 5![[thin space (1/6-em)]](https://www.rsc.org/images/entities/char_2009.gif) :
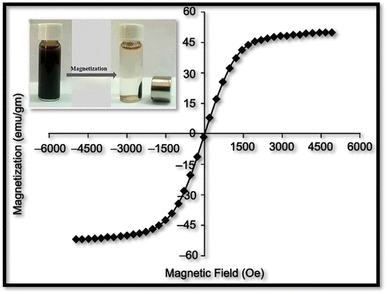
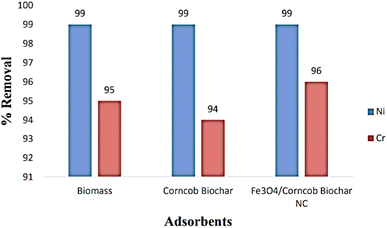
:![[thin space (1/6-em)]](https://www.rsc.org/images/entities/char_2009.gif) 1 ratio, forming a potent nanocomposite. Our comprehensive analysis, spanning UV-vis spectroscopy, FT-IR, SEM, TEM, and EDX, validated the successful synthesis. Conclusively, the analysis affirmed the nanoscale dimensions, indicating a nanoparticle size of 17 ± 3.49 nm. The VSM analysis revealed a saturation magnetization (Ms) value of 45 emu g−1, confirming vigorous magnetic behavior in the nanoparticles. Equilibrium and kinetic studies provided valuable insights into the adsorption process. For Cr(VI), the adsorption data closely adhered to the pseudo 1st order model for corncob biomass, while biochar and nanocomposite exhibited strong adherence to the pseudo 2nd order model. In case of Ni(II) the suitability of the Freundlich isotherm model was observed to be effective for all bio-adsorbents. The magnetic nanocomposite exhibited a BET surface area of 44.33 m2 g−1 and demonstrated a comparatively higher adsorptive removal capacity of 99% for Ni and 96% for Cr. In conclusion, all tested adsorbents displayed promising results. However, the nanocomposites emerged as heavy metal removal champions, offering expansive surface area, reusability, cost-effectiveness, and remarkable efficacy against both pollutants. This breakthrough positions magnetic nanocomposites as the future frontier for scalable, eco-conscious industrial applications..
1 ratio, forming a potent nanocomposite. Our comprehensive analysis, spanning UV-vis spectroscopy, FT-IR, SEM, TEM, and EDX, validated the successful synthesis. Conclusively, the analysis affirmed the nanoscale dimensions, indicating a nanoparticle size of 17 ± 3.49 nm. The VSM analysis revealed a saturation magnetization (Ms) value of 45 emu g−1, confirming vigorous magnetic behavior in the nanoparticles. Equilibrium and kinetic studies provided valuable insights into the adsorption process. For Cr(VI), the adsorption data closely adhered to the pseudo 1st order model for corncob biomass, while biochar and nanocomposite exhibited strong adherence to the pseudo 2nd order model. In case of Ni(II) the suitability of the Freundlich isotherm model was observed to be effective for all bio-adsorbents. The magnetic nanocomposite exhibited a BET surface area of 44.33 m2 g−1 and demonstrated a comparatively higher adsorptive removal capacity of 99% for Ni and 96% for Cr. In conclusion, all tested adsorbents displayed promising results. However, the nanocomposites emerged as heavy metal removal champions, offering expansive surface area, reusability, cost-effectiveness, and remarkable efficacy against both pollutants. This breakthrough positions magnetic nanocomposites as the future frontier for scalable, eco-conscious industrial applications..
Conflicts of interest
There are no conflicts to declare.References
- M. Basu, A. K. Guha and L. Ray, J. Cleaner Prod., 2017, 151, 603–615 CAS.
- G. Vilardi, L. Di Palma and N. Verdone, Chin. J. Chem. Eng., 2018, 26, 455–464 CAS.
- L. Zheng, D. Peng and P. Meng, Colloids Surf., A, 2019, 561, 109–119 CAS.
- N. Blagojev, D. Kukić, V. Vasić, M. Šćiban, J. Prodanović and O. Bera, J. Hazard. Mater., 2019, 363, 366–375 CAS.
- G. Vilardi, J. M. Ochando-Pulido, N. Verdone, M. Stoller and L. Di Palma, J. Cleaner Prod., 2018, 190, 200–210 CAS.
- V. Gupta, J. Sandesh and N. Chandra, Int. J. Sci. Res. Sci. Eng. Technol., 2018, 5, 169–174 Search PubMed.
- N. E. Ibisi and C. A. Asoluka, Chem. Int., 2018, 4, 52–59 CAS.
- J. Xu, Z. Cao, Y. Zhang, Z. Yuan, Z. Lou, X. Xu and X. Wang, Chemosphere, 2018, 195, 351–364 CAS.
- A. E. Burakov, E. V. Galunin, I. V. Burakova, A. E. Kucherova, S. Agarwal, A. G. Tkachev and V. K. Gupta, Ecotoxicol. Environ. Saf., 2018, 148, 702–712 CAS.
- A. Ali, K. Saeed and F. Mabood, Alexandria Eng. J., 2016, 55, 2933–2942 Search PubMed.
- M. Hua, S. Zhang, B. Pan, W. Zhang, L. Lv and Q. Zhang, J. Hazard. Mater., 2012, 211, 317–331 Search PubMed.
- S. Yu, X. Wang, H. Pang, R. Zhang, W. Song, D. Fu, T. Hayat and X. Wang, Chem. Eng. J., 2018, 333, 343–360 CAS.
- N. Ünlü and M. Ersoz, J. Hazard. Mater. B, 2006, 136, 272–280 Search PubMed.
- Ç. Kırbıyık, A. E. Pütün and E. Pütün, Water Sci. Technol., 2016, 73, 423–436 Search PubMed.
- C. R. T. Tarley and M. A. Z. Arruda, Chemosphere, 2004, 54, 987–995 Search PubMed.
- G. Ç. Dönmez, Z. Aksu, A. Öztürk and T. Kutsal, Process Biochem., 1999, 34, 885–892 Search PubMed.
- I. L. Ouma, E. B. Naidoo and A. E. Ofomaja, J. Environ. Chem. Eng., 2018, 6, 5409–5419 CAS.
- Y. Zhang, L. Zhu, Y. Wang, Z. Lou, W. Shan, Y. Xiong and Y. Fan, J. Taiwan Inst. Chem. Eng., 2018, 91, 291–298 CAS.
- J. K. Patra and K.-H. Baek, J. Photochem. Photobiol., B, 2017, 173, 291–300 CAS.
- S. Venkateswarlu, Y. S. Rao, T. Balaji, B. Prathima and N. Jyothi, Arabian J. Chem., 2013, 100, 241–244 CAS.
- M. Nasrollahzadeh, S. M. Sajadi, A. Rostami-Vartooni and M. Khalaj, J. Mol. Catal. A: Chem., 2015, 396, 31–39 CAS.
- A. A. Kajani and A.-K. Bordbar, J. Hazard. Mater., 2019, 366, 268–274 Search PubMed.
- C. Prasad, G. Yuvaraja and P. Venkateswarlu, J. Magn. Magn. Mater., 2017, 424, 376–381 CAS.
- R. K. Verma, M. Pandey, M. D. Indoria, R. Singh and S. Suthar, Trop. J. Pharm. Life Sci., 2018, 5, 08–18 Search PubMed.
- S. Wang, B. Gao, Y. Li, A. Mosa, A. R. Zimmerman, L. Q. Ma, W. G. Harris and K. W. Migliaccio, Bioresour. Technol., 2015, 181, 13–17 CAS.
- F. Yang, S. Zhang, Y. Sun, Q. Du, J. Song and D. C. Tsang, Bioresour. Technol., 2019, 274, 379–385 CAS.
- D. Kołodyńska, J. Bąk, M. Kozioł and L. Pylychuk, Nanoscale Res. Lett., 2017, 12, 433 Search PubMed.
- R. M. Al-Bahrani, S. M. A. Majeed, M. N. Owaid, A. B. Mohammed and D. A. Rheem, Acta Pharm. Sci., 2018, 56, 85–92 CAS.
- M. Zhang, B. Gao, S. Varnoosfaderani, A. Hebard, Y. Yao and M. Inyang, Bioresour. Technol., 2013, 130, 457–462 CAS.
- V. Vimal, M. Patel and D. Mohan, RSC Adv., 2019, 9, 26338–26350 CAS.
- M. Kobya, Adsorpt. Sci. Technol., 2004, 22, 51–64 CAS.
- Y. Bulut and H. Aydın, Desalination, 2006, 194, 259–267 CAS.
- H. Cederlund, E. Börjesson, D. Lundberg and J. Stenström, Water, Air, Soil Pollut., 2016, 227, 1–12 CAS.
- F. Y. Zhao, Y. L. Li and L. H. Li, Appl. Mech. Mater., 2014, 618, 24–27 CAS.
- V. A. R. Villegas, J. I. D. L. Ramírez, E. H. Guevara, S. P. Sicairos, L. A. H. Ayala and B. L. Sanchez, J. Saudi Chem. Soc., 2020, 24, 223–235 Search PubMed.
- H. M. Asoufi, T. M. Al-Antary and A. M. Awwad, J. Comput. Biol., 2018, 6, 9–16 Search PubMed.
- K. Petcharoen and A. Sirivat, Mater. Sci. Eng. B, 2012, 177, 421–427 CAS.
- S. Qu, F. Huang, S. Yu, G. Chen and J. Kong, J. Hazard. Mater., 2008, 160, 643–647 CAS.
- V. Alfredo Reyes Villegas, J. Isaías De León Ramírez, E. Hernandez Guevara, S. Perez Sicairos, L. Angelica Hurtado Ayala and B. Landeros Sanchez, J. Saudi Chem. Soc., 2020, 24, 223–235 CAS.
- V. Ranjithkumar, S. Sangeetha and S. Vairam, J. Hazard. Mater., 2014, 273, 127–135 CAS.
- A. Kumar, Y. Negi, V. Choudhary and N. Bhardwaj, J. Hazard. Mater., 2014, 2, 1–8 Search PubMed.
- L. Nalbandian, E. Patrikiadou, V. Zaspalis, A. Patrikidou, E. Hatzidaki and C. Papandreou, Curr. Nanosci., 2015, 12, 1 Search PubMed.
- O. M. Abd Almawgood, S. A. El Tohamy, E. H. Ismail and F. A. Samhan, Egypt. J. Chem., 2021, 64, 1293–1313 Search PubMed.
- A. Buthiyappan, J. Gopalan and A. A. A. Raman, J. Environ. Manage., 2019, 249, 109323 CAS.
Footnote |
| † Electronic supplementary information (ESI) available: Sustainability statement, water impact statement, calibration curves and table of bio-adsorbents utilized for sequestrating heavy metals. See DOI: https://doi.org/10.1039/d3na00923h |
| This journal is © The Royal Society of Chemistry 2024 |

