
 Open Access Article
 This Open Access Article is licensed under a Creative Commons Attribution-Non Commercial 3.0 Unported Licence
Liposome-coated nanoparticle triggers prostate cancer ferroptosis through synergetic chemodynamic-gas therapy†
Yingkai
Hong
ab,
Wenli
Hou
a,
Dehua
Ou
b,
Mingen
Lin
b,
Mayao
Luo
a and
Qiang
Wei
 *a
*a
aDepartment of Urology, Nanfang Hospital, Southern Medical University, Guangzhou, Guangdong 510515, China. E-mail: qwei@smu.edu.cn
bDepartment of Urology, The First Affiliated Hospital of Shantou University Medical College, 515000, China
First published on 19th December 2023
Abstract
Ferroptosis has attracted much attention for tumor treatment. It has been recently identified that castration-resistant prostate cancer (CRPC) is vulnerable to ferroptosis inducers. Notably, chemodynamic therapy (CDT), triggered by metal ions, could easily induce ferroptosis via a Fenton/Fenton-like reaction, but its efficiency was highly dependent on the intracellular H2O2 concentration, posing significant changes for its clinical translation. Herein, we attached glucose oxidase (GOx) onto the surface of manganese sulfide (MnS) and developed therapeutic nanocomposites (Lpo@MnS-GOx) after encapsulating with liposome. Upon internalization by cancer cells, the released GOx could transform glucose into gluconic acid (GA) and H2O2. Notably, the generated GA stimulates the degradation of MnS, followed by the promotion of the release of H2S and Mn2+, whereas the produced H2O2 can amplify the Fenton-like response initiated by Mn2+. The enhanced CDT combined with the gas therapy effect could simultaneously promote the accumulation of reactive oxygen species and finally induce ferroptosis and exhibit an excellent anti-tumor effect. Consequently, these Lpo@MnS-GOx NPs with enhanced ferroptosis-induced effect will find great potential for CRPC cancer treatment.
1. Introduction
Prostate cancer (PC) ranks as one of the frequently occurring malignancies among males globally.1 To date, androgen deprivation therapy has made a big impact and is initially effective in nearly all PC patients. Unfortunately, most of these PC patients might recur within 3 years, and further progress to lethal therapy-resistant PC called castration-resistant PC (CRPC).2,3 Currently, there are no long-term effective strategies for the treatment of CRPC patients, thus exploring novel therapeutic approaches for CRPC is an urgent clinical problem.Ferroptosis is an iron-dependent programmed cell death, which is characterized by increased lipid peroxidation.4,5 Recent studies have revealed that cancer cells could boost their ability to defend against oxidative stress by inhibiting ferroptosis, ultimately resulting in resistance. In other words, the regulation of ferroptosis could impact the effectiveness of the cancer treatment and help overcome resistance to conventional therapies, such as endocrine therapy, chemotherapy, and immunotherapy.6–9 Notably, Stoyanova T. et al. revealed that treatment with ferroptosis inducers (including erastin and RSL3) could significantly delay the tumor growth of CRPC.7 Therefore, ferroptosis induction would be a hopeful approach for managing CRPC.
As is known, encouraging achievements have been made in tumor-targeting drug-delivery nanomedicines in recent year.10–12 Emerging studies have demonstrated that chemodynamic therapy (CDT) could catalyze intra-cellular H2O2 into a toxic hydroxyl radical (˙OH) via a Fenton/Fenton-like reaction, which contributed to the accumulation of lipid peroxides.13–16 In particular, manganese-based nanoparticles (NPs), such as manganese oxide, manganese iron, and manganese sulfide (MnS), have been widely used for the treatment of various cancers.17,18 Upon exposure to acid environment, MnS could be degraded and release manganese ions (Mn2+) and hydrogen sulfide (H2S).17 Actually, H2S belongs to the endogenous gaseous signaling molecules, which participate in the regulation of various physiological and pathophysiological processes.19,20 Additionally, the H2S-mediated “gas therapy” could exhibit an anti-tumor effect by inducing the cellular cycle arrest, mitochondrial damage, or uncontrolled intracellular acidification.21,22 Nevertheless, the inadequate concentration of H2O2 (commonly almost 100 μM) inside the tumor inhibits the Mn2+-mediated Fenton-like effect, thus limiting the effectiveness of CDT and ferroptosis.
In order to elevate intracellular H2O2 levels and enhance the CDT effect, we first conjunct MnS with glucose oxidase (GOx). As expected, MnS-GOx was able to convert glucose into gluconic acid (GA) and H2O2, leading to glucose depletion and tumor starvation. Notably, GA generation would lead to a lower intracellular pH value, which could accelerate the degradation of MnS and promote H2S release.21,23 Furthermore, owing to the advantages of high bio-compatibility, bio-degradability, and low toxicity, liposomes have been extensively used as delivery vectors.24,25 Herein, we developed MnS NPs, which are linked to GOx, and ultimately encapsulated with liposome to generate Lpo@MnS-GOx NPs for anti-tumor treatment. The released GOx could trigger glucose oxidation, and result in the accumulation of H2O2 and GA. On the one hand, the generated H2O2 enhances the Fenton-like reaction triggered by Mn2+. On the other hand, GA induces the liberation of hydrogen sulfide (H2S) in conjunction with an intensified CDT impact, causing impairment to the functioning of mitochondria and resulting in the buildup of reactive oxygen species (ROS) within the mitochondria. Overall, Lpo@MnS-GOx NPs in conjunction with the CDT/H2S release/starvation therapy have the potential to induce ferroptosis, making it a hopeful approach for treating CRPC (Scheme 1).
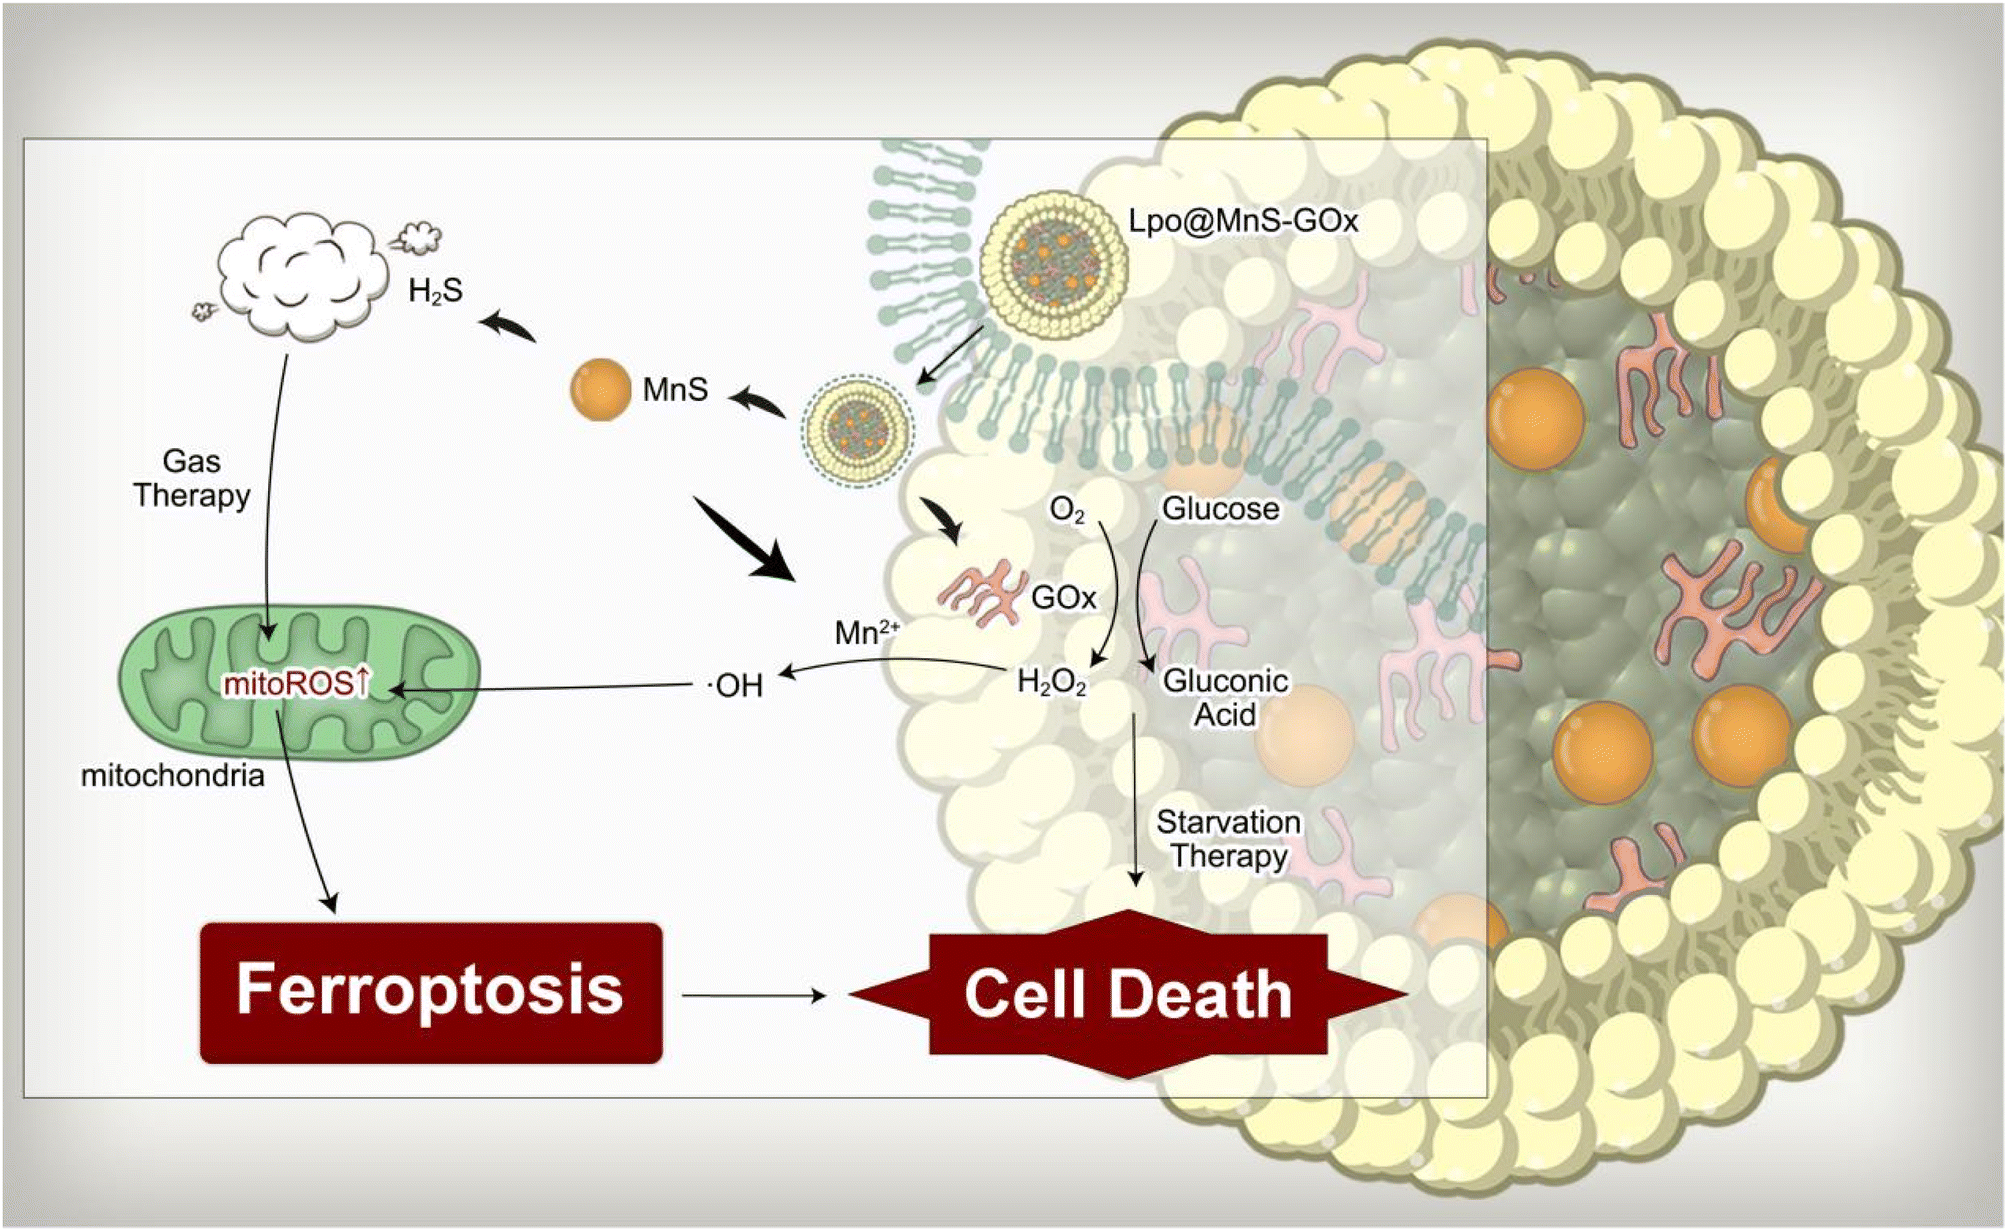 | ||
| Scheme 1 Schematic illustration of the synthesized therapeutic strategy triggered by Lpo@MnS-GOx NPs. In brief, Lpo@MnS-GOx induced prostate cancer ferroptosis through chemodynamic-gas therapy, which combined with starvation therapy exhibited a co-enhanced anti-tumor effect. | ||
2 Methods
2.1 Synthesis of MnS NPs
Briefly, manganese acetate (1.0 mM) and thioacetamide (1.5 mM) were dissolved in oleylamine (20 mL) under vigorous stirring. After 1 h, the mixed solution was transferred to a 50 mL teflon-line autoclave and heated at 220 °C for 2 hours. Subsequently, the product was washed with ethanol and distilled water several times until the supernatant was clear. Ultimately, the product was dried at 60 °C in an oven.2.2 Preparation of MnS-GOx NPs
Methoxy PEG sulfhydryl (mPEG-SH, Mw = 5000) was used for surface modification of MnS. Briefly, 1 mg MnS and 5 mg mPEG-SH were mixed in 5 mL of ultra-pure water under ultrasonication for five minutes. After 48 h of the PEGylation process, the PEGylated MnS were collected and washed with double-distilled H2O. Finally, to prepare the GOx functionalized nanoplatform, GOx and the sample were dispersed in water and stirred overnight. Finally, the resulting sample was obtained by centrifugation.2.3 Synthesis of Lpo@MnS-GOx NPs
DSPC, DSPE-PEG-2000, and cholesterol were dissolved in chloroform (3 mL), in a ratio of 10![[thin space (1/6-em)]](https://www.rsc.org/images/entities/char_2009.gif) :1:1, respectively. Then, the solution taken in a round-bottom flask was dried by rotary evaporation and MnS-GOx (1 mg mL−1) solution was added. After another sonication step of 30 min, polycarbonate membranes (Avanti Polar Lipids, Inc. Alabaster, AL) with 200 nm pore sizes were used to extrude the liposome solution, and Lpo@MnS-GOx NPs were obtained. The purple dispersion of Lpo@MnS-GOx NPs was obtained after dialysis for 24 h and Lpo@MnS-GOx NPs were stored at 4 °C and used within 4 days. Inductively coupled plasma mass spectrometry-mass spectroscopy (ICP-MS) was used to analyze the levels of Mn ions.
:1:1, respectively. Then, the solution taken in a round-bottom flask was dried by rotary evaporation and MnS-GOx (1 mg mL−1) solution was added. After another sonication step of 30 min, polycarbonate membranes (Avanti Polar Lipids, Inc. Alabaster, AL) with 200 nm pore sizes were used to extrude the liposome solution, and Lpo@MnS-GOx NPs were obtained. The purple dispersion of Lpo@MnS-GOx NPs was obtained after dialysis for 24 h and Lpo@MnS-GOx NPs were stored at 4 °C and used within 4 days. Inductively coupled plasma mass spectrometry-mass spectroscopy (ICP-MS) was used to analyze the levels of Mn ions.
2.4 In vitro Fenton-like properties
Before and after the addition of MnS NPs or MnS-GOx NPs, a comparison was made between the absorbances at 664 nm of MB (10 μg mL−1) in phosphate-buffered saline (PBS; pH = 6.5) containing H2O2 (2.0 mM). During the incubation with MnS-GOx (20 μg mL−1), the absorbances at 664 nm of MB (10 μg mL−1) in PBS (pH = 6.5) were measured at varying concentrations of H2O2 (0 mM, 1 mM, 2 mM, and 4 mM) or glucose (0 mg mL−1, 0.5 mg mL−1, and 1.0 mg mL−1).2.5 In vitro H2O2 generation
UV-vis absorption spectroscopy was used to quantify the concentration of H2O2 after the reaction of MnS-GOx NPs (20 μg mL−1).2.6 Level of H2S release in vitro
Firstly, 400 mL of MnS (5.5 mM) was added to a 3500 Da dialysis bag along with 50 mL of 10 mM HEPES buffer at pH 6.8 and 7.4. For the analysis of H2S, 1 mL of the solution, as a working solution, was removed at 0, 1, 2, 3, 4, 5, 6, 7, 8, 9, 10, 12, 24, 48, and 72 h. Then, a standard method was used to detect the concentration of H2S. Briefly, the working solution (100 μL), Zn(OAc)2 (100 μL, 1% (w/v)), DMPD (20 μL, 20 mM) and FeCl3 (20 μL, 30 mM) were mixed. 20 minutes later, the optical density (OD) was measured at 664 nm.2.7 Glucose oxidation reaction in vitro
Firstly, 1 mg mL−1 of glucose was dissolved in 10 mL of PBS. Subsequently, MnS-GOx (1 μg mL−1 GOx) and GOx (1 μg mL−1 GOx) were separately included. At specific time intervals, a 0.5 mL solution was collected and combined with 1.5 mL of DNS solution. After boiling for five minutes, the mixture was quenched in room-temperature water for 20 minutes. UV-vis absorbance spectra were observed and the absorbance at 600 nm was measured for each sample to determine the glucose concentration at various time intervals.2.8 Release ability of Mn ions
The quantity of Mn ions was measured using a bag filtration technique. Briefly, a dialysis bag containing Lpo@MnS-GOx NPs was immersed in PBS and constantly shaken at 37 °C. Then, a 4 mL aliquot of PBS was taken at different times to measure the concentration of Mn ions, and 4 mL of fresh PBS was added to the solution. Next, the calculation of the percentage of manganese ions released was tested using ICP-MS.2.9 Cell uptake of Lpo@MnS-GOx
Firstly, prostate cancer cells (PC-3) were cultured in DMEM with 10% FBS for 24 h. Afterward, Lpo@MnS-GOx ([MnS]: 1 μg mL−1) labelled with rhodamine B (RhB) was added to the cells. Finally, the intracellular fluorescence intensity was analyzed at indicated time points (1, 2, 4, and 8 h) with flow cytometry.2.10 Anti-tumor effect in vitro
PC-3 cells were planted and nurtured for 24 hours, followed by incubation with various NPs. To detect cell viability, we used the Cell Counting Kit-8 (CCK-8) assay (Dojindo, Kumamoto, Japan). Additionally, the PC-3 cells were placed in 12-well plates and cultured overnight, followed by treatment with Lpo@MnS-GOx ([MnS]: 4 μg mL−1) for 24 h. Afterward, the treated cells were stained with a Calcein-AM/PI detection kit to analyze the percentage of live or dead cells.2.11 Determination of the ROS level
PC-3 cells were treated under different conditions (MnCl2, Na2S, Lpo@MnS, or Lpo@MnS-GOx) ([MnS]: 4 μg mL−1) for 24 h. Then, the treated cells were co-incubated with a DCFH-DA probe for 30 min, and the analyses were performed using CLSM (Olympus) and flow cytometry assay.2.12 Detection of mitochondrial functions
Firstly, the PC-3 cells were treated with PBS, MnCl2, Na2S, Lpo@MnS or Lpo@MnS-GOx ([MnS]: 4 μg mL−1). Following that, the mitochondrial membrane potential (MMP) was measured using a JC-1 Kit, while the change in the mitochondrial permeability transition pore (mPTP) was analyzed using the mPTP detection kit.2.13 Detection of mtROS
Initially, PC-3 cells were incubated at a temperature of 37 °C for 24 hours. Following that, the cell medium was treated with MnCl2, Na2S, Lpo@MnS, or Lpo@MnS-GOx ([MnS]: 4 μg mL−1). Following 24 hours, the flow cytometry assay was conducted to measure the intracellular mitochondrial superoxide (mtROS) level using the MitoSOX™ Red mitochondrial superoxide indicator (Invitrogen).2.14 Detection of intracellular lipid peroxide
PC-3 cells were placed in confocal dishes and incubated at 37 °C for 24 hours. Afterward, the cells underwent a 24 hours treatment with Lpo@MnS-GOx NPs ([MnS]: 4 μg mL−1). As a final step, C11-BODIPY 581/591 (Thermo Scientific, Waltham, MA) was used to stain the cells, followed by 15 minutes of Hoechest33342. Finally, the representative images were captured by CLSM.2.15 Anti-tumor ability in vivo
All animal procedures were approved by the Shantou University Experimental Animal Ethics Committee (SUMC2023-304), and all investigation procedures were carried out in accordance with the Helsinki Declaration. Herein, the tumor-bearing model was established by collecting PC-3 cells and injecting them subcutaneously into the right flank of nude mice. After 7 days, the tumor-bearing mice were randomly divided into five groups, and the tumour-bearing mice were injected with saline, MnCl2, Na2S, Lpo@MnS or Lpo@MnS-GOx ([MnS]: 2.5 mg kg−1, 150 μL) via the tail vein on days 1, 3, and 5, respectively. Measurements of the tumor size and weight were taken at three-day intervals. After 14 days, the mice that received the treatment were sacrificed, and tumor samples were collected for additional H&E staining and immunofluorescent staining (TUNEL).2.16 Hemolysis detection assay
For the hemolysis detection, the red blood cells were collected and incubated with different concentrations of Lpo@MnS-GOx NPs from 5 to 80 μg mL−1 with red blood cells. The hemolysis rates of the different groups were calculated according to the OD value using a microplate reader.2.17 In vivo bio-distribution and metabolism study
Firstly, in order to evaluate the in vivo bio-distribution of Lpo@MnS-GOx, the healthy mice were intravenously injected with Lpo@MnS-GOx ([MnS]: 2.5 mg kg−1, 150 μL) separately. At the indicated time points (2 h, 6 h, 12 h, and 24 h), the main organs and tumors were collected, weighed, and dissolved in digesting aqua regia. The concentrations of Mn ions in different samples were detected by ICP-MS.2.18 In vivo safety assessment
To investigate the toxicity of Lpo@MnS-GOx in vivo, the sera of tumor-bearing mice were obtained to evaluate liver function (aspartate aminotransferase, AST; alanine aminotransferase, ALT) and renal function (blood urea nitrogen, BUN; creatinine, CREA). Additionally, main organs (heart, liver, spleen, lung, and kidney) were obtained from tumor-bearing mice for H&E staining.2.19 Statistical analysis
The data was presented as the average plus the standard deviation. One-way ANOVA was used to analyze the variations among multiple groups. Statistically significant results were determined for p-values less than 0.05.3 Results and discussion
3.1 Preparation and characterization of Lpo@MnS-GOx
As examined by transmission electron microscopy (TEM), the synthesized MnS NPs exhibited a uniform spherical morphology (Fig. 1A). Subsequently, Lpo@MnS-Gox NPs were synthesized by the thin-film dispersion method. As shown in Fig. 1B, the TEM image showed that the surface of the Lpo@MnS-GOx was clearly covered with a layer of membrane, and the particle size of Lpo@MnS-GOx was slightly larger than that of MnS. Additionally, the elemental mapping demonstrated that the Mn and S elements were homogeneously distributed in the Lpo@MnS-GOx NPs (Fig. 1B). Moreover, the change in the zeta potential further confirmed the successful synthesis of Lpo@MnS-GOx NPs, which was also beneficial for the duration of long blood circulation and high stability (Fig. 1C). The hydrodynamic size of Lpo@MnS-GOx NPs was ≈150 nm measured by dynamic light scattering, while the PDI of Lpo@MnS-GOx in DI water was 0.19, indicating good aqueous dispersity of nanocomplexes (Fig. 1D). As shown in Fig. S1,† there were no significant changes in the diameters of Lpo@MnS-GOx NPs in phosphate-buffered saline (PBS), saline, or the Dulbecco's modified Eagle's medium (DMEM) after 48 h, which demonstrated their stability. The encapsulation efficiencies (EE%) of MnS-GOx NPs detected by ICP-OES were high at 63%. The drug loading (DL%) of MnS-GOx in Lpo@MnS-GOx was ≈8.4%. To verify that the GOx was encapsulated into Lpo@MnS-GOx nanoparticles, relevant characterizations were performed. FT-IR results further proved that MnS-GOx nanoparticles were successfully synthesized (Fig. 1E). The characteristic bands of GOx from 1640 to 1660 cm−1 were ascribed to the amide I, which corresponds to the C![[double bond, length as m-dash]](https://www.rsc.org/images/entities/char_e001.gif) O stretching mode.26 In addition, the powder X-ray diffraction (XRD) of Lpo@MnS-GOx nanoparticles showed that MnS crystal had been grown successfully (Fig. 1F).27 The successful assembly of Lpo@MnS-GOx nanoparticles was also validated by the X-ray photoelectron spectroscopy (XPS) analysis (Fig. 1G) and the Mn 2p3/2 mainly consisted of Mn2+ (641 eV) and Mn3+ (642 eV) (Fig. 1H).27 The above results confirmed the successful construction of Lpo@MnS-GOx NPs.
O stretching mode.26 In addition, the powder X-ray diffraction (XRD) of Lpo@MnS-GOx nanoparticles showed that MnS crystal had been grown successfully (Fig. 1F).27 The successful assembly of Lpo@MnS-GOx nanoparticles was also validated by the X-ray photoelectron spectroscopy (XPS) analysis (Fig. 1G) and the Mn 2p3/2 mainly consisted of Mn2+ (641 eV) and Mn3+ (642 eV) (Fig. 1H).27 The above results confirmed the successful construction of Lpo@MnS-GOx NPs.
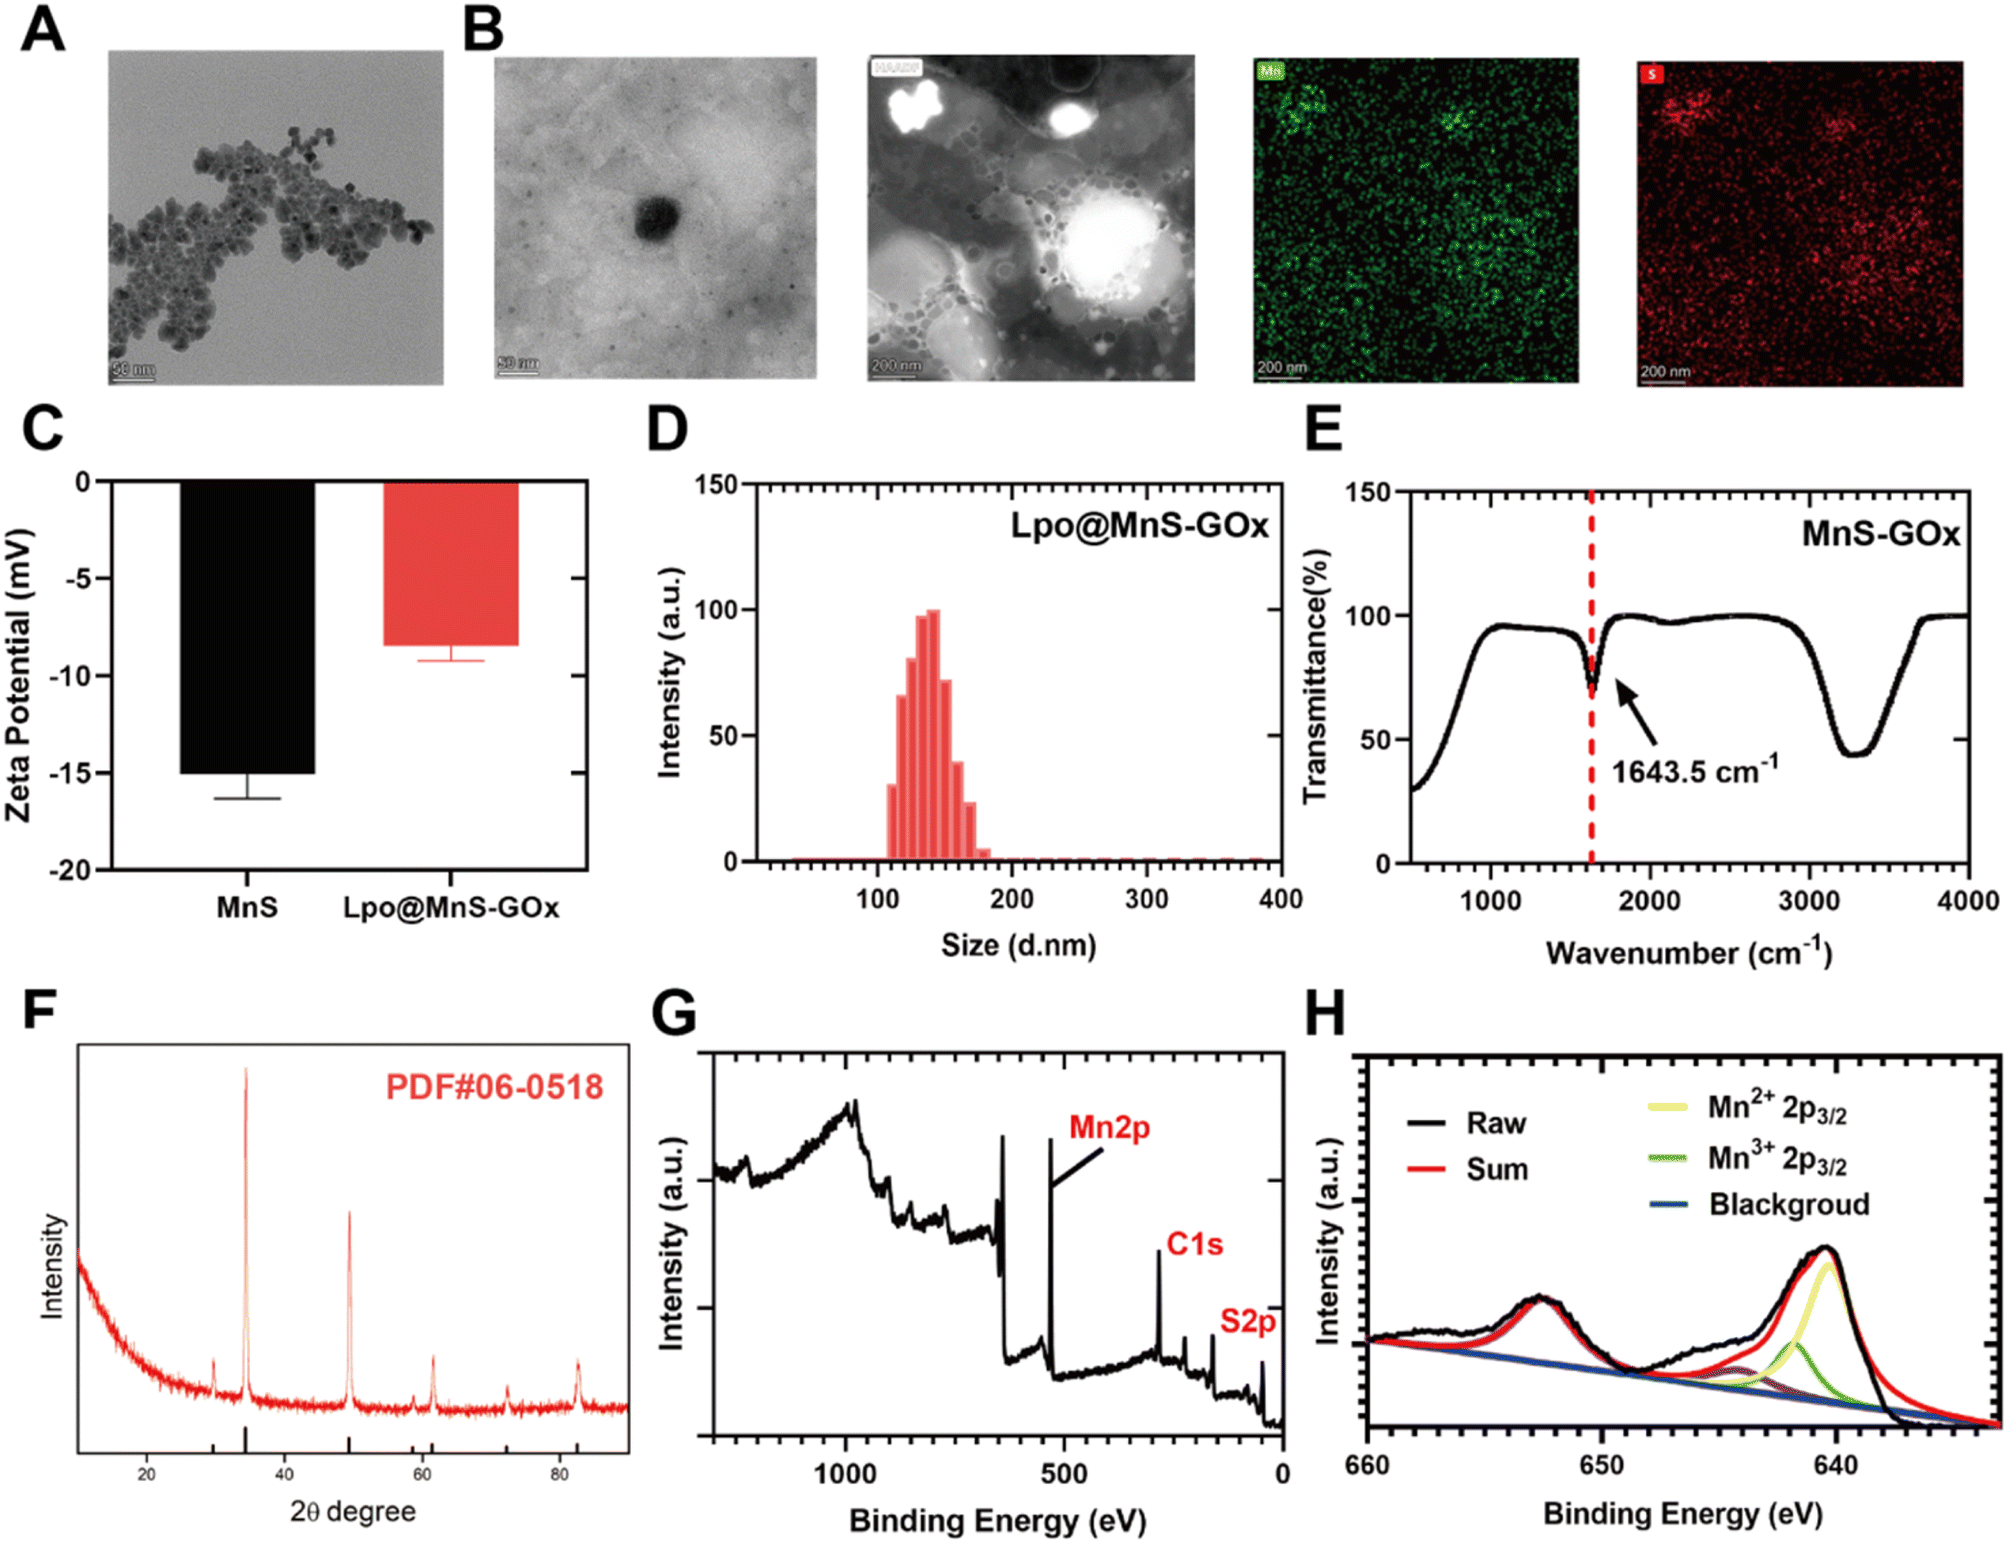 | ||
| Fig. 1 (A) Transmission electron microscopy (TEM) image of MnS NPs, scale bar: 50 nm. (B) TEM image and elemental mapping of Lpo@MnS-GOx NPs. (C) Zeta potentials of Lpo@MnS-GOx. (D) Hydrodynamic diameter distribution of MnS and Lpo@MnS-GOx. (E) FT-IR of MnS-GOx. (F) XRD patterns of MnS. (G) XPS of MnS. (H) High-resolution XPS scans of Mn (2p). | ||
3.2 In vitro hydroxyl radicals, H2O2, and H2S generation by Lpo@MnS-GOx
It is known that Mn2+-mediated Fenton-like reaction could convert H2O2 to highly toxic ˙OH,28 thus we further detected whether Lpo@MnS-GOx NPs could promote the production of ˙OH through the methylene blue (MB) assay. We firstly examined the ˙OH-producing capacity of Lpo@MnS-GOx NPs in the presence of various concentrations of H2O2 by measuring the absorbance of MB. Fig. 2A revealed that Lpo@MnS-GOx NPs showed robust ˙OH generation ability once mixed with higher concentrations of H2O2. Furthermore, we investigated whether the addition of glucose could enable MnS-GOx NPs to persistently generate ˙OH. As illustrated in Fig. 2B, the MB absorption also decreased with the increase of glucose, demonstrating the superior catalytic ability of MnS-GOx. Meanwhile, the Fenton-like effect could be strengthened with the concentration of MnS NPs or MnS-GOx NPs increase, which was mostly attributed to the self-supply of hydrogen peroxide triggered by GOx (Fig. 2C and D).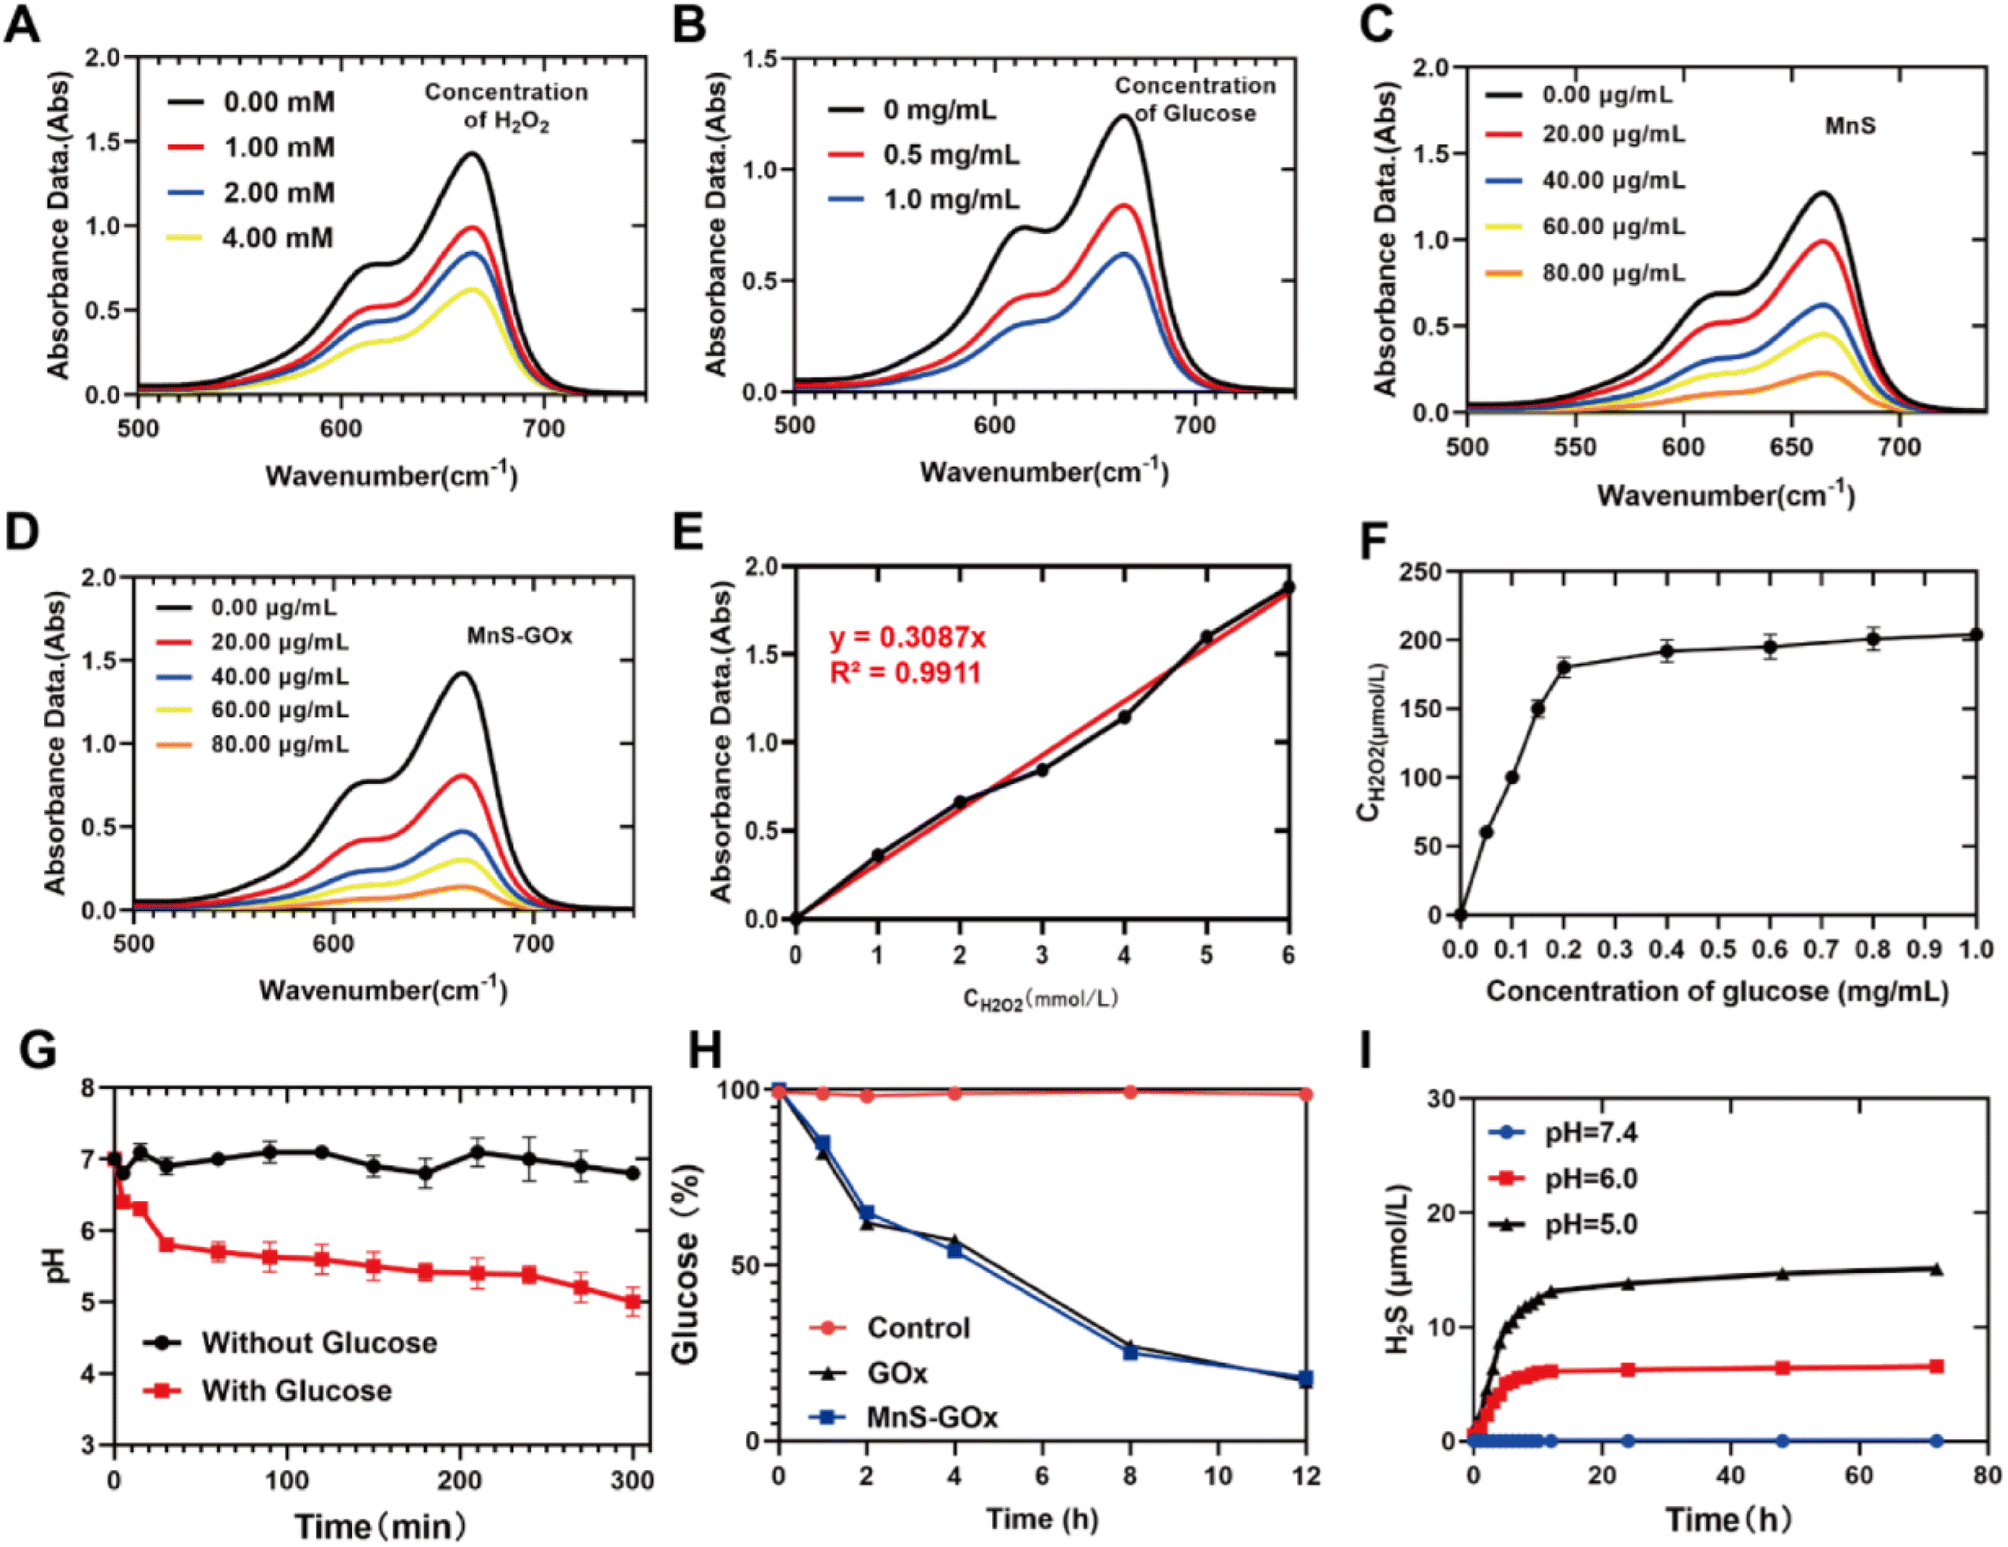 | ||
| Fig. 2 (A) MB probe degradation at different concentrations of H2O2 (0 mM, 1.0 mM, 2.0 mM, and 4.0 mM). (B) The degradation of the MB probe at different concentrations of glucose (0 mg mL−1, 0.5 mg mL−1, and 1.0 mg mL−1) with the concentration of H2O2 at 2.0 mM. (C) The degradation of MB probe in the presence of different concentrations of MnS. (D) The MB probe exhibits Fenton-like characteristics when MnS-GOx is present at concentrations of 0 μg mL−1, 20 μg mL−1, 40 μg mL−1, 60 μg mL−1, and 80 μg mL−1. (E) The standard curve of H2O2 in the KI reaction. (F) H2O2 levels after cultured with various concentrations of glucose (MnS-GOx: 20 μg mL−1). (G) pH levels of MnS-GOx (MnS-GOx: 20 μg mL; CGlucose = 0.5 mg mL−1). (H) The concentration of glucose changes in the glucose solution after different treatments (CGlucose = 0.5 mg mL−1). (I) The release ability of H2S from MnS-GOx NPs (20 μg mL−1). | ||
GOx is a catalyst that can facilitate the reaction of glucose, O2, and H2O to generate GA and H2O2.29,30 To determine the catalytic activity of GOx in the nanoreactor, MnS-GOx was used to measure the amount of the produced H2O2.31 KI was employed as the indicator of H2O2, and the standard H2O2 detection curve is shown in Fig. 2E. The concentration of H2O2 generated increased with increasing glucose concentrations (Fig. 2F). Notably, the results of Fig. 2F illustrate that with the concentration of the MnS-GOx solution increasing, the amount of H2O2 produced was as high as almost 200 μM, which was far greater than that in solid tumors (<100 μM). The results of Fig. 2G showed that the pH value within the MnS-GOx NPs solution was significantly decreased with the addition of glucose. Furthermore, it was examined whether the hybrid nanocomposite was capable of performing GOx catalysis in an aqueous glucose solution with MnS-GOx NPs and GOx, and a DNS reagent kit was used to measure time-dependent changes in the glucose concentration.32 During the incubation period, the glucose concentration in the solution decreased steadily (Fig. 2H). Taken together, these results consistently displayed that MnS-GOx could effectively convert glucose to generate H2O2 and gluconic acid.
MnS NPs were dispersed and immersed in PBS with varied pH for different periods of time. As revealed in Fig. 2I, almost no released H2S was detected in the solution with a pH of 7.4. In contrast, the release of H2S gas was clearly observed in the solution with a pH of 6.0 after 72 h, while the content of H2S released was higher when the solution pH was further reduced to 5.0. The above results confirmed the excellent ability of MnS NPs for the release of H2S gas. As discussed above, the addition of GOx could enhance the Mn2+-mediated CDT effect through self-supplied H2O2 and generation of gluconic acid, while the low pH environment would further promote the release of H2S gas, and finally achieve a combined chemodynamic-gas therapy. Additionally, we further performed the hemolytic test to confirm the bio-compatibility of Lpo@MnS-GOx NPs. As Fig. S2† shows, the results of hemolysis experiments indicated that Lpo@MnS-GOx NPs did not result in significant hemolysis (<5%) at any tested concentration, which confirmed that the prepared Lpo@MnS-GOx NPs possessed long blood-circulation duration ability.
3.3 Cellular uptake and anti-tumor effect triggered by Lpo@MnS-GOx in vitro
In order to ascertain the uptake of Lpo@MnS-GOx NPs by PC-3 cells, the NPs were initially labeled with Rhodamine B (RhB). To assess the ability of Lpo@MnS-GOx NPs to enter cells, the fluorescence of RhB within PC-3 cells was measured. Flow cytometric results showed a significant increase in intracellular RhB fluorescence intensity as the incubation time was extended from 1 to 8 hours (Fig. 3A and B). Additionally, in order to detect the in vitro antitumor effect triggered by Lpo@MnS-GOx NPs, the CCK-8 assay was performed. As depicted in Fig. 3C, cell viability showed a concentration-dependent therapeutic effect on PC-3 cells when treated with Lpo@MnS and Lpo@MnS-GOx NPs, while the Lpo@MnS-GOx group exhibited the highest rate of inhibition. Additionally, the live and dead double-staining results also showed that Lpo@MnS-GOx could significantly induce PC-3 cell death (Fig. 3D). Furthermore, the DCFH-DA was applied as an intracellular oxidant probe to assess ROS generation. Notably, as shown in Fig. 3E, Lpo@MnS-GOx presented significantly enhanced green fluorescence compared with Lpo@MnS, Na2S, and MnCl2, suggesting that the addition of GOx could improve CDT efficiency with enhanced ROS accumulation. Besides, similar results were revealed through flow cytometry analysis (Fig. 3F and G). Taken together, the composite Lpo@MnS-GOx exhibited an excellent anti-tumor effect in all the groups via ROS production, however, the mechanisms remain undefined.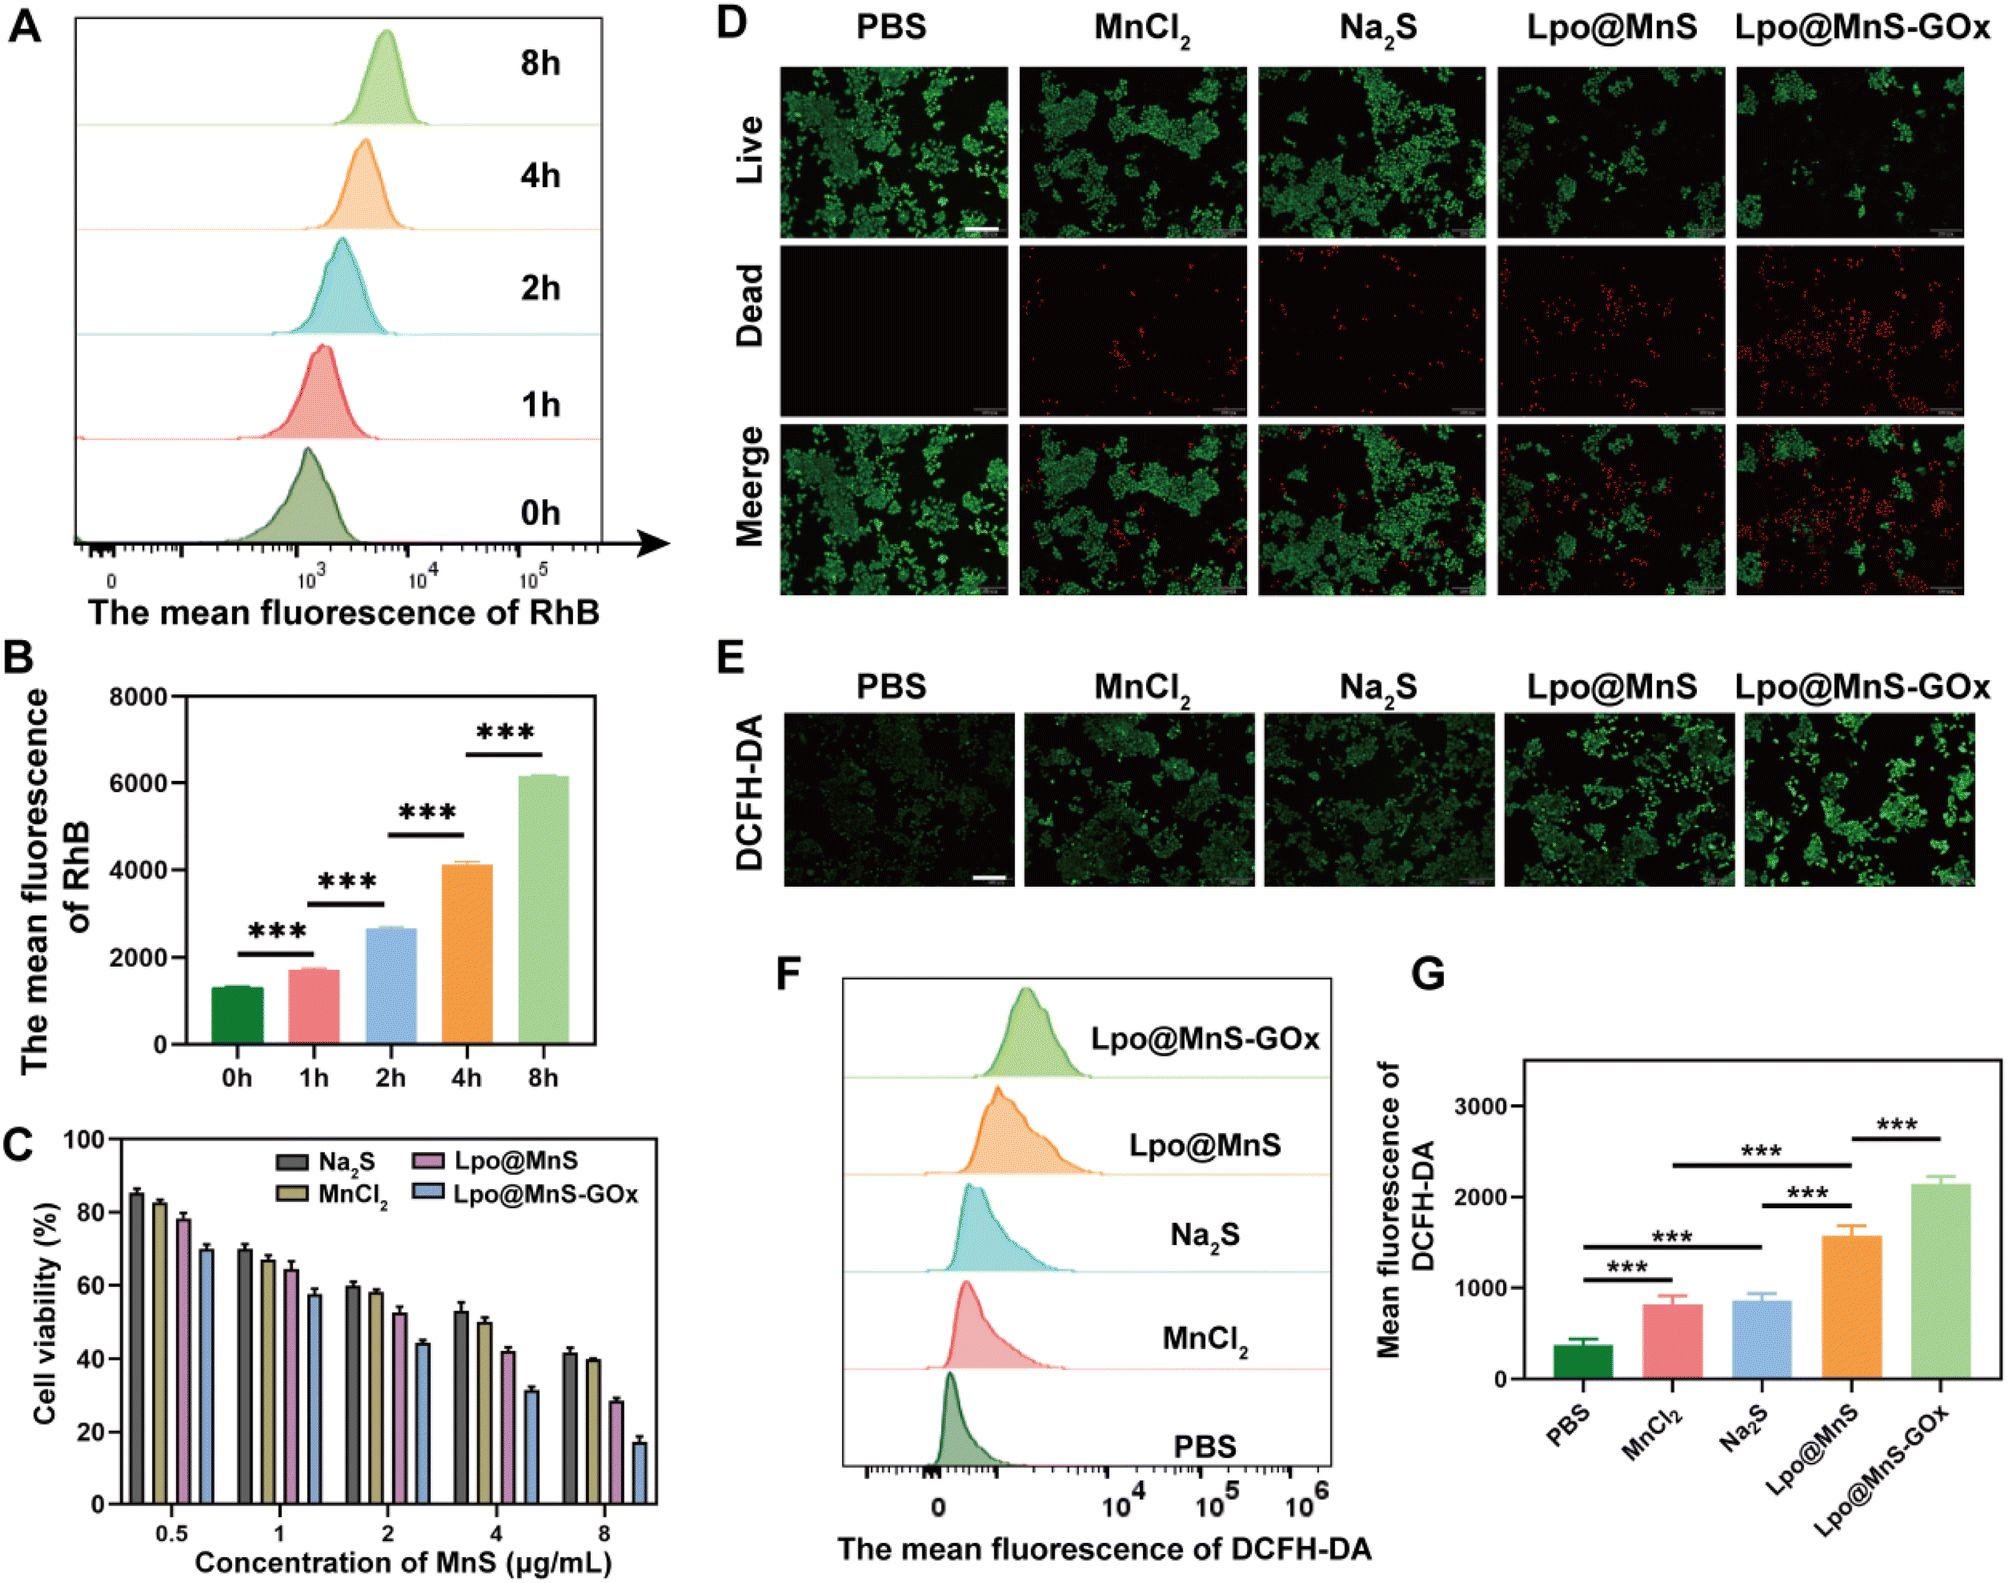 | ||
| Fig. 3 (A) Flow cytometry images and (B) corresponding quantification of the mean fluorescence at indicated time points. (C) Live and dead double-staining assay of PC-3 cells, scale bar: 200 μm. (D) Inverted fluorescence microscope observation of intracellular ROS generation, scale bar: 200 μm. € Cytotoxicity of Lpo@MnS-GOx nanoparticles toward PC-3 cells. (F) Flow cytometry, and (G) relative statistical analysis of intracellular ROS content within PC-3 cells after various treatments. ***P < 0.001. | ||
3.4 Chemodynamic-gas therapy induced mitochondrial dysfunction
Accumulated studies showed that both CDT and gas therapy could cause severe damage to cells with reduced mitochondrial membrane potential (MMP) concomitantly.33–35 Hence, in this investigation, we employed the JC-1 detection kit to assess the mitochondrial membrane potential of the treated cells. As shown in Fig. 4A and B, the cells treated with Lpo@MnS exhibited decreased mitochondrial membrane potentials compared to the MnCl2 and Na2S groups. Significantly, the cells subjected to Lpo@MnS-GOx exhibited the least mitochondrial membrane potential (MMP), suggesting extensive mitochondrial damage. In addition, the intensity of the mPTP was reduced in the Lpo@MnS-GOx group, which indicated more mitochondrial damage (Fig. 4C). Furthermore, the generated mtROS were further detected. As expected, the Lpo@MnS-GOx treated group showed a strong red fluorescence signal, indicating that Lpo@MnS-GOx NPs could promote mtROS accumulation through chemodynamic-gas therapy (Fig. 4E and F). | ||
| Fig. 4 (A) MTP level and (B) related statistical analysis. (C) mPTP pictures of PC-3 cells following different treatments, with a scale bar of 200 μm. (D) CLSM images of C11-BODIPY581/591-stained PC-3 cells in various groups, scale bar: 10 μm. (E) Flow cytometric analysis and (F) related statistical analysis of intracellular mtROS after different treatments. *P < 0.05, **P < 0.05, ***P < 0.001. | ||
Actually, lipids are important targets of reactive oxygen species, while the upregulated mtROS would further move into the cytosol and cause lipid peroxidation generation. Notably, lipid peroxidation is the driver of ferroptotic cell death. Besides, in addition to lipid peroxidation accumulation, the consumption of GSH could also inactivate GPX4 to boost ferroptosis.36,37 Furthermore, the relative GSH content was significantly lower in cells treated with Lpo@MnS-GOx NPs (Fig. S3†), accompanied by the lowest GPX4 activity (Fig. S4†). Encouraged by these results, we further used the BODIPY581/591-C11 probe to determine the content of lipid peroxidation, which is a key signal for the detection of ferroptosis. Fig. 5D shows that the Lpo@MnS-GOx treatment group exhibited the strongest green fluorescence intensity followed by the Lpo@MnS group, suggesting significant lipid peroxidation accumulation and subsequent ferroptosis induction triggered by the enhanced CDT and H2S release.
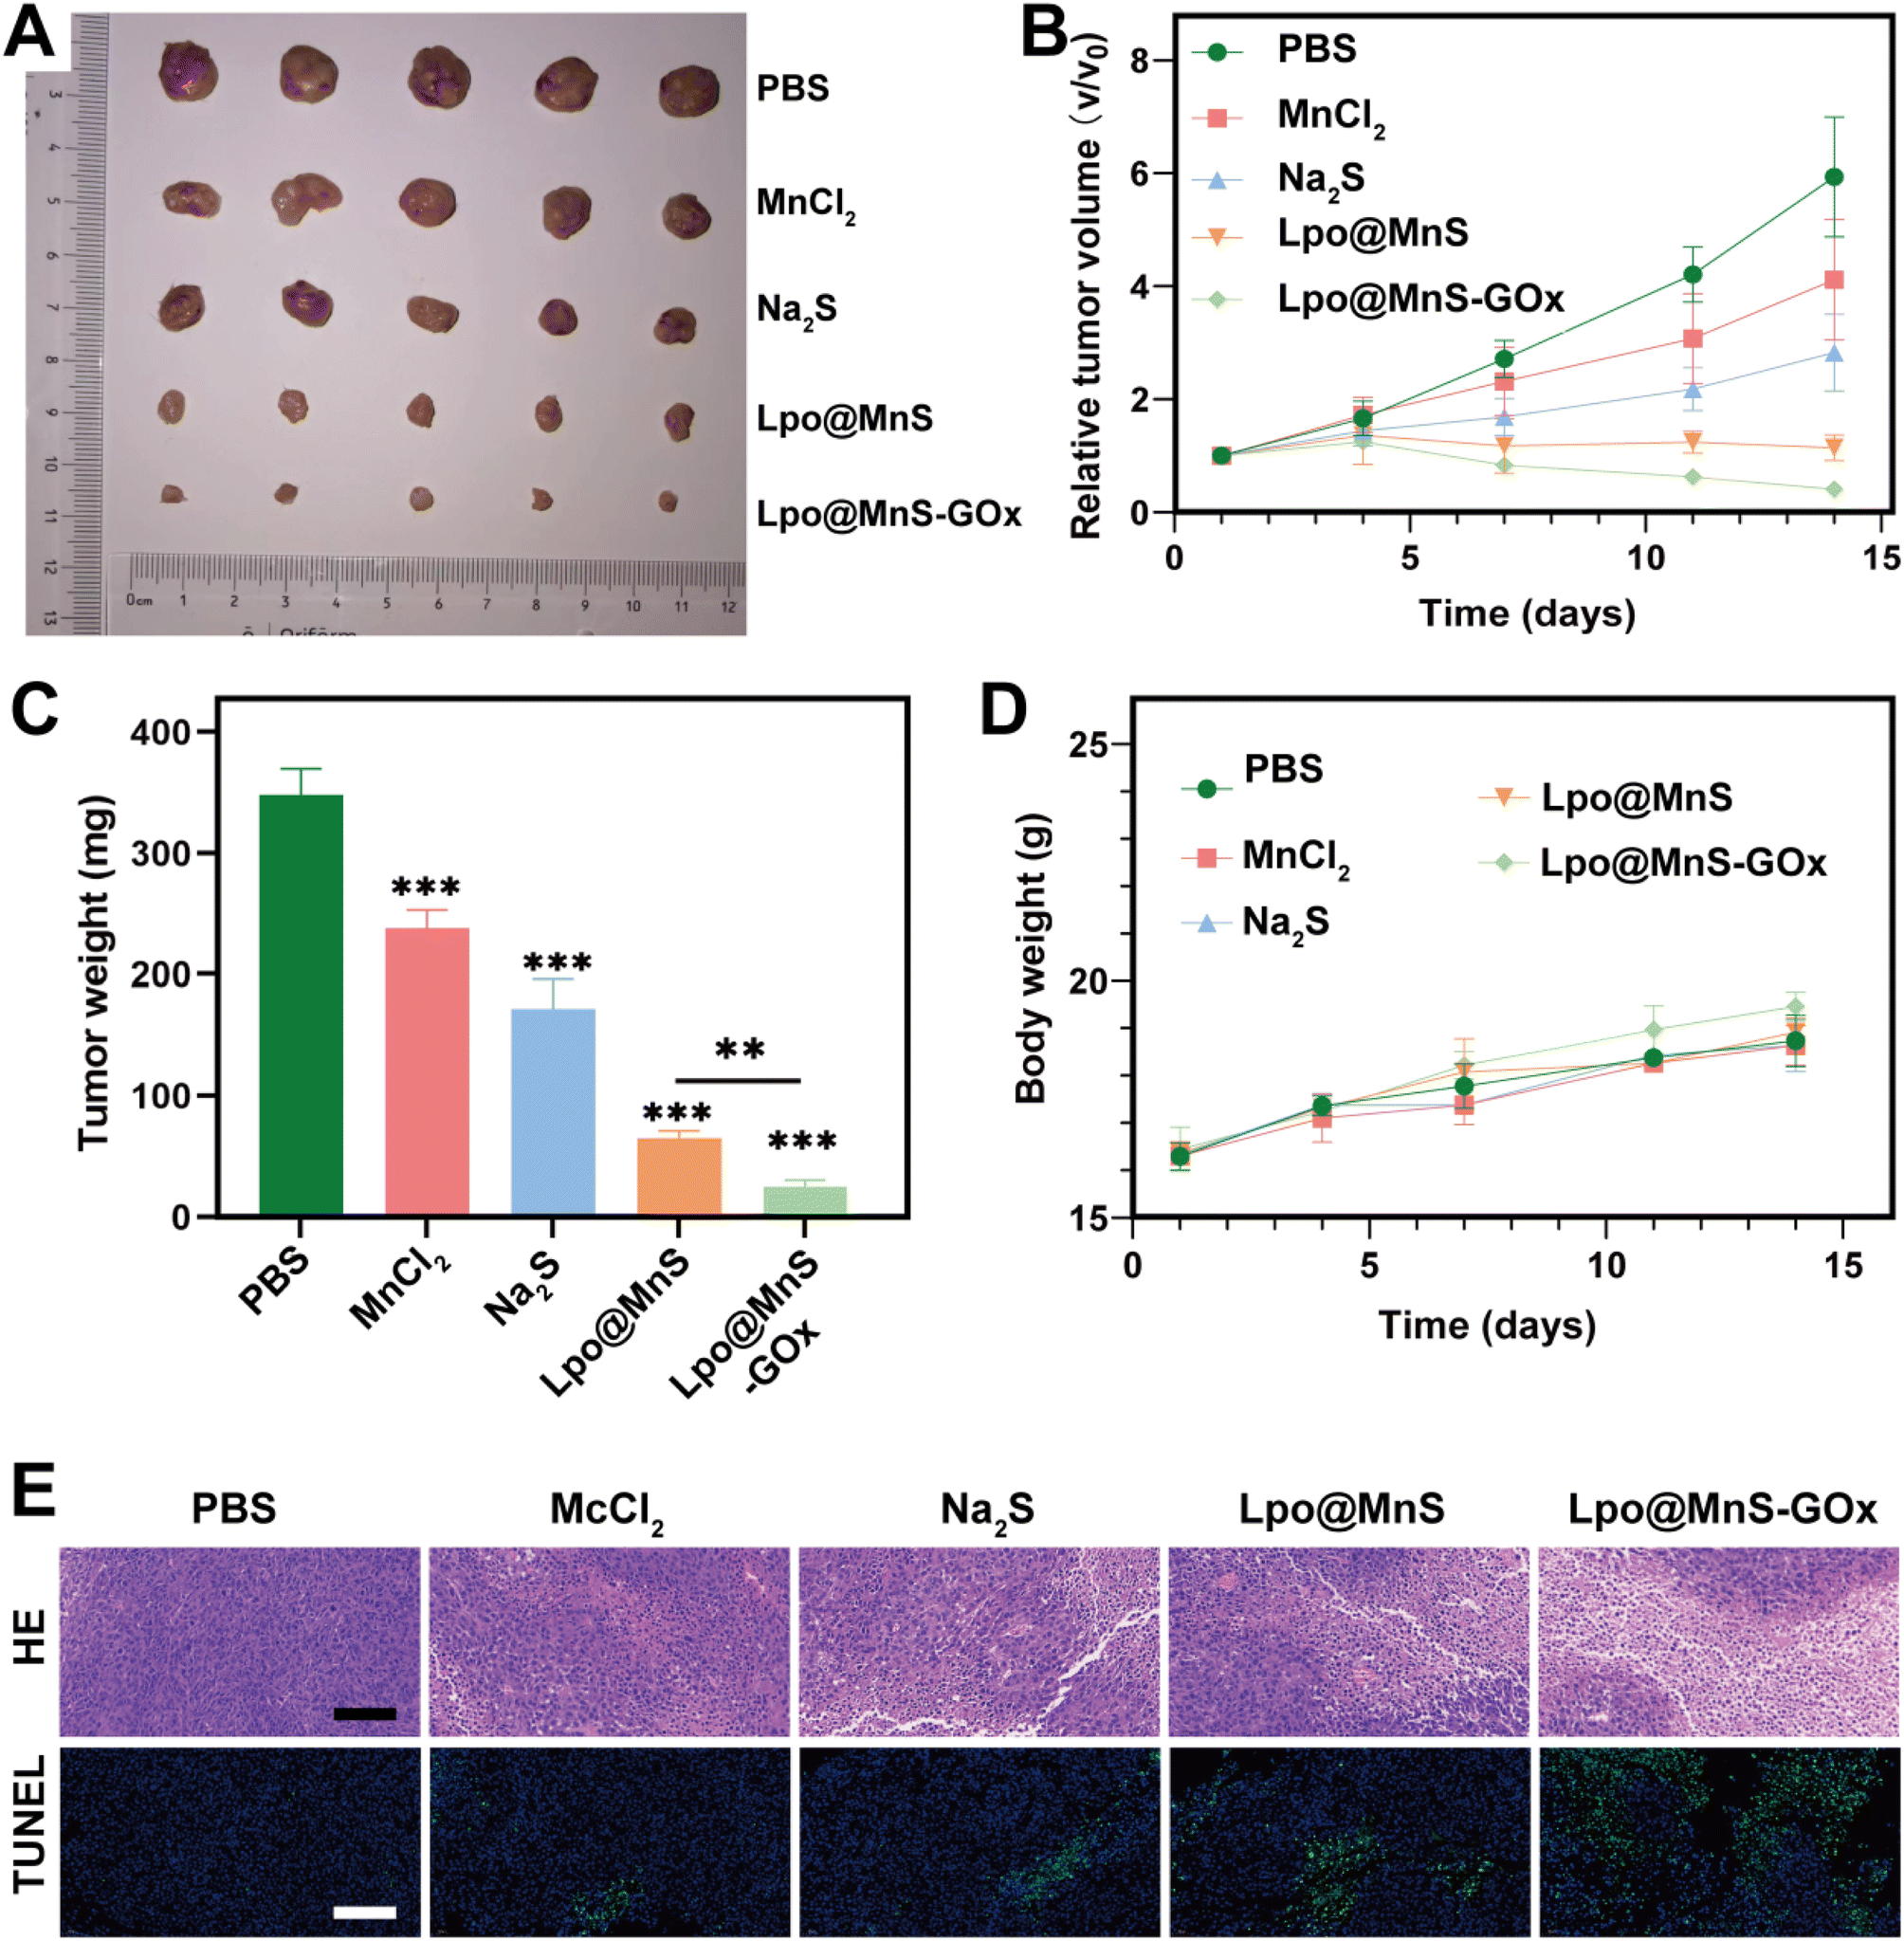 | ||
| Fig. 5 (A) Images of tumors derived from mice. (B) Relative tumor volume. (C) Tumor weight of PC-3 tumors. (D) Body weight of the tumor-bearing mice. (E) H&E and TUNEL staining images, scale bar: 150 μm. **P < 0.05, ***P < 0.001. | ||
3.5 Lpo@MnS-GOx inhibited tumor growth in vivo
To assess the therapeutic ability of Lpo@MnS-GOx NPs, a PC-3 tumor-bearing mouse model was constructed. Then, mice were randomized into five groups, including Saline, MnCl2, Na2S, Lpo@MnS, and Lpo@MnS-GOx groups. Following 14 days of treatment, the mice were sacrificed, and the tumor samples were collected. Compared to other groups, the Lpo@MnS-GOx group showed nearly complete elimination of tumors (Fig. 5A). Furthermore, the tumor grew rapidly in mice treated with PBS, MnCl2, and Na2S groups, implying that they could not effectively suppress the tumor growth. Instead, the tumor growth in the group treated with Lpo@MnS-GOx was remarkably inhibited, which could be due to the synergistic CDT effect and H2S therapy (Fig. 5B). Then, the changes in the tumor weight had similar tendencies (Fig. 5C). Moreover, the Mn ion bio-distribution in tumor-bearing mice at different time points, post-injection of Lpo@MnS-GOx NPs was assessed using an inductively coupled plasma optical emission spectrometer (ICP-OES). The bio-distribution analysis of major organs and tumors is shown in Fig. S5,† and the results showed that the uptake of the Lpo@MnS-GOx NPs within the tumor peaked at 12 h.Furthermore, throughout the tumor treatment, mice in every group maintained consistent body weights, suggesting the minimal toxicity of Lpo@MnS-GOx (Fig. 5D). Additionally, in order to confirm the bio-compatibility of Lpo@MnS-GOx NPs, the serum samples from these treated mice were collected for the detection of liver and kidney functions. As expected, our results displayed that no significant differences were observed among both groups, indicating that Lpo@MnS-GOx NPs caused little damage to liver and kidney functions (Fig. S6†). Subsequently, in order to determine their potential toxicity towards major organs, the major organs (heart, liver, spleen, lung, and kidney) were collected for H&E staining. Notably, no pathological changes were observed between the PBS and Lpo@MnS-GOx groups (Fig. S7†). Taken together, these data provide strong evidence that the systemic toxicity of Lpo@MnS-GOx NPs was negligible. Furthermore, H&E, and TUNEL staining were performed after collecting the excised tumor tissues. Which consistently revealed that Lpo@MnS-GOx NPs caused the most severe cell death relative to other groups (Fig. 5E). Taken together, these results prove that our designed NPs had a remarkable anti-tumor effect in vivo.
4 Conclusions
We developed ferroptosis-amplifying NPs by attaching GOx to MnS NPs, which were finally encapsulated in a liposome. Upon internalizing by the PC-3 cells, GOx that was released induced a depletion of glucose within the cells. Notably, the addition of GOx could enhance the Mn2+-mediated CDT effect through self-supply of H2O2 and gluconic acid generation, while the low pH environment would further promote the release of H2S gas. As a result, the combination of the chemodynamic-gas therapy may initiate harm to mitochondria and the production of mtROS, resulting in the buildup of lipid peroxidation substances and causing significant cell death through ferroptosis. Collectively, our findings indicate that Lpo@MnS-GOx facilitates ferroptosis and amplifies therapeutic advantages, presenting a hopeful approach to managing prostate cancer.Data availability
The data that support the findings of this study are available from the corresponding author upon reasonable request.Conflicts of interest
The authors have no conflicts of interest to declare.Acknowledgements
This work was funded in part by the National Natural Science Foundation of China 81872092.References
- R. L. Siegel, K. D. Miller and A. Jemal, Ca-Cancer J. Clin., 2020, 70(1), 7–30 CrossRef.
- N. Sharifi, W. L. Dahut, S. M. Steinberg, W. D. Figg, C. Tarassoff, P. Arlen and J. L. Gulley, BJU Int., 2005, 96(7), 985–989 CrossRef.
- M. Y. Teo, D. E. Rathkopf and P. Kantoff, Annu. Rev. Med., 2019, 70, 479–499 CrossRef CAS.
- B. R. Stockwell, J. P. Friedmann Angeli, H. Bayir, A. I. Bush, M. Conrad, S. J. Dixon, S. Fulda, S. Gascón, S. K. Hatzios, V. E. Kagan, K. Noel, X. Jiang, A. Linkermann, M. E. Murphy, M. Overholtzer, A. Oyagi, G. C. Pagnussat, J. Park, Q. Ran, C. S. Rosenfeld, K. Salnikow, D. Tang, F. M. Torti, S. V. Torti, S. Toyokuni, K. A. Woerpel and D. D. Zhang, Cell, 2017, 171(2), 273–285 CrossRef CAS.
- D. Tang, X. Chen, R. Kang and G. Kroemer, Cell Res., 2021, 31(2), 107–125 CrossRef CAS.
- C. Zhang, X. Liu, S. Jin, Y. Chen and R. Guo, Mol. Cancer, 2022, 21(1), 47 CrossRef PubMed.
- A. Ghoochani, E. C. Hsu, M. Aslan, M. A. Rice, H. M. Nguyen, J. D. Brooks, E. Corey, R. Paulmurugan and T. Stoyanova, Cancer Res., 2021, 81(6), 1583–1594 CrossRef CAS.
- V. S. Viswanathan, M. J. Ryan, H. D. Dhruv, S. Gill, O. M. Eichhoff, B. Seashore-Ludlow, S. D. Kaffenberger, J. K. Eaton, K. Shimada, A. J. Aguirre, S. R. Viswanathan, S. Chattopadhyay, P. Tamayo, W. S. Yang, M. G. Rees, S. Chen, Z. V. Boskovic, S. Javaid, C. Huang, X. Wu, Y. Y. Tseng, E. M. Roider, D. Gao, J. M. Cleary, B. M. Wolpin, J. P. Mesirov, D. A. Haber, J. A. Engelman, J. S. Boehm, J. D. Kotz, C. S. Hon, Y. Chen, W. C. Hahn, M. P. Levesque, J. G. Doench, M. E. Berens, A. F. Shamji, P. A. Clemons, B. R. Stockwell and S. L. Schreiber, Nature, 2017, 547(7664), 453–457 CrossRef CAS.
- S. Guo, W. Xiong, J. Zhu, J. Feng, R. Zhou, Q. Fan, Q. Zhang, Z. Li, J. Yang, H. Zhou, P. Yi, Y. Feng, S. Yang, X. Qiu, Y. Xu and Z. Shen, Biomaterials, 2023, 302, 122300 CrossRef CAS.
- L. Huang, Y. D. Lu, S. Guo, J. Yang, Z. Y. Liang, Q. Q. Zhang, P. W. Yi, Y. Q. Feng, Y. Li, Y. K. Xu, X. Z. Qiu, J. Feng and Z. Y. Shen, Adv. Funct. Mater., 2023, 33, 2209278 CrossRef CAS.
- H. Li, Y. Feng, Q. Luo, Z. Li, X. Li, H. Gan, Z. Gu, Q. Gong and K. Luo, Theranostics, 2023, 13(15), 5386–5417 CrossRef CAS PubMed.
- Y. Lu, Z. Liang, J. Feng, L. Huang, S. Guo, P. Yi, W. Xiong, S. Chen, S. Yang, Y. Xu, Y. Li, X. Chen and Z. Shen, Adv. Sci., 2022, 10(1), e2205109 CrossRef.
- Z. Chen, Z. Li, H. Huang, G. Shen, Y. Ren, X. Mao, L. Wang, Z. Li, W. Wang, G. Li, B. Zhao, W. Guo and Y. Hu, Small, 2023, e2302758 CrossRef.
- C. Jia, Y. Guo and F. G. Wu, Small, 2022, 18(6), e2103868 CrossRef PubMed.
- Z. Tang, Y. Liu, M. He and W. Bu, Angew. Chem., Int. Ed. Engl., 2019, 58(4), 946–956 CrossRef PubMed.
- L. Huang, J. Zhu, W. Xiong, J. Feng, J. Yang, X. Lu, Y. Lu, Q. Zhang, P. Yi, Y. Feng, S. Guo, X. Qiu, Y. Xu and Z. Shen, ACS Nano, 2023, 17(12), 11492–11506 CrossRef.
- T. He, X. Qin, C. Jiang, D. Jiang, S. Lei, J. Lin, W. G. Zhu, J. Qu and P. Huang, Theranostics, 2020, 10(6), 2453–2462 CrossRef PubMed.
- X. Yang, Y. Yang, F. Gao, J. J. Wei, C. G. Qian and M. J. Sun, Nano Lett., 2019, 19(7), 4334–4342 CrossRef.
- J. Cheng, Y. Zhu, Y. Dai, L. Li, M. Zhang, D. Jin, M. Liu, J. Yu, W. Yu, D. Su, J. Zou, X. Chen and Y. Liu, Angew. Chem., Int. Ed. Engl., 2023, 62(27), e202304312 CrossRef.
- J. Li, L. Xie, B. Li, C. Yin, G. Wang, W. Sang, W. Li, H. Tian, Z. Zhang, X. Zhang, Q. Fan and Y. Dai, Adv. Mater., 2021, 33(22), e2008481 CrossRef PubMed.
- W. Sun, C. Zhu, J. Song, S. C. Ji, B. P. Jiang, H. Liang and X. C. Shen, Adv. Healthcare Mater., 2023, 12(23), e2300385 CrossRef PubMed.
- M. Wan, Z. Liu, T. Li, H. Chen, Q. Wang, T. Chen, Y. Tao and C. Mao, Angew. Chem., Int. Ed. Engl., 2021, 60(29), 16139–16148 CrossRef CAS.
- Y. Ge, F. Rong, Y. Lu, Z. Wang, J. Liu, F. Xu, J. Chen, W. Li and Y. Wang, Nano Lett., 2023, 23(14), 6610–6618 CrossRef CAS PubMed.
- D. E. Large, R. G. Abdelmessih, E. A. Fink and D. T. Auguste, Adv. Drug Delivery Rev., 2021, 176, 113851 CrossRef CAS PubMed.
- S. Shah, V. Dhawan, R. Holm, M. S. Nagarsenker and Y. Perrie, Adv. Drug Delivery Rev., 2020, 154–155, 102–122 CrossRef CAS.
- F. Shao, Y. Wu, Z. Tian and S. Liu, Biomaterials, 2021, 274, 120869 CrossRef CAS PubMed.
- M. Li, Q. Zhao, X. Yi, X. Zhong, G. Song, Z. Chai, Z. Liu and K. Yang, ACS Appl. Mater. Interfaces, 2016, 8(15), 9557–9564 CrossRef CAS PubMed.
- W. H. Guo, Z. Chen, Z. H. Li, H. L. Huang, Y. X. Ren, Z. Y. Li, B. X. Zhao, G. X. Li and Y. F. Hu, Chem. Eng. J., 2023, 455 Search PubMed.
- S. Zhang, Y. Zhang, Y. Feng, J. Wu, Y. Hu, L. Lin, C. Xu, J. Chen, Z. Tang, H. Tian and X. Chen, Adv. Mater., 2022, 34(50), e2206851 CrossRef PubMed.
- M. Zhang, W. Wang, F. Wu, T. Zheng, J. Ashley, M. Mohammadniaei, Q. Zhang, M. Wang, L. Li, J. Shen and Y. Sun, Biomaterials, 2020, 252, 120106 CrossRef CAS.
- C. Huang, X. S. Lin, T. Lin, W. Q. Lin, Z. Q. Gong, Q. Zheng, B. Z. Li and H. M. Wang, Chem. Eng. J., 2023, 466 Search PubMed.
- Z. Lu, J. Gao, C. Fang, Y. Zhou, X. Li and G. Han, Adv. Sci., 2020, 7(17), 2001223 CrossRef CAS.
- J. Huang, Y. Li, L. Zhang, J. Wang, Z. Xu, Y. Kang and P. Xue, Biomaterials, 2022, 286, 121572 CrossRef CAS.
- Y. Zhao, S. Wang, Y. Ding, Z. Zhang, T. Huang, Y. Zhang, X. Wan, Z. L. Wang and L. Li, ACS Nano, 2022, 16(6), 9304–9316 CrossRef CAS.
- K. Wang, Y. Li, X. Wang, Z. Zhang, L. Cao, X. Fan, B. Wan, F. Liu, X. Zhang, Z. He, Y. Zhou, D. Wang, J. Sun and X. Chen, Nat. Commun., 2023, 14(1), 2950 CrossRef CAS.
- Z. Liu, S. Liu, B. Liu, Y. Bian, M. Yuan, C. Yang, Q. Meng, C. Chen, P. Ma and J. Lin, Small, 2023, 19(19), e2207825 CrossRef PubMed.
- L. Zeng, S. Ding, Y. Cao, C. Li, B. Zhao, Z. Ma, J. Zhou, Y. Hu, X. Zhang, Y. Yang, G. Duan, X. W. Bian and G. Tian, ACS Nano, 2023, 17(14), 13195–13210 CrossRef CAS.
Footnote |
| † Electronic supplementary information (ESI) available. See DOI: https://doi.org/10.1039/d3na00877k |
| This journal is © The Royal Society of Chemistry 2024 |