 Open Access Article
Phase tunable nickel doped Mn3O4 nanoparticle synthesis by chemical precipitation: kinetic study on dye degradation
Jasim
Uddin
a,
Rahim
Abdur
 a,
Md. Rifat
Hossain
a,
Shahin
Aziz
b,
Mohammad Shah
Jamal
*a,
Md. Aftab Ali
Shaikh
*cd and
Mosharof
Hossain
a,
Md. Rifat
Hossain
a,
Shahin
Aziz
b,
Mohammad Shah
Jamal
*a,
Md. Aftab Ali
Shaikh
*cd and
Mosharof
Hossain
 *a
*a
aInstitute of Energy Research and Development, Bangladesh Council of Scientific and Industrial Research (BCSIR), Dr Qudrat-i-Khuda Road, Dhanmondi, Dhaka – 1205, Bangladesh. E-mail: msjdubd@gmail.com; mosharof@bcsir.gov.bd
bBCSIR Laboratories Dhaka, Bangladesh Council of Scientific and Industrial Research (BCSIR), Dr Qudrat-i-Khuda Road, Dhanmondi, Dhaka 1205, Bangladesh
cBangladesh Council of Scientific and Industrial Research (BCSIR), Dr Qudrat-i-Khuda Road, Dhanmondi, Dhaka – 1205, Bangladesh. E-mail: aftab74@yahoo.com
dDepartment of Chemistry, University of Dhaka, Dhaka – 1000, Bangladesh
First published on 16th December 2023
Abstract
Nickel (Ni) doped Mn3O4 nanoparticles (NPs) were synthesized by a quick and facile chemical precipitation technique to investigate their performance in the degradation of methylene blue (MB) in the absence of light. XRD, FESEM, TEM, AAS, XPS, and FT-IR were used for the investigation of the structural, surface morphological, and elemental composition of Ni doped Mn3O4 NPs. XRD confirms the formation of a tetragonal phase structure of pure Mn3O4 and 1% and 3% Ni doped Mn3O4 NPs. However, mixed phases were found in the case of 5 to 10% Ni doped Mn3O4 NPs. Well-defined spherical-shaped morphology was presented through FESEM. Particle sizes decreased linearly (58.50 to 23.68 nm) upon increasing the doping concentration from 0% (pure Mn3O4) to 7% respectively, and then increased (48.62 nm) in the case of 10% doping concentration. TEM further confirmed spherical shaped 32 nm nanoparticles for 7% Ni doped Mn3O4. The elemental composition and oxidation state of the prepared NPs were confirmed by using XPS spectra. Mixed valence Mn2+ and Mn4+ states were found in pure Mn3O4 and 1% and 3% Ni doped Mn3O4 NPs in the ratio of 2MnO–MnO2. In addition, three different oxidation states Mn2+, Mn3+, and Mn4+ were found in 5 to 10% Ni doped Mn3O4 NPs. Moreover, as a dopant Ni exists as Ni2+ and Ni3+ states in all Ni doped Mn3O4 NPs. The synthesized NPs were then applied as potent oxidants for the degradation of MB at pH 3. With the increase of doping concentration to 7%, the degree of degradation was increased to 79% in the first 10 min and finally, it became about 98%. The degradation of MB follows the pseudo-first-order linear kinetics with a degradation rate of 0.0342 min−1.
Introduction
The current intense scientific interest in nanoparticle research is concentrated on metals with remarkable viability to synthesize a broad variety of oxide compounds.1 Manganese oxides have attracted a lot of interest in recent years due to their physical and chemical characteristics and their prospective uses in solar energy conversion,2 ion exchange,3 heterogeneous catalysts,4 molecular adsorption,5 electrochemical materials,6etc. Manganese oxides form several phases like MnO, MnO2, Mn2O3, and Mn3O4. Among them, Mn3O4 (hausmannite, tri-manganese tetraoxide) is one of the most stable mixed oxides at high temperatures and has a spinel structure.7,8 Due to the presence of various oxidation states of manganese in Mn3O4, it can be used as an effective catalyst for the oxidation of methane and carbon monoxide9 and the selective reduction of nitrobenzene.10 Additionally, it is a useful compound for reducing nitrogen oxides (NOx) and volatile organic compound (VOC) emissions from various origins and mitigating air pollution.11 Because of its various applications, scientists are trying to enhance their activity. Many researchers have already synthesized Mn3O4 nanoparticles by using various methods including thermal decomposition,12 ultrasonic bath,13 sol–gel,14 co-precipitation,15 microwave irradiation,16 surfactant assisted,17 oxidation,18 and physical evaporation.19 Most of these procedures involve several steps or call for a high vacuum system, a longer reaction time, and oxygen protection.20 Thus, it is crucial to develop a low-cost, affordable synthetic approach. Chemical precipitation is an easy, inexpensive, and non-toxic approach compared to previously reported methods.21 Keeping this fact in mind, in this study, Mn3O4 and Ni doped Mn3O4 nanoparticles with varying doping concentrations were synthesized for the first time using a simple chemical precipitation technique. The fundamental advantage of this technique is that it produces final particles in nanometer dimension with limited size distribution. Nowadays, doping is a promising technique for altering nanomaterials to improve their electrical, optical, and catalytic properties.22 Doping of transition metal in Mn-oxide NPs is one of the efficient methods to produce deformed Mn(III) species, which is a crucial structural feature to increase catalytic activity.23 Since Ni exhibits the highest activity as a dopant of Mn-oxide NPs, in this study Ni doped Mn3O4 NPs are synthesized with varying concentrations of dopants.During the dyeing process, about 15% of the world's total dye production is wasted and discharged in textile effluents.24 Even at low concentrations, dyes pose a serious threat to aquatic life and human health because they include poisonous and harmful chemical components.25 Photosynthesis in aquatic plants is impeded by dyes in water, which reduce light transmission. In addition, several of the dyes are said to be very carcinogenic and have poor biodegradability.26 Methylene blue (MB) is a well-known, highly carcinogenic thiazine pollutant that has been produced and utilized in numerous industries for a variety of reasons. When ingested, it becomes a major risk to human health and has been known to cause damage to the nervous system and eyes.27 Therefore, researchers are very concerned with finding a quick and efficient way to remove dye and organic contaminants from industrial effluents.28 Because of their high reduction potential, manganese oxides are powerful oxidants that can easily oxidize a variety of inorganic substances including Cr(III),29 Sb(III),30 Co(III),31 Se(IV),32 and organic compounds such as catechol, quinines, substituted phenols, aromatic amines, pesticides, and explosives (e.g. TNT).33–38 Many researchers studied the degradation of MB using Mn3O4, however the rate of degradation was slow and took a long time.39,40 In order to overcome these limitations, Ni doped Mn3O4 and Mn3O4 NPs for MB degradation were prepared. However, various methods such as adsorption,41 biodegradation,42 chlorination, and ozonation43 have been used to remove dyes. In the present study, advanced oxidation technology44 has been used for comparing the oxidative degradation of MB by newly prepared different concentrations of Ni doped Mn3O4 and Mn3O4 nanoparticles. The primary aim of this work was to synthesize Ni doped Mn3O4 and Mn3O4 nanoparticles using a facile chemical precipitation technique for dye (MB) removal from textile effluents. The outcome of this research work will introduce a new dimension in nanoparticle synthesis and find a potential application for the degradation of dyes present in colored aqueous effluents from textile industries.
Experimental
Materials
All chemicals and solvents were purchased and utilized as obtained without further purification. Manganese(II) acetate tetrahydrate (MAct), nickel acetate tetrahydrate (NAct), sodium hydroxide (NaOH), methylene blue, and ethanol were purchased from Sigma-Aldrich Co. Germany.Preparation of precursor solutions
36.7635 g of MAct salt was dissolved in 500 mL de-ionized (DI) water for the preparation of 300 mM MAct solution. Similarly, 300 mM of NAct solution was prepared by dissolving 7.4652 g NAct salt in 100 mL DI water. Furthermore, a 300 mM NaOH solution was prepared for precipitation by dissolving 12 g pellets in 1000 mL DI water. For better dissolution, all solutions were kept on continuous magnetic stirring at 450 rpm at room temperature.Synthesis of nanoparticles
The NPs were prepared by a simple inexpensive chemical precipitation technique.8 For Mn3O4 nanoparticle synthesis, 100 mL of freshly prepared MAct solution was taken in a glass beaker. Then NaOH was added at a rate of 6 drops per minute to the precursor solution with continuous magnetic stirring at 450 rpm for allowing precipitation at room temperature. After complete precipitation, the precipitate (ppt) was filtered with Whatman filter paper. The ppt was rinsed with DI water. The rinse was repeated about 5 times to completely remove NaOH. There was no need to put any control over the pH of the solution in this process. Then the ppt was dried in an oven at 90 °C temperature for 24 h. The dried ppt was then weighed and ground into fine powder using a ball miller (Pulverisette 23, FRITSCH, Germany) at 50 Hz for 5 min with 20 balls. Then the powder was taken into quartz crucibles and calcined at 500 °C for 2 h inside a programmable muffle furnace and then slowly cooled down to room temperature. Samples were stored in a vial and kept in a desiccator.For 1, 3, 5, 7, and 10% Ni doped Mn3O4 NP synthesis, 1, 3, 5, 7, and 10 mL NAct solution was taken in a separate glass beaker respectively. Then the volume of each beaker was made to 100 mL by adding the corresponding amount of MAct solution. Other processes were similar to those of Mn3O4 NPs. Finally, the NPs were used for different types of characterization.
Characterization
The obtained products were characterized by various characterization techniques. X-ray diffraction (XRD) (EMMA; GBC Scientific Equipment, Australia) patterns were recorded using Cu Kα radiation (λ = 0.15406 nm) at 35.5 kV and 28 mA, scanning range of 10–70°, at 5° per minute. HighScore software was used to determine the crystallographic data. Surface morphology of the NPs was determined by applying field emission scanning electron microscopy (FESEM); (JSM-7610F, JEOL, Japan) with accelerating voltage: 15 kV, magnification: 1![[thin space (1/6-em)]](https://www.rsc.org/images/entities/char_2009.gif) 000
000![[thin space (1/6-em)]](https://www.rsc.org/images/entities/char_2009.gif) 00× and transmission electron microscopy (TEM); (JEM 2100plus, JEOL, Japan). The compositional study of the prepared nanoparticles was carried out by X-ray photoelectron spectroscopy (XPS), (K-alpha, Thermo Fisher Scientific, USA) and atomic absorption spectroscopy (AAS); (AA-7000, Shimadzu, Japan). A study using Fourier transform-infrared spectroscopy (FT-IR) (Frontier, PerkinElmer, UK) was carried out on KBr pellets to characterize distinct surface functionalities in the samples. A UV-vis spectrophotometer (Cintra 2020; GBC Scientific Equipment, Australia) was used to observe the degradation of MB spectroscopically.
00× and transmission electron microscopy (TEM); (JEM 2100plus, JEOL, Japan). The compositional study of the prepared nanoparticles was carried out by X-ray photoelectron spectroscopy (XPS), (K-alpha, Thermo Fisher Scientific, USA) and atomic absorption spectroscopy (AAS); (AA-7000, Shimadzu, Japan). A study using Fourier transform-infrared spectroscopy (FT-IR) (Frontier, PerkinElmer, UK) was carried out on KBr pellets to characterize distinct surface functionalities in the samples. A UV-vis spectrophotometer (Cintra 2020; GBC Scientific Equipment, Australia) was used to observe the degradation of MB spectroscopically.
Analytical method
First of all, a 500 mL volumetric flask containing 25 mg of MB was filled up to the mark with deionized water (DI) to prepare a 50 ppm MB solution. A glass beaker was then filled with 100 mL of a produced 50 ppm MB dye solution for the decolorization experiment. The pH of the dye solution was kept at 3. After that, 10 mg of Mn3O4 NPs were added to the dye solution with stirring at room temperature in the absence of light. The NPs were left behind as the precipitate after centrifuging 5 mL of the mixed solution for 10 min at the specified time interval. After that, the progress of decolorization was assessed using a UV-vis spectrophotometer. Similarly, MB degradation capacity was measured by using Ni doped Mn3O4 nanoparticles keeping the constant amounts of nanoparticles and dye concentration.Results and discussion
Characterization of Mn3O4 and Ni doped Mn3O4 nanoparticles
where k is the shape factor (0.94), λ is the X-ray wavelength (1.5418 Å), β is the full width at half maxima (FWHM) of the corresponding diffraction line and θ is the diffraction angle. The average crystallite size, FWHM, peak position, and microstrain calculated for the plane (211) of each sample are shown in Table 1.
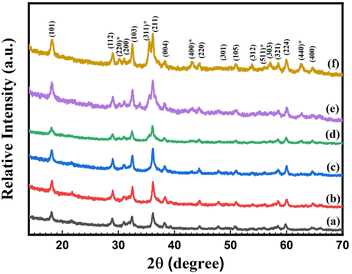 | ||
| Fig. 1 X-ray diffraction (XRD) patterns of synthesized (a) pure Mn3O4, (b) 1% Ni doped Mn3O4, (c) 3% Ni doped Mn3O4, (d) 5% Ni doped Mn3O4, (e) 7% Ni doped Mn3O4 and (f) 10% Ni doped Mn3O4 NPs. | ||
| Nanoparticles | Peak position 2θ (°) | FWHM, β (°) | Crystallite size (nm) | Microstrain (ε) × 10−3 |
|---|---|---|---|---|
| Pure Mn3O4 | 36.16 | 0.2509 | 34.81 | 3.35 |
| 1% Ni doped Mn3O4 | 36.16 | 0.2598 | 33.62 | 3.47 |
| 3% Ni doped Mn3O4 | 36.12 | 0.2705 | 32.29 | 3.62 |
| 5% Ni doped Mn3O4 | 36.06 | 0.3788 | 23.05 | 5.08 |
| 7% Ni doped Mn3O4 | 36.12 | 0.5087 | 17.17 | 6.81 |
| 10% Ni doped Mn3O4 | 36.14 | 0.2181 | 40.05 | 2.92 |
It is found that without 1%, the most intense diffraction peak of doped nanoparticles is shifted. As doping concentrations increase from 0% (pure Mn3O4) to 7%, the FWHM of the prominent peaks rises respectively, which can be attributed to a reduction in crystallite size. However, in the case of 10% doping concentration, the opposite phenomena are found. Therefore, the broadening and shifting of the diffraction peak with Ni doping strongly suggest that Ni ions have effectively supplanted the Mn ions within the Mn3O4 lattice. The reason for the reduced sizes of the Ni doped Mn3O4 NPs (from 1 to 7%) is thought to be either oxygen desorption or the fact that Ni, which is injected, settles within the Mn3O4 lattice and so forms bonds with the unstable oxygen atoms of Mn3O4. This suggests that Ni doping can reduce the nucleation rate of Mn3O4 and in turn, can subsequently influence the size of the particles.47 Microstrain values indicate that with increasing the concentration of dopants, the internal stress is increased. But in the case of 10% doping concentration, the crystallite size suddenly increases which means that it experiences lower internal stress due to the formation of mixed phases.48,49
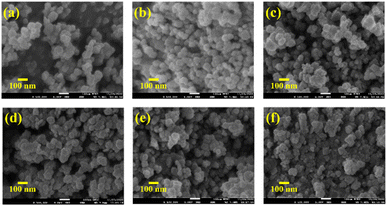 | ||
| Fig. 4 FESEM images of (a) pure Mn3O4, (b) 1% Ni doped Mn3O4, (c) 3% Ni doped Mn3O4, (d) 5% Ni doped Mn3O4, (e) 7% Ni doped Mn3O4 and (f) 10% Ni doped Mn3O4 NPs. | ||
The EDS analysis was also carried out for the elemental composition of the prepared NPs which is shown in Fig. 5a–f. In the case of pure Mn3O4 NPs, only Mn and O atomic percent values were found (Fig. 5a). On the other hand, Ni doped Mn3O4 NPs showed elemental peaks of Mn, Ni and O (Fig. 5b–f). The average values of atomic percent of constituent atoms with standard deviation are presented in Table 2. The Ni atomic percent increased with increasing Ni doping percent, though the atomic percent of Ni does not directly delineate the original doping percent, but rather illustrates the increasing trend.
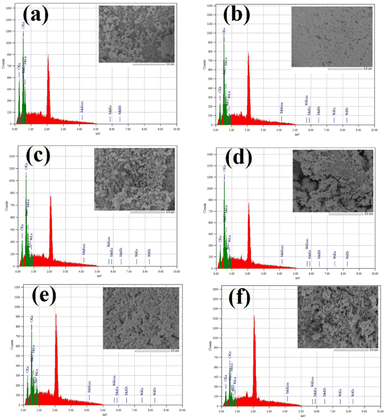 | ||
| Fig. 5 EDS mapping of synthesized (a) pure Mn3O4, (b) 1% Ni doped Mn3O4, (c) 3% Ni doped Mn3O4, (d) 5% Ni doped Mn3O4, (e) 7% Ni doped Mn3O4 and (f) 10% Ni doped Mn3O4 NPs. | ||
| Nanoparticles | Atomic percent (%) | |||
|---|---|---|---|---|
| Mn | Ni | O | C | |
| Pure Mn3O4 | 37.31 ± 0.79 | Not detected | 39.40 ± 2.22 | 23.29 ± 2.54 |
| 1% Ni doped Mn3O4 | 41.06 ± 0.58 | 0.88 ± 0.04 | 44.12 ± 0.57 | 13.94 ± 0.04 |
| 3% Ni doped Mn3O4 | 40.79 ± 0.26 | 2.41 ± 0.38 | 42.91 ± 0.19 | 13.89 ± 0.60 |
| 5% Ni doped Mn3O4 | 40.78 ± 0.10 | 4.43 ± 0.28 | 44.42 ± 0.07 | 10.37 ± 0.25 |
| 7% Ni doped Mn3O4 | 37.65 ± 1.05 | 6.63 ± 0.11 | 40.55 ± 0.35 | 15.17 ± 0.63 |
| 10% Ni doped Mn3O4 | 35.86 ± 1.16 | 8.97 ± 0.45 | 41.53 ± 0.18 | 13.63 ± 1.44 |
The elemental peak of carbon was found in each EDS spectrum because carbon tape was used for attaching the sample during FESEM and EDS analysis.
| Nanoparticles | Atomic percent (%) | |
|---|---|---|
| Mn | Ni | |
| Pure Mn3O4 | 28.492 ± 0.008 | Not detected |
| 1% Ni doped Mn3O4 | 28.575 ± 0.033 | 0.600 ± 0.002 |
| 3% Ni doped Mn3O4 | 28.658 ± 0.017 | 1.879 ± 0.003 |
| 5% Ni doped Mn3O4 | 27.450 ± 0.050 | 3.758 ± 0.003 |
| 7% Ni doped Mn3O4 | 25.925 ± 0.008 | 4.626 ± 0.007 |
| 10% Ni doped Mn3O4 | 26.017 ± 0.050 | 5.232 ± 0.012 |
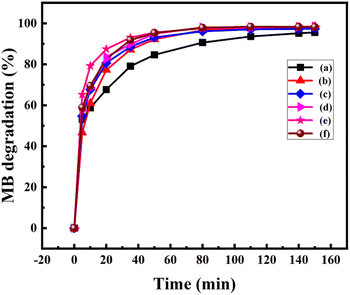
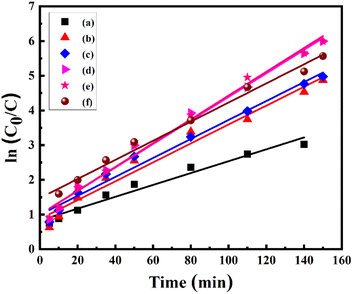
where A0 is the initial absorbance and A is the absorbance at time t of MB. Fig. 7 displays the degradation of 50 ppm MB solution using pure Mn3O4 and Ni doped Mn3O4 NPs at pH 3. It is noted that pure Mn3O4, 1, 3, 5, 7, and 10% Ni doped Mn3O4 removed 59, 61, 68, 69, 79, and 69% of MB after the first 10 min respectively. Hence, it is clear that the MB degradation efficiency increases with doping concentration up to 7% due to the decreasing of particle sizes. Additionally, when the particle size decreased, both the total number of active sites on the surface and the particular surface area of the NPs rose, which might significantly boost the efficiency of MB decolorization.38 But in the case of 10% doping concentration, MB degradation percentage decreased because of increasing particle size. Finally, for pure Mn3O4 NPs, about 95% and for Ni doped Mn3O4 NPs about 98% of MB were degraded. When compared to the scientific literature, these outcomes are comparatively superior to those of zinc oxide (60%), nano cadmium sulfide (29%), zinc sulfide (27%), Mn3O4/Fe2O3 (85%), Mn3O4/Fe3O4 nanocomposites (93%), zinc sulfide/cadmium sulfide composites (85%), hollow cadmium sulfide nanospheres (87%), commercial anatase (73%), cadmium sulfide −6, 8, 18 (96%) and photolysis only (21%); and lower than that of graphene–zinc oxide (100%).39,40,44,52–55 Theoretically, at pH < 4.5, protonation causes the surface of Mn3O4 to become positively charged. As pH decreases, the positive charge of Mn3O4 increases, which inhibits the adsorption of the cationic dye MB and the creation of the surface precursor due to electrostatic repulsion. As a result, MB was decolorized by Mn3O4 following a surface mechanism, i.e., the interaction of MB with surface-bound Mn(II, III) to produce a surface precursor complex, where electron transport takes place.38,44
where C0 is the initial concentration at t = 0 and C shows the concentration at time t, whereas the slope of the graph shows the rate constant (k). The linear kinetics were evidently being followed by all samples, and 7% Ni doped Mn3O4 NPs exhibited the best performance.
These results showed the higher values of rate constants in comparison to recent studies.38,44,52,56 Furthermore, the larger value of k indicates that the NPs are more appropriate for the decolorization of MB. Rate constants, r2 values, and degree of degradation (%) of all NPs are given in Table 4.
| Nanoparticles | MB concentration (ppm) | Degree of degradation (%) | r 2 | Rate constants (min−1) |
|---|---|---|---|---|
| Pure Mn3O4 | 50 | 95 | 0.968 | 0.0171 |
| 1% Ni doped Mn3O4 | 98 | 0.973 | 0.0272 | |
| 3% Ni doped Mn3O4 | 98 | 0.983 | 0.0273 | |
| 5% Ni doped Mn3O4 | 98 | 0.989 | 0.0339 | |
| 7% Ni doped Mn3O4 | 98 | 0.990 | 0.0342 | |
| 10% Ni doped Mn3O4 | 98 | 0.989 | 0.0275 |
MB degradation percentage is compared with previously reported values using similar types of doped metal oxide NPs, and the results are tabulated in Table 5.
Conclusions
Ni doped Mn3O4 NPs with different Ni percentages were successfully synthesized through a simple chemical precipitation technique. The particle size observed using FESEM was reduced from 58.50 to 23.68 nm when dopants were incorporated into the Mn3O4 matrix from 0% to 7% respectively. However, in the case of 10% doping concentration, the particle size was increased to 48.62 nm. Further TEM analysis confirmed spherical shaped NPs with an average size of 32 nm for 7% Ni doped Mn3O4. The composition of the elements in the prepared NPs was confirmed by the XPS data. Pure Mn3O4, 1% and 3% Ni doped Mn3O4 NPs were shown to have Mn2+ and Mn4+ states and 5 to 10% of Ni doped Mn3O4 NPs contained three different oxidation states, including Mn2+, Mn3+, and Mn4+. Furthermore, all doping NPs contain nickel as a dopant in the Ni2+ and Ni3+ states. By changing the percentage of dopants, the phase of the prepared NPs can be easily tuned. The Ni-doping process leads to the change of phases of NPs which increased the decolorization rate. But the excess incorporation of dopants (10%) increased the crystallite size and decreased the degradation rate of MB. The kinetic study confirmed that all synthesized products followed the pseudo-first-order linear kinetics, and 7% Ni doped Mn3O4 showed a higher degradation rate of 0.0342 min−1 among all samples. It showed an excellent degradation rate because of the lower size and higher surface area of particles. A major advantage of the Ni doped Mn3O4 NPs was found to be the rapid degradation of dye compared to Mn3O4. Due to the high degradation rate, Ni doped Mn3O4 NPs will create a new dimension for the purification of dye polluted wastewater in the world.Author contributions
Conceptualization: MH; methodology: JU, MH; experimental: JU, RA; data curation: JU, RA; formal analysis: MRH, RA, JU; writing the main manuscript: JU, MH; reviewing the manuscript: SA, AAS, MSJ; all authors have read and agreed to the published version of the manuscript.Conflicts of interest
The authors declare that they have no conflict of interest.Acknowledgements
The authors are grateful for the assistance of Riyadh Hossen Bhuiyan, Scientific Officer, BCSIR Laboratories, Dhaka, and Md. Saiful Quddus, senior Scientific Officer, Institute of Glass & Ceramic Research and Testing (IGCRT), BCSIR, Dhaka-1205, Bangladesh. The authors declare that this manuscript was prepared under the R&D project of “Incorporation of inorganic hole-transporting materials (HTL) for efficient and stable perovskite solar cells”.References
- Y. Wang, C. Hou, X. Lin, H. Jiang, C. Zhang and G. Liu, Appl. Phys. A: Mater. Sci. Process., 2021, 127, 1–7 CrossRef.
- Y. Yamashita, K. Mukai, J. Yoshinobu, M. Lippmaa, T. Kinoshita and M. Kawasaki, Surf. Sci., 2002, 514, 54–59 CrossRef CAS.
- Q. Feng, H. Kanoh and K. Ooi, J. Mater. Chem., 1999, 9, 319–333 RSC.
- T. Rhadfi, J. Y. Piquemal, L. Sicard, F. Herbst, E. Briot, M. Benedetti and A. Atlamsani, Appl. Catal., A, 2010, 386, 132–139 CrossRef CAS.
- Y. F. Shen, R. P. Zerger, R. N. DeGuzman, S. L. Suib, L. McCurdy, D. I. Potter and C. L. O'Young, Science, 1993, 260, 511–515 CrossRef CAS PubMed.
- A. R. Armstrong and P. G. Bruce, Nature, 1996, 381, 499–500 CrossRef CAS.
- M. Mansournia, F. Azizi and N. Rakhshan, J. Phys. Chem. Solids, 2015, 80, 91–97 CrossRef CAS.
- B. Gnana Sundara Raj, A. M. Asiri, J. J. Wu and S. Anandan, J. Alloys Compd., 2015, 636, 234–240 CrossRef CAS.
- E. R. Stobbe, B. A. De Boer and J. W. Geus, Catal. Today, 1999, 47, 161–167 CrossRef CAS.
- E. J. Grootendorst, Y. Verbeek and V. Ponec, J. Catal., 1995, 157, 706–712 CrossRef CAS.
- M. F. M. Zwinkels, S. G. JÄRÅS, P. G. Menon and T. A. Griffin, Catal. Rev., 1993, 35, 319–358 CrossRef CAS.
- O. Jankovský, D. Sedmidubský, P. Šimek, Z. Sofer, P. Ulbrich and V. Bartuněk, Ceram. Int., 2015, 41, 595–601 CrossRef.
- T. Rohani Bastami and M. H. Entezari, Ultrason. Sonochem., 2012, 19, 560–569 CrossRef CAS.
- M. Mohamed Ismail, S. Hemaanandhan, D. Mani, M. Arivanandhan, G. Anbalagan and R. Jayavel, J. Sol-Gel Sci. Technol., 2020, 93, 703–713 CrossRef CAS.
- A. K. Singh, T. K. Dhiman, G. B. V. S. Lakshmi, R. Raj, S. K. Jha and P. R. Solanki, Nanotechnology, 2022, 33, 285501 CrossRef.
- T. V. M. Sreekanth, Y. Kisoo and J. Kim, Int. J. Energy Res., 2022, 46, 1683–1692 CrossRef.
- L. Laffont and P. Gibot, Mater. Charact., 2010, 61, 1268–1273 CrossRef CAS.
- K. A. M. Ahmed, Q. Zeng, K. Wu and K. Huang, J. Solid State Chem., 2010, 183, 744–751 CrossRef CAS.
- Y. Q. Chang, X. Y. Xu, X. H. Luo, C. P. Chen and D. P. Yu, J. Cryst. Growth, 2004, 264, 232–236 CrossRef CAS.
- Z. Durmus, H. Kavas, A. Baykal and M. S. Toprak, Cent. Eur. J. Chem., 2009, 7, 555–559 CAS.
- A. Ramadoss, K. Krishnamoorthy and S. J. Kim, Mater. Res. Bull., 2012, 47, 2680–2684 CrossRef CAS.
- A. K. Worku, D. W. Ayele and N. G. Habtu, SN Appl. Sci., 2021, 3, 1–16 Search PubMed.
- J. S. Hong, H. Seo, Y. H. Lee, K. H. Cho, C. Ko, S. Park and K. T. Nam, Small Methods, 2020, 4, 1–7 CrossRef.
- A. Houas, H. Lachheb, M. Ksibi, E. Elaloui, C. Guillard and J. M. Herrmann, Appl. Catal., B, 2001, 31, 145–157 CrossRef CAS.
- L. Hu, G. Deng, W. Lu, Y. Lu and Y. Zhang, Cuihua Xuebao, 2017, 38, 1360–1372 CAS.
- S. C. DeVito, Crit. Rev. Environ. Sci. Technol., 1993, 23, 249–324 CrossRef.
- M. I. Din, R. Khalid, J. Najeeb and Z. Hussain, J. Cleaner Prod., 2021, 298, 126567 CrossRef CAS.
- R. Shokoohi, M. Khazaei, K. Godini, G. Azarian, Z. Latifi, L. Javadimanesh and H. Zolghadr Nasab, Inorg. Chem. Commun., 2021, 127, 108501 CrossRef CAS.
- J. G. Kim, J. B. Dixon, C. C. Chusuei and Y. Deng, Soil Sci. Soc. Am. J., 2002, 66, 306–315 CrossRef CAS.
- N. Belzile, Y. W. Chen and Z. Wang, Chem. Geol., 2001, 174, 379–387 CrossRef CAS.
- A. Manceau, V. A. Drits, E. Silvester, C. Bartoli and B. Lanson, Am. Mineral., 1997, 82, 1150–1175 CAS.
- M. J. Scott and J. J. Morgan, Environ. Sci. Technol., 1996, 30, 1990–1996 CrossRef CAS.
- C. J. Matocha, D. L. Sparks, J. E. Amonette and R. K. Kukkadapu, Soil Sci. Soc. Am. J., 2001, 65, 58–66 CrossRef CAS.
- R. A. Petrie, P. R. Grossl and R. C. Sims, Environ. Sci. Technol., 2002, 36, 3744–3748 CrossRef CAS PubMed.
- H. Li, L. S. Lee, D. G. Schulze and C. A. Guest, Environ. Sci. Technol., 2003, 37, 2686–2693 CrossRef CAS.
- H. Zhang and C. H. Huang, Environ. Sci. Technol., 2005, 39, 4474–4483 CrossRef CAS PubMed.
- K. H. Kang, D. M. Lim and H. Shin, Water Res., 2006, 40, 903–910 CrossRef CAS PubMed.
- M. X. Zhu, Z. Wang and L. Y. Zhou, J. Hazard. Mater., 2008, 150, 37–45 CrossRef CAS.
- X. Li, Y. Gao, L. Yu and L. Zheng, J. Solid State Chem., 2010, 183, 1423–1432 CrossRef CAS.
- A. Wei, L. Xiong, L. Sun, Y. Liu, W. Li, W. Lai, X. Liu, L. Wang, W. Huang and X. Dong, Mater. Res. Bull., 2013, 48, 2855–2860 CrossRef CAS.
- M. Arshadi, M. Mehravar, M. J. Amiri and A. R. Faraji, J. Colloid Interface Sci., 2015, 440, 189–197 CrossRef CAS PubMed.
- A. T. Moore, A. Vira and S. Fogel, Environ. Sci. Technol., 1989, 23, 403–406 CrossRef CAS.
- Y. M. Slokar and A. Majcen Le Marechal, Dyes Pigm., 1998, 37, 335–356 CrossRef CAS.
- A. K. M. Atique Ullah, A. K. M. Fazle Kibria, M. Akter, M. N. I. Khan, A. R. M. Tareq and S. H. Firoz, Water Conserv. Sci. Eng., 2017, 1, 249–256 CrossRef.
- Y. Li, H. Tan, X. Y. Yang, B. Goris, J. Verbeeck, S. Bals, P. Colson, R. Cloots, G. Van Tendeloo and B. L. Su, Small, 2011, 7, 475–483 CrossRef CAS PubMed.
- V. Maruthapandian, T. Pandiarajan, V. Saraswathy and S. Muralidharan, RSC Adv., 2016, 6, 48995–49002 RSC.
- G. Raja, A. Nallathambi, A. Prakasam, S. Gopinath, C. Ragupathi, S. Narayanan, P. Tamizhdurai, R. Kumaran, N. S. Alsaiari, K. M. Abualnaja and M. Ouladsmane, J. Saudi Chem. Soc., 2022, 26, 101440 CrossRef CAS.
- S. Karpagavalli, S. J. Kennady Vethanathan and S. Perumal, Int. J. Nanopart., 2019, 11, 305–321 CrossRef CAS.
- W. Qin, T. Nagase, Y. Umakoshi and J. A. Szpunar, Philos. Mag. Lett., 2008, 88, 169–179 CrossRef CAS.
- G. An, P. Yu, M. Xiao, Z. Liu, Z. Miao, K. Ding and L. Mao, Nanotechnology, 2008, 19(27), 275709 CrossRef PubMed.
- S. Saha, A. Roy, A. Ray, T. Das, M. Nandi, B. Ghosh and S. Das, Electrochim. Acta, 2020, 353, 136515 CrossRef CAS.
- G. C. Silva, V. S. T. Ciminelli, A. M. Ferreira, N. C. Pissolati, P. R. P. Paiva and J. L. López, Mater. Res. Bull., 2014, 49, 544–551 CrossRef CAS.
- S. Liu, H. Li and L. Yan, Mater. Res. Bull., 2013, 48, 3328–3334 CrossRef CAS.
- W. M. Zhang, Y. Q. Jiang, X. Y. Cao, M. Chen, D. L. Ge and Z. X. Sun, Mater. Res. Bull., 2013, 48, 4379–4384 CrossRef CAS.
- G. Lin, J. Zheng and R. Xu, J. Phys. Chem. C, 2008, 112, 7363–7370 CrossRef CAS.
- X. Wang, L. Mei, X. Xing, L. Liao, G. Lv, Z. Li and L. Wu, Appl. Catal., B, 2014, 160–161, 211–216 CrossRef CAS.
- M. Umar, H. Ajaz, M. Javed, S. Iqbal, M. Shuaib Khan, A. Alhujaily, N. S. Awwad and H. A. Ibrahium, Inorg. Chem. Commun., 2023, 157, 111353 CrossRef CAS.
- B. Shaikh, M. A. Bhatti, A. A. Shah, A. Tahira, A. K. Shah, A. Usto, U. Aftab, S. I. Bukhari, S. Alshehri, S. N. U. Shah Bukhari, M. Tonezzer, B. Vigolo and Z. H. Ibhupoto, Nanomaterials, 2022, 12, 3754 CrossRef CAS PubMed.
- M. S. Osgouei, N. Kamrani, S. Fazli-Shokouhi and M. Khatamian, J. Alloys Compd., 2022, 902, 163729 CrossRef CAS.
| This journal is © The Royal Society of Chemistry 2024 |


